Article

Non-Invasive Optoacoustic Imaging for In-Depth Cultural Heritage Diagnostics

by
George J. Tserevelakis
*,
Eleanna Pirgianaki
,
Kristalia Melessanaki
,
Giannis Zacharakis
and
Costas Fotakis
Institute of Electronic Structure and Laser, Foundation for Research and Technology Hellas, 70013 Heraklion, Crete, Greece
*
Author to whom correspondence should be addressed.
Photonics 2024, 11(10), 902; https://doi.org/10.3390/photonics11100902
Submission received: 4 August 2024 / Revised: 26 August 2024 / Accepted: 24 September 2024 / Published: 25 September 2024

Abstract

:
The complex composition of cultural heritage (CH) items presents significant challenges in assessing their condition and predicting potential risks of material degradation. Typically employed diagnostic optical methods are inevitably limited by light scattering, thus restricting in-depth investigations of objects with complex structural and optical properties. To address this issue, we introduce a novel reflection-mode optoacoustic (OA) diagnostic system for non-contact and non-invasive measurements of CH, placing emphasis on the detection of ageing-related modifications in artistic media such as paints. In this direction, the sensitivity of OA measurements was proven to be up to two orders of magnitude higher than conventional absorption spectroscopy assessments. Furthermore, we have evaluated the in-depth imaging capabilities of the developed OA system, demonstrating that it can offer superior contrast levels of sketches beneath opaque paint layers compared to standard near-infrared diagnostic techniques. The current OA imaging technology may advance state-of-the-art diagnostic capabilities in CH preservation by delivering unprecedented depth-to-resolution ratios combined with exceptional optical absorption sensitivity in a non-invasive manner. These features are crucial for the early detection of material degradation and the comprehensive analysis of CH objects, facilitating the development of optimal conservation strategies to prolong their lifespan and preserve their aesthetic value.

1. Introduction

Monuments and objects of cultural heritage (CH) constitute invaluable treasures which must be preserved and made accessible. Nevertheless, the uniqueness and complex composition of heritage items pose significant challenges regarding the surface and in-depth evaluation of their state, as well as the early prediction of potential risks related to the degradation of their original materials and structural integrity [1,2]. To this effect, there is a clear demand of diagnostic, non-destructive techniques which enable the optimal conservation strategies for shedding light into their historical, social and geographical origin, as well as prolonging their lifetime and aesthetic value [3]. Towards this direction, various optical tools including multispectral imaging [4,5,6], optical coherence tomography (OCT) [7,8,9] and multiphoton microscopy [10,11] have been extensively employed for the detection of degradation effects and the uncovering of hidden features in different types of CH objects. Furthermore, Raman [12,13,14] and mid-IR absorption [15,16,17] spectroscopic techniques have been successfully used to identify surface ageing-related alterations in artefacts based on chemically sensitive information. However, the performance of all these optical methods is ultimately limited by strong light scattering and absorption, hindering in-depth investigations of CH objects with highly complex structural and optical properties [18]. Addressing such challenges requires the development of innovative approaches that significantly enhance the capabilities of optical diagnosis in CH, pushing the boundaries beyond the current state-of-the-art.
Over the last years, optoacoustic (OA) (or photoacoustic) imaging has emerged as one of the most rapidly expanding diagnostic technologies within the sphere of contemporary biomedical research [19,20,21]. The technique relies on the generation of high-frequency ultrasonic waves following the absorption of pulsed optical radiation by a material. The laser-induced pressure perturbations are typically detected and recorded using piezoelectric transducers as in the case of conventional ultrasound imaging. The peak-to-peak amplitude of OA signals is directly proportional to the optical absorption coefficient of the medium [22,23]. Consequently, the OA technique offers optical absorption information with high sensitivity and spatial resolution, which are ultimately determined by the properties of the ultrasonic detector. Compared to NIR or visible signals, OA waves present up to three orders of magnitude improved transmission through turbid media, enabling investigations at depths otherwise inaccessible to pure optical imaging modalities [24].
Recently, several studies attempted to expand the applicability of OA imaging technologies beyond the barriers of biomedicine, directing them towards CH diagnostics. In particular, OA-based tools have been employed for the uncovering of hidden underdrawings in painted mock-ups [25] and the delineation of text in multilayered documents [26], as well as the thickness assessment of opaque paint layers [27]. Furthermore, OA imaging has been combined with multiphoton microscopy [28] to provide complementary information in painted canvas mock-ups and samples of fresco wall paintings. It should be mentioned that these applications required a coupling medium (e.g., water or liquid agarose) to ensure proper OA signal detection using conventional immersion transducers. However, the use of a liquid coupling medium, even if it is considered safe and compatible with the object’s surfaces, may not be the ideal option for several sensitive CH objects. To face this challenge, air-coupled ultrasonic detection has been integrated in transmission-mode OA systems towards the non-contact and non-invasive acquisition of hidden layers in paintings [29]. However, such systems are limited to inspecting only very thin objects and cannot provide diagnostic information for artefacts of varying thickness and geometry.
This work introduces the development of an innovative reflection-mode OA diagnostic system for the non-contact and non-destructive investigation of CH objects, placing emphasis on the ultrasensitive detection of ageing-related modifications and degradation in typical media such as paints. Furthermore, the in-depth diagnostic capabilities of the novel system have been systematically compared to state-of-the-art NIR imaging, demonstrating the superior performance of OA signal detection even under conditions of strong optical scattering. In this context, the potential of the OA technique can significantly complement the existing pure optical techniques towards the reliable acquisition of invaluable information in a wide variety of CH objects.

2. Materials and Methods

2.1. Diagnostic Methods and Instruments

2.1.1. OA Imaging Apparatus

The non-invasive reflection-mode OA imaging apparatus (Figure 1a) utilizes a Q-switched Nd:YAG laser (SL404, Spectron Laser Systems, Rugby, UK; wavelength: 1064 nm, maximum pulse energy 30 mJ, pulse duration: 10 ns, pulse repetition rate: 10 Hz) for the efficient excitation of OA signals in the investigated mock-ups. The emitted optical radiation has been initially attenuated using a beamsplitter so that the pulse energy on the mock-up is found within a range from 0.04 to 2.6 mJ. The pulse energy is adjusted according to the optical absorption features of each mock-up, thus avoiding potential photodamage effects on its different layers. In this direction, preliminary OA measurements were performed in similar mock-ups by gradually increasing the pulse energy till the point we observed an acceptable signal to noise ratio (SNR) value (~35–40 for spot measurements or ~20 for imaging mode). The irradiated area was examined by means of optical microscopy to evaluate possible morphological alterations of the layers. It has to be mentioned that no signs of photodamage were detected for all investigated samples using the determined pulse energies. A positive lens with a focal distance of 50 cm has been employed to loosely focus the beam (spot size: ~1 mm), thus improving the sensitivity of the imaging system. Subsequently, the focused beam is directly incident on the mock-up’s surface, forming an angle of approximately 30 degrees in respect to the horizontal plane. Specifically, the integrated air-coupled transducer has a physical diameter of approximately 2 cm and a focal distance of 1 cm. Simple trigonometric calculations indicate that the maximum angle of incidence is 45 degrees relative to the horizontal plane, as larger angles would result in the laser beam being blocked by the transducer. The selected angle is smaller than the maximum possible one, thus preventing any blockage even with relatively large diameters of the incident beam near the irradiation region. Prior to the imaging session, the mock-ups were placed and secured on a custom-made aluminum sample holder, which in turn was fixed on a set of high-precision motorized XY stages (Danaher Precision Systems, Salem, NH, USA). The stages are utilized for the raster-scanning of each sample over the focused beam to attain a point-by-point data acquisition synchronized with the trigger signal of the laser source. Following the selective absorption of the pulsed infrared radiation, the generated OA waves are transmitted through the various layers of the investigated mock-up and subsequently propagate through ambient air prior their detection by a spherically focused air-coupled transducer (NCT1-D7-P10, The Ultran Group, State College, PA, USA; nominal central frequency: 1 MHz; focal distance: 10 mm; numerical aperture: 0.32) in a confocal configuration with the focused optical beam. The resulting OA signals are enhanced by two low-noise radio frequency (RF) amplifiers (TB-414-8A+, Mini-Circuits, Camberley, UK; gain: 31 dB) providing a total gain of 62 dB, which has been sufficient for the digitization and recording of OA waveforms by a fast oscilloscope (DSO7034A, Agilent Technologies, Santa Clara, CA, USA; bandwidth: 350 MHz; sample rate: 2 GSa/s). Aiming to improve the SNR values, the recorded waveforms (consisted of 1000 points) are subjected to hardware averaging by eight times, transferred to a laptop computer and processed further using a digital lowpass filter (cut-off frequency: 2 MHz) for noise reduction. Finally, the peak-to-peak OA amplitude value for each processed waveform is estimated to provide the pixel brightness value in the resulting 8-bit images of the examined mock-ups. Depending on the size of the region of interest, the scanning areas were squares with dimensions of 2 by 2 cm2, 2.6 by 2.6 cm2 or 3.2 by 3.2 cm2, which were sampled, using 60 × 60, 90 × 90 and 120 × 120 pixels, respectively, fulfilling the Nyquist criterion for lossless sampling. The total time required for the recording of a single OA image using the aforementioned settings ranged from 50 min to 3.5 h and was ultimately determined by the laser’s pulse repetition rate. Control and synchronization of the OA imaging apparatus were performed using custom-developed software, whereas image processing was achieved through ImageJ 1.54 and MATLAB R2022a programming environments.

2.1.2. NIR Imaging

A custom multispectral imaging system optimized for paintings diagnostics has been utilized to record NIR images of the mock-ups. The system integrates a high-resolution CMOS camera (UI-5480CP, IDS, Obersulm, Germany; 4.92 MP) coupled with a NIR-transparent objective lens (Macro Lens 25 mm, F = 1.3, Electrophysics Corp., West Fairfield, NJ, USA). The respective illumination is achieved through two broadband emission lamps (Halostar Starlite, OSRAM, Munich, Germany; 50 W, 12 V) which were placed at 45° in respect to the mock-up plane. The images have been collected using a bandpass filter (1050BP25, Omega Optical, Brattleboro, VT, USA; central wavelength: 1050 nm; bandwidth: 25 nm) with the camera positioned at 0°. The typical pixel size for the recorded NIR images was 20 μm.

2.1.3. Digital Microscopy

Microscopy images have been obtained by a digital microscope (AM4113T-FVW, Dino-Lite Premier, New Taipei City, Taiwan) integrating visible or UV light sample illumination. The digital microscope is connected to a computer through USB, whereas its accompanying software (DinoCapture 3.0) provides several features including distance measurement tools, as well as image enhancement and annotation capabilities. During the imaging session, the edge of the microscope touches gently a small area of the mock-up’s surface and the image of the selected area is featured on the computer screen. Finally, the image focus is manually controlled by a Z-adjustment wheel located on the microscope body.

2.1.4. Digital Profilometry

The thickness of the applied paint or gelatin layers on the mock-ups has been measured by a digital profilometer (Surface Roughness Tester SJ-410, Mitutoyo, Kawasaki, Japan). The profilometer’s stylus rides in a line across the mock-up’s surface, tracing through vertical displacements the thickness of the desired layer as it passes from the substrate (reference height) to the region of interest. The lateral movement of the stylus parallel to the mock-up’s surface is performed automatically using a motorized stage. In turn, the stylus is connected to a sensor which translates the recorded vertical displacements into electrical signals representing the traced surface profile. The measured data were directly displayed on the digital screen of the instrument and finally exported into ASCII files for further analysis.

2.1.5. Spectral Measurements of Paint Layers

The diffuse reflectance spectra of artificially aged paint layers were measured on a UV-Vis-NIR spectrophotometer equipped with an integrating sphere (Lambda 950, PerkinElmer, Waltham, MA, USA) in the range of 350–1200 nm. Prior to the actual spectral measurements, the spectrometer was calibrated using a highly reflective (>99%) Spectralon target (Labsphere, North Sutton, NH, USA) for defining 100% on the reflectance scale. The absorption spectrum, A(λ), of each measured paint layer is directly calculated through the corresponding reflectance spectrum, R(λ), as A(λ) = 1  −  R(λ), assuming negligible sample transmittance for thick paint layers.

2.2. Mock-Ups Preparation Procedures

2.2.1. Canvas and Gypsum Mock-Ups

A graphite pencil (CASTELL 9000 2B, Faber-Castell, Stein, Germany) was initially used to sketch a specific geometric pattern on small pieces of prepared canvas, representing the underdrawings of the painting. Afterwards, two characteristic types of pigments and a mixture of them—namely, ultramarine blue (Na7Al6Si6O24S3, Kremer 4503, Paco, Athens, Greece) and titanium white (TiO2, Kremer 46200, Paco, Athens, Greece) were individually blended in acrylic binder (Lascaux® Acrylic Glue 498 HV, Kremer Pigmente GmbH & Co. KG, Aichstetten, Germany) to form thick acrylic paints. Each paint paste was applied using a spatula over the canvas pieces, forming paint layers ~60 μm thick, using a 60 μm thick tape (Scotch Magic Tape, Scotch, St. Paul, MN, USA) as reference. The mock-ups were left to dry completely for one hour prior the application of two layers of dewaxed diluted shellac (Paco, Athens, Greece) over the paint using a brush. To ensure that the shellac varnish had dried, the mock-ups were imaged during the next day after their production. Similar procedures have been followed for the case of gypsum substrate mock-ups, with the exception that shellac varnish was not applied on the paint layers. As regards the generation of the gypsum substrate mock-ups, paint layers of various thicknesses (60, 120, 180 and 240 μm) were applied. One to four 60 μm thick tape layers were superimposed to the sample border as a reference. The average thickness of the resulting paint layers was experimentally verified through digital profilometry measurements. For this specific series of mock-ups, the underdrawings were produced using a charcoal pencil (PITT CHARCOAL SOFT, Faber-Castell, Stein, Germany), whereas the overlying paint layers contained exclusively titanium white pigment (TiO2, Kremer 46200) in the acrylic binder.

2.2.2. Artificially Aged Paint Samples

Eight egg-yolk based tempera paint samples were produced on microscope glass slides (D100011, Deltalab, Barcelona, Spain) using two characteristic types of pigments, namely yellow ochre (SiO2 + AlO3 + Fe2O3 + Fe3O4, Kremer 40080) and Prussian blue (C18Fe7N18 Kremer 45202). The generated samples were subsequently subjected to accelerated artificial ageing that was carried out through prolonged heating (thermal ageing [30,31,32]). To prepare the medium, equal proportions (v/v) of egg yolk, vinegar and water were initially mixed. The pigments were individually and proportionately blended in the egg yolk binder to form egg-tempera paints. Each paint paste was applied using a spatula over the glass surfaces forming thin paint layers. To ensure that the paint was dried, the samples were placed in an oven (Cole-Parmer Instrument Company, Vernon Hills, IL, USA) for thermal ageing two days after their production. Three yellow ochre and three Prussian blue paint samples were heated at a constant temperature of 65 °C for 2, 4 and 6 h, respectively. One sample of each paint type was kept as a reference, representing the non-aged case.

2.2.3. Gelatin Layer Preparation

The applied thin gelatin layers on the mock-ups, have been prepared by dissolving small pieces of commercially available gelatin leaves (Jotis, Athens, Greece) in distilled water at a concentration of 3.3% w/v. The gelatin pieces were initially soaked into the water for approximately 5 min and the mixture was subsequently heated in a microwave oven to its boiling point (~100 °C) and then cooled down to ~40 °C. The resulting gel was applied directly onto the surface of the mock-ups using a syringe to avoid air-bubble formation during jellification. The gel layers were then left to solidify at least for 30 min before the beginning of OA imaging. The average thickness of the applied gelatin layers was estimated using a digital profilometer at ~115 μm. Following the completion of the OA imaging session, the gelatin layer was carefully peeled off the surface of the mock-ups by hand.

3. Results

3.1. Characterization of the OA Imaging Apparatus

The developed non-invasive, reflection-mode OA imaging apparatus was initially characterized in terms of OA detection bandwidth and lateral spatial resolution, aiming to verify its optimum performance prior to the measurement of the produced mock-ups. Towards that end, we have recorded the OA signal emitted by a graphite spot of ~180 μm in diameter on gypsum substrate. The generated spot is more than 4 times smaller compared to the theoretically predicted diffraction limited focus of the air-coupled transducer (~761 μm) and thus can be considered as a point signal source with good approximation. Furthermore, the laser pulse duration (10 ns) is ~50 times smaller than the characteristic stress relaxation time for the excited region, considering that the speed of sound in ambient air at 20 °C is 343 m/s. Under the aforementioned conditions, the recorded OA signal following excitation with a 2.2 mJ pulse can be reasonably considered as the impulse response of the integrated transducer (Figure 1b). The waveform is characterized by successive positive and negative peaks corresponding to the respective compression and rarefaction regions of the laser-induced broadband ultrasonic wave, which presents an apparent peak-to-peak amplitude value in the order of 50 mV. Aiming to investigate the frequency content of the detected time-domain signal, we have subsequently applied a Fast Fourier Transform (FFT) to generate a normalized OA amplitude spectrum representing the detection sensitivity of the transducer (Figure 1c). The sensitivity curve demonstrates a peak at 950 kHz, approximating closely to the nominal central frequency of 1 MHz provided by the manufacturer. Furthermore, the -6 dB detection bandwidth has been determined between 635 and 1190 kHz, which is also in good agreement with the respective nominal values. Aiming to estimate the point spread function (PSF) of the OA imaging apparatus corresponding to the maximum achievable lateral resolution, we further acquired a 50 × 50 pixels image (Figure 1d) of the graphite spot by raster scanning an area of 2 by 2 mm2 (pixel size: 40 μm). A pixel intensity profile was then extracted from the PSF image and the data points were fitted with a gaussian curve for the estimation of the respective full width at half maximum (FWHM) value, indicating a lateral resolution of 772 μm (Figure 1e). The calculated FWHM of the gaussian curve has been approximately equal to the diffraction limited focus of the transducer (761 μm), confirming additionally the optimal performance of the OA imaging apparatus.

3.2. OA Detection of Paint Ageing

As a first step, we evaluated the capabilities of OA signal recording towards the sensitive detection of paint ageing through the induced modifications in the optical absorption properties of the medium. In this framework, we acquired and measured the peak-to-peak OA signal amplitude from the egg-tempera paints which had been artificially aged through heating at 65 °C (thermal ageing). A reference (non-aged) ochre yellow paint sample is shown in Figure 2a, whereas Figure 2b–d present similar samples that have been thermally aged for 2, 4 and 6 h, respectively. Typical OA waveforms generated from the aforementioned paint layers are explicitly shown in Figure 2e, following excitation with 0.17 mJ NIR laser pulses. A remarkable increase of the peak-to-peak OA amplitude is observed as a function of the heating duration, revealing a respective gradual increase of the optical absorption coefficient at 1064 nm according to the paint-ageing degree. A series of 10 peak-to-peak OA amplitude measurements were obtained for each sample to estimate an average value which was subsequently plotted as a function of thermal-ageing time (Figure 2f). The data points were additionally fitted with an exponential function in the form of y = y0 + Ae−x/B (red curve in Figure 2f), indicating a saturation of the detected OA amplitude and thus the corresponding optical absorption coefficient for higher thermal ageing durations. The characteristic time for the observed thermal ageing saturation in the case of ochre yellow paint was assessed through the B fitting parameter at 1.75 h. Similar OA measurements were repeated for a series of thermally aged Prussian blue paint samples (Figure 2g–j), following OA excitation with lower energy NIR pulses of 40 μJ to retain acceptable SNR values while avoiding potential photodamage effects due to the apparently high optical absorption of the pigment. The recorded OA waveforms in this case (Figure 2k) also revealed a well-distinguishable increase of the optical absorption coefficient as a function of the thermal ageing duration. The estimated peak-to-peak OA amplitude values were similarly averaged out of 10 sequential measurements and plotted in the graph of Figure 2l, indicating an approximately linear behavior with the ageing time. As a result, a linear regression model was utilized (red line in Figure 2l) to describe the ageing behavior of the Prussian blue paints. The slope of the fitted line was estimated at 1.75 mV/h, which corresponds to a 10.5 mV absolute OA amplitude increase (~30.6% relative increase) for the full temporal range of the thermal ageing process. Finally, we attempted to validate all the recorded amplitude measurements by assessing the correlation of the OA data for both paint types with respective optical absorbance measurements at 1064 nm using a state-of-the-art spectrophotometer. In this respect, we estimated a Pearson correlation coefficient of 0.95 for the ochre yellow and 0.98 for the Prussian blue samples, verifying the high accuracy of the OA measurements. Furthermore, it has to be mentioned that for both paints, the maximum variation of absorbance as measured by the spectrophotometer did not exceed 0.5%. On the contrary, the respective maximum relative OA amplitude change reached up to 54.8% (yellow ochre samples), indicating an improvement by 2 orders of magnitude sensitivity regarding the detection of optical absorption alterations in the investigated, aged samples.

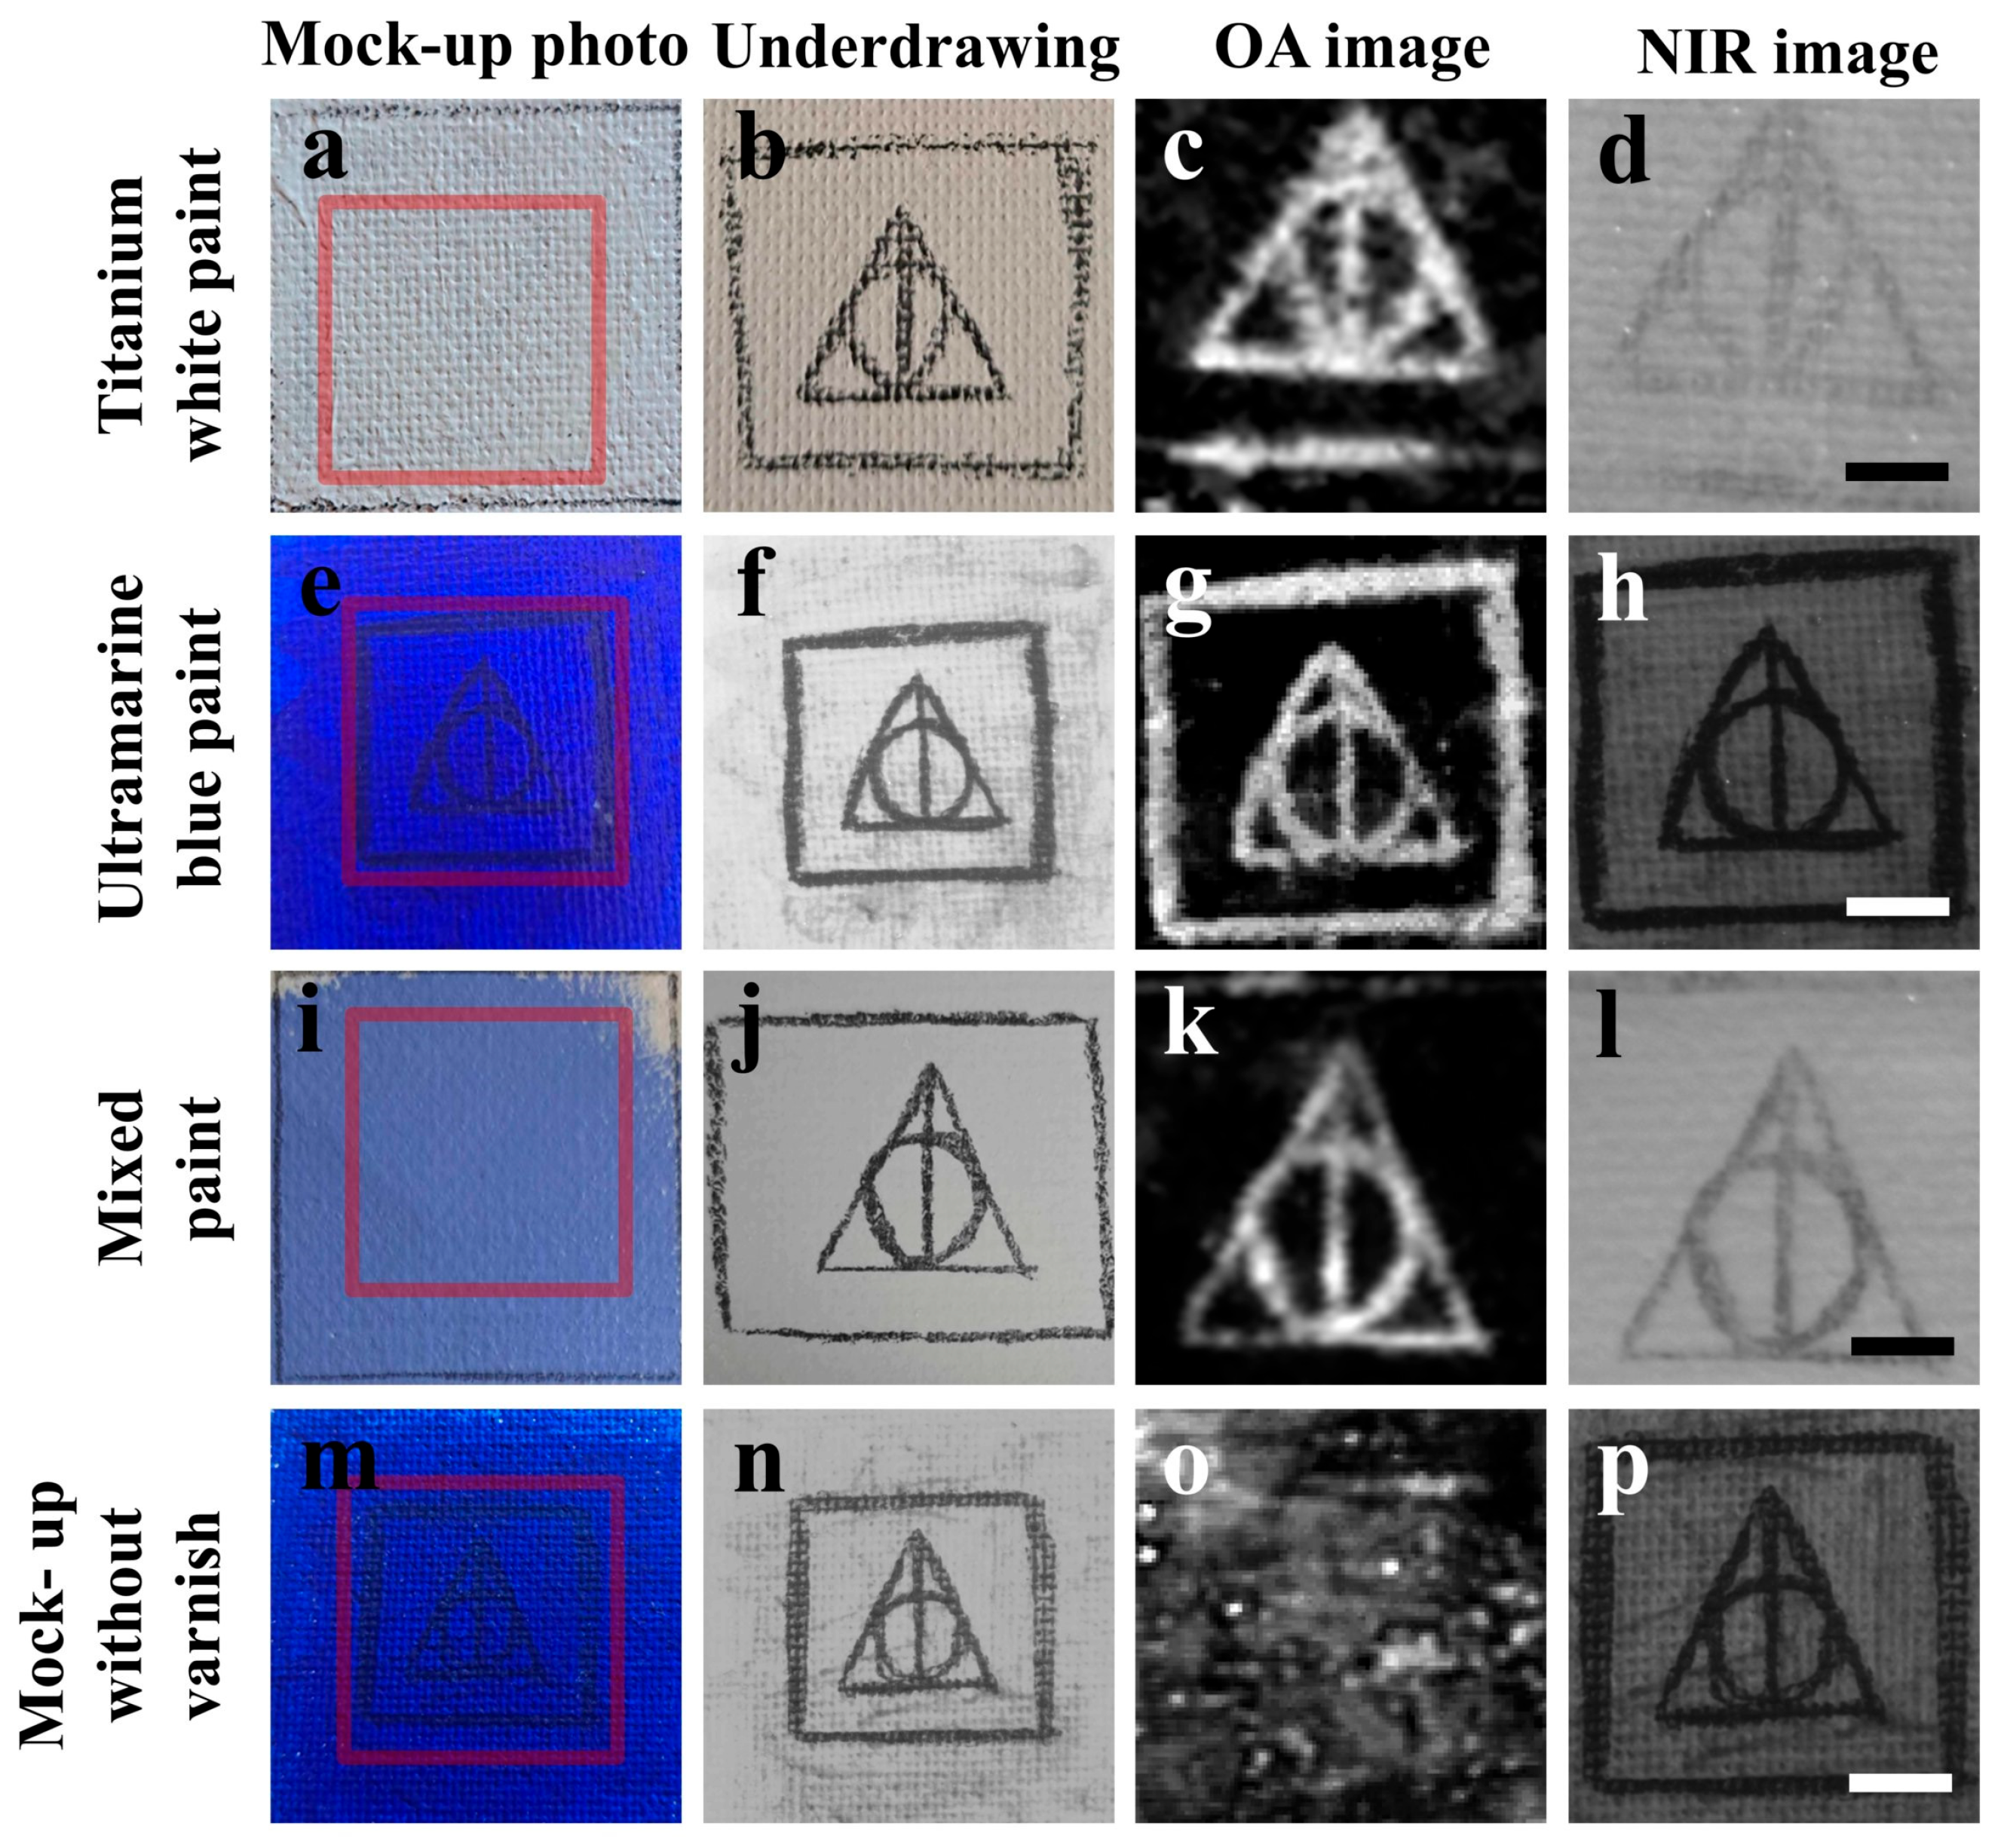
3.3. OA Imaging of Painted Canvas Mock-Ups with Varnish

Aiming to evaluate the in-depth imaging capabilities of the reflection-mode, non-invasive OA system, we initially attempted to uncover hidden, pencil-underdrawing patterns in painted canvas mock-ups covered with shellac varnish. In this direction, commonly used pigments including titanium white and ultramarine blue have been used for the generation of the paints. Figure 3a depicts the central area (3 by 3 cm2) of a titanium white painted canvas mock-up, whereas the red square indicates the 2 by 2 cm2 region that was subsequently examined by means of OA imaging. The underlying pencil sketch prior to the application of the paint is explicitly shown in Figure 3b, for the same area as in Figure 3a. The acquired OA image was able to reveal the hidden sketch in the selected region with high contrast specificity as a result of the strong absorption of NIR radiation by the graphite rather than the overlying paint layer (Figure 3c). Finally, we proceeded to the comparison of the recorded OA image with the state-of-the-art method of NIR imaging at a similar spectral detection region (1050 nm) with the excitation wavelength (1064 nm). While the NIR image of the underdrawing (Figure 3d) provides high resolution spatial information, the imaging contrast is apparently lower than the respective OA image, most probably due to the strong scattering of incident and reflected radiation by the white paint. Similar results are presented for two mock-ups containing either ultramarine blue (Figure 3e–h) or mixed titanium white and ultramarine blue paints (Figure 3i–l). It can be observed that the OA method provides high contrast images of the hidden underdrawings in all examined cases. Nevertheless, this feature is not evident in the respective NIR images, as their contrast appear to vary drastically according to the individual optical properties of each paint layer. Finally, aiming to investigate the role of the varnish layer as regards the performance of OA imaging, we attempted to image a similar ultramarine blue canvas mock-up but without covering it with shellac (Figure 3m). In this special case, the hidden underdrawing (Figure 3n) could not be revealed in the respective OA image, as no useful contrast was provided despite the recording of considerable amplitude signals (Figure 3o). On the contrary, the NIR imaging of the same mock-up (Figure 3p) was able to offer high quality information of the underdrawing both in terms of contrast and resolution, similarly to the respective case shown in Figure 3e–h. The inadequacy of OA imaging to provide any diagnostic information of hidden layers for this mock-up can be safely attributed to the strong signals generated on the surface of the absorbing paint layer, which do not exhibit any significant attenuation as they are transmitted directly through the ambient air towards the transducer. As a result, the signals from the paint’s surface dominate over the respective attenuated signals arising from the covered pencil sketch. Therefore, it can be deduced that the negligible optical absorption thin varnish layer efficiently eliminates such artifacts, as all generated OA waves, either originating from paint or highly absorbing graphite, follow similar transmission paths through its bulk and thus experience comparable attenuations prior their detection.

3.4. OA Imaging of Gypsum Mock-Ups without Varnish

As a next step, we proceeded to the OA imaging of different mock-up types, which were produced using gypsum substrates and similar paints as in the previous case but had not been covered with any optically transparent varnish, suppressing the superficial parasitic OA signals. Aiming to avoid the previously observed imaging artifacts, a thin gelatin layer was initially applied on the mock-ups prior to the measurements, facilitating the sensitive detection of underdrawings. The photo of a gypsum mock-up (depicted area: 5 by 5 cm2) covered with titanium white paint is presented in Figure 4a, with the red square indicating a 2.6 by 2.6 cm2 region that was selected for OA imaging. The respective pencil sketch before the application of the paint is shown in Figure 4b for the same area. A high contrast OA image of the hidden underdrawings is shown in Figure 4c, while the respective NIR image of Figure 4d can barely delineate the pencil sketches due to the apparent strong interaction of the optical radiation with the titanium white paint. It is worth mentioning that the use of the gelatin layer allowed for the acquisition of OA images with comparable contrast levels as in the shellac covered canvas mock-up presented in Figure 3a–d. Similar results are presented for an ultramarine blue painted gypsum mock-up (Figure 4e–h), as well as a mixed titanium white and ultramarine blue sample (Figure 4i–l). In both cases, the OA images demonstrate comparable (ultramarine blue) or better (mixed paint) contrast of underdrawings than the NIR technique, albeit with apparently lower spatial resolution due to the extensive focal spot of the transducer. Following the end of the OA imaging session, the applied gelatin layers were carefully peeled off from the mock-up surfaces so as to investigate potential morphological or structural alterations at a microscopic level due to their use.
An initial visual comparison of the titanium white gypsum mock-up with the gelatin layer (Figure 5a) and directly after its removal (Figure 5b) showed no apparent macroscopic alterations, as the surfaces of the paint appear virtually identical in both images. Aiming to inspect further the morphology of the mock-up, digital microscopy was utilized for the high-resolution assessment of possible modifications at different regions. Typical microscopy images that were acquired before the gelatin layer application (Figure 5c) and after its removal (Figure 5d) additionally showed no detectable paint surface changes in accordance to the macroscopic observations. Similar results are presented for the ultramarine (Figure 5e–h) and the mixed paint (Figure 5i–l) mock-ups, validating that in all examined cases, both the application and removal procedures of the gelatin layer used for parasitic OA signal suppression do not microscopically alter the morphology of the original mock-up surfaces.

3.5. Imaging Performance Evaluation as a Function of Paint Layer Thickness

Aiming to investigate the imaging performance of both OA and NIR modalities with an increasing paint layer thickness, we produced four gypsum mock-ups using charcoal pencil for the sketching of underdrawings, and titanium white pigment for the respective generation of overlying paints. An identical “X” pattern was initially drawn on the surface of all four mock-ups prior to their covering with titanium white paint of controlled thickness using stacked 60 μm thick tapes as reference (see Section 2). Specifically, paint layers of 60 μm, 120 μm, 180 μm and 240 μm thickness were applied to conceal the sketches. A thin gelatin layer was also applied for parasitic signal suppression before the OA imaging, which was performed by constantly irradiating the mock-ups with 2.6 mJ pulses. Figure 6a depicts a 5 by 5 cm2 area of a gypsum mock-up covered with a 60 μm thick titanium white paint layer, with the red square indicating a respective 2 by 2 cm2 central region that was selected for underdrawings visualization. A photo of the “X” shaped sketch prior to the paint application is presented in Figure 6b, whereas the corresponding OA and NIR images are shown in Figure 6c and Figure 6d, respectively. Similar results are presented for the 120 μm (e–h), the 180 μm (i–l) and the 240 μm (m–p) paint layer thickness mock-ups, showcasing a gradual imaging contrast loss which is apparently more significant in the case of NIR imaging than the OA modality. Nevertheless, the OA images also demonstrate an apparent SNR drop with an increasing thickness, which can be primarily attributed to more intense scattering of optical radiation, and secondarily to the higher attenuation of the generated OA waves as they propagate through the layer.
Aiming for a quantitative exploration of these observations, we initially proceeded to the estimation of the SNR values for the recorded OA images as a function of paint layer thickness. The SNR was estimated by averaging four respective values which were individually estimated by calculating the ratio between the mean pixel intensity across the “X” pattern and the standard deviation of the pixels in each formed triangular “no-signal” region of the image. The graph of Figure 7a shows the evaluated data points fitted with an exponential decay function in the form of y = Ae−x/B (red curve), yielding a characteristic paint thickness (B) equal to 190.88 μm, which in turn corresponds to the respective 1/e SNR value. Furthermore, we compared between the OA and the NIR imaging techniques by estimating the contrast, C, of the images through the common Michelson equation
C = I s i g n a l I b a c k g r o u n d I s i g n a l + I b a c k g r o u n d
where Isignal and Ibackground correspond to the average pixel intensity value for the “X” pattern and the background, respectively. In an analogous manner to SNR estimation, four individual contrast values were calculated and their mean was considered as the final contrast of the image. The plot in Figure 7b shows the quantified contrast data for OA (black circles) and NIR (black squares) images as a function of paint thickness. The data points have been further fitted with exponential decay functions (red and blue curves) to reveal characteristic thicknesses of 285.72 μm for the OA and 159.56 μm for the NIR imaging modality. The ratio of these thickness values is approximately 1.8, indicating a superior performance of OA over the state-of-the-art NIR imaging at similar spectral detection regions as the laser’s excitation wavelength. The resistance of OA imaging in optical scattering can be explained in terms of the drastically reduced attenuation of OA waves during their propagation through the paint compared to the NIR reflected radiation in a “double-pass” configuration. The estimated ratio is only slightly lower than the ideal value of 2, which would be expected if we completely neglected the OA waves attenuation effect, thus simulating a perfect “single-pass” imaging mode.

4. Discussion

This work has demonstrated the capabilities of a novel reflection-mode OA imaging methodology for the ultrasensitive detection of ageing-related modifications in paints and the in-depth imaging of hidden optically absorbing layers with minimal disturbance on the examined object. The OA modality presented a remarkable sensitivity regarding the detection of ageing-related optical absorption modifications in paint layers, which has been approximately two orders of magnitude higher compared to standard absorbance measurements through a spectrophotometer. This superior performance can be justified due to the fact that the detected peak-to-peak OA amplitude is directly proportional to the optical absorption coefficient (μ) of the medium [22,23]. In contrast to this analogy between the OA signal and μ, spectrophotometry measures the absorbed radiation intensity, demonstrating a non-linear dependence with μ according to Beer–Lambert’s law. A detailed mathematical analysis (Appendix A) reveals that OA sensing offers a few orders of magnitude higher sensitivity in the detection of small μ variations when a highly absorbing medium is examined.
Although Prussian blue is a widely used pigment, its stability has been questioned since its discovery in 1704, especially when mixed with other paints or exposed to light and low-oxygen conditions simulating natural ageing processes [33]. The recorded OA measurements are found in excellent agreement with these observations, revealing a consistent linear increase of the absorption coefficient at 1064 nm as a function of ageing duration (Figure 2l). On the contrary, ochre yellow is known to be relatively stable and more tolerant in ageing conditions, as has been verified by detailed UV/Vis spectrophotometric measurements in the diffuse reflectance mode [34]. The observed OA signal saturation in the case of ochre yellow ageing (Figure 2f) is in accordance to its ascertained stability, indicating that prolonged ageing time does not significantly alter the optical absorption properties of the paint in the NIR.
The developed OA imaging system integrates a spherically focused air-coupled ultrasonic transducer providing a lateral resolution of the order of 770 μm, which has been sufficient for the detailed mapping of pencil underdrawings in canvas and gypsum mock-ups. The employed detector is commercially available at low cost, whereas it does not require special maintenance and can be integrated into the diagnostic system in a completely straightforward manner. In addition, it does not involve sophisticated alignment or optimization procedures; therefore, the imaging system can be directly used by conservators and operators with no photonics-based background. Air-coupled detectors are compact (~3 cm) and can be easily transported for in situ measurements. This feature is extremely important when investigating invaluable heritage objects that cannot be moved to the lab. Finally, it has to be mentioned that they are quite insensitive to temperature or humidity fluctuations and, of course, are not affected at all by the environmental light conditions. In the case that a protective optically transparent varnish layer is present, the hidden layers can be visualized non-invasively and without any contact with the object, similarly to competitive pure optical methods such as NIR imaging and OCT. To our knowledge, this is the first time that such performance has been achieved, demonstrating the rich potential of OA diagnostic tools for in-depth investigations of CH objects with arbitrary geometries and thicknesses. A highly compatible thin, solid gelatin layer is necessary if no varnish layer exists on the object’s surface in order to suppress the strong signals generated exactly at the paint–air interface. Gelatin comprises an inert medium which is routinely used for cleaning purposes for CH objects [35,36], presenting apparently no interaction with the object’s paint layers, as has been carefully verified through optical microscopy observations. The OA imaging contrast of painted-over sketches has been at least two times higher than the respective contrast provided by NIR images in cases of relatively thick and highly scattering pigmented layers.
While traditional immersion transducers are expected to present superior detection sensitivity of hidden layers due to the significantly more efficient coupling with the OA signal source, they inevitably require the use of water or low viscosity gel media during the imaging procedures, which may irreversibly alter the original surfaces of the examined artwork, directly threatening its integrity and aesthetic value. Such detectors typically employed in biomedical studies cannot be considered suitable for inspecting invaluable CH items of historical significance in galleries, museums and monuments. Balancing detection sensitivity with non-invasiveness is highly important for practical applications in CH diagnostics, making OA imaging a valuable complement to existing state-of-the-art techniques. Future versions of the developed imaging setup may include optical detection of OA waves [37,38] by integrating established interferometric or refractometric techniques, eliminating completely the need for thin gelatin layers, especially in the case of valuable ultrasensitive objects. While promising, these methods still require further optimization in terms of cost-efficiency and robustness, as well as advanced engineering, before they can be effectively used for in situ measurements of CH artifacts. Beyond this significant improvement, multispectral OA excitation using tunable laser sources in the NIR and midIR [39,40] may further facilitate the precise discrimination of multiple concealed layers with varying optical absorption characteristics, enhancing simultaneously the specificity and the sensitivity concerning the detection of chemical degradation or discoloration effects. The latter capability could be effectively combined with other well-established pure optical methods, such as OCT and multiphoton microscopy, in the context of a holistic approach providing complementary information from the different layers comprising the CH object under investigation. In this context, the present OA imaging technology may extend the current state-of-the-art methods and reshape the CH diagnostics capabilities by offering substantially enhanced imaging depth to spatial resolution ratios coupled with high optical absorption sensitivity in a completely non-invasive manner.

Author Contributions

Conceptualization, G.J.T. and C.F.; methodology, G.J.T., K.M. and E.P.; software, G.J.T.; validation, E.P.; formal analysis, G.J.T.; investigation, E.P.; resources, K.M.; data curation, G.J.T. and E.P.; writing—original draft preparation, G.J.T.; writing—review and editing, C.F. and G.Z.; visualization, G.J.T.; supervision, C.F. and G.Z.; project administration, C.F.; funding acquisition, C.F. and G.Z. All authors have read and agreed to the published version of the manuscript.

Funding

This work has been supported by the Horizon Europe Project, iPhotoCult (Project number: 101132448). Furthermore, G.Z. and G.J.T would like to acknowledge funding from the H2020 FETOPEN project “DynAMic” (EC-GA-863203).

Institutional Review Board Statement

Not applicable.

Informed Consent Statement

Not applicable.

Data Availability Statement

The data that support the findings of this study are available from the corresponding author upon reasonable request.

Acknowledgments

The authors wish to thank Giannis Syngelakis, Evdoxia Dimitroulaki and Kostas Hatzigiannakis for their assistance in profilometric and spectroscopic measurements as well as NIR imaging. G.J.T. and G.Z. wish also to thank Orestis Faklaris from the Institute Jacques Monod (now at Montpellier Cell Biology Research Center) for donating components that were integrated into the OA imaging system.

Conflicts of Interest

The authors declare no conflict of interest.

Appendix A. Sensitivity Comparison between OA Detection and Absorption Spectroscopy

The initial pressure amplitude, p0, of OA waves is directly proportional to the optical absorption coefficient μ for the employed excitation wavelength [22], and thus
p 0 = A μ
where A is a proportionality constant including the Grüneisen parameter of the medium and the optical fluence. Assuming an induced variation in the optical absorption coefficient, Δμ, we can write that
Δ p 0 Δ μ = A     Δ p 0 p 0 = A Δ μ p 0   Δ p 0 p 0 = A Δ μ A μ   Δ p 0 p 0 = Δ μ μ
Therefore, the last equation shows how the relative peak-to-peak OA amplitude is expected to change for a variation Δμ of a medium characterized by an optical absorption coefficient equal to μ.
In the case of optical absorption spectroscopy, the absorbed radiation intensity is measured following light propagation through a medium. Beer–Lambert’s law implies that the transmitted optical intensity, Itrs, will be given by the equation
I t r s = I 0 e μ L
where I0 stands for the initial light intensity incident on the surface of the medium and L is the optical path length. The absorbed optical intensity, Iabs, will then be equal to the difference between I0 and Itrs and thus can be expressed as
I a b s = I 0 ( 1 e μ L )
By differentiating both sides of the latter equation with respect to μ, we find that
d I a b s d μ = Ι 0 L e μ L
For a relatively small variation Δμ in the optical absorption coefficient μ, this differential equation can be approximately re-written as
Δ I a b s = Δ μ Ι 0 L e μ L
and thus, the relative change of the absorbed optical intensity can be finally expressed as
Δ I a b s I a b s = Δ μ L e μ L 1 e μ L
Let us now compare between the relative signal changes provided by OA and absorption spectroscopy techniques for a given small optical absorption coefficient variation Δμ by calculating the sensitivity ratio R as follows:
R = Δ p 0 p 0 Δ I a b s I a b s = Δ μ μ Δ μ L e μ L 1 e μ L = 1 e μ L μ L e μ L = e μ L 1 μ L
For the case of low absorption limit (μ → 0), R approximates 1, which means that both techniques present essentially the same sensitivity as regards the detection of small optical absorption variations. However, for media characterized by higher optical absorption coefficients, we can observe a rapid exponential increase of R as a function of μ.
Specific cases are described as follows:
  • for μ = 1/L, R becomes approximately equal to 1.718;
  • for μ = 5/L, R becomes approximately equal to 29.48;
  • for μ = 7/L, R becomes approximately equal to 156.5;
  • for μ = 10/L, R becomes approximately equal to 2203.
As a conclusion, OA signal detection may provide a few orders of magnitude higher sensitivity levels compared to traditional absorption spectroscopy when detecting very small optical absorption changes in highly absorbing media.

References

  1. Pironti, C.; Ricciardi, M.; Proto, A.; Cucciniello, R.; Fiorentino, A.; Fiorillo, R.; Motta, O. New analytical approach to monitoring air quality in historical monuments through the isotopic ratio of CO2. Environ. Sci. Pollut. Res. 2022, 29, 29385–29390. [Google Scholar] [CrossRef] [PubMed]
  2. Faggiano, A.; Pironti, C.; Motta, O.; Miele, Y.; Fiorentino, A.; Marchettini, N.; Ricciardi, M.; Proto, A. Insight on the deterioration of cultural objects: A multi-analytical approach to characterize degradation products of lead weights from a Steinway & sons piano. Environ. Sci. Pollut. Res. 2023, 30, 104633–104639. [Google Scholar]
  3. Anglos, D.; Georgiou, S.; Fotakis, C. Lasers in the analysis of cultural heritage materials. Nano Res. 2009, 8, 47–60. [Google Scholar] [CrossRef]
  4. Jones, C.; Duffy, C.; Gibson, A.; Terras, M. Understanding multispectral imaging of cultural heritage: Determining best practice in MSI analysis of historical artefacts. J. Cult. Herit. 2020, 45, 339–350. [Google Scholar] [CrossRef]
  5. Es Sebar, L.; Lombardo, L.; Buscaglia, P.; Cavaleri, T.; Lo Giudice, A.; Re, A.; Borla, M.; Aicardi, S.; Grassini, S. 3D Multispectral Imaging for Cultural Heritage Preservation: The Case Study of a Wooden Sculpture of the Museo Egizio di Torino. Heritage 2023, 6, 2783–2795. [Google Scholar] [CrossRef]
  6. Liang, H. Advances in multispectral and hyperspectral imaging for archaeology and art conservation. Appl. Phys. A 2012, 106, 309–323. [Google Scholar] [CrossRef]
  7. Targowski, P.; Iwanicka, M.; Rouba, B.J.; Frosinini, C. OCT for Examination of Artwork; Springer: Cham, Switzerland; Vero Beach, FL, USA, 2020; pp. 2473–2495. [Google Scholar]
  8. Targowski, P.; Iwanicka, M. Optical Coherence Tomography: Its role in the non-invasive structural examination and conservation of cultural heritage objects—A review. Appl. Phys. A 2012, 106, 265–277. [Google Scholar] [CrossRef]
  9. Liang, H.; Cid, M.G.; Dobre, G.M.; Podoleanu, A.G.; Pedro, J.; Saunders, D. En-face optical coherence tomography—A novel application of non-invasive imaging to art conservation. Opt. Express 2005, 13, 6133–6144. [Google Scholar] [CrossRef]
  10. Dal Fovo, A.; Castillejo, M.; Fontana, R. Nonlinear optical microscopy for artworks physics. Riv. Nuovo Cim. 2021, 44, 453–498. [Google Scholar] [CrossRef]
  11. Mari, M.; Filippidis, G. Non-Linear Microscopy: A Well-Established Technique for Biological Applications towards Serving as a Diagnostic Tool for in situ Cultural Heritage Studies. Sustainability 2020, 12, 1409. [Google Scholar] [CrossRef]
  12. Bersani, D.; Lottici, P.P. Raman spectroscopy of minerals and mineral pigments in archaeometry. J. Raman Spectrosc. 2016, 47, 499–530. [Google Scholar] [CrossRef]
  13. Candeias, A.; Madariaga, J.M. Applications of Raman spectroscopy in art and archaeology. J. Raman Spectrosc. 2019, 50, 137–142. [Google Scholar] [CrossRef]
  14. Edwards, H.; Colomban, P.; Vandenabeele, P. Raman Spectroscopy in Cultural Heritage Preservation; Springer International Publishing: Berlin, Germany, 2023. [Google Scholar]
  15. Liu, G.L.; Kazarian, S.G. Recent advances and applications to cultural heritage using ATR-FTIR spectroscopy and ATR-FTIR spectroscopic imaging. Analyst 2022, 147, 1777–1797. [Google Scholar] [CrossRef] [PubMed]
  16. Poliszuk, A.; Ybarra, G. Analysis of cultural heritage materials by infrared spectroscopy. In Infrared Spectroscopy: Theory, Developments and Applications; Nova Science Publishers: Hauppauge, NY, USA, 2014; pp. 519–536. [Google Scholar]
  17. Volpi, F.; Vagnini, M.; Vivani, R.; Malagodi, M.; Fiocco, G. Non-invasive identification of red and yellow oxide and sulfide pigments in wall-paintings with portable ER-FTIR spectroscopy. J. Cult. Herit. 2023, 63, 158–168. [Google Scholar] [CrossRef]
  18. Tserevelakis, G.J.; Pouli, P.; Zacharakis, G. Listening to laser light interactions with objects of art: A novel photoacoustic approach for diagnosis and monitoring of laser cleaning interventions. Herit. Sci. 2020, 8, 98. [Google Scholar] [CrossRef]
  19. Liu, H.; Wang, M.; Ji, F.; Jiang, Y.; Yang, M. Mini review of photoacoustic clinical imaging: A noninvasive tool for disease diagnosis and treatment evaluation. J. Biomed. Opt. 2024, 29, S11522. [Google Scholar] [CrossRef] [PubMed]
  20. Lee, H.; Han, S.; Kye, H.; Kim, T.-K.; Choi, W.; Kim, J. A Review on the Roles of Photoacoustic Imaging for Conventional and Novel Clinical Diagnostic Applications. Photonics 2023, 10, 904. [Google Scholar] [CrossRef]
  21. Tserevelakis, G.J.; Mavrakis, K.G.; Pantazopoulou, D.; Lagoudaki, E.; Detorakis, E.; Zacharakis, G. Hybrid autofluorescence and photoacoustic label-free microscopy for the investigation and identification of malignancies in ocular biopsies. Opt. Lett. 2020, 45, 5748–5751. [Google Scholar] [CrossRef]
  22. Wang, L.V.; Wu, H.-I. Biomedical Optics: Principles and Imaging; John Wiley and Sons: Hoboken, NJ, USA, 2012; pp. 283–293. [Google Scholar]
  23. Yao, J.; Wang, L.V. Sensitivity of photoacoustic microscopy. Photoacoustics 2014, 2, 87–101. [Google Scholar] [CrossRef]
  24. Hui, J.; Li, R.; Phillips, E.H.; Goergen, C.J.; Sturek, M.; Cheng, J.-X. Bond-selective photoacoustic imaging by converting molecular vibration into acoustic waves. Photoacoustics 2016, 4, 11–21. [Google Scholar] [CrossRef]
  25. Tserevelakis, G.J.; Chaban, A.; Klironomou, E.; Melessanaki, K.; Striova, J.; Zacharakis, G. Revealing Hidden Features in Multilayered Artworks by Means of an Epi-Illumination Photoacoustic Imaging System. J. Imaging 2021, 7, 183. [Google Scholar] [CrossRef] [PubMed]
  26. Tserevelakis, G.J.; Tsagkaraki, M.; Siozos, P.; Zacharakis, G. Uncovering the hidden content of layered documents by means of photoacoustic imaging. Strain 2019, 55, e12289. [Google Scholar] [CrossRef]
  27. Dal Fovo, A.; Tserevelakis, G.J.; Papanikolaou, A.; Zacharakis, G.; Fontana, R. Combined photoacoustic imaging to delineate the internal structure of paintings. Opt. Lett. 2019, 44, 919–922. [Google Scholar] [CrossRef] [PubMed]
  28. Tserevelakis, G.J.; Tsafas, V.; Melessanaki, K.; Zacharakis, G.; Filippidis, G. Combined multiphoton fluorescence microscopy and photoacoustic imaging for stratigraphic analysis of paintings. Opt. Lett. 2019, 44, 1154–1157. [Google Scholar] [CrossRef]
  29. Dal Fovo, A.; Tserevelakis, G.J.; Klironomou, E.; Zacharakis, G.; Fontana, R. First combined application of photoacoustic and optical techniques to the study of an historical oil painting. Eur. Phys. J. Plus 2021, 136, 757. [Google Scholar] [CrossRef]
  30. Seves, A.M.; Sora, S.; Scicolone, G.; Testa, G.; Bonfatti, A.M.; Rossi, E.; Seves, A. Effect of thermal accelerated ageing on the properties of model canvas paintings. J. Cult. Herit. 2000, 1, 315–322. [Google Scholar] [CrossRef]
  31. Bacci, M.; Picollo, M.; Porcinai, S.; Radicati, B. Evaluation of the museum environmental risk by means of tempera-painted dosimeters. Thermochim. Acta. 2000, 365, 25–34. [Google Scholar] [CrossRef]
  32. Farmakalidis, H.V.; Douvas, A.M.; Karatasios, I.; Sotiropoulou, S.; Boyatzis, S.; Argitis, P.; Chryssoulakis, Y.; Kilikoglou, V. Accelerated thermal ageing of acrylic copolymers, cyclohexanone-based and urea-aldehyde resins used in paintings conservation. Mediterr. Archaeol. Archaeom. 2016, 16, 213–228. [Google Scholar]
  33. Gervais, C.; Languille, M.-A.; Reguer, S.; Garnier, C.; Gillet, m. Light and anoxia fading of Prussian blue dyed textiles. Herit. Sci. 2014, 2, 26. [Google Scholar] [CrossRef]
  34. Amanatiadis, S.; Apostolidis, G.; Karagiannis, G. Consistent characterization of color degradation due to artificial aging procedures at popular pigments of byzantine iconography. Minerals 2021, 11, 782. [Google Scholar] [CrossRef]
  35. De France, K.J.; D’Emilio, E.; Cranston, E.D.; Geiger, T.; Nyström, G. Dual physically and chemically crosslinked regenerated cellulose—Gelatin composite hydrogels towards art restoration. Carbohydr. Polym. 2020, 234, 115885. [Google Scholar] [CrossRef] [PubMed]
  36. Giraud, T.; Gomez, A.; Lemoine, S.; Pelé-Meziani, C.; Raimon, A.; Guilminot, E. Use of gels for the cleaning of archaeological metals. Case study of silver-plated copper alloy coins. J. Cult. Herit. 2021, 52, 73–83. [Google Scholar] [CrossRef]
  37. Biqin, D.; Sun, C.; Zhang, H.F. Optical Detection of Ultrasound in Photoacoustic Imaging. IEEE Trans. Biomed. Eng. 2017, 64, 4–15. [Google Scholar]
  38. Wissmeyer, G.; Pleitez, M.A.; Rosenthal, A.; Ntziachristos, V. Looking at sound: Optoacoustics with all-optical ultrasound detection. Light Sci. Appl. 2018, 7, 53. [Google Scholar] [CrossRef] [PubMed]
  39. Pleitez, M.A.; Khan, A.A.; Soldà, A.; Chmyrov, A.; Reber, J.; Gasparin, F.; Seeger, M.R.; Schätz, B.; Herzig, S.; Scheideler, M.; et al. Label-free metabolic imaging by mid-infrared optoacoustic microscopy in living cells. Nat. Biotechnol. 2020, 38, 293–296. [Google Scholar] [CrossRef]
  40. Visscher, M.; Pleitez, M.A.; Van Gaalen, K.; Nieuwenhuizen-Bakker, I.M.; Ntziachristos, V.; Van Soest, G. Label-free analytic histology of carotid atherosclerosis by mid-infrared optoacoustic microscopy. Photoacoustics 2022, 26, 100354. [Google Scholar] [CrossRef]
Figure 1. OA imaging apparatus and performance characterization. (a) Schematical representation of the developed non-invasive, reflection-mode OA imaging apparatus for artworks diagnosis. (b) Time-domain OA signal from a graphite spot with a diameter of ~180 μm. (c) Amplitude spectrum of the waveform shown in (b), which peaked at 950 kHz (dotted red line). (d) OA image of the graphite spot. Scalebar is equal to 400 μm. (e) Pixel intensity profile extracted from (d). The data points (black dots) have been fitted (R2 = 0.995) with a gaussian function (red curve), yielding a FWHM value equal to 772 μm.
Photonics 11 00902 g001
Figure 2. OA amplitude measurements of artificially aged paint samples. (a) Non-aged yellow ochre paint sample. (bd) Thermally aged ochre yellow paint samples for 2, 4 and 6 h, respectively. (e) Typical OA signals arising from the aforementioned yellow ochre paints following the averaging of 32 waveforms. A fixed temporal delay of 1 μs has been inserted among the four signals to facilitate the visualization of OA pressure perturbations. (f) Mean OA amplitude versus thermal-ageing time. Error bars correspond to ± one standard deviation out of 10 consecutive measurements. The red curve corresponds to an exponential fitting with R2 approximately equal to 0.999. (gj) Similar images for thermally aged Prussian blue paint samples. (k) Typical OA signals arising from the Prussian blue paints. (l) Respective graph showing the mean OA amplitude versus thermal ageing time. The data points have been fitted (red line) using a linear regression model (R2 = 0.989).
Photonics 11 00902 g002
Figure 3. OA and NIR imaging of painted canvas mock-ups. (a) Photo of a titanium white canvas mock-up covered with shellac varnish. The red square indicates a 2 by 2 cm2 area which is scanned using the OA imaging modality. (b) Photo of the pencil underdrawing before the application of the paint for the mock-up shown in (a). (c) OA image of the underdrawing. (d) Respective NIR image of the same region as in (c). Scalebar corresponds to 5 mm. (eh) Similar results for the case of an ultramarine blue mock-up. (il) Similar results for a mixed titanium white and ultramarine blue mock-up. (mp) Similar results for an ultramarine blue mock-up which is not covered with shellac varnish.
Photonics 11 00902 g003
Figure 4. OA and NIR imaging of painted gypsum mock-ups. (a) Photo of 5 by 5 cm2 region depicting a titanium white gypsum mock-up with no applied varnish. The red square indicates a 2.6 by 2.6 cm2 area which is scanned using the OA imaging modality. (b) Photo of the pencil underdrawing before the application of the paint for the mock-up shown in (a). (c) OA image of the underdrawing. (d) Respective NIR image of the same region as in (c). Scalebar corresponds to 5 mm. (eh) Similar results for an ultramarine blue mock-up. (il) Similar results for a mixed titanium white and ultramarine blue mock-up. In this case, the red square shown in (i) delineates an area of 3.2 by 3.2 cm2 corresponding to the OA scanning region.
Photonics 11 00902 g004
Figure 5. Investigation of potential alterations following the application and removal of the gelatin layer. (a) Photo of the titanium white gypsum mock-up covered with a thin gelatin layer. The red arrow shows one of the areas that was further inspected by means of digital microscopy. (b) Photo of the same mock-up directly after gelatin layer removal. (c) 2 by 2 mm2 digital microscopy image of the region indicated with the red arrow in (a) prior the gelatin application. (d) Digital microscopy image of the same region as in (c) directly after the gelatin layer removal. Scalebar is equal to 0.5 mm. (eh) Similar results for an ultramarine blue mock-up. (il) Similar results for a mixed titanium white and ultramarine blue mock-up.
Photonics 11 00902 g005
Figure 6. OA and NIR imaging of titanium white gypsum mock-ups with gradually increasing paint layer thickness. (a) Circular mock-up covered with 60 μm thick titanium white paint (5 by 5 cm2 region is shown). The red square indicates a 2 by 2 cm2 area which is subsequently imaged using both OA and NIR modalities. (b) Charcoal X-shaped sketch before the paint application. (c) OA image of the hidden “X” pattern. (d) Respective NIR image of the same region. Similar results are shown for gypsum mock-ups covered with 120 μm (eh), 180 μm (il) and finally 240 μm (mp) thick titanium white paint layers.
Photonics 11 00902 g006
Figure 7. SNR and imaging contrast quantification as a function of paint layer thickness. (a) Graph of OA image SNR versus paint layer thickness estimated from the data presented in Figure 6. Error bars represent the ± one standard error of the mean value out of the four measurements in the same image. The red curve corresponds to an exponential decay fitting of the data points (R2 = 0.990). (b) A graph of the Michelson contrast values for the OA and NIR images presented in Figure 5. Error bars represent the ± one standard error of the mean values out of the four measurements in the same image. The data have been similarly fitted with exponential decay functions (red and blue curves) with R2 > 0.994 in both cases.
Photonics 11 00902 g007
Disclaimer/Publisher’s Note: The statements, opinions and data contained in all publications are solely those of the individual author(s) and contributor(s) and not of MDPI and/or the editor(s). MDPI and/or the editor(s) disclaim responsibility for any injury to people or property resulting from any ideas, methods, instructions or products referred to in the content.

