Abstract
To guarantee the reliability of Tactile Internet (TI) applications such as telesurgery, which demand extremely high reliability and are experiencing rapid expansion, we propose a novel smart resilience mechanism for Next-Generation Ethernet Passive Optical Networks (NG-EPONs). Our architecture integrates Artificial Intelligence (AI) and Software-Defined Networking (SDN)-Enabled Broadband Access (SEBA) platform to proactively enhance network reliability and performance. By harnessing the AI’s capabilities, our system automatically detects and localizes fiber faults, establishing backup communication links using Radio Frequency over Glass (RFoG) to prevent service disruptions. This empowers NG-EPONs to maintain uninterrupted, high-quality network service even in the face of unexpected failures, meeting the stringent Quality-of-Service (QoS) requirements of critical TI applications. Our AI model, rigorously validated through 5-fold cross-validation, boasts an average accuracy of 81.49%, with a precision of 84.33%, recall of 78.18%, and F1-score of 81.00%, demonstrating its robust performance in fault detection and prediction. The AI model triggers immediate corrective actions through the SDN controller. Simulation results confirm the efficacy of our proposed mechanism in terms of delay, system throughputs and packet drop rate, and bandwidth waste, ultimately ensuring the delivery of high-quality network services.
1. Introduction
The need for digital technology has grown significantly since the COVID-19 pandemic. On the other hand, the development of new technology such as the Internet of Things (IoT), fifth-generation (5G) cellular networks and the boom in Artificial Intelligence (AI) have created a new demand for network connectivity. Attention is now focused on the next-generation near future applications of the Tactile Internet (TI) that need to support the latency-sensitive human-to-machine/robot (H2M/R) applications such as Extended Reality (XR), tele-surgery, industry automation, and intelligent transport systems [1]. Statista has predicted that the number of connected devices will be more than 30.9 billion units by 2025 [2]. This means that there will be significant challenges to the network operators to provide robust and guaranteed services to the users.
One of the future applications that will need ultra-low latency and robustness is the TI. The TI has some similarities with and distinctions from the IoT or 5G. The 5G cellular networks are focused more on improving Human-to-Human (H2H) communications, whereas the IoT is dependent on Machine-to-Machine (M2M) communications to facilitate industrial automation systems or machine-centric activities [3]. However, the TI requires a human-centered design approach due to the inherent Human-in-the-Loop (HITL) nature of H2M/R interaction, such as tele-surgery types of applications [4].
In [5], they determined the QoS key performance indicator of the TI use cases. For example, the tele-operation scenario should have a latency below 1–10 ms and a reliability of 99.999%. In terms of M2M applications, such as self-driving cars and industrial automation, the required latency is 5–10 ms [6] and reliability is 99.999% (an average of less than 6 min downtime per year) [7]. These indicators show that the underlying network not only guarantees minimum latency but also ensures that the system is robust enough to have minimum reliability requirements.
Currently, wired and wireless communications networks are rapidly evolving in terms of their architecture and capabilities to challenge latency-sensitive H2M/R applications. In wired networks, especially optical fiber, Passive Optical Networks (PONs) have continually evolved over the years. PONs now offer bandwidth capacity and functionality, delivering low-latency, high-bandwidth, and cost-efficient services to large numbers of users. Moreover, most urban areas near residential and industrial premises have now deployed optical fiber [8].
Ethernet Passive Optical Network (EPON) technology is among the best PON technologies due to its lower cost, high bandwidth, and readiness to support efficient Quality-of-Services (QoS). The current standard of EPON is the IEEE 802.3ca, which was approved in 2020 as the next-generation EPON (NG-EPON), boosting the bandwidth of a single channel by a factor of 5 to 25 Gbps [9]. Moreover, the NG-EPON can have higher data rates by using channel bonding that can offer aggregated data rates of Nx25s Gbps. Consequently, a fully operating NG-EPON may deliver up to 50 Gbps for both upstream and downstream transmission [10]. Nevertheless, managing an NG-EPON that can handle the strict QoS from residential or industrial users is challenging. Industrial users usually have stringent QoS requirements, one of which is maintenance service [11]. This service includes ensuring that the network is fault-tolerant against any fiber fault. Any fiber cut or loss can significantly impact industrial systems, especially in terms of TI or H2M/R applications, which can involve life-and-death situations.
In general, different types of anomalies can affect the performance of NG-EPON. Some fiber failures can occur due to mechanical faults, optical faults, or electrical faults. Since a single fiber link can connect to the residential, industrial, or enterprise networks, carrying a mixture of data from personal to public or even 911 or TI data, any fiber failures can have enormous impacts and need to be responded to immediately [12]. Moreover, failure in optical network communication can be categorized as soft or minor failures and severe failures. Severe failures lead to immediate service loss due to fiber cuts, bends, and other problems. Minor failures can degrade the transmission quality due to signal overlap, laser deflection, filter switching, noise, and other problems [13]. Therefore, the network operators must ensure reliable data communication for high-speed Internet. Failures to handle this can lead to significant financial and data loss for both network operators and customers. At the same time, the network operators also need to reduce the operation and maintenance expenses (OPEX).
According to the Federal Communication Commission (FCC), more than one-third of fiber disruptions are caused by fiber-cable problems [14]. These issues can include failures of connectors or power supplies, fiber breaks, macro bends, or even problems with Optical Line Terminal (OLT) or Optical Network Unit (ONU) transceiver problems. Consequently, a remote and automatic monitoring or diagnosing mechanism for the fiber links would be very beneficial to reduce the mean time to repair (MTTR), increasing customer satisfaction.
The main contribution of this paper is as follows:
- We propose a smart resilience mechanism architecture and operations in Next-Generation Ethernet Passive Optical Network (NG-EPON).
- We introduce a novel Resilience Dynamic Bandwidth Allocation (RDBA) mechanism, ensuring the Quality-of-Services (QoS) of real-time and tactile internet applications.
- We build a supervised AI model using Multi-Layer Perceptron (MLP) for detecting any anomalies or faults in the branches.
- The extensive simulation results demonstrate that the resilience of AI-enhanced anomaly and fault detection effectively manages delay for real-time and tactile internet applications.
The remainder of this paper is organized as follows. Related work is presented in Section 2. The SDN-Enabled Broadband Access (SEBA) architecture is discussed in Section 3. Section 4 introduces the proposed smart resilience architecture. Section 5 presents the performance evaluation. Finally, Section 6 concludes our work.
2. Related Work
The objective of fiber monitoring is to detect any anomalies in the optical layer by analyzing the monitoring data. Several techniques are commonly used by engineers to identify fiber faults in Optical Distribution Networks (ODNs). For instance, one study [14] uses a Reference Reflector (RR) placed at the end of each fiber on the ODN and uses Optical Time-Domain Reflectometry (OTDR) to detect, locate, and estimate the reflectance of the connections and mechanical splices in the fiber links. Another approach uses binary-coded Fiber Bragg Granting (FBG) [11]. The FBG binary codes serve as indicators between one ONU to other ONUs by varying the wavelengths used by the FBGs to easily identify fault branches [11]. Some early studies have also proposed embedded OTDR called miniaturized OTDR integrated into the ONUs [15,16,17,18].
Furthermore, to consistently meet the Service Level Agreement (SLA), network operators need a mechanism to maintain service continuity even when there are fiber faults in the ODN. In EPON, network operators usually use protection mechanisms such as trunk protection or tree protection. Trunk protection primarily focuses on protecting the OLT and feeder fiber. In contrast, tree protection covers the entire area but is very costly. Dedicated protection might deliver more reliability for service continuity but cannot provide efficient resource utilization [19]. Several studies have shown the use of ring topology to minimize the cost of establishing redundant paths in traditional EPON while handling any fiber cut or failures within the network [20,21,22]. Apart from all the various approaches such as tree, trunk, star, ring, or bus protection mechanisms, some studies also used hybrid topologies that improve EPON network redundancy but increase the network complexity [23]. Moreover, some studies also use SDN capability and a bus protection line to enhance the resilience of the existing EPON system [24].
Recently, Artificial Intelligence (AI) entities have been able to perform operations analogous to human activities, such as learning and decision-making. AI-based techniques are already changing and improving industries, including telecommunications networks. These techniques range from performance monitoring and guaranteeing the transmission to optical network control and management in both transport and access networks [25]. Current studies related to fiber monitoring already use the Machine Learning (ML) approach to detect any anomaly in the optical networks [12,14,26,27]. These studies have shown that ML can detect and localize any fiber faults in the ODN. Although these studies have already proposed AI monitoring mechanisms, to the best of our knowledge, no studies have focused on integrated resilience that not only intelligently localizes any fiber faults in the ODN but also automatically recovers the network using AI mechanisms. Moreover, most studies only proposed the ML model without any simulation or experiment on the working PON systems. Table 1 presents a table of related work contributions.

Table 1.
Related work contributions.
To realize this, our proposed architecture uses AI-enabled unified platforms to automate and adapt to changing circumstances and business needs. As Cisco’s 2024 Global Networking Trends Report stated, in the next two years, network operators will use AI-enabled unified platforms to automate and adapt to changing circumstances and business needs [28]. SDN-Enabled Broadband Access (SEBA) is a unified cloud-native platform, providing scalable and flexible network management. SEBA is based on Software-Defined-Networking (SDN) principles, offering simpler, flexible, and easily customizable networks. Moreover, SEBA promotes interoperability between OLTs and ONUs from different manufacturers. SEBA is open-source, giving operators unprecedented flexibility in customizing SEBA for their access network, integrating it with the rest of their backend systems, implementing only the features they require, adding application programming interfaces (APIs) themselves, and not being bound by the timelines and prices of a traditional vendor [29].
Network Fault Detection and Localization
Commonly, to detect anomalies in the ODN, engineers are using OTDR, which is a technique based on the Rayleigh backscattering [12]. The concept is like a radar, so the OTDR will send a series of optical pulses into the ODN. Afterward, the backscattered signals will be recorded as a function of time that can be translated to the position of the optical fiber components such as the splitter, ONUs, and end connectors. This information is used for event analysis. Figure 1 illustrates the example of OTDR trace.
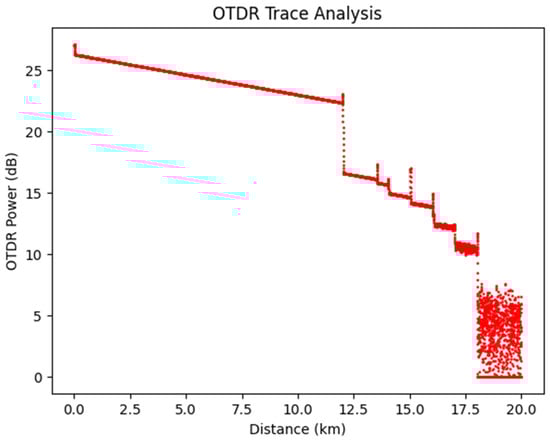
Figure 1.
Example of OTDR traces.
As shown in Figure 1, we can see that the initial drop at the beginning of the figure represents the launch condition level of around 25 dB. Afterward, the downward-sloped line indicates the attenuation of the fiber (feeder fiber). At the end of the linear attenuation, a small peak signifies the splitter, connectors, ONUs, or other reflective events. The dense scattering at the end marks the termination of the fiber.
OTDR traces are usually difficult to interpret even for experienced engineers due to the noise that affects the signals. Analyzing these traces may be very challenging using conventional methods, especially to distinguish subscribers unambiguously [30]. It can be very time-consuming, since the engineer needs to remove the noise manually, which can increase the MTTR and reduce the detection and localization accuracy. One of the strategies to effectively manage and interpret the OTDR traces is for network operators to use baseline measurements, saving the measurements when the network is functioning normally. In this way, network operators create a reference point for future comparisons if faults occur in the ODN. Moreover, maintaining and organizing a database of reference points for all OTDR traces can help with quick retrieval and analysis during troubleshooting. Additionally, network operators must ensure that the network engineers are well-trained in interpreting OTDR traces and using the tools by conducting regular training sessions to stay updated. All these combined techniques still depend on the network engineers.
Furthermore, before any fault occurs in the ODN, some anomalies can also appear in the network condition. Network operators can use various visualization tools such as a Bit Error Rate (BER) analyzer, Optical Time Domain Visualizer, and Optical Spectrum Analyzer. These tools can show the performance of optical signal delivery. An eye diagram is used to measure the signal quality. Ideally, an eye diagram would consist of two parallel lines with instantaneous rise and fall times, making them virtually invisible. The eye diagram can show vital parameters such as timing jitter and inter-symbol interference [31]. Combining both OTDR trace analysis and the eye diagram can improve the early detection of faults in the ODN.
Consequently, in this paper, we propose automatic detection and localization using an ML algorithm by incorporating OTDR trace analysis data and eye diagram analyzer data. By incorporating ML algorithms, we can improve the accuracy and efficiency of detecting and localizing fiber faults. ML can process vast amounts of data, identifying patterns and detecting anomalies much faster with greater precision than network engineers. By leveraging ML, network operators can reduce their reliance on network engineers for fault detection and localization, leading to quicker resolutions and increased network reliability (as illustrated in the proposed Smart Resilience Architecture in “Figure 4”).
3. SEBA Architecture
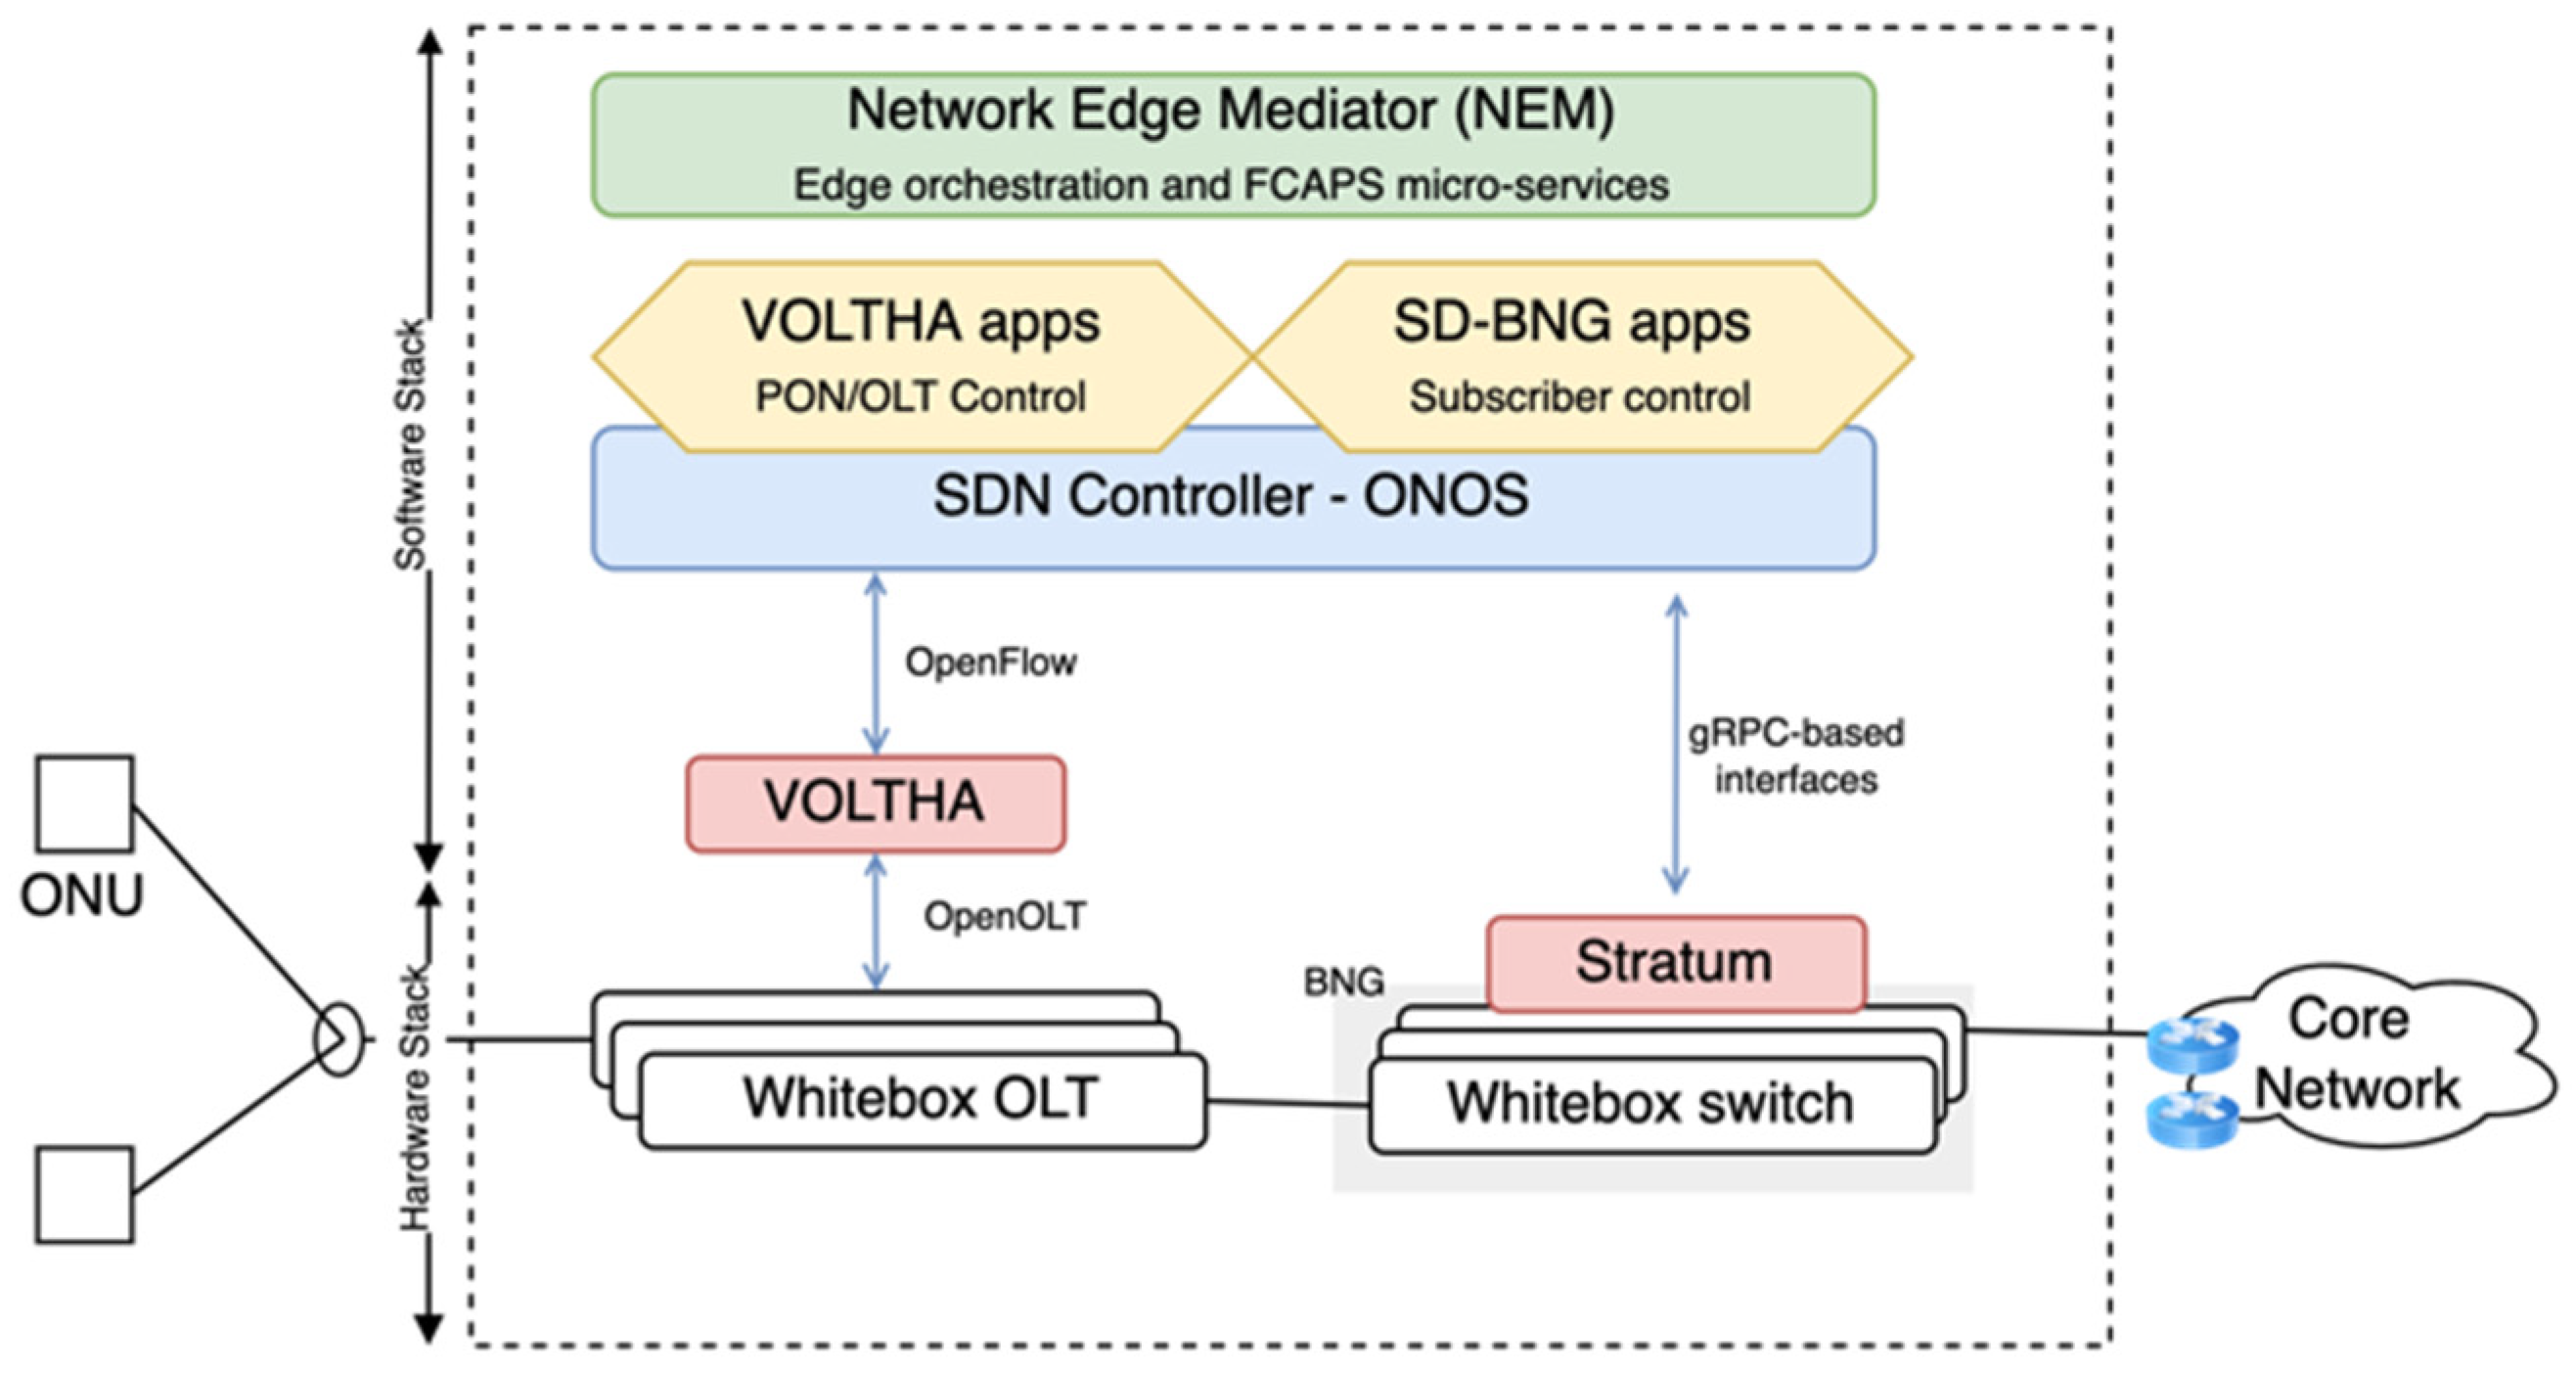
This section discusses the concept of SEBA architecture, shown in Figure 2, which consists of Virtual OLT Hardware Abstraction (VOLTHA), a Network Edge Mediator (NEM), and an SDN Controller.

Figure 2.
Generic SEBA architecture.
3.1. Virtual OLT Hardware Abstraction (VOLTHA)
In the central office, the white-box OLT will be used, incorporating Virtual OLT Hardware Abstraction (VOLTHA), allowing the Virtual OLT (vOLT) to be managed by the Software-Defined Networking (SDN) controller, i.e., Open Network Operating System (ONOS). The vOLT can have NetConf, OpenFlow Agent, OLT Application Programming Interface (API), and ONU Management and Control Interface (OMCI) stack-connected to the ONOS SDN controller. VOLTHA hides PON-level details from the SDN controller and abstracts each PON as a pseudo-Ethernet switch easily programmed by the SDN controller.
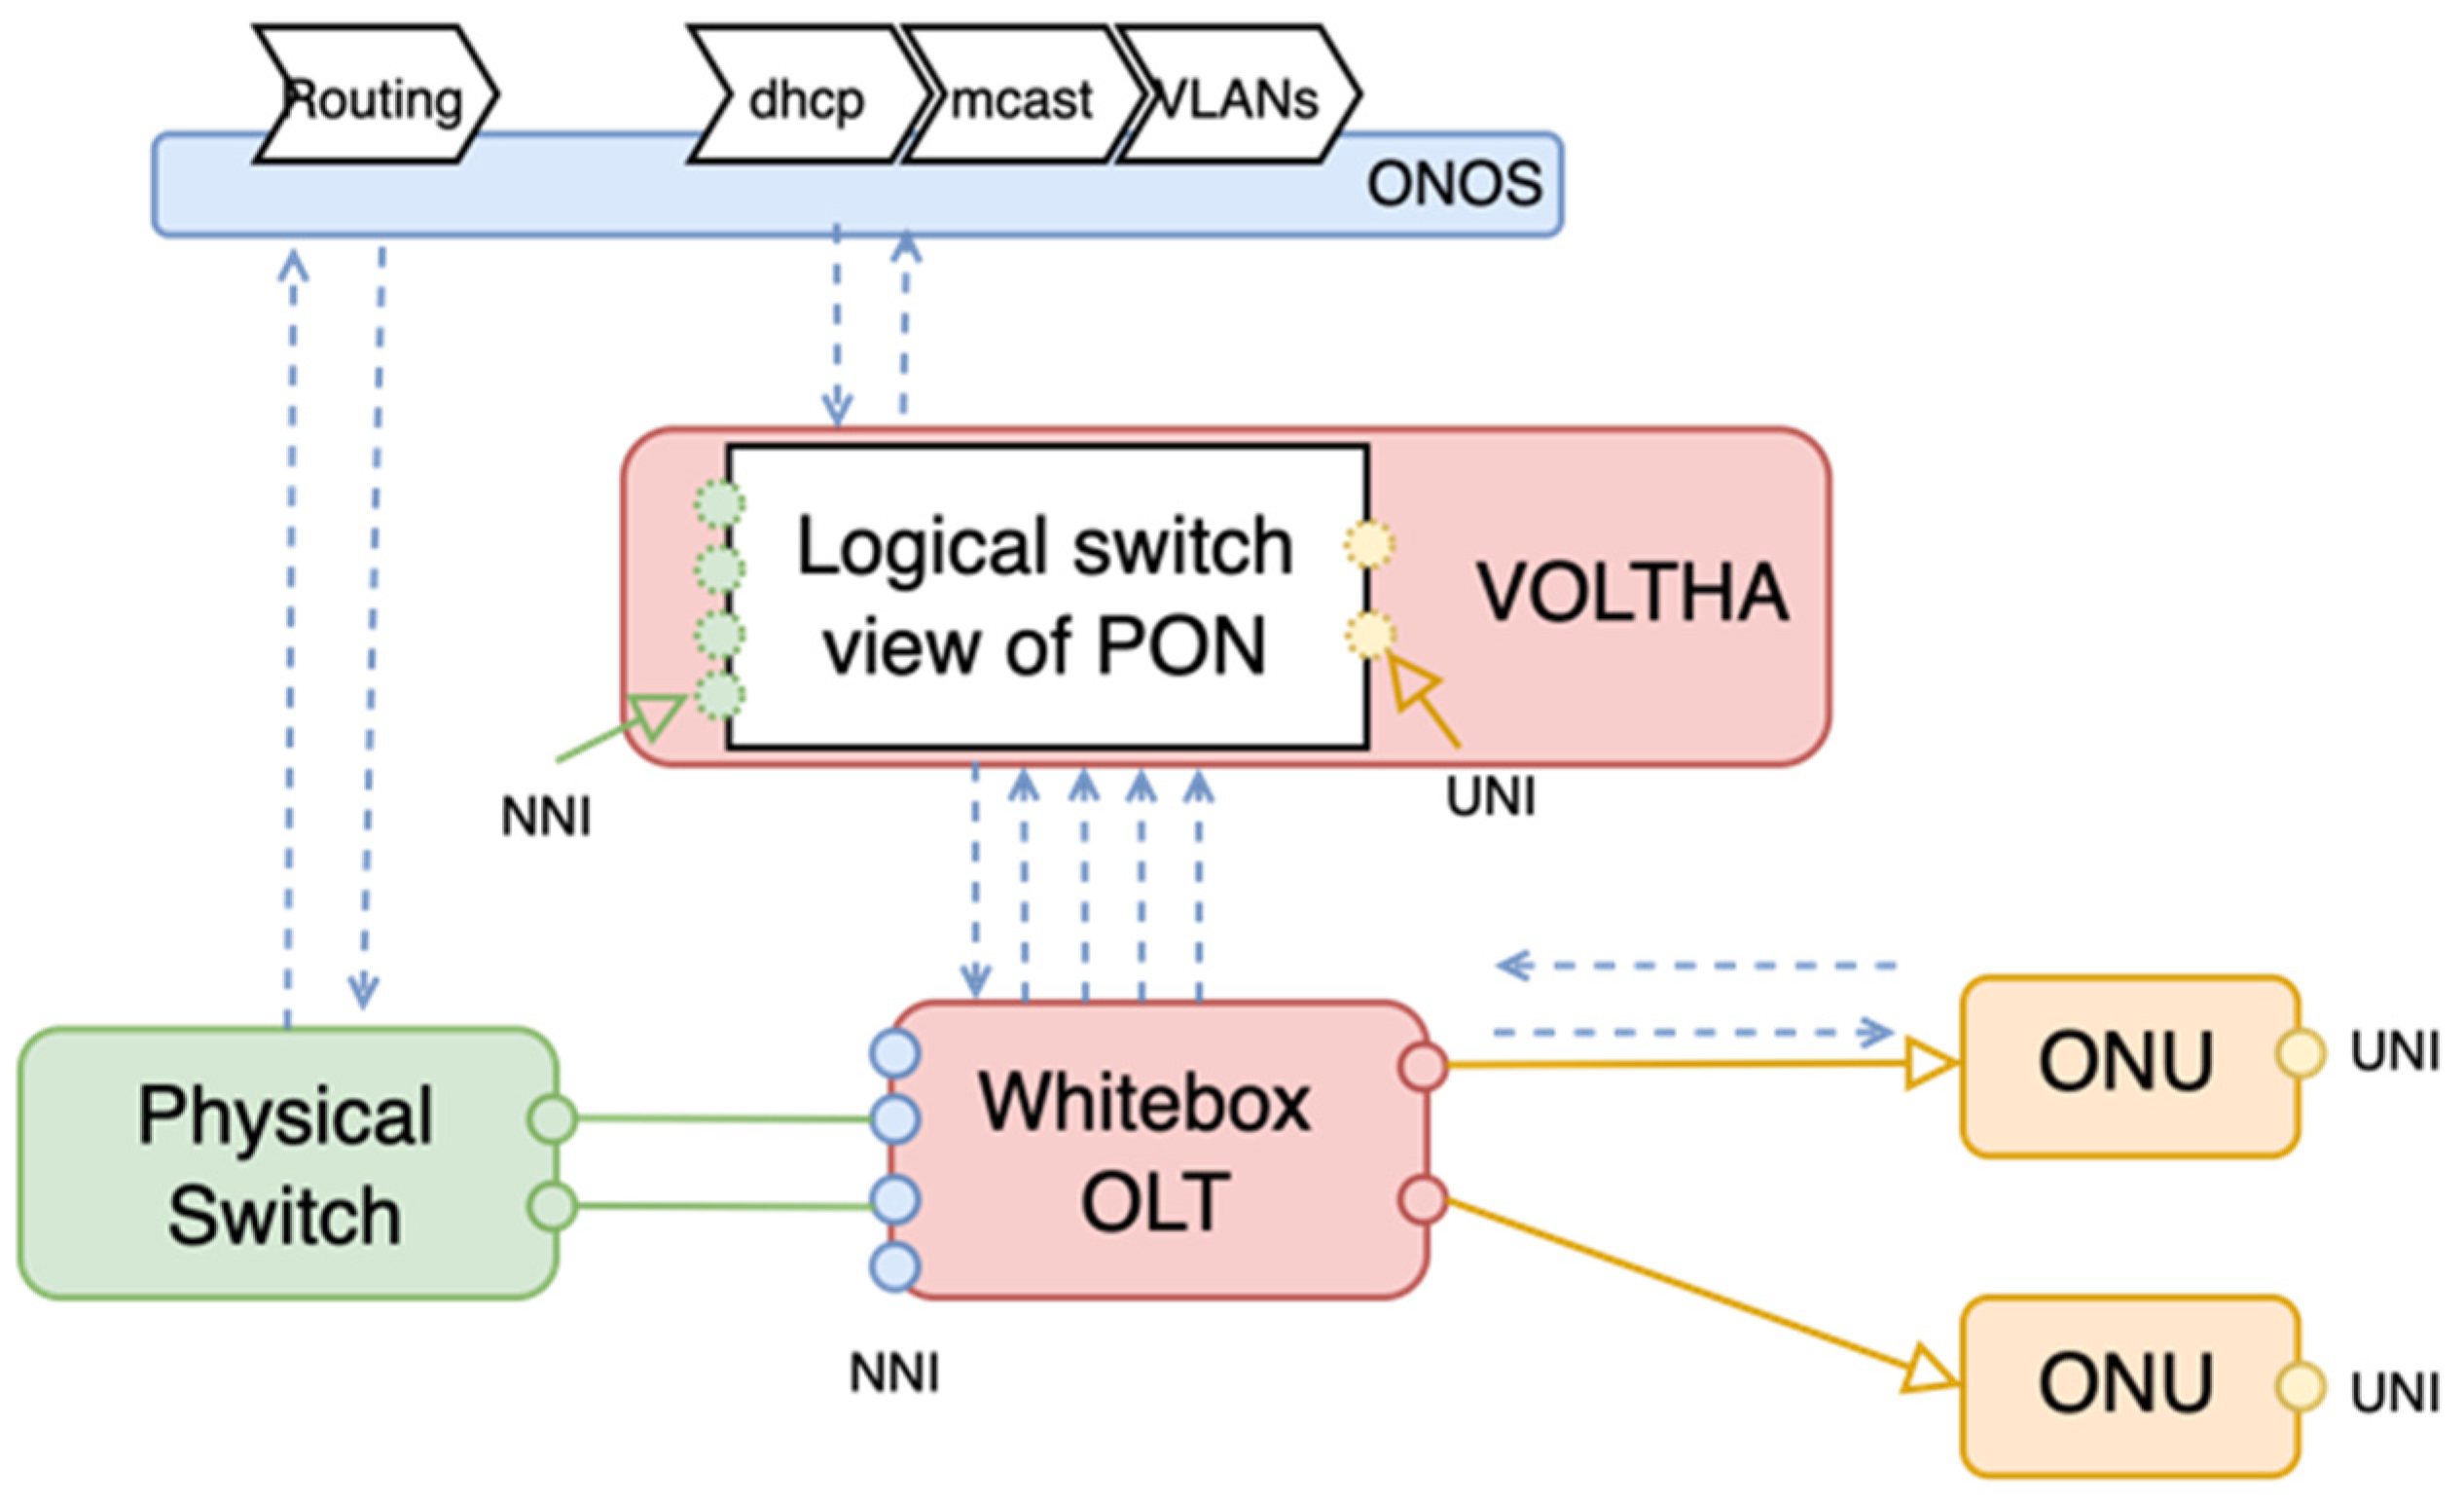
Figure 3 illustrates the operation architecture of VOLTHA. The process begins with VOLTHA activating the OLT, which has Network-to-Network Interface (NNI) ports on one side and PON ports on the other. Once activated, VOLTHA abstracts the OLT, including the connected NNI port, which is connected to a logical switch within VOLTHA. VOLTHA then informs ONOS of the existence of this logical switch. The ONUs are attached to the OLT through its PON ports, and the User Network Interface (UNI) port at the ONU is also added to the logical switch within VOLTHA. As an example, the Edgecore ASFvOLT16 White box OLT, which is used in industrial settings, supports [32]. Other vendors, such as CIG, Tellabs, and Iskratel offer similar OLT solutions.
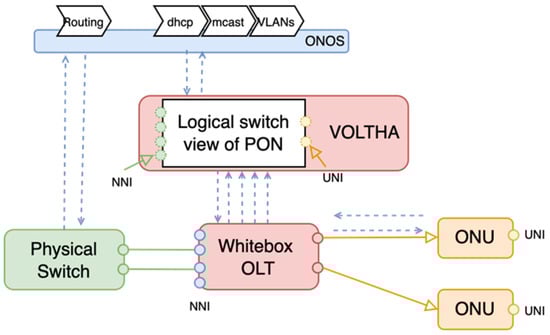
Figure 3.
VOLTHA operation architecture.
3.2. Network Edge Mediator
The Network Edge Mediator (NEM) acts as the mediation layer between the access system and the service provider’s back end, providing centralized management and orchestration capabilities. The NEM supports essential functionalities known as fault, configuration, accounting, performance, and security (FCAPS): (1) Fault management: detecting and resolving network faults; (2) Configuration: managing network element settings; (3) Accounting: collecting usage data for billing and auditing; (4) Performance: monitoring and analyzing network metrics to ensure service quality; and (5) Security: enforcing policies to protect network integrity. This ensures that the NEM facilitates seamless network control, configuration backup, and restoration [33].
4. Proposed Architecture
This section discusses the proposed smart resilience architecture that not only can detect and localize fiber faults but also automatically establish connections while waiting for the engineer to fix the fiber faults in the ODN. In this architecture, we use the SEBA for Residential Services Central Office Rearchitected as Datacenter (R-CORD) platform concept, which sits in the middle and provides management and abstraction solutions, enabling the use of white box hardware. White box hardware reduces both Capital expenditures (CAPEX) and Operation & Maintenance expenses (OPEX). In this way, we separate the software from the hardware, enhancing the agility that brings the best of the cloud Network Function Virtualization (NFV) and SDN together. The OLT and ONUs used in the proposed architecture are white box hardware, providing a highly flexible and cost-effective solution. The white box devices feature hardware platforms that can run third-party software, such as VOLTHA, which offers open programmability and interoperability.
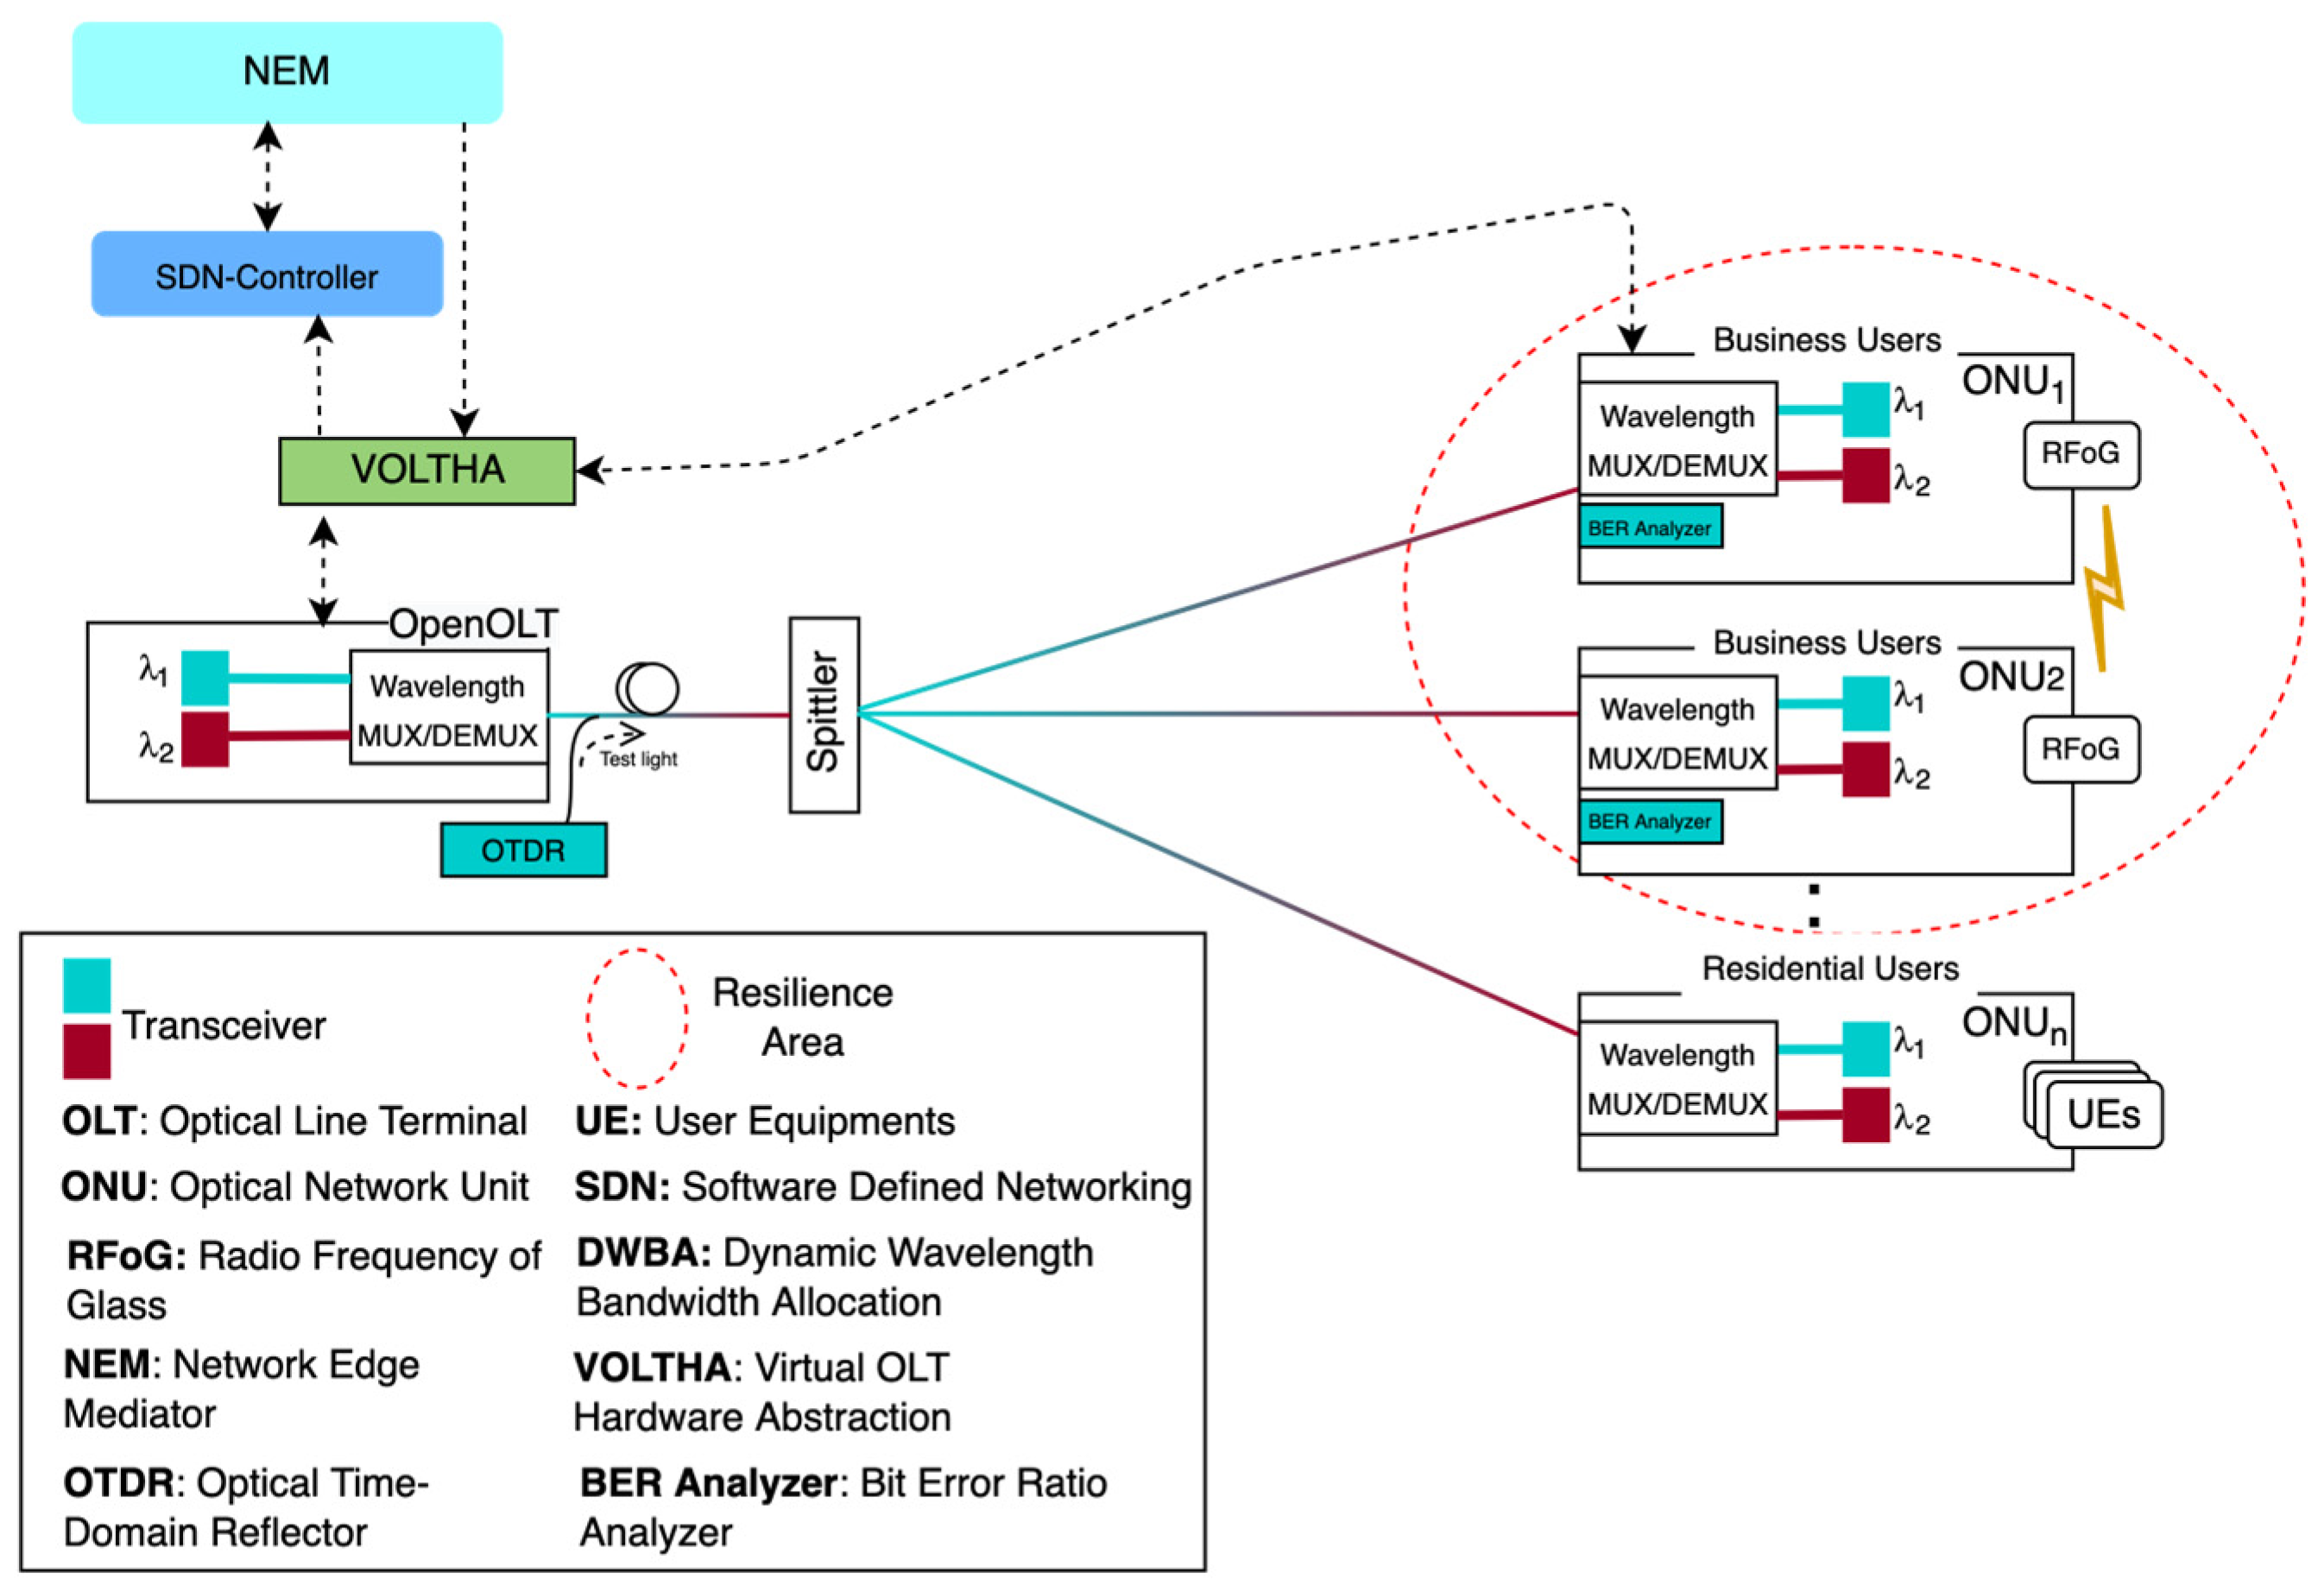
Figure 4 shows the smart resilience architecture in NG-EPON. In the north part, the OLT is connected to VOLTHA, an SDN controller such as the ONOS and NEM. These components incorporate one another using APIs and Remote Procedure Calls (gRPC) to provide seamless communication between VOLTHA, SDN controllers, and the NEM. As already mentioned, VOLTHA will activate the OLT and add to its logical switch. Moreover, the ONUs will also be added to the logical switch by VOLTHA. The SDN controllers provide centralized control and management for dynamic traffic steering, automatic failover, and real-time network adjustment. The OTDR, located at the central office, detects and localizes fiber faults, while the BER analyzer at the business users’ side captures eye diagrams to detect anomalies. Furthermore, in the south part, the users are categorized into two different groups: business users and residential users. Usually, business users have very strict SLAs and requirements. Therefore, as shown in the figure, business users such as ONU1 and ONU2 have the resilience area (indicated by the red dashed circle) which will be covered with the Radio Frequency over Glass (RFoG). The RFoG serves as a critical backup mechanism for business users in the event of a fiber fault. The RFoG allows RF signals to be transmitted over fiber optic cables, maintaining compatibility while providing the benefits of fiber optics, such as higher bandwidth and lower latency. In the proposed architecture, RFoG is activated as a secondary communication path when the primary fiber link experiences a fault or anomaly. The failover process is handled automatically by the ONU and the SDN controller, ensuring that the RFoG backup link is ready to carry traffic when needed. This mechanism will maintain continuous service, minimize downtime, and enhance overall network resilience.
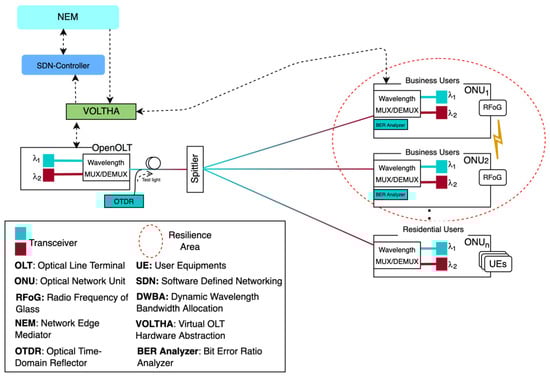
Figure 4.
The smart resilience architecture in NG-EPON.
In normal conditions, ONUs send/receive data using the primary optical path (λ1, λ2). The SDN controller monitors the network performance such as Bit Error Rate (BER) and OTDR trace analysis. Network operators oversee the network using a centralized platform, i.e., the NEM, which provides dashboards, alerts, and reports for network operators. In our proposed architecture, edge computing is realized in the NEM. This integration edge computing is to receive incoming data in real-time, identify any potential issues, and perform real-time analysis and alerts. Edge computing within the NEM can be implemented using high-performance servers equipped with GPUs for accelerated AI processing. Typically, Kafka is used to stream the collected data (telemetry data) from the NEM to the edge computing device. One study [34] has shown that a Kafka-based framework is highly scalable and can support up to around 4000 messages per second with low CPU load and achieve an end-to-end latency of about 50 ms. The AI model deployed at the edge can detect anomalies in the network, predicting a variety of faults such as fiber cuts, partial fiber degradation, fiber bending, and faulty splitters. When anomalies are detected, the NEM communicates with the SDN controller to take corrective actions based on the AI predictions, such as activating backup conditions.
When faults or degradations occur in the ODN, including fiber cuts, fiber bending, and faulty splitters, the AI model identifies these anomalies and initiates a backup-mode plan. The OLT and ONU are notified via the NEM, and the OTDR is used to localize the fault within the network of the branches. When the ONU activates the backup mode, the RFoG becomes activated and ready to send the data to the nearest ONU (backup ONU) within its coverage. Simultaneously, the SDN controller updates the network configuration to handle the failover scenario. For instance, if partial fiber degradation is detected, the SDN controller may initially attempt to reroute traffic within the primary path. In the event of a complete fiber cut to ONU1, the ONU1 and SDN controller trigger the RFoG backup mechanism, routing data through ONU2. This multi-layered approach ensures robustness against various types of failures.
Since there is no direct connection link between the affected ONU and OLT, a mechanism must be used so that the nearest ONU (backup ONU) can differentiate the incoming data from the OLT and send it to the affected ONU via RFoG. Similarly, the OLT needs to know that the data comes from the affected ONU. This can be achieved using data tagging such as a virtual local area network (VLAN).
In the proposed architecture, the VLAN tag table is established in the OLT and ONUs. This table can be changed over time and updated using the SDN controller, which dynamically updates the VLAN tag table and configurations based on network changes and faults. This ensures that the OLT and ONUs will map VLAN tags to their respective destinations. Table 2 shows an example of the VLAN tag table.
Table 2.
VLAN Tag Example.
4.1. Intelligence Fault Detection and Localization with Intelligence Diagnosis
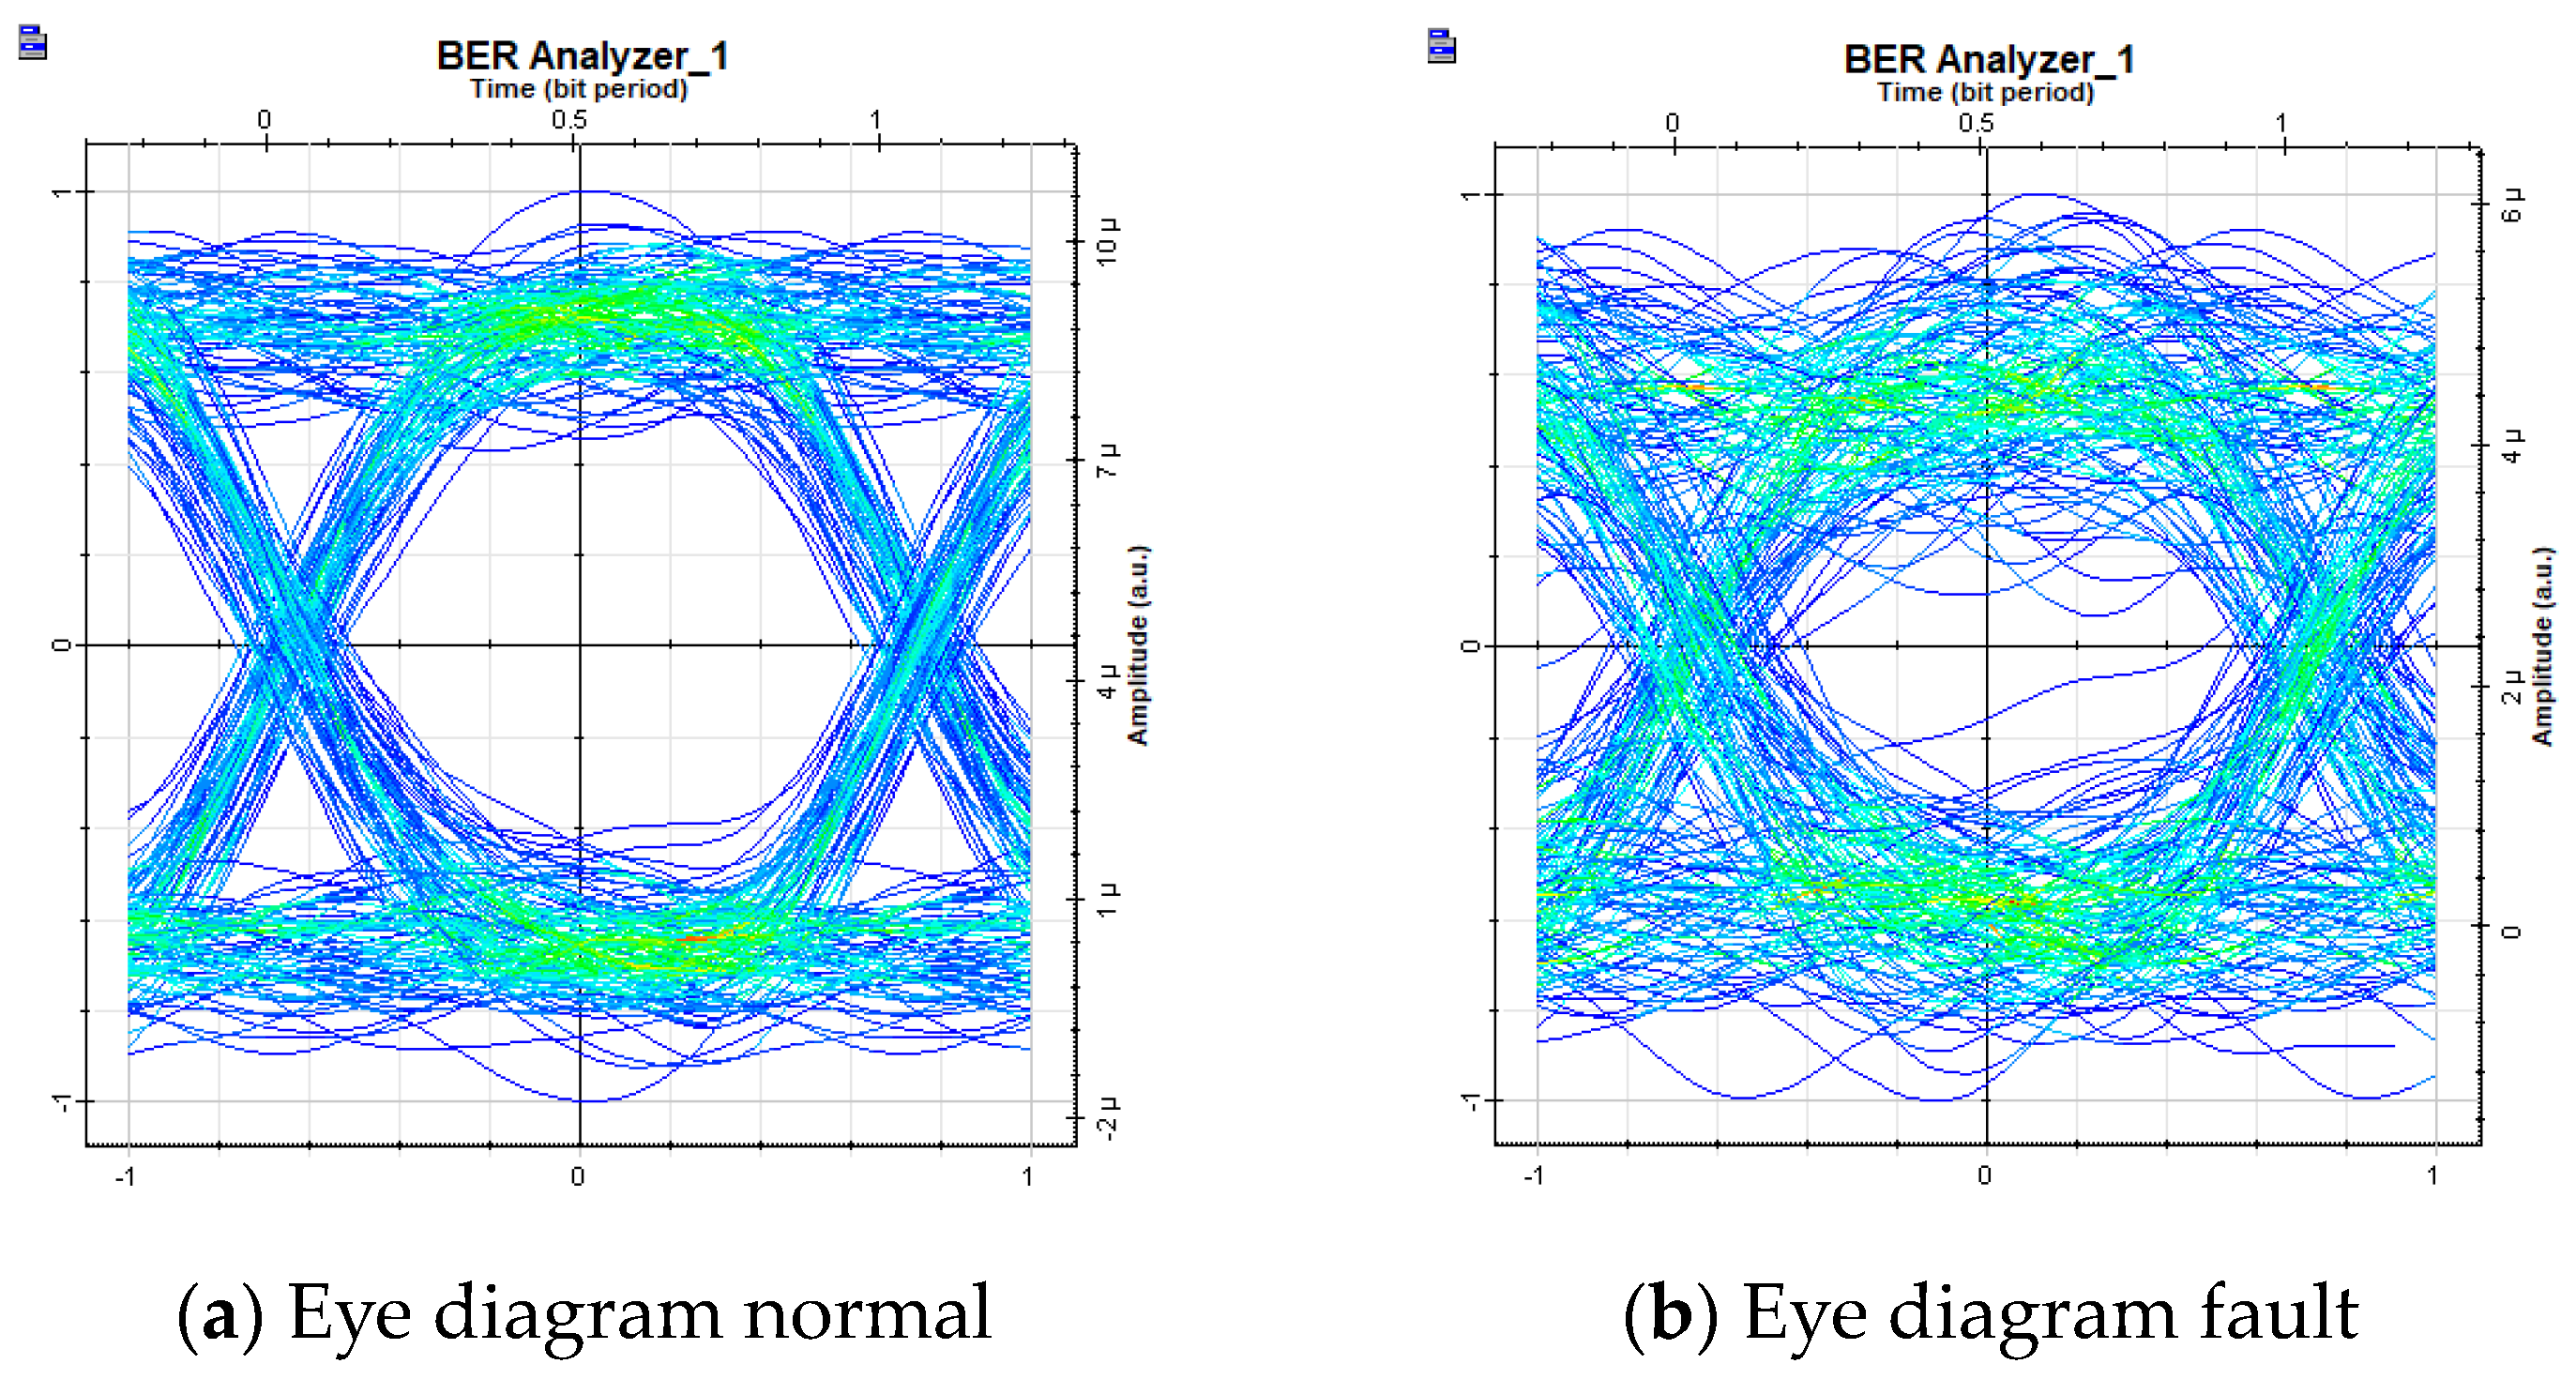
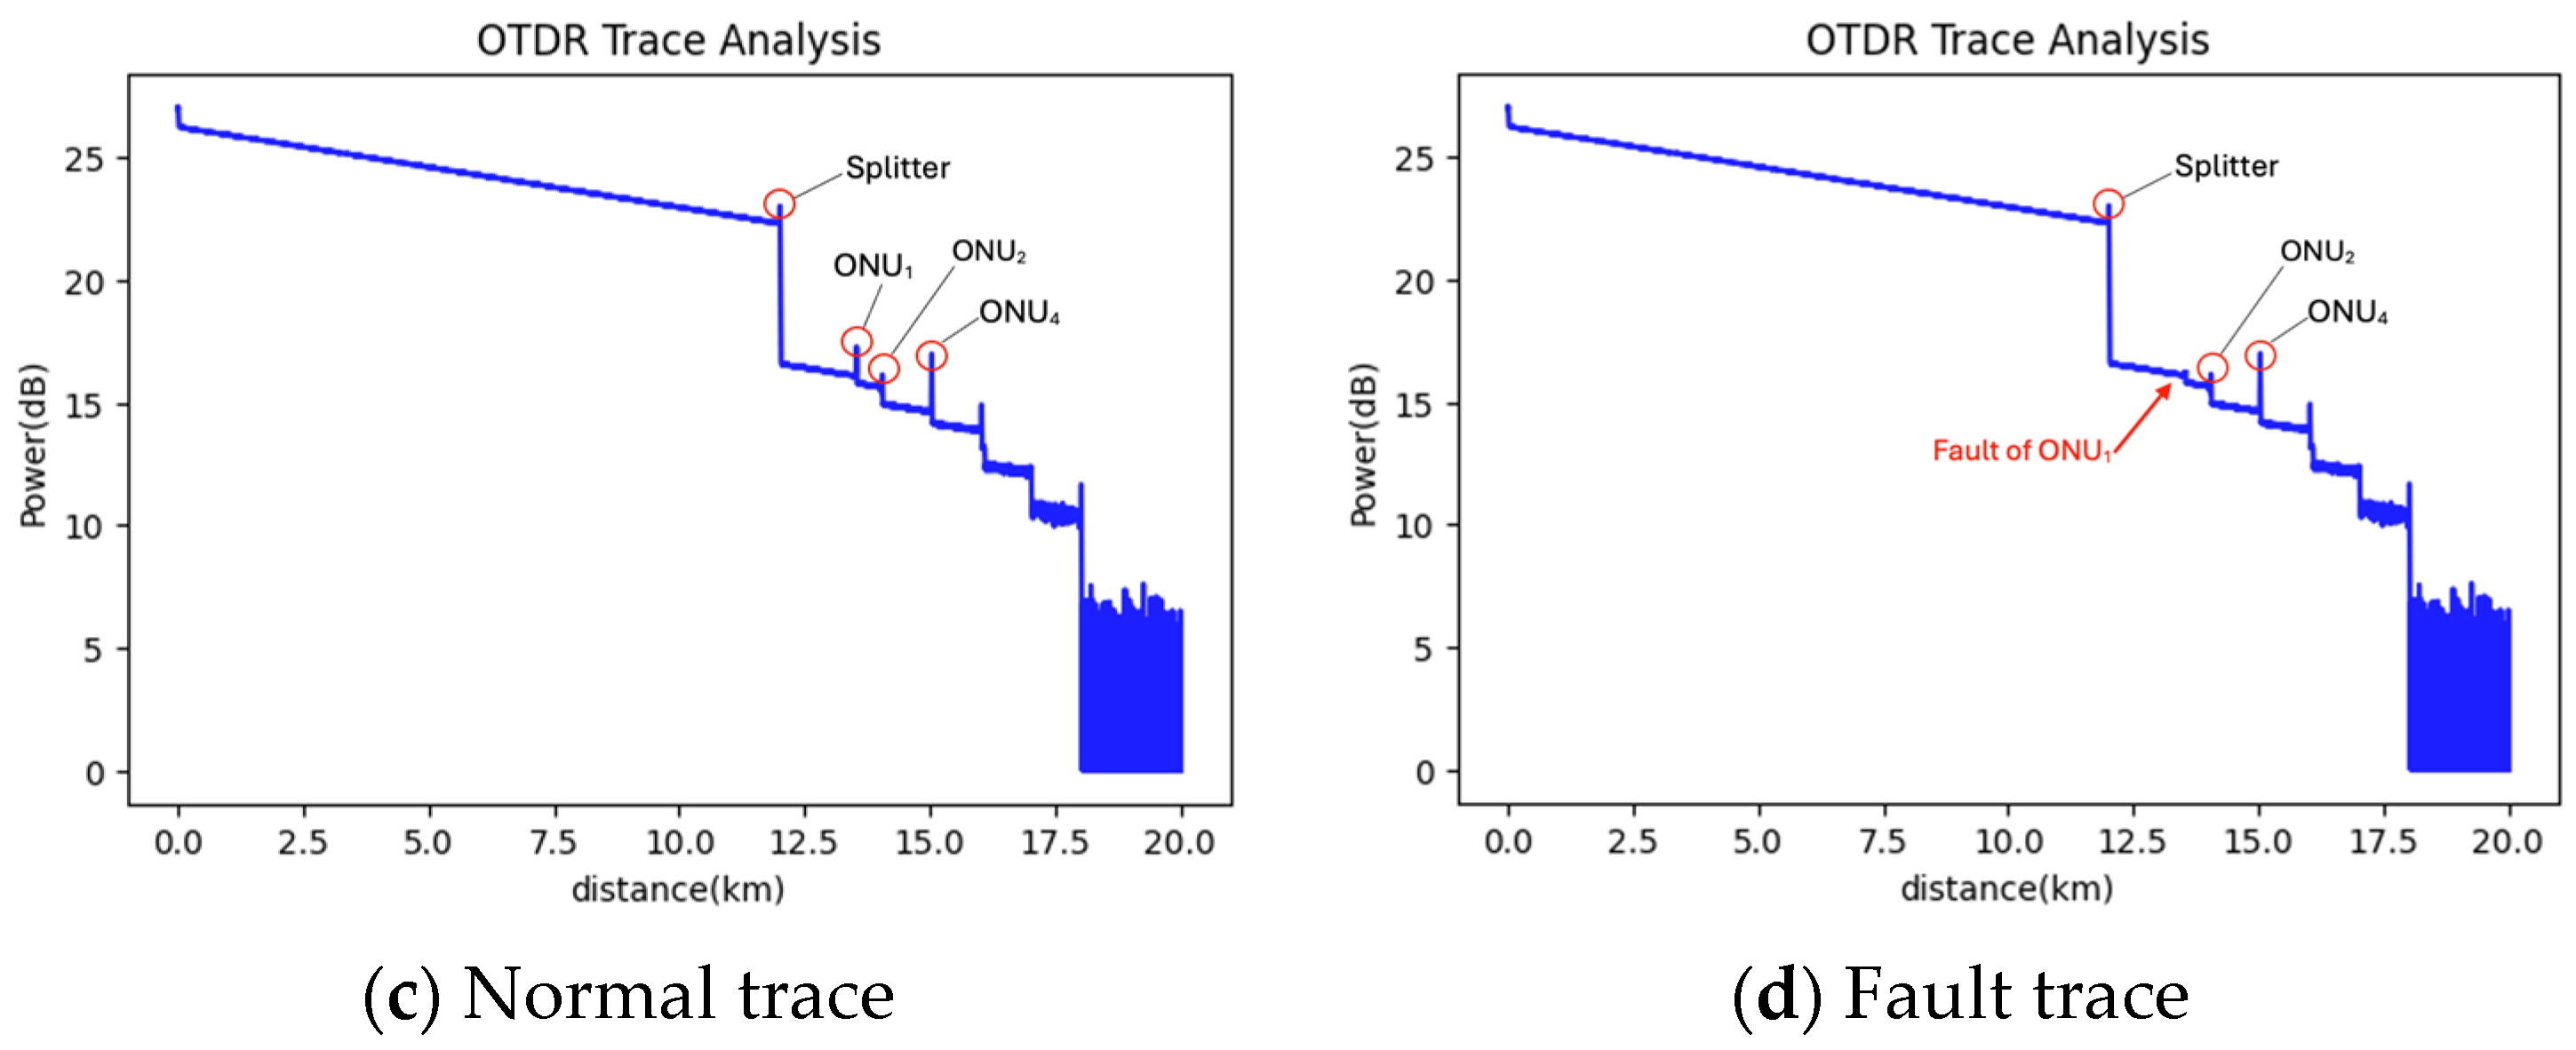
As mentioned before, this paper focuses on fault detection and localization through OTDR trace analysis and the eye diagram evaluation. Figure 5 illustrates the comparison between normal and fault conditions from these perspectives. Figure 5a shows a clear eye opening, indicating minimal noise, jitter, and distortion. In contrast, Figure 5b depicts a situation with anomalies. When there are anomalies in noise, jitter, or distortion, the eye diagram shows that the eye opening is reduced vertically and horizontally, distorting the eye shape, which indicates a very high level of noise, higher jitter, and potential issues with the transmission channel. Figure 5c shows the power attenuation for different ONUs located at different distances in a normal trace event, while Figure 5d highlights the scenario where ONU1 experiences a fiber fault. The OTDR trace results for ONU1 show a loss, with no peak detected, indicating the presence of a fault. Typically, both the OTDR trace analysis and eye diagram are tested against a predefined mask. Any violation of these masks can indicate potential fiber faults within the ODN.
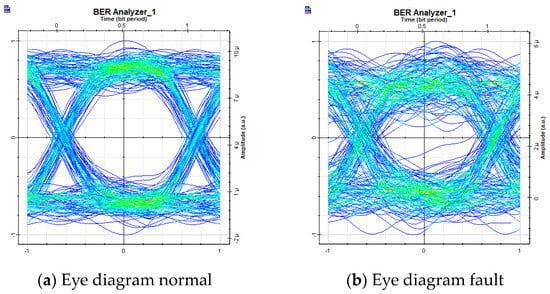
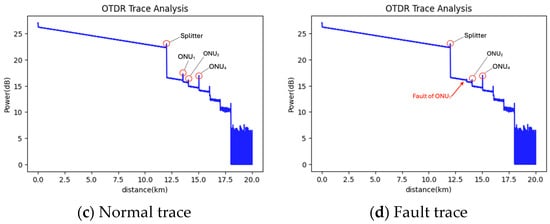
Figure 5.
Comparison of normal vs. fault condition.
Consequently, in our proposed fault detection and localization approach, we use eye diagrams to complement the OTDR in identifying subtle degradation in signal quality, since OTDR alone only detects severe faults such as fiber cuts. The proposed ML model uses this combination of eye diagram and OTDR data to enhance the accuracy of prediction and localization. This leads to improved accuracy and efficiency, especially in identifying minor or soft faults that would not be captured by OTDR alone.
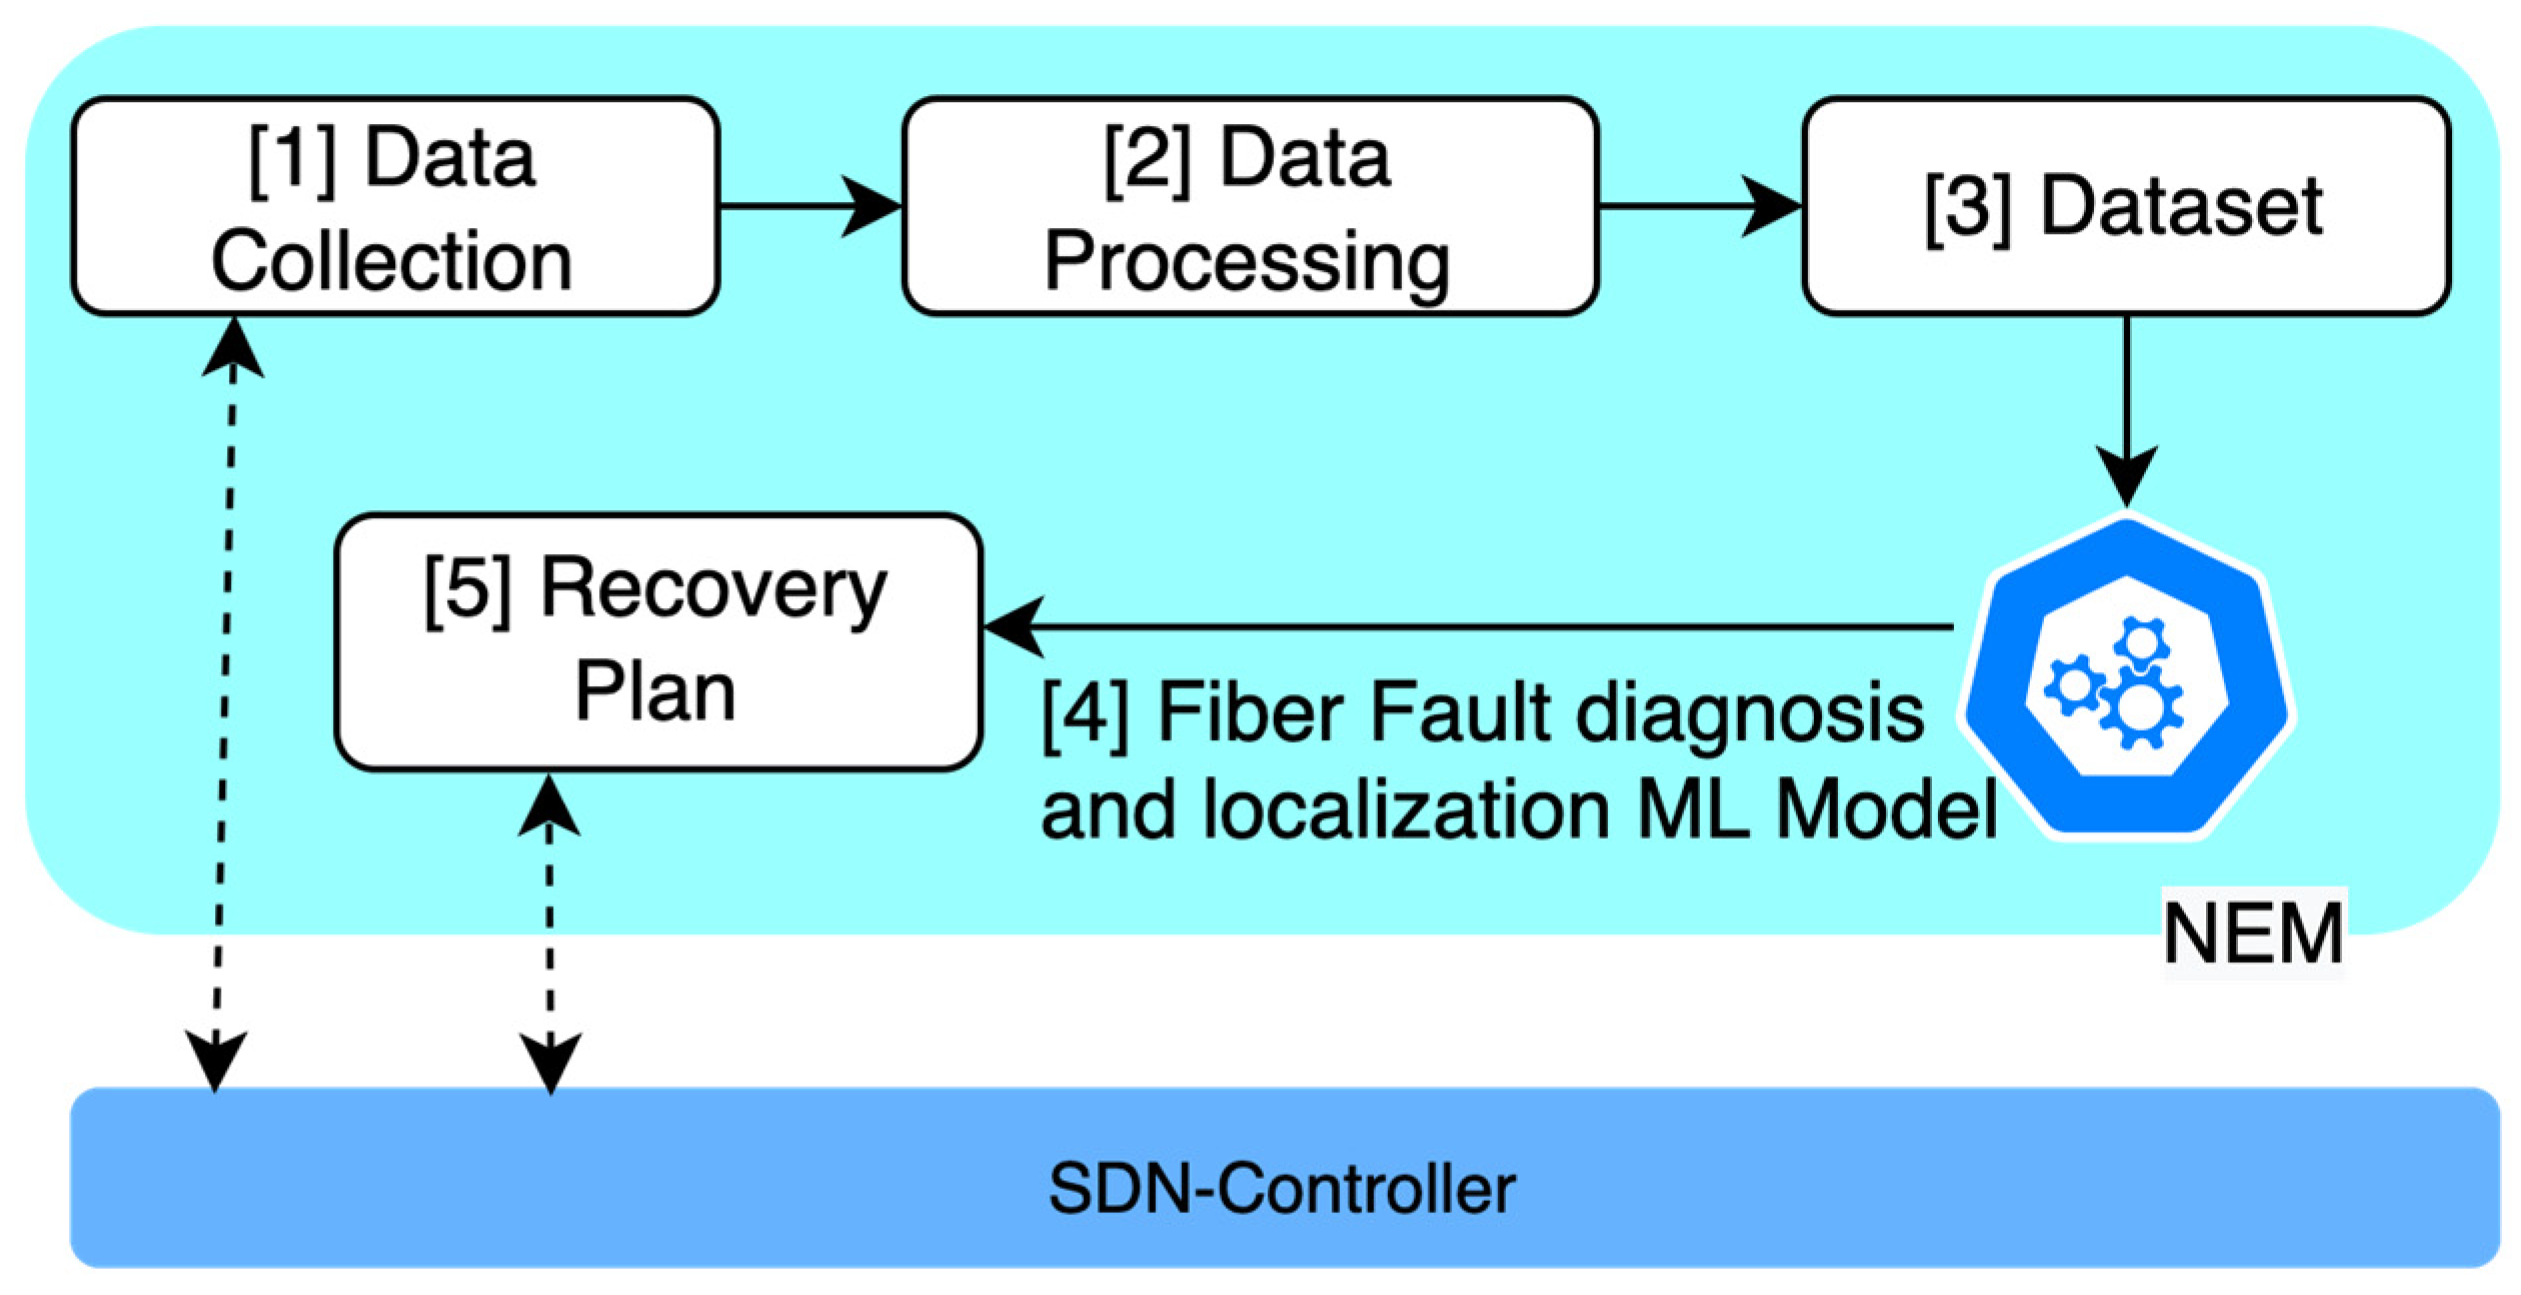
The proposed framework for fault detection and localization with intelligent diagnosis is shown in Figure 6, following the study in [12]. There are five main stages to realize the proposed framework, namely, (1) Data collection: The deployed ODN infrastructure is periodically monitored using OTDR and BER Analyzer. The generated OTDR traces and the eye diagram data are sent to the SDN controller; (2) Data processing: The collected data is pre-processed to normalize and standardize the features to a similar scale; (3) Anomaly detection: The processed data are compiled into a dataset, which is then used to train and evaluate a machine learning model designed to detect anomalies in the network; (4) Fiber fault diagnosis and localization ML model; (5) Mitigation and recovery from fiber failures plan: The plan will be formulated to address and fix the detected faults. Alerts are generated to notify engineers and customers of the issues. The SDN controller facilitates dynamic management and control of the network based on the machine learning model outputs.
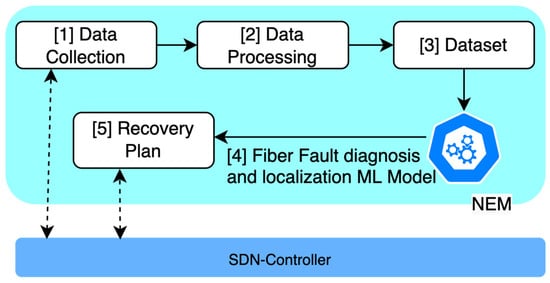
Figure 6.
Proposed framework for fault detection and localization.
4.2. Simulation-Based Evaluation
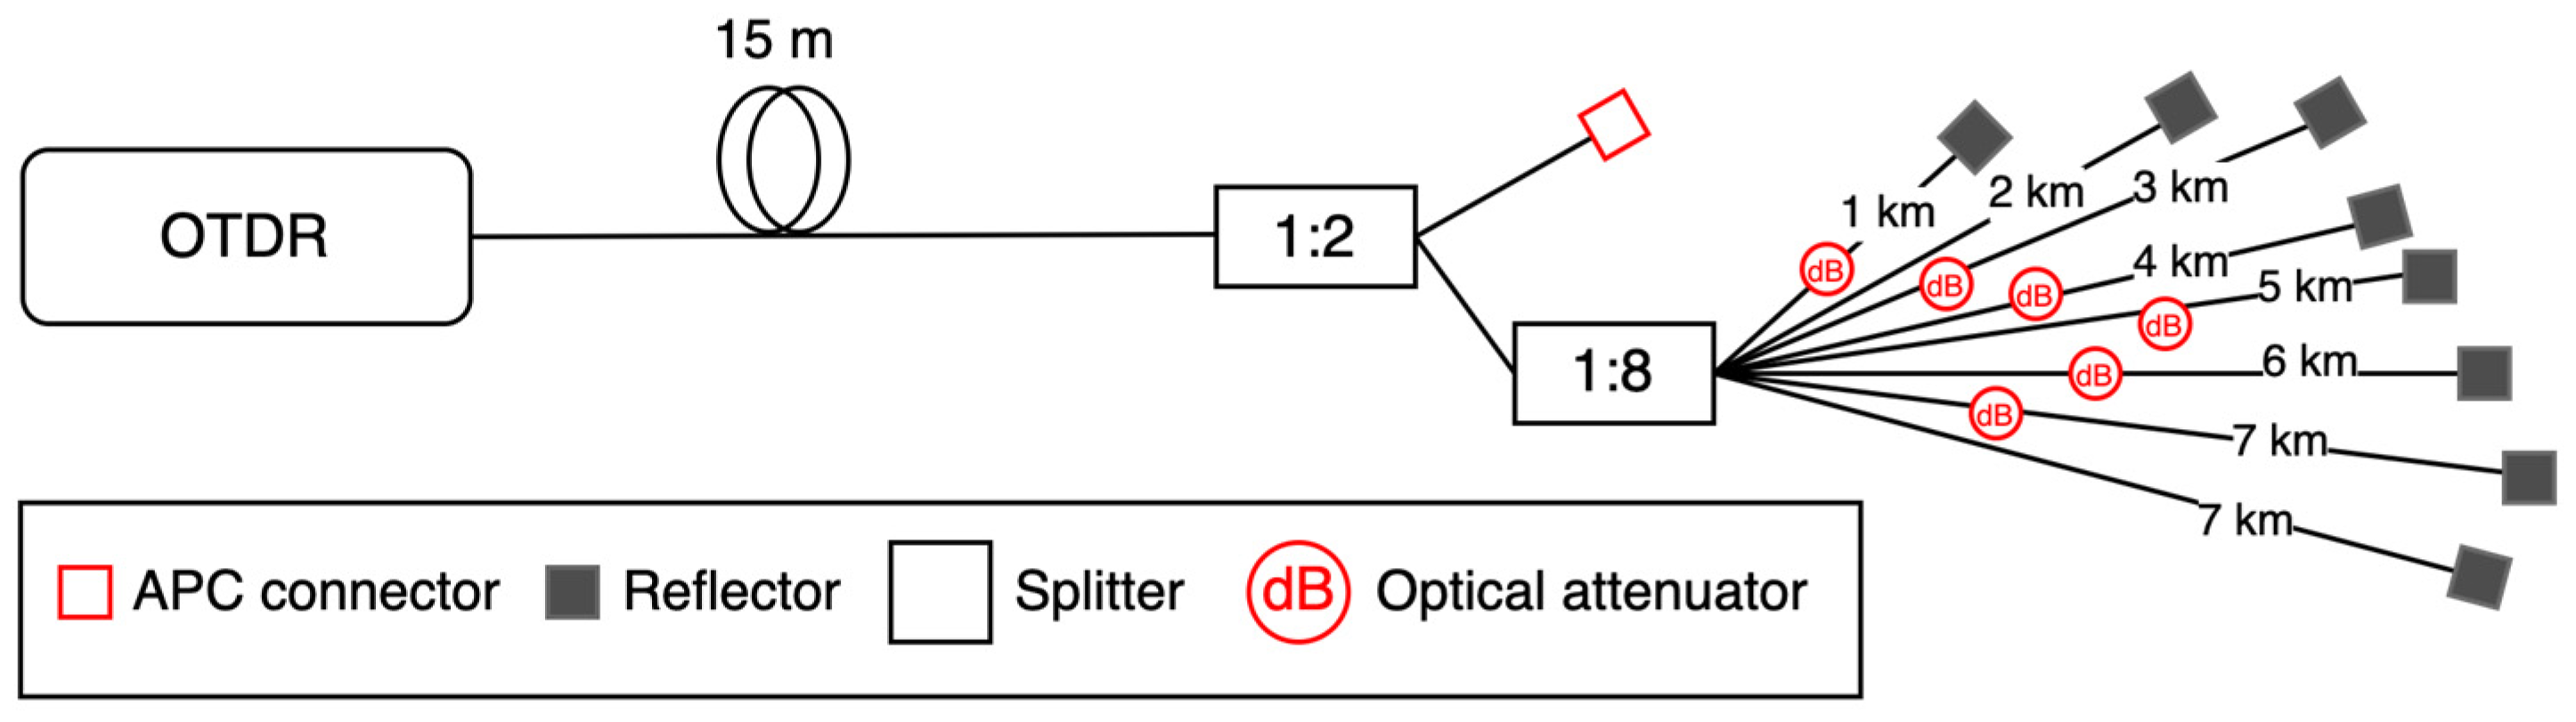
To validate the proposed approach, the simulation-based evaluation setup was built using OptiSystem 21.0 software. OptiSystem is an innovative, rapidly evolving, and powerful software design tool that enables users to plan, test, and simulate almost every type of optical link in the transmission layer of a broad spectrum of optical networks, from LAN, SAN, and MAN to ultra-long-haul. It offers transmission layer optical communication system design and planning from component to system level and visually presents analysis and scenarios [35]. The setup comprises an OLT connected to the 8 ONUs with a passive splitter. The distance between the OLT and ONUs ranges from 15 to 20 km, with a feeder fiber length of 15 km and branch lengths varying from 2 km to 7 km. The optical transmitter frequency is set to 1550 nm with a power of 7 dBm, using NRZ modulation. The attenuation loss is 0.2 dB/km, and the splitter loss varies from 4 dB to 8 dB. Two scenarios were simulated: normal and faulty scenarios. For the faulty scenarios, different anomalies were introduced, including macro-bending, micro-bending, fiber cut, and bad splitter. The simulation generated 709.054 samples. The data set was constructed, normalized, and divided into a training (60%), a validation (20%), and a test set (20%) for fault and normal scenario eye diagrams using OTDR traces, obtained from [12]. It is worth mentioning that the eye diagrams were used for anomaly detection, while the OTDR was used to localize the fault. A BER analyzer was placed at the end of each branch to capture the eye diagrams. The dataset is balanced, with an approximately equal number of samples representing normal and faulty conditions. To mimic anomalies (such as fiber bending, bad splitter) and fiber faults, attenuators were placed at the 2 km, 3 km, 5 km, and 7 km branches, respectively. The termination at the end of the 7 km branch was removed to simulate a fiber fault. Figure 7 shows a simulation-based evaluation setup for generating faulty branch data using OptiSystem in the passive optical network. Furthermore, the normal samples are derived from the simulation-based evaluation setup conducted without any attenuator.
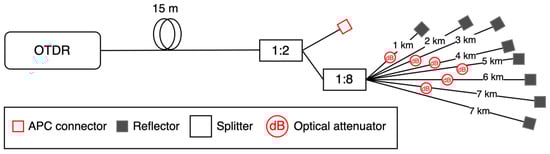
Figure 7.
Simulation-based evaluation setup for generating faulty branch data using Optisystem.
4.3. Neural Network Architecture and Model Evaluation
We started by preprocessing the data, applying a standard scaler to normalize the features, and guaranteeing that all features are on a similar scale to enhance the model’s performance. We then implemented a Multi-Layer Perceptron (MLP) neural network due to its simpler architecture, which requires less computational power compared with other machine learning algorithms, making it ideal for high-speed network environments.
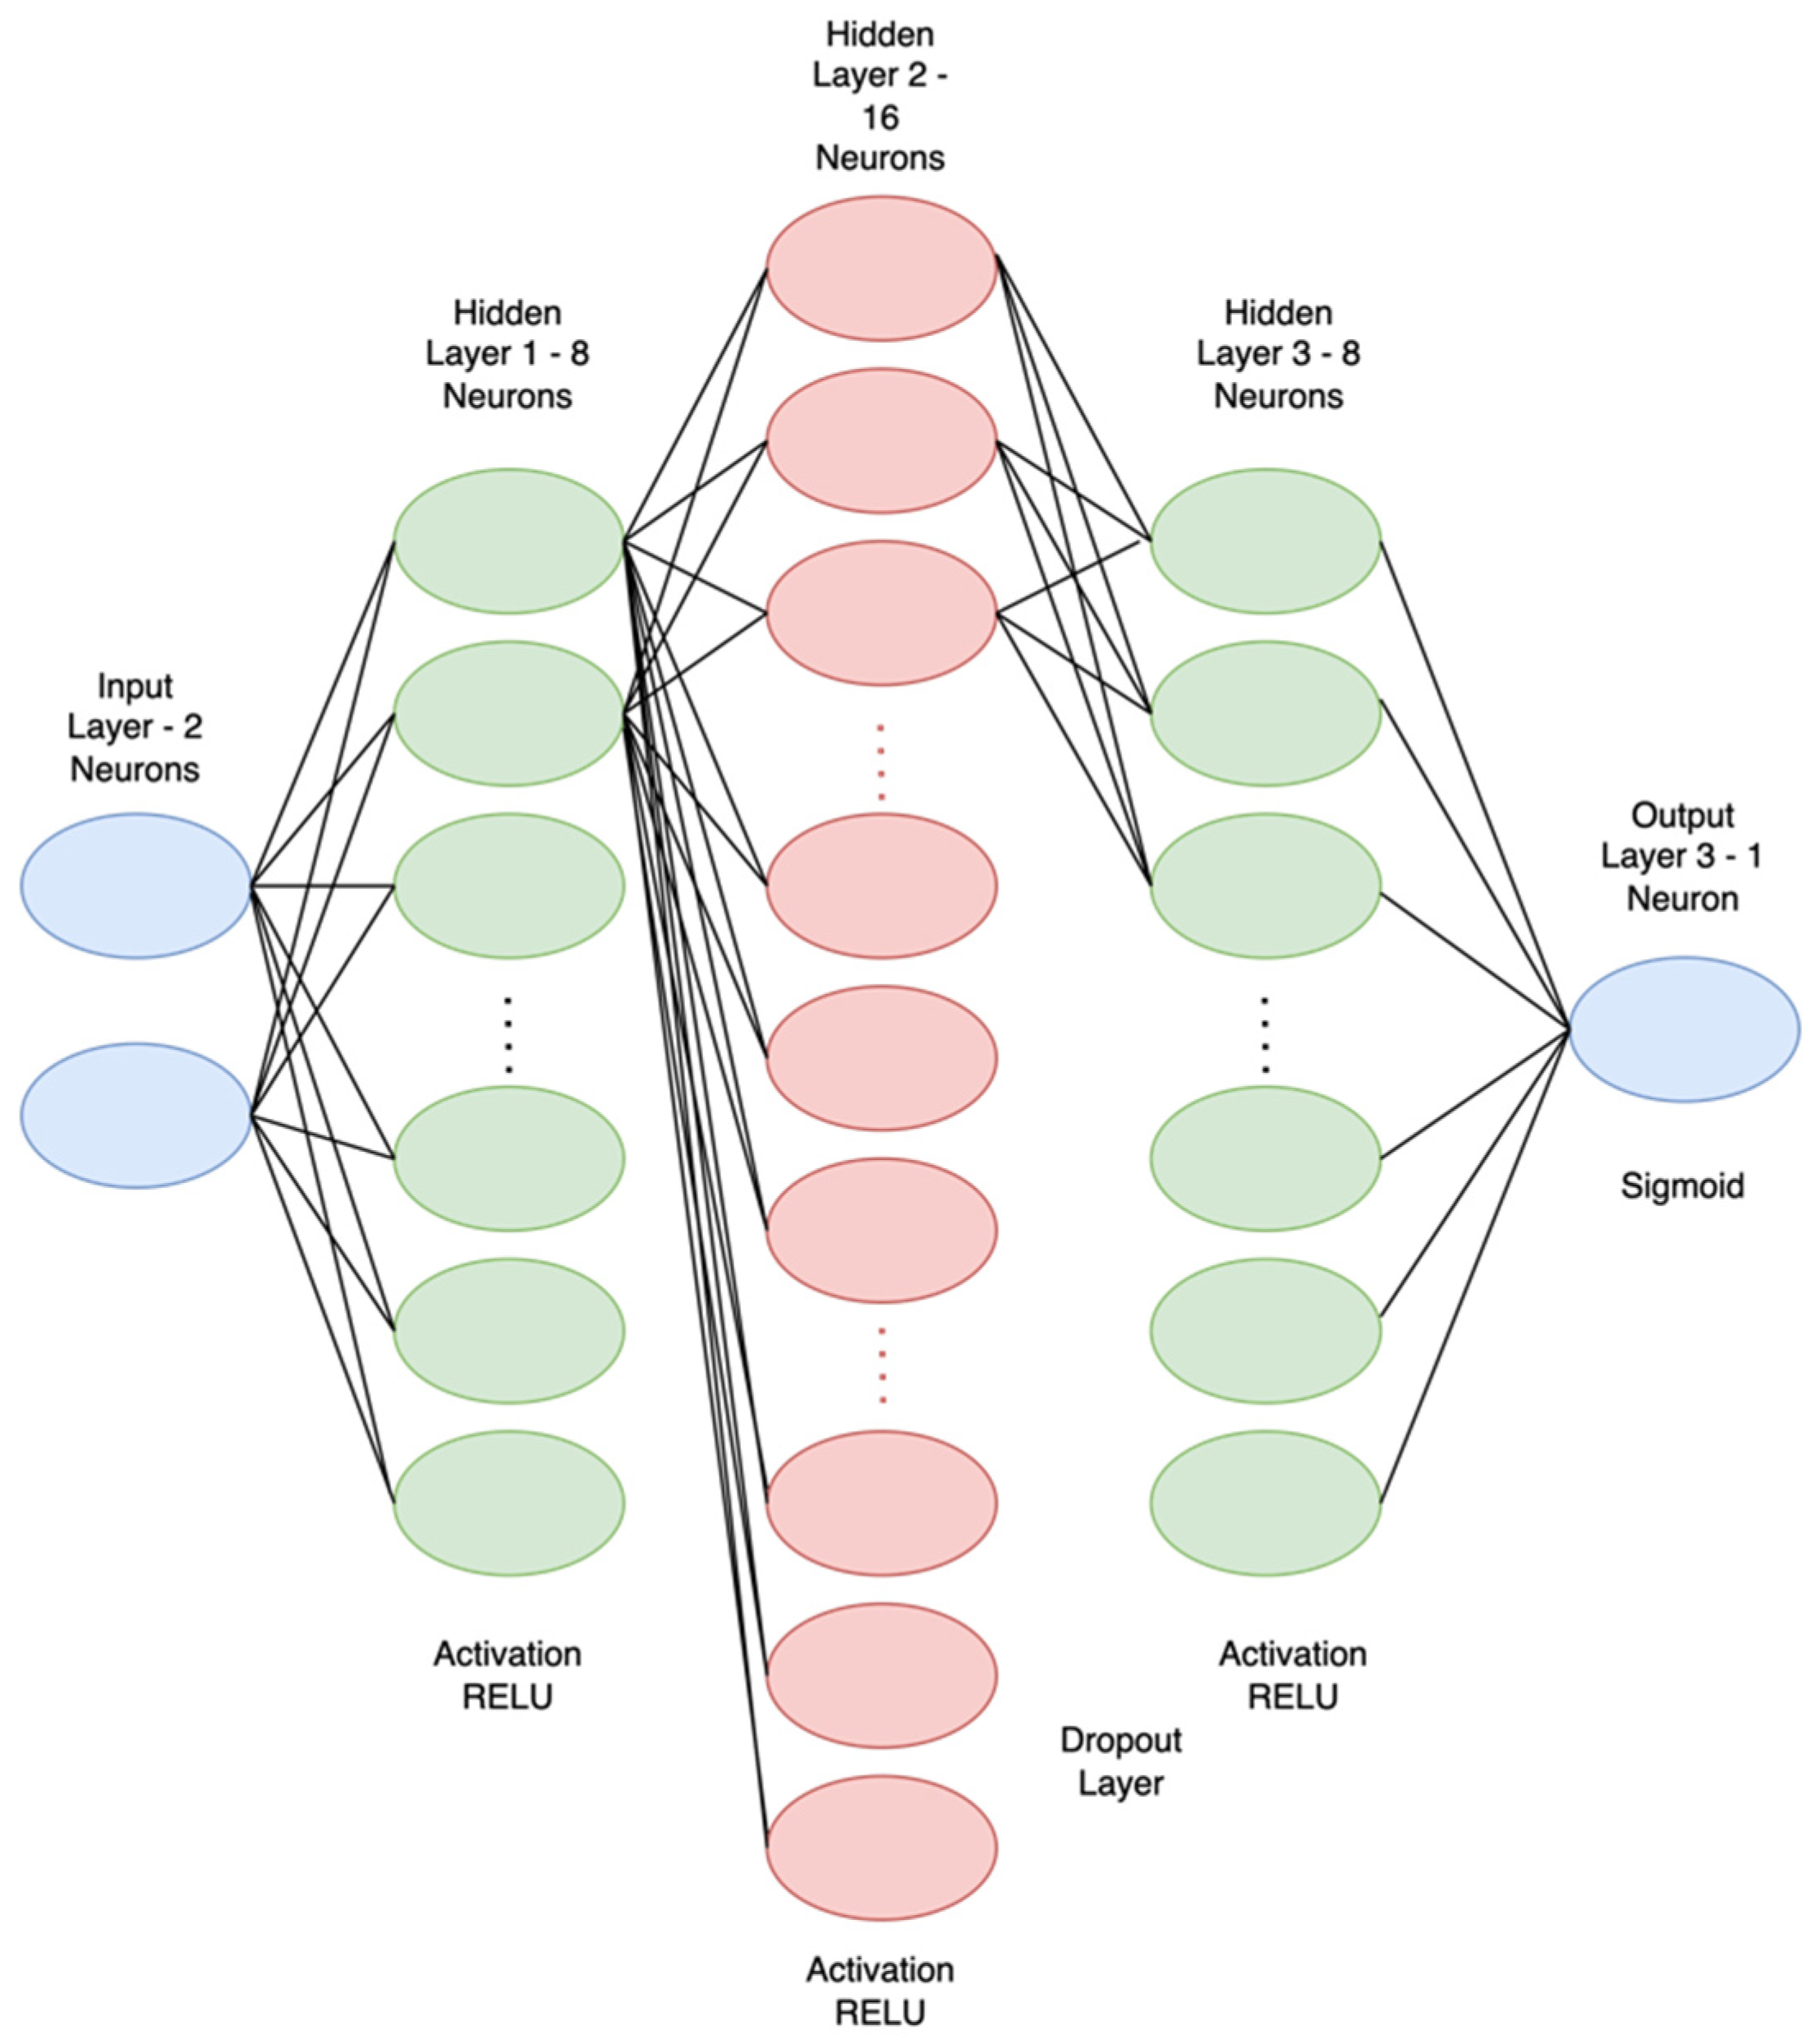
As shown in Figure 8, our MLP model has an input layer, followed by three hidden layers. The input layer has two neurons (for time and amplitude/reflection) (indicated by blue), while the hidden layers have 8, 16, and 8 neurons, (indicated by green, red, and green), respectively. All layers use the ReLU activation function, except the output layer (indicated by blue), which has a single neuron and uses the sigmoid activation function for binary classification (e.g., fault or no-fault). In total, this model has 313 trainable parameters.
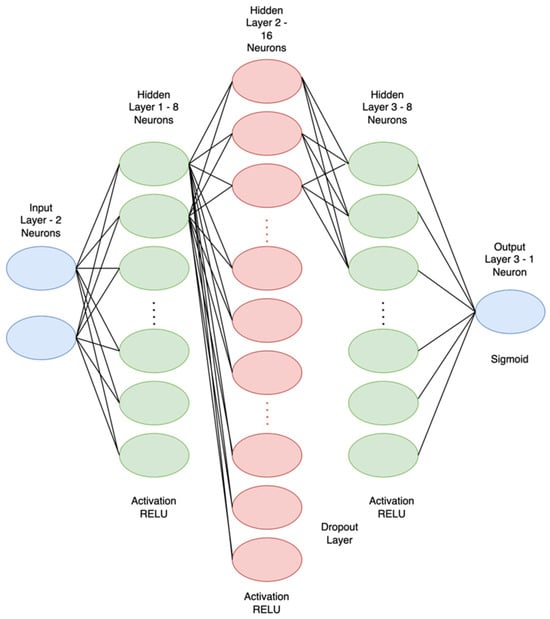
Figure 8.
The proposed MLP model for fiber fault diagnosis and localization.
To assess the model’s performance and robustness, we utilized stratified K-fold cross-validation, where each fold maintains the same class distribution as the original dataset. The training was conducted over 40 epochs with a batch size of 256, using 20% of the training data as a validation set to monitor for overfitting. Performance metrics such as accuracy, precision, recall, and F1-score were calculated for each fold. After completing all folds, we computed the average of these metrics to summarize the model’s overall performance on unseen data. The model achieved an average accuracy of 0.8149, precision of 0.8433, average recall of 0.7818, and average F1-score of 0.8100. These results indicate that the model performs robustly in distinguishing between “Normal” and “Fault” classes. The high average precision suggests effective minimization of false positives, meaning the model reliably identifies true positives when making positive predictions. However, the slightly lower recall indicates that some fault instances may be missed, resulting in false negatives. The balanced average F1-score reflects a good trade-off between precision and recall, making the model suitable for applications where both types of errors are of concern.
4.4. Resilience Dynamic Bandwidth Allocation
The Resilience Dynamic Bandwidth Allocation (RDBA) uses an offline scheduler approach, where the OLT waits for report messages from all ONUs before performing dynamic bandwidth allocation (DBA). In this way, the OLT will have a holistic view of all ONU demands, ensuring fairness [36]. In the normal condition where no fault is detected, the OLT will assign the bandwidth allocation to ONUs based on the following Formula (1):
where RN is the EPON line rate (in bits per second), Tmax is maximum cycle time (in milliseconds), N is the total number of ONUs, G is the guard time, and 512 bits is the control message length. The minimum guaranteed bandwidth (Bmin) of the ONU is calculated with the following Formula (2):
where Wmax is the maximum timeslot of an ONU, Wreport is the reserved window size of the report message (in bits). We limit each ONU timeslot to prevent upstream channel monopolization by heavily loaded ONUs. However, the Wmax can also be set according to the SLA.
When the proposed ML identifies faults or anomalies in the ODN by analyzing data from OTDR traces and the BER analyzer, the NEM will inform the OLT using the SDN controller to switch from normal DBA to RDBA. Once the RDBA is activated, the OLT dynamically adjusts the bandwidth allocation to prioritize the backup ONU, ensuring it can handle the data from both its traffic and the affected ONU (i.e., the faulty ONU). The backup ONU receives additional bandwidth, scaled based on predefined factors, to maintain service continuity for both ONUs. This process ensures minimal service disruption even during fault conditions, as the RFoG link facilitates the rerouting of traffic from the affected ONU to the backup ONU.
Figure 9 shows the pseudocode of the proposed RDBA. In the normal condition, the OLT calculates the available bandwidth (Bavailable) and the guaranteed bandwidth (Bmin) in each cycle. Under normal conditions in each cycle, the ONU gets the guaranteed bandwidth. If the guaranteed bandwidth (Bmin) is greater than the reported bandwidth from the queue, the granted bandwidth (GRANT_ONUi) is set to the queue’s requested bandwidth. Otherwise, the granted bandwidth is set to the remaining Bmin. The remaining Bmin is then updated by subtracting the granted bandwidth. In the restoration plan, when a fault occurs, the OLT will adjust for the backup ONU. If the current ONU is a backup ONU, the OLT sets the protection VLAN tag for the affected ONU. The Bmin is then calculated for the backup ONU, but it will be multiplied by alpha (). Here, represents the additional bandwidth allocated to the backup ONU to ensure it can handle the increased traffic, as the affected ONU now routes all data through the backup ONU via RFoG. If the current ONU is not a backup ONU, the normal condition function is applied. Moreover, to verify that the total requested bandwidth from ONUs does not exceed Bavailable due to the addition of variable , the total_requested_bandwidth is calculated as follows (3):
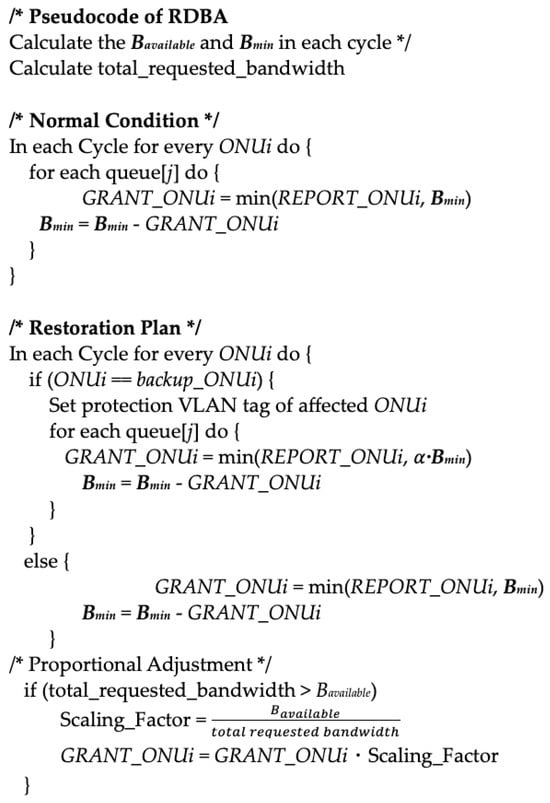
Figure 9.
The pseudocode of RDBA.
5. Performance Evaluation
To validate the proposed model, we implemented the NG-EPON architecture using the OPNET simulator. All key components and protocols of NG-EPON, such as dynamic bandwidth allocation, cycle time, transmission capacity, guard time, etc., are fully modeled. The proposed system model consists of 32 ONUs and one OLT. The downstream and upstream channels between the OLT and ONU are configured to 1 Gbps. The distance from the OLT to the ONUs is uniformly distributed over 10 to 20 km. To generate Assured-Forwarding (AF), Best-Effort (BE), and Tactile-Internet (TI) traffic, we employ self-similarity and long-range dependence, generating highly bursty traffic with a Hurst parameter of 0.7 [17]. The packet size is uniformly distributed between 512 and 12,144 bits. The Expedited Forwarding (EF) traffic is modeled using a T1 circuit-emulated line with a constant frame rate (1 frame/125 μs) and a fixed packet size of 560 bits, which occupies approximately 14% of the total upstream bandwidth. The remaining traffic is distributed as 50% AF, 20% BE, and 30% TI for scenario I, and 40% AF, 20% BE, and 40% TI for scenario II. To evaluate the proposed mechanism, we construct different scenarios: (1) no-fault, (2) one fault, and (3) three faults.
The focus of the simulation is to evaluate the system’s performance after faults are detected. Fault scenarios with one fault and three faults were introduced, and the system’s performance was measured in terms of key metrics, such as mean packet delay, system throughput, packet drop rate, and bandwidth waste. These measurements help validate the resilience of the architecture in ensuring performance guarantees, particularly in terms of low-latency requirements for real-time traffic such as Tactile Internet (TI). While the optical network’s physical characteristics (e.g., power levels, impairments) were not the focus of this simulation, the system response to fault scenarios was crucial in demonstrating the architecture’s ability to maintain service continuity and minimize disruption. To further validate the system, we compared the performance of the proposed RDBA mechanism against a traditional DBA approach, which does not incorporate fault-tolerant features. In the baseline DBA approach, bandwidth is allocated without any resilience mechanisms to manage fault scenarios. The simulation parameters are summarized in Table 3.
Table 3.
Simulation parameters.
5.1. Mean Packet Delay
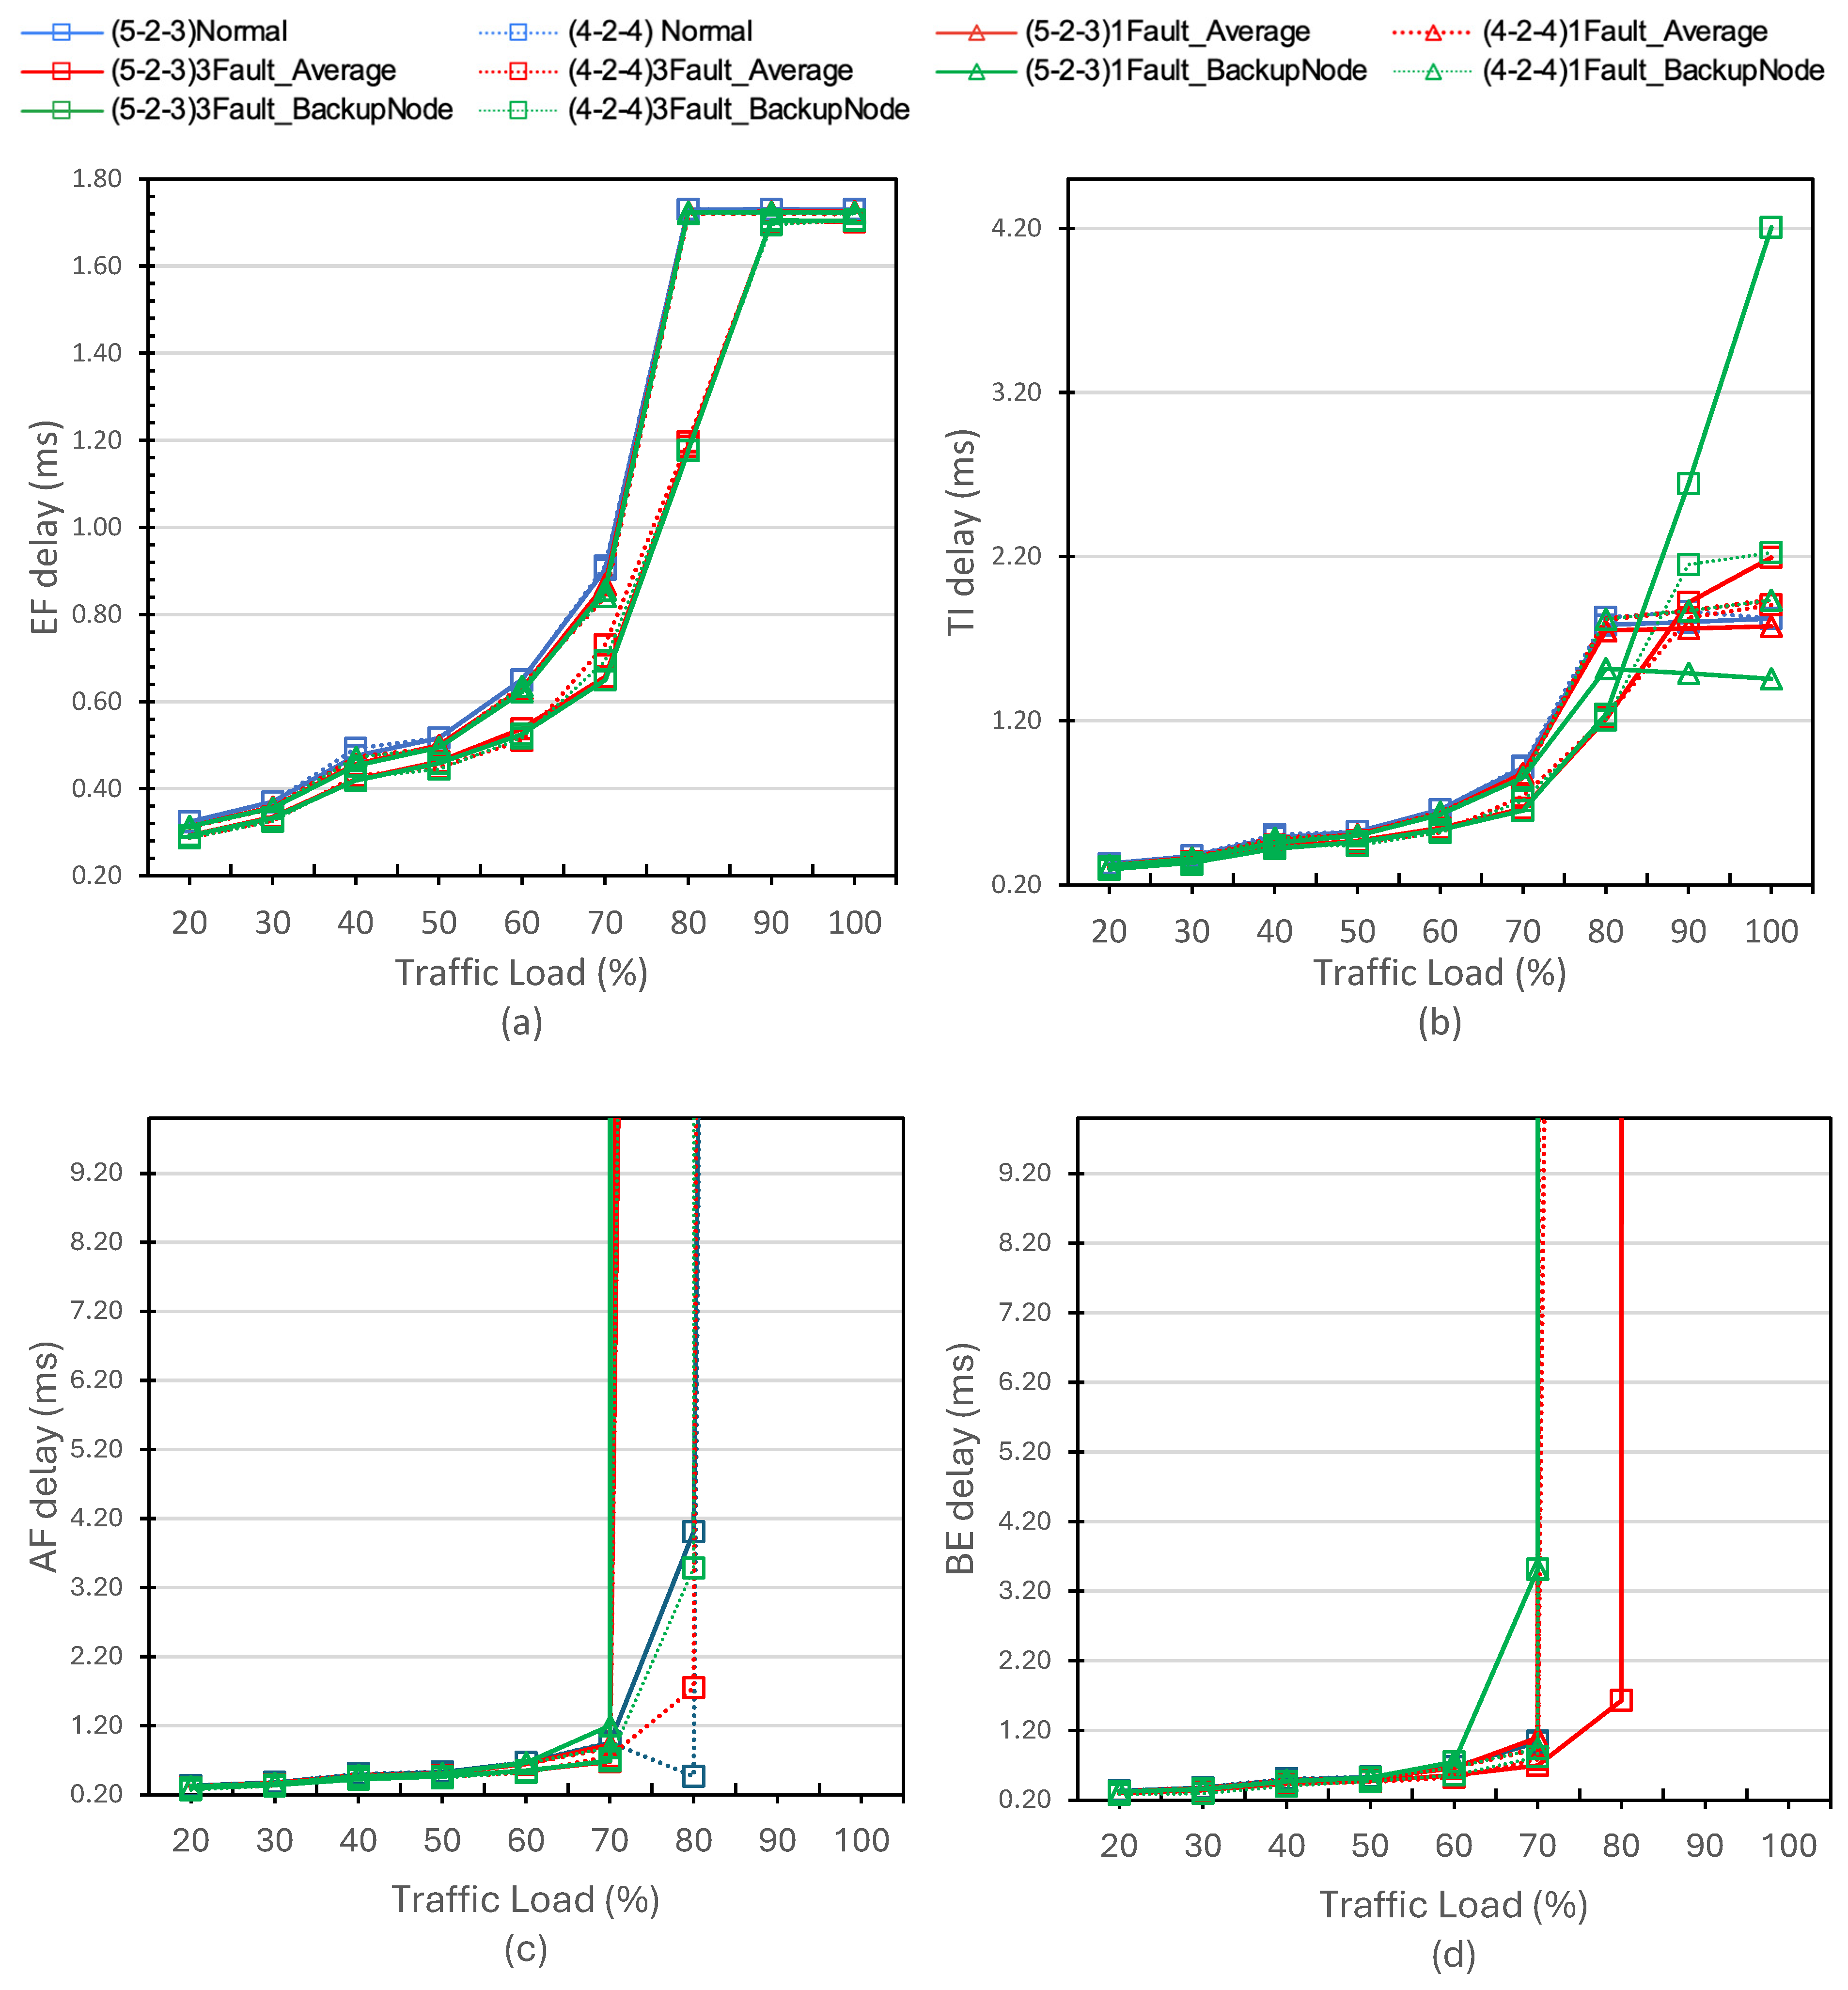
Figure 10 shows the mean packet delay of Expedited Forwarding (EF), Assured Forwarding (AF), and Tactile Internet (TI) with different traffic proportions. Four scenarios are depicted: Normal: delay of no faults in the network (blue line); 1Fault_Average: delay with one fault in the network, which represents a single fault occurring in one branch of the ODN; 3Fault_Average: delay with three faults in the network, representing multiple faults distributed across different branches of the ODN; 1Fault_BackupNode: delay at a specific backup node handling the affected ONU with one fault; and 3Fault_BackupNode: delay at specific backup nodes handling the affected ONUs with three faults.
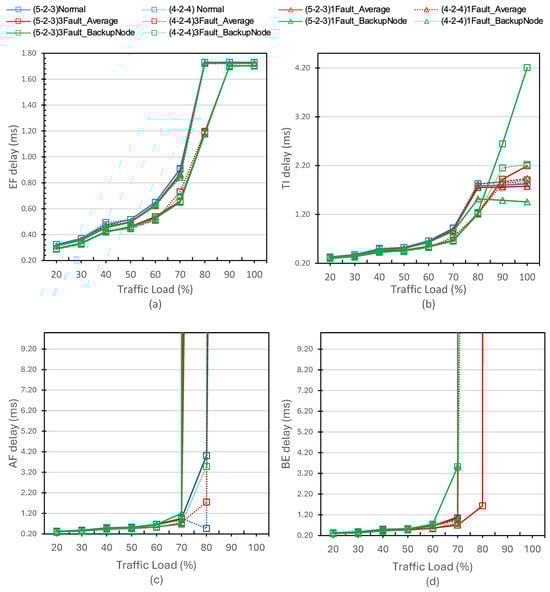
Figure 10.
Mean packet delay of EF, TI, AF and TI traffic.
As seen in Figure 10a, the EF delay under normal conditions increases gradually with the traffic load, showing an expected behavior where higher traffic leads to higher delay. However, in the 1Fault_Average and 3Fault_Average scenarios, when the traffic loads are below 70%, the delay remains close to the normal operation but increases more significantly as the traffic load exceeds 70%. This highlights the compounded effect of multiple faults on the network performance. The green lines (1Fault_BackupNode and 3Fault_BackupNode) show that the EF delay at specific backup nodes handling the affected ONUs is slightly higher than the normal operation but much lower than the 1Fault_Average line, demonstrating the effectiveness of the backup node in mitigating the impact of the faults on the affected ONUs.
In terms of TI delay, shown in Figure 10b, when there is one fault in the network, the 1Fault_BackupNode and 3Fault_BackupNode manage to stay close to the normal operation levels, even at higher traffic loads. This again demonstrates the effectiveness of the backup node in mitigating the impact of the fault, ensuring that TI delay remains well below 2 ms up to 90% and slightly exceeds 2 ms at 100% load. In the 3Fault_BackupNode scenario, the delay remains relatively low at moderate traffic loads but spikes dramatically beyond 80% load, reaching up to 5 ms at 100% load. This indicates that while backup nodes help manage the delay better than without them, multiple faults still pose a significant challenge, especially under high-traffic conditions.
Figure 10c,d illustrate the AF and BE delay, respectively. AF delay, much like EF, shows a minimal increase with rising traffic loads in the normal scenario. BE traffic, typically given the lowest priority, shows non-congested conditions under normal conditions. However, as the traffic load increases, the limited available resources are allocated preferentially to higher-priority traffic; therefore, once the traffic load surpasses 70%, the resources available for AF and especially BE packets become increasingly constrained. When faults are present, resources are redistributed to maintain service levels for critical applications, exacerbating delays for AF and BE traffic.
Consequently, the proposed RDBA mechanism successfully ensures that delays for EF and TI packets remain below critical thresholds, i.e., below 2 ms [4,37], maintaining high QoS for real-time and tactile internet applications. The results show that under normal and fault conditions, the RDBA can keep the delays well managed. The RDBA prioritizes higher-priority traffic, which can lead to increased delays for AF and BE packets under fault conditions. The simulation results highlight the importance of having a robust DBA mechanism that incorporates resilient AI-enhanced fault detection and recovery to effectively manage delay, particularly for high-priority traffic such as EF and TI packets.
5.2. System Throughput
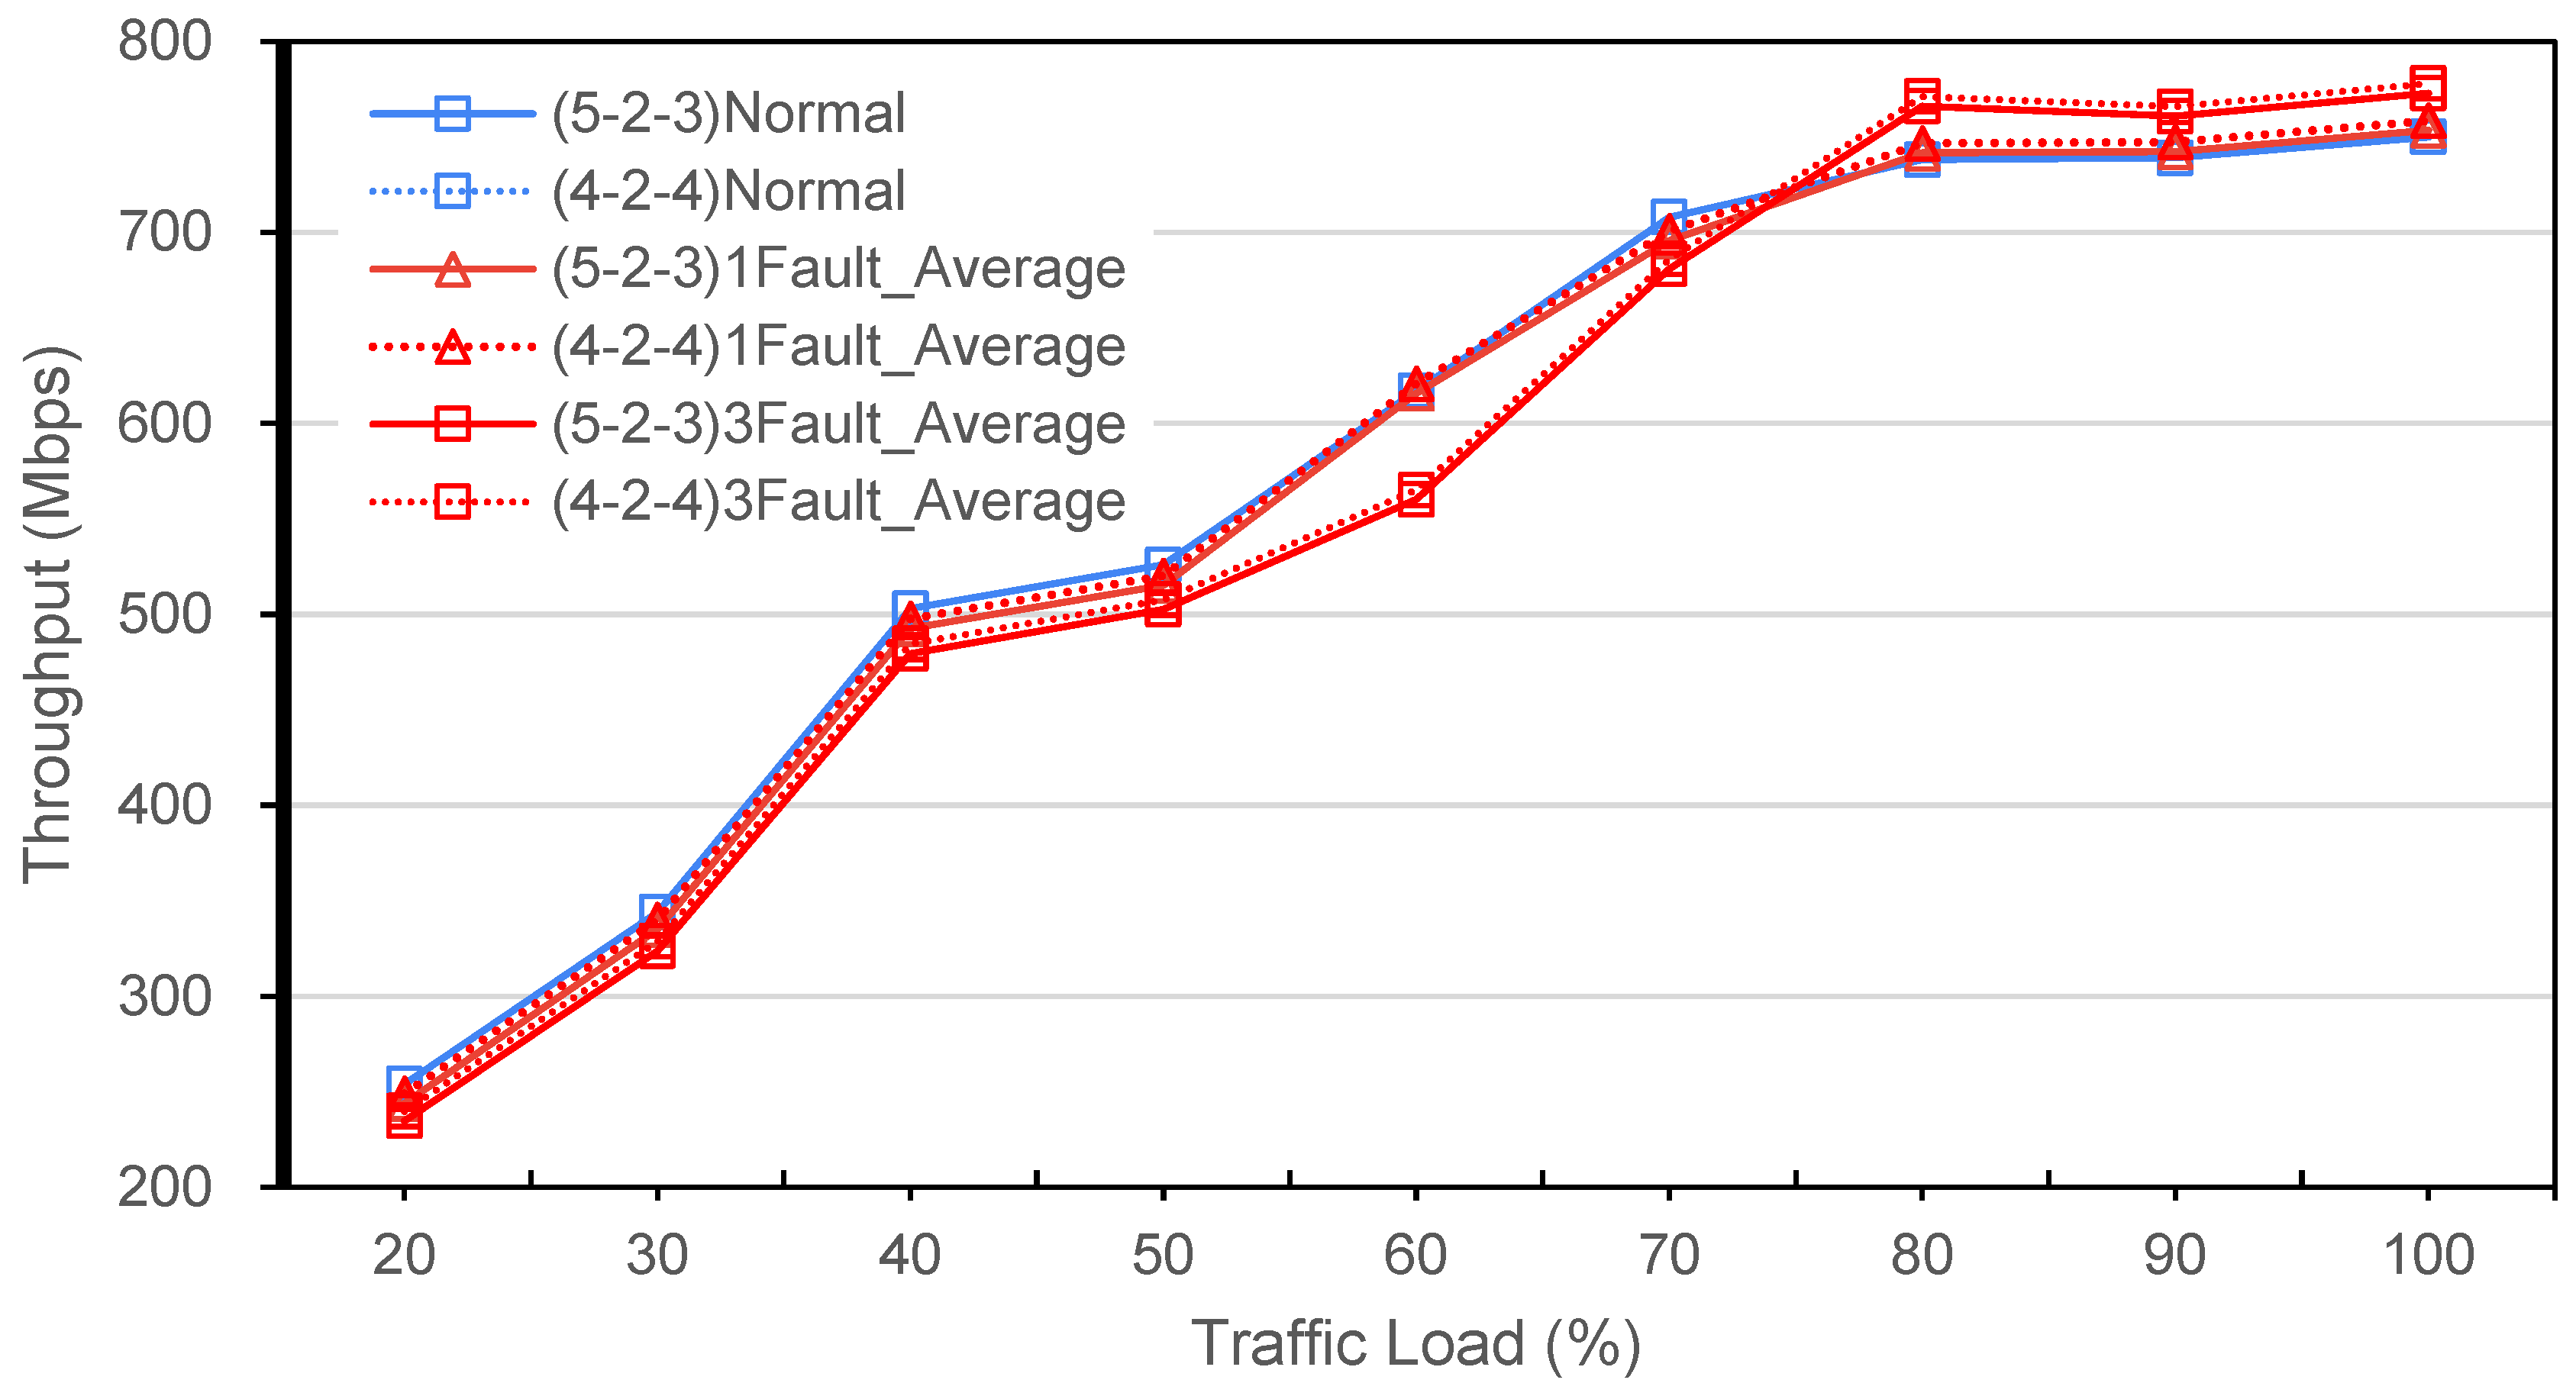
Figure 11 depicts the system throughput under normal and fault conditions. The system throughput of the network demonstrates a consistent increase as the traffic load rises, indicating the network’s robust capacity to handle escalating demands. This pattern shows an efficient RDBA that successfully adapts to increasing traffic demands. Moreover, in fault conditions (1Fault and 3Fault Averages), there is an observed increase in throughput efficiency compared with normal conditions. This is because the overhead communication required for inactive or faulty ONUs decreases, allowing more bandwidth to be allocated to active connections, thus improving the overall efficiency of the NG-EPON systems.
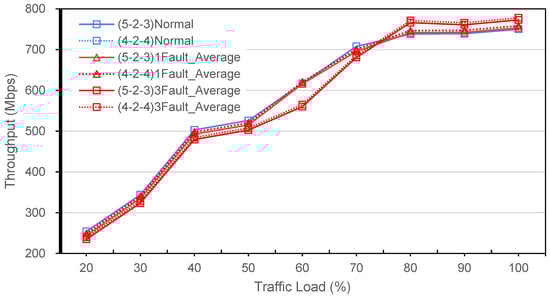
Figure 11.
System throughput.
5.3. Packet Drop Rate
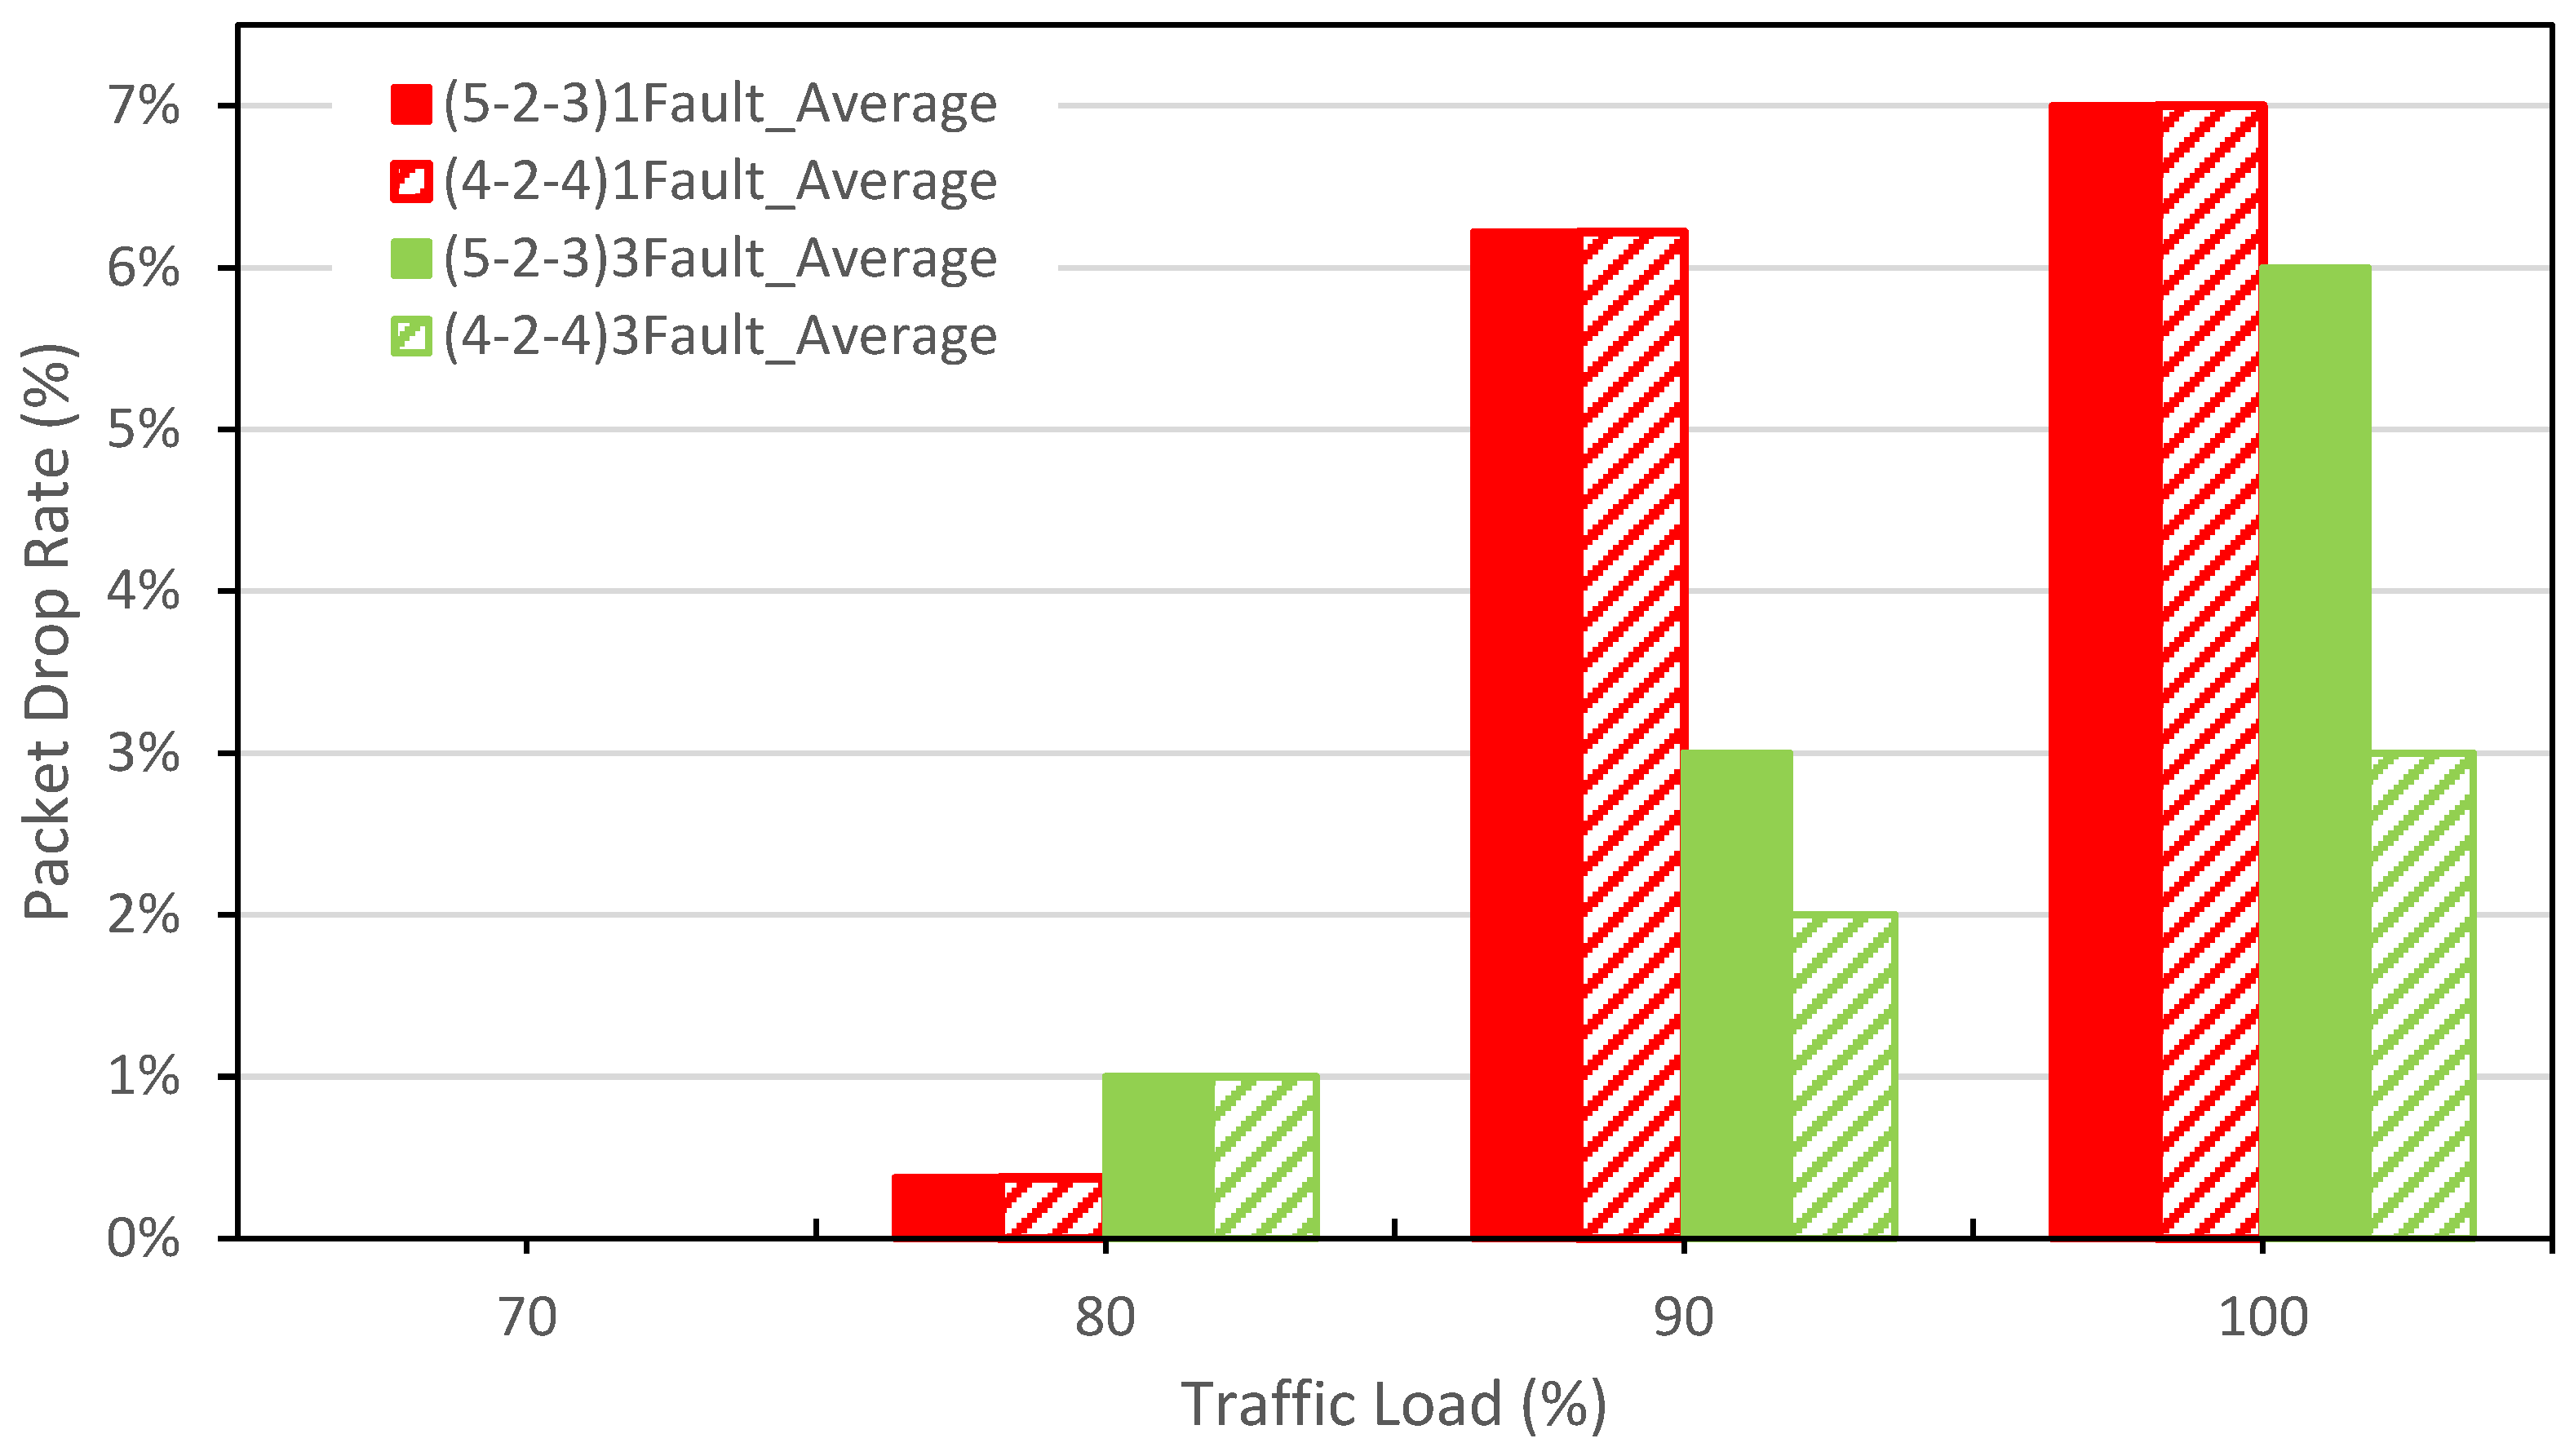
The packet drop rate shown in Figure 12 shows that the drop rates remain minimal at up to 70% traffic load across all scenarios, indicating healthy network functionality under moderate loads. However, as the load exceeds 80%, packet drop rates begin to rise, especially under conditions of three faults. The packet losses occur predominantly in AF and BE traffic categories, while EF and TI packets, given the highest priority in the network, experience no packet drop. This differentiation in packet treatment highlights the network’s strategic prioritization, ensuring that critical real-time applications dependent on EF and TI traffic maintain uninterrupted service even as the system approaches or reaches full capacity.

Figure 12.
Packet drop rate.
5.4. Bandwidth Waste
Figure 13 showcases the trend of decreasing bandwidth waste as the traffic load increases with various scenarios including normal conditions and faults. At lower traffic loads, the bandwidth waste tends to be a surplus of allocated but unused bandwidth, leading to higher waste. As the traffic load increases, the demand for bandwidth rises, making the RDBA allocate nearly all available bandwidth to meet this demand, thereby minimizing waste. Thus, the RDBA demonstrates a robust capability to optimize resource management, particularly crucial when the network load reaches full capacity.
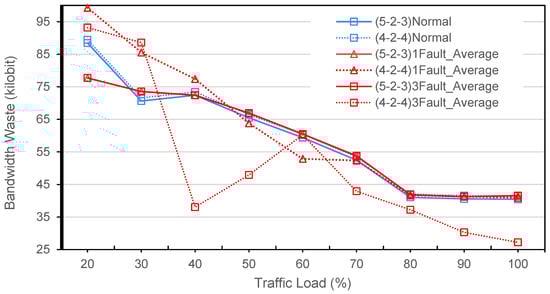
Figure 13.
Bandwidth waste.
The results from the comparison show that the RDBA mechanism outperforms the baseline DBA, particularly under fault conditions. While the baseline DBA experiences significant delays in high-priority traffic (EF and TI) during fault scenarios, the RDBA mechanism mitigates these delays using backup nodes, ensuring that critical traffic maintains low-latency performance even when multiple faults are present. While the RDBA performs better in handling faults and maintaining service continuity, it introduces some complexity in terms of system management and leads to higher delays for low-priority traffic (AF and BE), particularly under high-load conditions. This trade-off highlights the need for balancing fault tolerance and resource management in heavily loaded networks.
6. Conclusions
In this paper, we propose a Smart Resilience in an NG-EPON AI-Enhanced fault tolerance system, trained on an NG-EPON topology to detect and localize faulty branch anomalies. The topology used for simulations consists of 32 ONUs connected to a central OLT, with fiber distances ranging from 10 to 20 km, representing a typical NG-EPON deployment. Faulty branch anomalies are detected using a combination of OTDR trace analysis at the central office and BER analysis at the ONUs, and the AI model identifies faults within the network. The proposed architecture and RDBA mechanisms perform effectively under different scenarios, including normal, one fault, and three faults. We validated the performance of the proposed method using simulation-based evaluation data derived from NG-EPON systems and the OPNET simulator. Our AI model is based on a neural network with three hidden layers, trained using datasets generated from OTDR traces and eye diagrams. Our simulations demonstrate that the proposed architecture and mechanism can maintain the system’s performance even in the presence of faults. In future work, we aim to enhance our AI model’s capability to operate in a more complex and autonomous environment, improving its ability to adapt dynamically to real-world, large-scale NG-EPON topologies. Furthermore, we will include a more detailed simulation-based evaluation scenario to fully quantify the benefits and limitations of our model in real-time fault scenarios.
Author Contributions
Conceptualization and methodology, A.T.L., R.K. and C.-H.T.; formal analysis A.T.L. and R.K.; validation and editing A.T.L., I.-S.H. and C.-H.T.; supervision and funding, I.-S.H. All authors have read and agreed to the published version of the manuscript.
Funding
This work was funded by the National Science Council under grants NSTC 113-2221-E-155-055.
Institutional Review Board Statement
Not applicable.
Informed Consent Statement
Not applicable.
Data Availability Statement
Data are contained within the article.
Acknowledgments
We would like to express our sincere gratitude to Khouloud Abdelli for her invaluable contribution to our research. Abdelli provided the critical data that formed the foundation of our study, and her support and insights were instrumental in the completion of this work. We are deeply appreciative of her assistance and dedication.
Conflicts of Interest
The authors declare no conflicts of interest.
Abbreviations
| 5G | Fifth-generation |
| AF | Assured-Forwarding |
| AI | Artificial Intelligence |
| API | Application Programming Interface |
| BE | Best-Effort |
| BER | Bit Error Rate |
| CAPEX | Capital expenditures |
| EF | Expedited Forwarding |
| EPON | Ethernet Passive Optical Network |
| FBG | Fiber Bragg Granting |
| FCAPS | fault, configuration, accounting, performance, and security |
| FCC | Federal Communication Commission |
| gRPC | Remote Procedure Calls |
| H2H | Human-to-Human |
| H2M/R | Human-to-Machine/Robot |
| HITL | Human-in-the-Loop |
| IoT | Internet of Things |
| M2M | Machine-to-Machine |
| ML | Machine Learning |
| MLP | Multi-Layer Perceptron |
| MTTR | Mean Time to Repair |
| NEM | Network Edge Mediator |
| NFV | Network Function Virtualization |
| NG-EPONs | Next-Generation Ethernet Passive Optical Networks |
| NNI | Network-to-Network Interface |
| ODN | Optical Distribution Networks |
| OLT | Optical Line Terminal |
| OMCI | ONU Management and Control Interface |
| ONOS | Open Network Operating System |
| ONU | Optical Network Unit |
| OPEX | Operation and Maintenance Expenses |
| OTDR | Optical Time-Domain Reflectometry |
| PON | Passive Optical Networks |
| QoS | Quality-of-Service |
| R-CORD | Residential Services Central Office Rearchitected as Datacenter |
| RDBA | Resilience Dynamic Bandwidth Allocation |
| RFoG | Radio Frequency over Glass |
| RR | Reference Reflector |
| SDN | Software-Defined Networking |
| SEBA | SDN-Enabled Broadband Access |
| SLA | Service Level Agreement |
| TI | Tactile Internet |
| UNI | User Network Interface |
| VLAN | Virtual Local Area Network |
| vOLT | Virtual OLT |
| VOLTHA | Virtual OLT Hardware Abstraction |
| XR | Extended Reality |
References
- Trisha, S.M.; Hossen, M. Auction-based Hybrid DBA Algorithm in EPON-WiMAX Converge Network for 5G and Beyond (5 GB) Communications. Opt. Fiber Technol. 2023, 81, 103542. [Google Scholar] [CrossRef]
- Statista. Global IoT and Non-IoT Connections 2010–2025. Available online: https://www.statista.com/statistics/1101442/iot-number-of-connected-devices-worldwide/ (accessed on 25 July 2024).
- Saad, W.; Bennis, M.; Chen, M. A Vision of 6G Wireless Systems: Applications, Trends, Technologies, and Open Research Problems. IEEE Netw. 2020, 34, 134–142. [Google Scholar] [CrossRef]
- Promwongsa, N.; Ebrahimzadeh, A.; Naboulsi, D.; Kianpisheh, S.; Belqasmi, F.; Glitho, R.; Crespi, N.; Alfandi, O. A Comprehensive Survey of the Tactile Internet: State-of-the-Art and Research Directions. IEEE Commun. Surv. Tutor. 2021, 23, 472–523. [Google Scholar] [CrossRef]
- Holland, O.; Steinbach, E.; Prasad, R.V.; Liu, Q.; Dawy, Z.; Aijaz, A.; Pappas, N.; Chandra, K.; Rao, V.S.; Oteafy, S.; et al. The IEEE 1918.1 ‘Tactile Internet’ Standards Working Group and its Standards. Proc. IEEE 2019, 107, 256–279. [Google Scholar] [CrossRef]
- Wang, X.; Ji, Y.; Zhang, J.; Bai, L.; Zhang, M. Low-Latency Oriented Network Planning for MEC-Enabled WDM-PON Based Fiber-Wireless Access Networks. IEEE Access 2019, 7, 183383–183395. [Google Scholar] [CrossRef]
- Amjad, Z.; Sikora, A.; Hilt, B.; Lauffenburger, J.-P. Low Latency V2X Applications and Network Requirements: Performance Evaluation. In Proceedings of the 2018 IEEE Intelligent Vehicles Symposium (IV), Changshu, China, 26–30 June 2018; pp. 220–225. [Google Scholar] [CrossRef]
- Dias, I.; Ruan, L.; Ranaweera, C.; Wong, E. From 5G to Beyond: Passive Optical Network and Multi-Access Edge Computing Integration for Latency-Sensitive Applications. Opt. Fiber Technol. 2023, 75, 103191. [Google Scholar] [CrossRef]
- IEEE 802.3ca-2020; IEEE Standard for Ethernet Amendment 9: Physical Layer Specifications and Management Parameters for 25 Gb/s and 50 Gb/s Passive Optical Networks. IEEE: Piscataway, NJ, USA, 2020; pp. 1–267. [CrossRef]
- Zhang, C.; Yang, M.; Zheng, W.; Zheng, Y.; Wu, Y.; Zhang, Y. Analysis of Wavelength Deployment Schemes in Terms of Optical Network Unit Cost and Upstream Transmission Performance in NG-EPONs. J. Opt. Commun. Netw. 2021, 13, 214. [Google Scholar] [CrossRef]
- Ab-Rahman, M.S.; Ridzuan, A.M.; Kaharudin, I.H.; Hwang, I.S. Real Time FTTH Network Monitoring using Binary Coded Fiber Bragg Grating. Optik 2022, 251, 168408. [Google Scholar] [CrossRef]
- Abdelli, K.; Cho, J.Y.; Azendorf, F.; Griesser, H.; Tropschug, C.; Pachnicke, S. Machine Learning-based Anomaly Detection in Optical Fiber Monitoring. J. Opt. Commun. Netw. 2022, 14, 365. [Google Scholar] [CrossRef]
- Villa, G.; Tipantuña, C.; Guamán, D.S.; Arévalo, G.V.; Arguero, B. Machine Learning Techniques in Optical Networks: A Systematic Mapping Study. IEEE Access 2023, 11, 98714–98750. [Google Scholar] [CrossRef]
- Abdelli, K.; Grießer, H.; Ehrle, P.; Tropschug, C.; Pachnicke, S. Reflective Fiber Fault Detection and Characterization using Long Short-Term Memory. J. Opt. Commun. Netw. 2021, 13, E32. [Google Scholar] [CrossRef]
- Honda, N.; Iida, D.; Izumita, H.; Azuma, Y. In-Service Line Monitoring System in PONs Using 1650-nm Brillouin OTDR and Fibers With Individually Assigned BFSs. J. Light. Technol. 2009, 27, 4575–4582. [Google Scholar] [CrossRef]
- Fouli, K.; Chen, L.R.; Maier, M. Time-, Wavelength-, and Code-Domain Optical Reflection Monitoring for Next-Generation Access-Metro Networks. Comput. Commun. 2011, 34, 1011–1021. [Google Scholar] [CrossRef]
- Liem, A.T.; Hwang, I.S.; Nikoukar, A. An Autonomous Recovery Mechanism Against Optical Distribution Network Failures in EPON. Opt. Fiber Technol. 2014, 20, 552–560. [Google Scholar] [CrossRef]
- Liem, A.T.; Hwang, I.S.; Nikoukar, A.; Ab-Rahman, M.S. Distribution Drop Fiber in-Service Fault Management in Enhanced EPON System. Opt. Switch. Netw. 2015, 17, 52–63. [Google Scholar] [CrossRef]
- Ashraf, M.; Idrus, S.; Iqbal, F.; Butt, R.; Faheem, M. Disaster-Resilient Optical Network Survivability: A Comprehensive Survey. Photonics 2018, 5, 35. [Google Scholar] [CrossRef]
- Yeh, C.H.; Chow, C.W.; Liu, Y.L. Self-Protected Ring-Star-Architecture TDM Passive Optical Network with Triple-Play Management. Opt. Commun. 2011, 284, 3248–3250. [Google Scholar] [CrossRef]
- Kanungoe, A.; Mukhopadhyay, A.; Das, G.; Banerjee, R.; Das, R. A New Protection Scheme for A Combined Ring-Star based Hybrid WDM/TDM PON Architecture. Opt. Switch. Netw. 2015, 18, 153–168. [Google Scholar] [CrossRef]
- Hsu, C.-H.; Jiang, S.-Y.; Hsieh, S.-E.; Yeh, C.-H.; Lai, Y.-T.; Chen, L.-Y.; Liaw, S.-K.; Chow, C.-W. Hybrid Self-Protected Fiber-FSO WDM-PON System with Fiber Breakage Prevention. Photonics 2022, 9, 822. [Google Scholar] [CrossRef]
- Zentani, A.; Zulkifli, N.; Ramli, A. Network Resiliency and Fiber Usage of Tree, Star, Ring and Wheel based Wavelength Division Multiplexed Passive Optical Network Topologies: A Comparative Review. Opt. Fiber Technol. 2022, 73, 103038. [Google Scholar] [CrossRef]
- Pakpahan, A.F.; Hwang, I.S.; Yu, Y.M.; Hsu, W.H.; Liem, A.T.; Nikoukar, A. Novel Elastic Protection Against DDF Failures in An Enhanced Software-Defined SIEPON. Opt. Fiber Technol. 2017, 36, 51–62. [Google Scholar] [CrossRef]
- Mata, J.; de Miguel, I.; Durán, R.J.; Merayo, N.; Singh, S.K.; Jukan, A.; Chamania, M. Artificial Intelligence (AI) Methods in Optical Networks: A Comprehensive Survey. Opt. Switch. Netw. 2018, 28, 43–57. [Google Scholar] [CrossRef]
- Nyarko-Boateng, O.; Adekoya, A.F.; Weyori, B.A. Predicting the Actual Location of Faults in Underground Optical Networks using Linear Regression. Eng. Rep. 2021, 3, eng212304. [Google Scholar] [CrossRef]
- Straub, M.; Reber, J.; Saier, T.; Borkowski, R.; Li, S.; Khomchenko, D.; Richter, A.; Färber, M.; Käfer, T.; Bonk, R. ML Approaches for OTDR Diagnoses in Passive Optical Networks—Event Detection and Classification: Ways for ODN Branch Assignment. J. Opt. Commun. Netw. 2024, 16, C43. [Google Scholar] [CrossRef]
- Cisco. 2024 Global Networking Trends Report. Available online: https://www.cisco.com/c/dam/en/us/solutions/enterprise-networks/2024-global-networking-trends.pdf (accessed on 25 May 2024).
- Das, S. From CORD to SDN Enabled Broadband Access (SEBA) [Invited Tutorial]. J. Opt. Commun. Netw. 2021, 13, A88. [Google Scholar] [CrossRef]
- Bentz, C.; Baudzus, L.; Krummrich, P. Signal to Noise Ratio (SNR) Enhancement Comparison of Impulse-, Coding- and Novel Linear-Frequency-Chirp-Based Optical Time Domain Reflectometry (OTDR) for Passive Optical Network (PON) Monitoring Based on Unique Combinations of Wavelength Selective Mirrors. Photonics 2014, 1, 33–46. [Google Scholar] [CrossRef]
- Almarhabi, A.; Alhazmi, H.; Samarkandi, A.; Yao, Y.D. Modulation Classification Based on Eye Diagrams and Deep Learning. In Proceedings of the 2022 31st Wireless and Optical Communications Conference (WOCC), Shenzhen, China, 11–12 August 2022; pp. 35–40. [Google Scholar] [CrossRef]
- Edge Core Networks Corporation. Edgecore Networks. Available online: https://www.edge-core.com/solution-inquiry.php?cls=5&id=51 (accessed on 27 May 2024).
- Open Networking Foundation. Reference Design SDN Enabled Broadband Access (SEBA). March 2021. Available online: https://opennetworking.org/reference-designs/seba/ (accessed on 28 May 2024).
- Sgambelluri, A.; Pacini, A.; Paolucci, F.; Castoldi, P.; Valcarenghi, L. Reliable and Scalable Kafka-based Framework for Optical Network Telemetry. J. Opt. Commun. Netw. 2021, 13, E42. [Google Scholar] [CrossRef]
- Optiwave Sytstem. OptiSystem Overview. Optiwave. Available online: https://optiwave.com/optisystem-overview/ (accessed on 23 June 2024).
- Liem, A.T.; Hwang, I.S.; Ganesan, E.; Taju, S.W.; Sandag, G.A. A Novel Temporal Dynamic Wavelength Bandwidth Allocation Based on Long-Short-Term-Memory in NG-EPON. IEEE Access 2023, 11, 82095–82107. [Google Scholar] [CrossRef]
- Simsek, M.; Aijaz, A.; Dohler, M.; Sachs, J.; Fettweis, G. 5G-Enabled Tactile Internet. IEEE J. Select. Areas Commun. 2016, 34, 460–473. [Google Scholar] [CrossRef]


Disclaimer/Publisher’s Note: The statements, opinions and data contained in all publications are solely those of the individual author(s) and contributor(s) and not of MDPI and/or the editor(s). MDPI and/or the editor(s) disclaim responsibility for any injury to people or property resulting from any ideas, methods, instructions or products referred to in the content. |
© 2024 by the authors. Licensee MDPI, Basel, Switzerland. This article is an open access article distributed under the terms and conditions of the Creative Commons Attribution (CC BY) license (https://creativecommons.org/licenses/by/4.0/).