Communication

Solution Doping of PMMA-Based Step-Index Polymer Optical Fibers by Rhodamine B Near Glass Transition Temperature of PMMA

College of Chemistry and Chemical Engineering, Ningxia Normal University, Guyuan 756000, China
*
Author to whom correspondence should be addressed.
Photonics 2024, 11(10), 966; https://doi.org/10.3390/photonics11100966
Submission received: 7 September 2024 / Revised: 5 October 2024 / Accepted: 11 October 2024 / Published: 15 October 2024

Abstract

:
Solution doping is a facile approach to fabricating photoactive polymer optical fibers (POFs). However, previous studies reveal that only the cladding of step-index POFs can be doped by the solution doping method in methanol or aqueous solutions, whereas the fiber core is hardly doped. To dope the fiber core as well as the cladding, this study attempts to dope PMMA-based step-index POFs by raising the doping temperatures to near the Tg of PMMA. The results show that a considerable amount of rhodamine B (RhB) is doped in the fiber core, though the amount is still much less than that in the cladding. The highest content in the fiber core is 0.479 mg/g, which is achieved by doping the POFs in water at 110 °C for 8 h. At the same condition, the RhB content of the cladding is 11.5 mg/g. It is found that the high-temperature doping process leads to dramatic axial shrinkage and radial expansion of the POFs, due to the relaxation of the fiber core. The wrinkled cladding after doping suggests that the macromolecule orientation of the core is much higher than that of the cladding, and high orientation should be the main reason why the core is much more difficult to dope than the cladding. Additionally, the doping process at 90 °C in water does not increase the fiber loss regardless of the tremendous POF structure change. In short, the core of PMMA-based step-index POFs can be doped at a temperature near the Tg of the PMMA, making the solution doping technique more practicable for POF doping.

1. Introduction

Doping is a convenient and widely used method to functionalize both silica and polymer optical fibers (POFs) to extend their wide applications in sensing thanks to the intrinsic properties of optical fibers, including their electromagnetic immunity, small size, remote-sensing ability, etc. [1,2,3,4]. Silica optical fibers have been doped mainly by rare earth elements to realize various desired functionalities [5,6,7]. Similarly, POFs have been doped by photoactive organic small molecules [8,9,10], quantum dots [11,12], and rare earth elements [13,14] to make them photoactive. Doped POFs have been applied as fiber amplifiers, sensors, light sources, and lasers [15,16,17,18,19,20,21]. Compared with silica optical fibers, POFs are much easier to dope. The most straightforward and facile approach to doping POFs is to add the dopant into the fiber core when it is polymerized during the fabrication of the fiber preforms or to add the dopant into the core material when the fiber is fabricated by the extrusion method [22,23,24]. One major issue with this method is that the dopant must withstand the high temperature of the drawing or extrusion process and might change chemically. For example, the drawing or extrusion temperature of polymethyl methacrylate (PMMA)-based POFs is well over 200 °C. It has been reported, however, that the initial decomposition temperature of rhodamine B (RhB) and Rhodamine 6G, two widely used dopants, is 53.5 °C and 219.0 °C, respectively. The mass loss of RhB at 53.5 °C is 2.95% and reaches 5.11% at 195.8 °C, and the mass loss of rhodamine 6G is as high as 14.91% within the temperature range of 219.0–255.7 °C [25]. Therefore, many researchers resort to doping commercial POFs to make them photoactive. The general procedure is to swell the POFs in methanol to allow dissolved dopant molecules to diffuse into the swollen POFs, which is normally called the solution doping technique [9,26]. This technique dopes POFs at a much lower temperature than the fiber drawing temperature and can be realized in common chemical laboratories.
However, there is one major issue with the solution doping method. That is, the doping process increases fiber loss, especially when methanol is used to swell the POFs. Igor Ayesta et al. successfully doped bare PMMA fibers without cladding by RhB in methanol and obtained uniformly doped bare fibers, but the appropriate doping temperature is around 10 °C, which is lower than room temperature. The fiber loss starts to be affected at 20 °C, and the fiber loss after doping at 35 °C is too high to be measured. The main reason is attributed to the relaxation of oriented PMMA macromolecules after swelling in methanol due to the reduced Tg of the methanol–PMMA system. To address this issue, our research group proposed to dope POFs in an aqueous solution and methanol aqueous solutions within the temperature range of 60–80 °C [10,27]. The results show that the fiber loss is not affected by the aqueous solution-based doping process and raising the temperature or increasing the methanol in the doping solution can effectively accelerate the doping process. However, it is found that only the cladding is doped [26,28], and the dopant content in the fiber core is extremely low compared to that of the cladding, even up to 80 °C in water. It is hypothesized that it is due to the high orientation of polymers in the fiber core, and the swelling ratio of the core is not large enough for the diffusion of dopant molecules into the core.
The present study attempts to dope PMMA-based step-index POFs by RhB in aqueous solution at a further higher temperature, namely, near the glass transition temperature (Tg) of PMMA (~108 °C). The main objective is to dope the fiber core as well as the cladding by the solution doping method since the doped fiber core is desired for many applications. Additionally, methanol is added to investigate its influence on the doping process.

2. Experimental

2.1. Materials and Reagents

The POF (ESKA CK-20, Mitsubishi Chemical, Tokyo, Japan) used in the study has a PMMA core and fluorinated cladding. Its average diameter is 500 µm, while the core diameter is 485 µm. Thus, the thickness of the cladding is less than 10 µm. It should be noted that the diameter of the fiber and the core fluctuate significantly, as large as ±30 µm, as indicated by the specifications of the fiber. RhB (AR) and methanol (AR) were purchased from Shanghai Taitan and used without further purification.

2.2. Doping and Characterization of POFs

To dope POFs at temperatures higher than the boiling points of water or the methanol/water solutions at ambient pressure, hydrothermal kettles with a stainless-steel body and a PTFE chamber were used, which were tightly sealed during doping so that the doping solutions in it could reach temperatures higher than 100 °C. Typically, 100 mL of water or methanol/water solution in various ratios and 0.500 g of RhB were added into a thermal kettle and stirred until fully dissolved, then a number of POF sections in lengths of 5 cm were added, and the kettle was properly sealed. It was placed in an oven, and the temperature was set to 90, 100, or 110 °C. After periods of doping time, POF sections were taken out and rinsed with water to remove any dopants stuck on the fiber surface and then characterized. Fiber diameters were measured by a micrometer, and the surface morphology of doped POFs was observed by scanning electron microscopy (JSM-7610F, JEOL, Tokyo, Japan).

2.3. Measurement of Doping Concentration

The concentration of RhB in the doped fiber, the cladding, or the core was calculated by measuring the absorption of their solutions at 557 nm, the absorption peak of RhB as previously reported [10]. Firstly, the absorption of the prepared solutions and the RhB content were linearly fitted to obtain a linear equation. Then, the doped fiber sections were weighed and dissolved in acetone, and the absorption of the solution at 557 nm was measured by an ultraviolet spectrophotometer (Agilent Cary 3500, Santa Clara, CA, USA). The RhB content of the solution was calculated by substituting the absorption into the linear equation. Then, the total mass of RhB in the fiber was calculated and divided by the mass of the dissolved fiber to obtain the RhB content of the fiber in the unit of mg/g.
To measure the RhB content of the fiber core and the cladding, they were separated by 5 min ultrasonic stirring in ethyl acetate and then were dissolved separately. The mass of the core and the cladding were estimated by their geometry and assumed density (1.2 g/cm3) as described in [10]. Then, the absorption of the two solutions by the core or the cladding were measured, and the RhB contents were calculated, respectively.

3. Results and Discussion

3.1. Macroscopic and Microscopic Changes in POFs

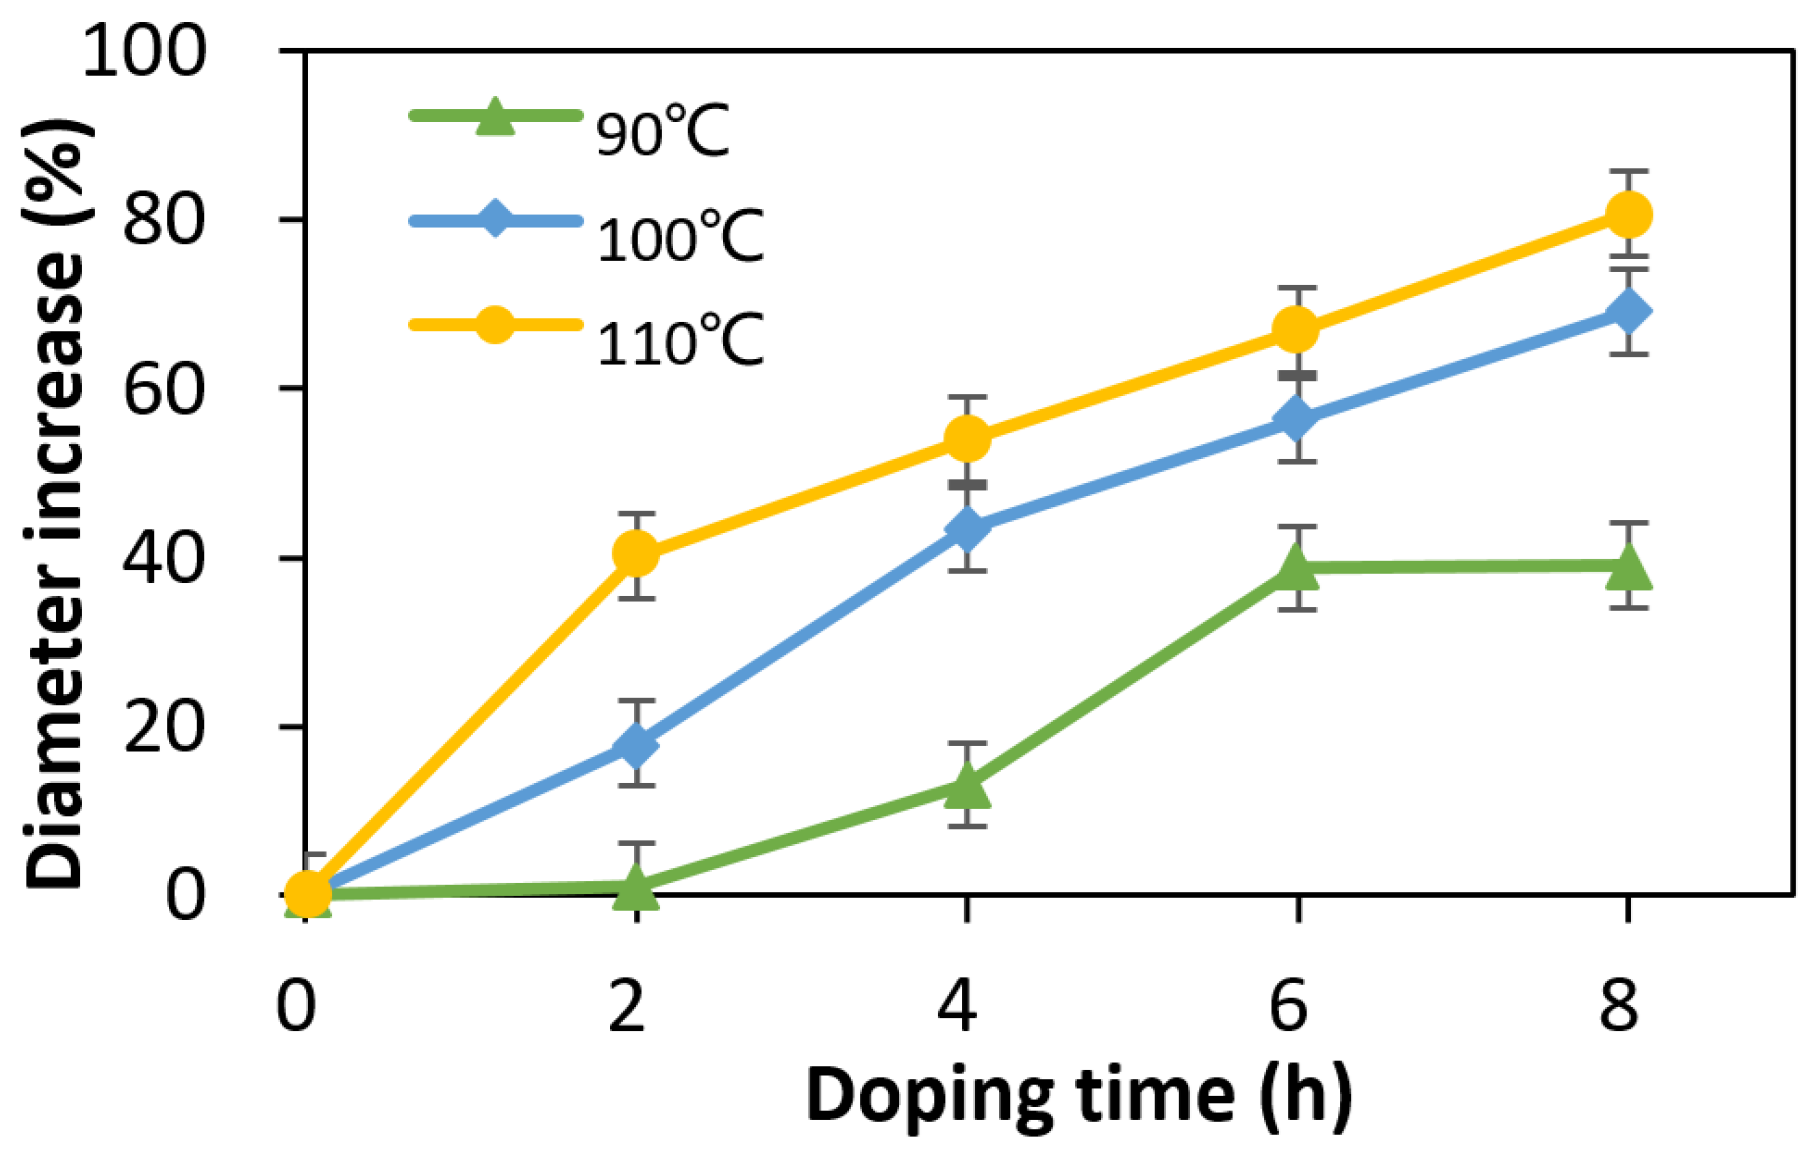
Figure 1a illustrates POF sections after doping in pure water dissolved with RhB at 90 °C for 1, 2, 4, 6, and 8 h, and Figure 1b is the cross-section of the fiber doped for 8 h. Similar changes are observed at 100 and 110 °C and are not shown. The most apparent macroscopic change in the fiber section due to doping is its dramatic length shrinkage. The initial length of the fiber section is 5 cm. After 8 h of doping, the length is reduced to only about 1.5 cm. At the same time, the fiber diameter increases significantly (Figure 2). The largest diameter increase is about 80% after 8 h of doping in water at 110 °C. That means the diameter of the doped fiber is almost 900 µm. In the same time, the color of the POF becomes deeper red as the doping proceeds, indicating that more RhB molecules have diffused into the fiber, though the cross-section image indicates that the color is mainly due to the cladding. Axial shrinking and radial expansion of the fiber during doping are expected due to the relaxation of the highly oriented macromolecules in the fiber, especially at high temperatures near the Tg of PMMA [29]. The fiber drawing process orients the PMMA macromolecules along the fiber axial direction. At a high doping temperature, the relaxation of the orientation leads to axial shrinking and radial expansion [24].
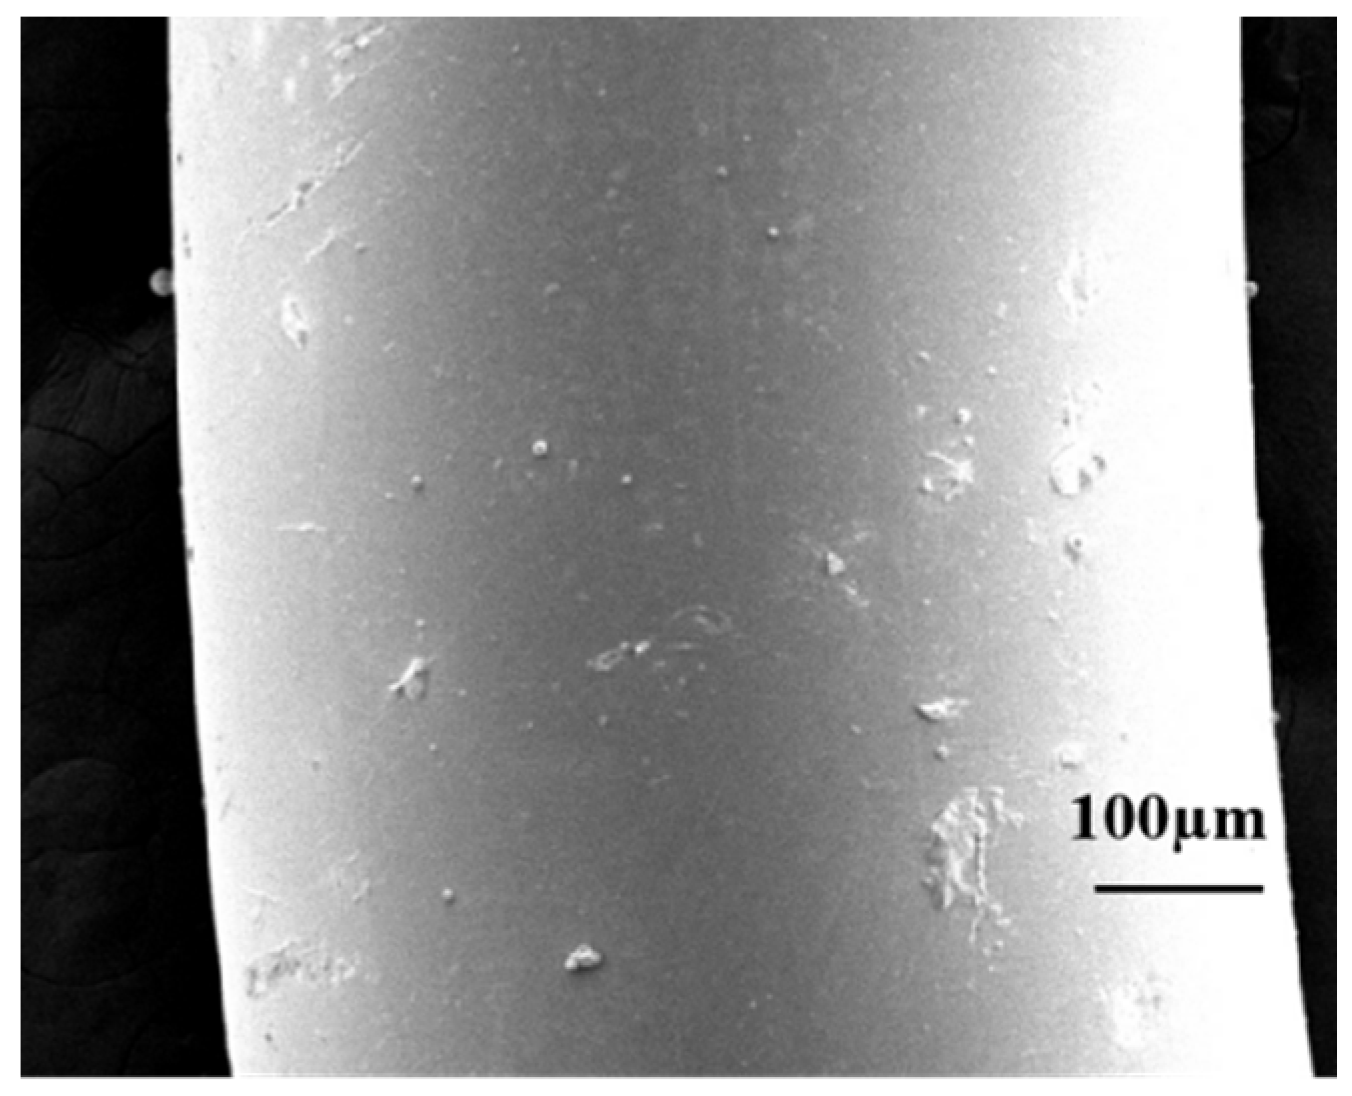
Along with macroscopic dimension change, the fiber surface also changes notably after doping. As shown in Figure 3, the smooth fiber surface becomes wrinkled. Wrinkles are perpendicular to the axial direction, about a few hundred micrometers long and spaced dozens of micrometers irregularly. It is speculated that the wrinkled part is only the fiber cladding. To verify the speculation, the fiber core and the cladding are separated in ethyl acetate with ultrasonic stirring, and the bare fiber core is doped. Figure 4 is the SEM photo of the bare fiber core without cladding after doping in water at 110 °C for 8 h, and the surface is still smooth. Therefore, it is confirmed that the surface wrinkles of the doped fiber are the fiber cladding. The results indicate that macromolecules composing the fiber cladding orient much less than those of the fiber core. The high-temperature doping process leads to the relaxation of the highly oriented polymers of the fiber core, yielding axial shrinkage and radial expansion. But the fiber cladding relaxes much less and forms wrinkles as the core shortens. The relaxation mismatch between them separates the core and the cladding from location to location and produces wrinkles, though the core and the cladding do not separate completely.

3.2. Dopant Concentration in the Fiber

As shown in Figure 1, the color deepening of the doped fibers suggests that the RhB molecules have diffused into the fiber. Measurement of the dopant concentration in the fiber core and the cladding reveals that there is a noticeable amount of RhB in the fiber core, though the content is much less than that in the cladding, as shown in Table 1. When POFs are doped in water, the RhB concentration of the cladding increases from 7.90 to 11.5 mg/g as the doping temperature is raised from 90 to 110 °C, while the concentration of the core is from 0.305 to 0.479 mg/g, suggesting that raising the doping temperature is beneficial to the doping concentration. As a comparison, the doping concentration of 6G in the fiber core is less than 0.1 mg/g when the fiber is doped at 80 °C in water/methanol (90/10 v/v) solution for 96 h [27].
The table reveals a quite surprising finding. That is, in the doping solution with 20% methanol, there is almost no RhB, even in the fiber cladding, regardless of the doping temperature. Also, the RhB concentration in the cladding of the fiber doped in the 10% methanol solution is lower than the same doped in the water, suggesting that in the temperature range of 90–110 °C, more methanol in the doping solution leads to a lower doping concentration of RhB in the fiber. The main reason might be the high solubility of the RhB in the methanol/water solution compared to that in water. In terms of phase equilibrium, the equilibrium concentration of the RhB in the fiber cladding is much lower when the fiber is in the solution of 20% methanol, compared with when the fiber is in water. Additionally, the doping speed in the 10% methanol solution is close to that in the water solution. In short, within the temperature range of 90–110 °C, methanol in the doping solution does not contribute to the doping process. This is in sharp contrast to the doping temperature range of 50–80 °C previously studied, in which range it is found that an appropriate amount methanol can effectively accelerate the doping process.

3.3. Effect of Doping on the Fiber Loss

To investigate the impact of high-temperature doping on the fiber loss, the transmission spectrum of the fiber during doping was recorded in real time in water at 90 °C and at ambient pressure (~83 kPa). One end of the fiber is connected to a light source (HL2000, Wyoptics, Shanghai, China), and the other is connected to an optical spectrum analyzer (USB2000, Ocean Optics, Orlando, FL, USA); the middle section of the fiber (length about 10 cm) was immersed in the doping solution. The solution was contained in a flask and heated in a water bath. As the doping proceeds, the transmission spectrum of the POF is recorded continuously and the result is shown in Figure 5. It is worth pointing out that each spectrum contains the remaining light from the light source after its absorption by the POF and the fluorescent light of the RhB excited by the input light. The absorption of the POF is significant because the transmission spectra of the POF are quite different from the output light spectrum of the light source. However, side excitation of the POF that was doped in water at 80 °C for 8 h by the light source HL2000 produces no measurable fluorescent light, suggesting that the intensity of the fluorescent light in each spectrum is negligible. The intensity of the transmitted light at around 550 nm, the absorption band of RhB, rapidly decreases to zero after doping for 2 h. As the doping proceeds, more RhB molecules diffuse into the POF, and the absorption band becomes wider and wider; thus, the transmission of light around 550 nm (450–700 nm) also decreases notably. However, even after 12 h, the intensity of the transmitted light in the range of 700–850 nm (far beyond the absorption band of the RhB) barely changes, suggesting that the doping process does not raise the fiber loss except within the absorption band of the RhB. Because 100 and 110 °C are above the boiling temperature of water at the local air pressure, the present experiment setup cannot reach such high temperatures; thus, the impact of doping at these two temperatures on the fiber loss has not been investigated. Nevertheless, the result demonstrates the feasibility of doping PMMA-based POFs in water at 90 °C.
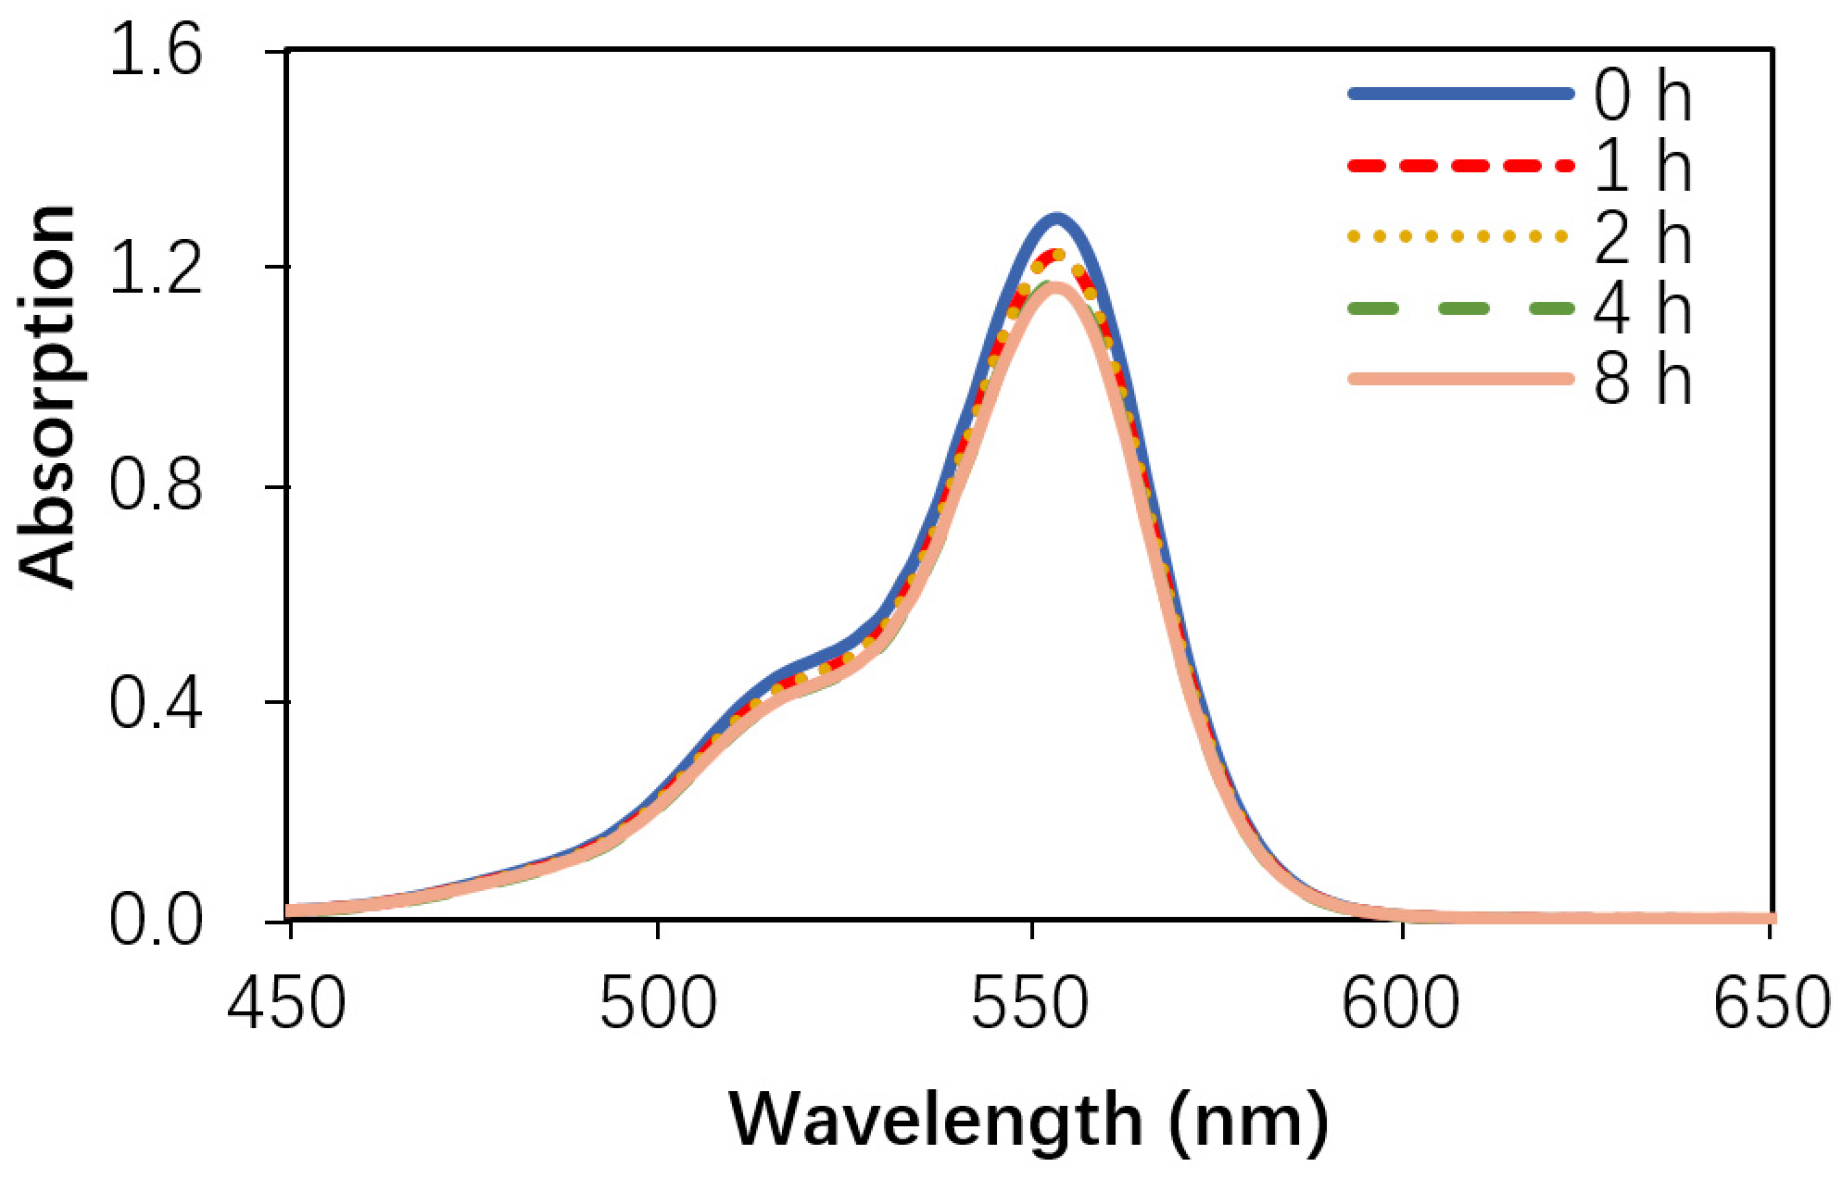
As mentioned, dyes like RhB tend to degrade at high temperatures. To investigate the degradation of RhB in the solution during the POF doping, the absorption spectrum of the doping solution was measured after the doping solution was cooled and diluted 1000 times. Figure 6 shows the result for the as-prepared solution (0 h) and those heated at 110 °C for 1, 2 4, and 8 h. The peak absorption before heating is 1.28 and reduces to about 1.15 after heating for 8 h. Assuming a linear relationship between the absorption and the RhB concentration, the degradation ratio is about 10.0%, which is quite significant. Despite that, the result reveals that most RhB molecules in the doping solution remain and confirms that the spectrum change in Figure 5 is due to the RhB diffused into the POF rather than due to the degradation of the RhB in the doping solution.
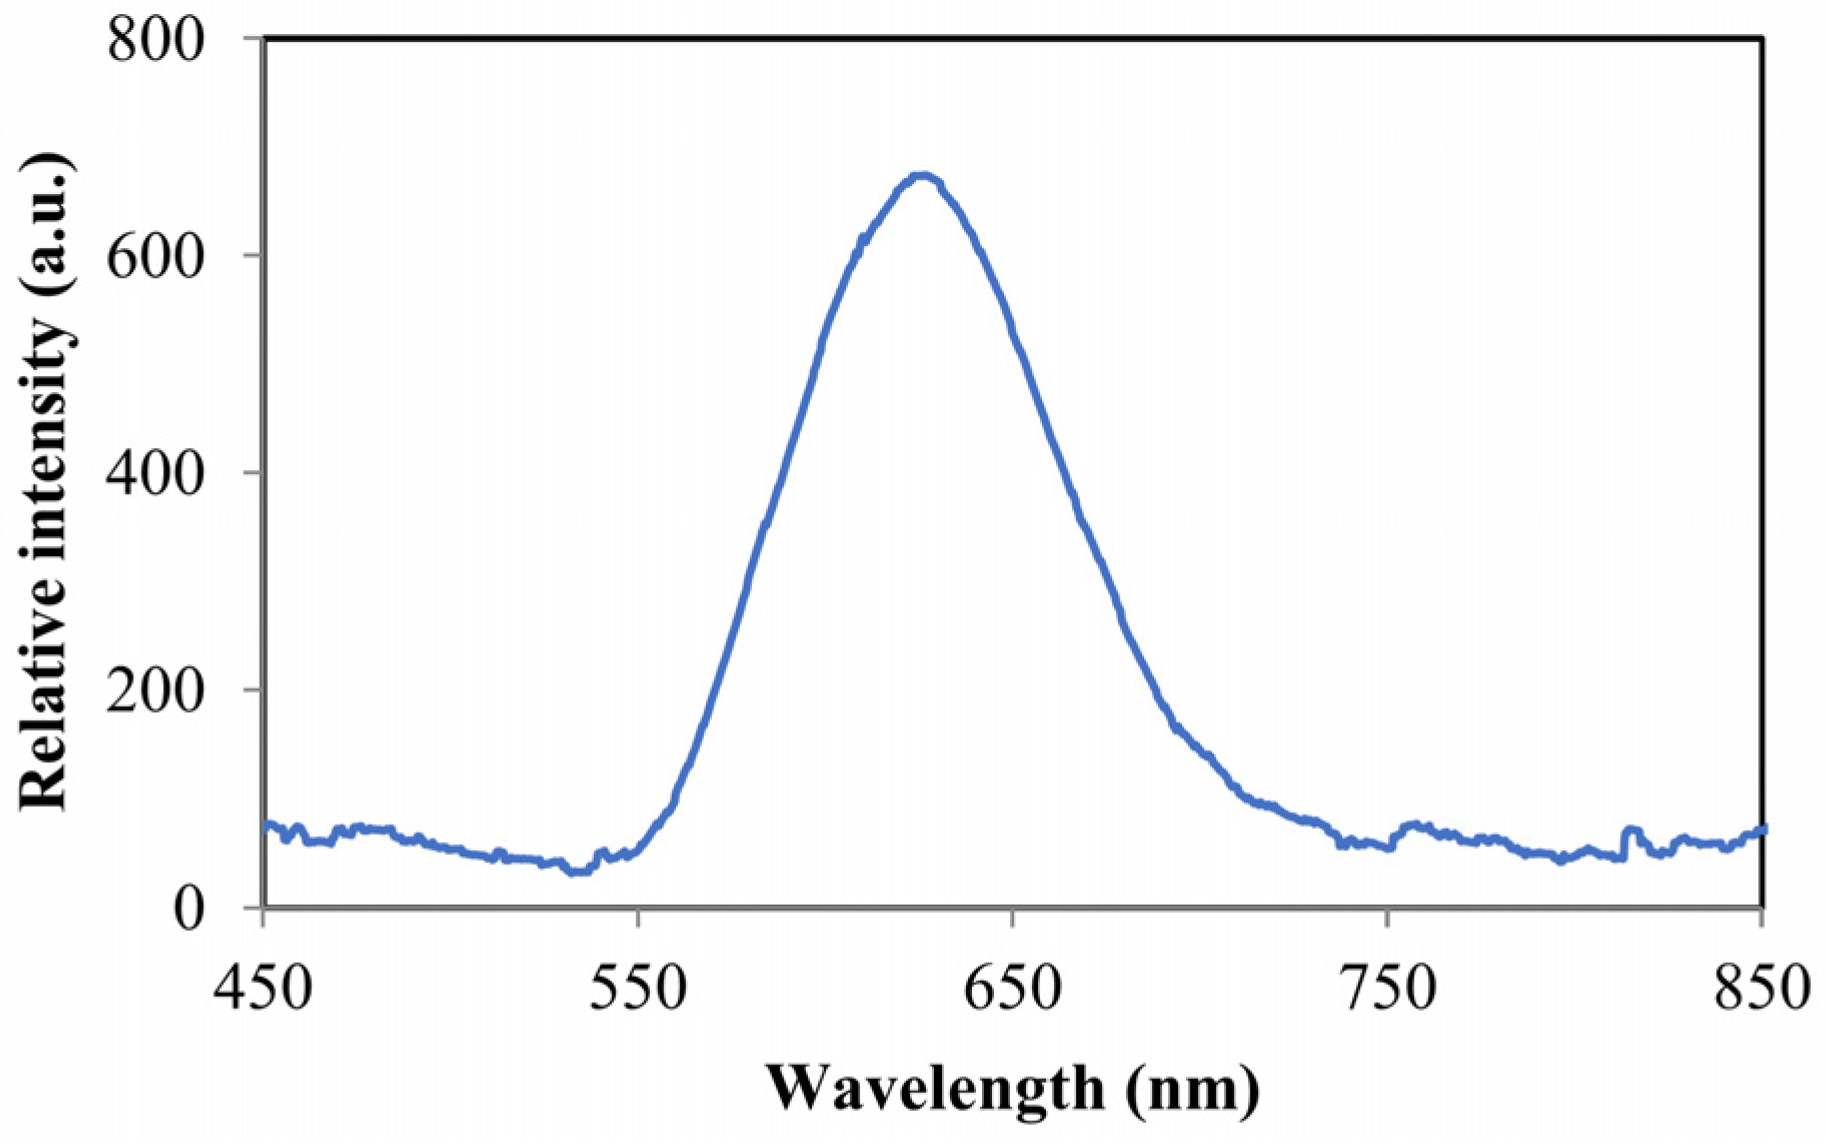
The emission spectrum of the doped fiber at 90 °C for 8 h is measured as shown in Figure 7. The doped section (~10 cm) of the fiber is illuminated by a 365 nm light tube (ZF-20D, Jiapeng Technology, Shanghai, China), while one end of the fiber is connected to the optical spectrum analyzer (USB2000, Ocean Optics) to obtain the emission spectrum. The peak of the fluorescence spectrum is about 620 µm, which is consistent with results that have been previously reported [30]. It has been found that the peak of the fluorescence spectrum of RhB-doped POFs depends on the doping concentration and the fiber length [30]. The emission spectrum further confirms that RhB molecules have been successfully doped in POFs, and the doped POFs are still usable after doping at 90 °C. Nevertheless, preliminary experimental results show that the mechanical properties, including the elastic modulus and yield stress, of POFs slightly degrade after doping.

4. Conclusions

PMMA-based step-index POFs were doped by RhB in aqueous solutions near the Tg of PMMA. Macroscopic and microscopic changes in the POFs due to the doping process were characterized. The concentration of RhB in the core and the cladding was measured, and the transmission spectrum of the POF during doping was investigated. The results show that POFs shrank in the axial direction and expanded radially due to the relaxation of the fiber core during doping at 90, 100, and 110 °C in both aqueous solutions and water/methanol solutions. The wrinkled cladding of the doped POFs suggests that relaxation mainly occurs in the fiber core, which means the orientation of the polymer in the fiber core is much higher than that in the cladding. It explains why the fiber core is much more difficult to dope than the cladding. As the doping temperature was raised to 100 and 110 °C, the relaxation of the fiber core was dramatic enough so that a considerable amount of the RhB was measured in the fiber core. After doping in water at 110 °C for 8 h, the measured concentration of RhB in the fiber core reached 0.479 mg/g. In contrast to the doping temperature range of 50–80 °C, the addition of methanol to the doping solution lowered the concentration of the RhB in the fiber cladding and the core in the range of 90–110 °C. Additionally, it was found that doping at 90 °C in the aqueous solution does not increase the fiber loss, regardless of the dramatic macroscopic and microscopic changes in the POFs, indicating that doping PMMA-based POFs near their Tg is feasible.

Author Contributions

Conceptualization, Z.-F.Z.; methodology, Y.M.; investigation, Y.M. and D.F.; writing—original draft preparation, Y.M. and D.F.; writing—review and editing, Z.-F.Z.; visualization, Y.M. and D.F.; supervision, Z.-F.Z.; project administration, Z.-F.Z.; funding acquisition, Z.-F.Z. All authors have read and agreed to the published version of the manuscript.

Funding

This research was funded by Ningxia Normal University, grant number XJZDD2322.

Institutional Review Board Statement

Not applicable.

Informed Consent Statement

Not applicable.

Data Availability Statement

Relevant data are available from the authors upon reasonable request.

Conflicts of Interest

The authors declare no conflicts of interest.

References

  1. Zhao, Y.; Lin, Z.; Dong, S.; Chen, M. Review of Wearable Optical Fiber Sensors: Drawing a Blueprint for Human Health Monitoring. Opt. Laser Technol. 2023, 161, 109227. [Google Scholar] [CrossRef]
  2. Sadeque, M.S.B.; Chowdhury, H.K.; Rafique, M.; Durmuş, M.A.; Ahmed, M.K.; Hasan, M.M.; Erbaş, A.; Sarpkaya, İ.; Inci, F.; Ordu, M. Hydrogel-Integrated Optical Fiber Sensors and Their Applications: A Comprehensive Review. J. Mater. Chem. C 2023, 11, 9383–9424. [Google Scholar] [CrossRef]
  3. Kuang, R.; Wang, Z.; Ma, L.; Wang, H.; Chen, Q.; Junior, A.L.; Kumar, S.; Li, X.; Marques, C.; Min, R. Smart Photonic Wristband for Pulse Wave Monitoring. Opto-Electron. Sci. 2024, 3, 240009. [Google Scholar] [CrossRef]
  4. Ngiejungbwen, L.A.; Hamdaoui, H.; Chen, M.-Y. Polymer Optical Fiber and Fiber Bragg Grating Sensors for Biomedical Engineering Applications: A Comprehensive Review. Opt. Laser Technol. 2024, 170, 110187. [Google Scholar] [CrossRef]
  5. Zhu, Z.; Sun, S.; Chai, X.; Gao, J.; Lu, M.; Wu, Z.; Gao, Y.; Feng, T.; Bai, X.; Zhang, Y.; et al. Quantum Dot-Doped Optical Fibers. Laser Photonics Rev. 2024, 18, 2301388. [Google Scholar] [CrossRef]
  6. Hemming, A.; Simakov, N.; Haub, J.; Carter, A. A Review of Recent Progress in Holmium-Doped Silica Fibre Sources. Opt. Fiber Technol. 2014, 20, 621–630. [Google Scholar] [CrossRef]
  7. Bradley, D.A.; Hugtenburg, R.P.; Nisbet, A.; Abdul Rahman, A.T.; Issa, F.; Mohd Noor, N.; Alalawi, A. Review of Doped Silica Glass Optical Fibre: Their TL Properties and Potential Applications in Radiation Therapy Dosimetry. Appl. Radiat. Isot. 2012, 71, 2–11. [Google Scholar] [CrossRef]
  8. Large, M.C.J.; Ponrathnam, S.; Argyros, A.; Pujari, N.S.; Cox, F. Solution Doping of Microstructured Polymer Optical Fibres. Opt. Express 2004, 12, 1966–1971. [Google Scholar] [CrossRef]
  9. Ayesta, I.; Azkune, M.; Arrospide, E.; Arrue, J.; Illarramendi, M.; Durana, G.; Zubia, J. Fabrication of Active Polymer Optical Fibers by Solution Doping and Their Characterization. Polymers 2018, 11, 52. [Google Scholar] [CrossRef]
  10. Ma, C.; Tian, C.; Zhang, Z.F. Doping of Polymer Optical Fiber Cladding in the Solution of Water and Methanol at Elevated Temperature. Polym. Bull. 2024, 81, 4307–4317. [Google Scholar] [CrossRef]
  11. Yu, H.C.Y.; Argyros, A.; Leon-Saval, S.G.; Fuerbach, A.; Efimov, A.; Barton, G.W. Emission Properties of Quantum Dots in Polymer Optical Fibres. Opt. Express 2009, 17, 21344–21349. [Google Scholar] [CrossRef]
  12. Whittaker, C.A.; Perret, A.; Fortier, C.W.; Tardif, O.-M.; Lamarre, S.A.; Morency, S.; Larivière, D.; Beaulieu, L.; Messaddeq, Y.; Allen, C.N. Light-Generating CdSe/CdS Colloidal Quantum Dot-Doped Plastic Optical Fibers. ACS Appl. Nano Mater. 2020, 3, 6478–6488. [Google Scholar] [CrossRef]
  13. Arrue, J.; García-Ramiro, B.; Jiménez, F.; Illarramendi, M.A.; Ayesta, I.; Zubia, J.; Evert, R.; Zaremba, D. Gain in Europium-Chelate-Doped Polymer-Optical-Fiber Amplifiers. J. Opt. Soc. Am. B 2018, 35, 2770. [Google Scholar] [CrossRef]
  14. Vieira, A.; Arrue, J.; García-Ramiro, B.; Jiménez, F.; Illarramendi, M.A.; Zubia, J. POF-Based Solar Concentrators Incorporating Dyes and Europium Chelates. Materials 2021, 14, 2667. [Google Scholar] [CrossRef]
  15. Arrue, J.; Jiménez, F.; Ayesta, I.; Illarramendi, M.A.; Zubia, J. Polymer-Optical-Fiber Lasers and Amplifiers Doped with Organic Dyes. Polymers 2011, 3, 1162–1180. [Google Scholar] [CrossRef]
  16. Sheeba, M.; Thomas, K.J.; Rajesh, M.; Nampoori, V.P.N.; Vallabhan, C.P.G.; Radhakrishnan, P. Multimode Laser Emission from Dye Doped Polymer Optical Fiber. Appl. Opt. 2007, 46, 8089–8094. [Google Scholar] [CrossRef]
  17. Jaramillo-Ochoa, L.; Narro-García, R.; Ocampo, M.A.; Quintero-Torres, R. High Stability of Polymer Optical Fiber with Dye Doped Cladding for Illumination Systems. J. Lumin. 2017, 184, 205–210. [Google Scholar] [CrossRef]
  18. Jiang, N.; Ahmed, R.; Rifat, A.A.; Guo, J.; Yin, Y.; Montelongo, Y.; Butt, H.; Yetisen, A.K. Functionalized Flexible Soft Polymer Optical Fibers for Laser Photomedicine. Adv. Opt. Mater. 2018, 6, 1701118. [Google Scholar] [CrossRef]
  19. Hu, X.; Woyessa, G.; Kinet, D.; Janting, J.; Nielsen, K.; Bang, O.; Caucheteur, C. BDK-Doped Core Microstructured PMMA Optical Fiber for Effective Bragg Grating Photo-Inscription. Opt. Lett. 2017, 42, 2209–2212. [Google Scholar] [CrossRef]
  20. He, J.; Chan, W.-K.; Cheng, X.; Tse, M.-L.; Lu, C.; Wai, P.-K.; Savovic, S.; Tam, H.-Y. Experimental and Theoretical Investigation of the Polymer Optical Fiber Random Laser with Resonant Feedback. Adv. Opt. Mater. 2018, 6, 1701187. [Google Scholar] [CrossRef]
  21. Shukla, S.K.; Kushwaha, C.S.; Guner, T.; Demir, M.M. Chemically Modified Optical Fibers in Advanced Technology: An Overview. Opt. Laser Technol. 2019, 115, 404–432. [Google Scholar] [CrossRef]
  22. Parola, I.; Arrospide, E.; Recart, F.; Illarramendi, M.; Durana, G.; Guarrotxena, N.; García, O.; Zubia, J. Fabrication and Characterization of Polymer Optical Fibers Doped with Perylene-Derivatives for Fluorescent Lighting Applications. Fibers 2017, 5, 28. [Google Scholar] [CrossRef]
  23. Liang, H.; Zheng, Z.; Li, Z.; Xu, J.; Chen, B.; Zhao, H.; Zhang, Q.; Ming, H. Fabrication and Amplified Spontaneous Emission of Eu(DBM) 3Phen Doped Step-Index Polymer Optical Fiber. Opt. Quantum Electron. 2004, 36, 1313–1322. [Google Scholar] [CrossRef]
  24. Jiang, C.; Kuzyk, M.G.; Ding, J.-L.; Johns, W.E.; Welker, D.J. Fabrication and Mechanical Behavior of Dye-Doped Polymer Optical Fiber. J. Appl. Phys. 2002, 92, 4–12. [Google Scholar] [CrossRef]
  25. Qiu, S.; Chu, H.; Zou, Y.; Xiang, C.; Zhang, H.; Sun, L.; Xu, F. Thermochemical Studies of Rhodamine B and Rhodamine 6G by Modulated Differential Scanning Calorimetry and Thermogravimetric Analysis. J. Therm. Anal. Calorim. 2016, 123, 1611–1618. [Google Scholar] [CrossRef]
  26. Fasano, A.; Woyessa, G.; Janting, J.; Rasmussen, H.K.; Bang, O. Solution-Mediated Annealing of Polymer Optical Fiber Bragg Gratings at Room Temperature. IEEE Photonics Technol. Lett. 2017, 29, 687–690. [Google Scholar] [CrossRef]
  27. Tian, C.; Ma, C.; Han, X.; Zhang, Z.F. Doping of Polymer Optical Fiber Cladding by Rhodamine 6G in Aqueous Solution at Elevated Temperature. Polym. Bull. 2023, 80, 3395–3403. [Google Scholar] [CrossRef]
  28. Ayesta, I.; Azkune, M.; Illarramendi, M.A.; Arrospide, E.; Zubia, J.; Durana, G. Fabrication and Characterization of Active Polymer Optical Fibers with a Ring-Doped Structure. Opt. Fiber Technol. 2023, 75, 103209. [Google Scholar] [CrossRef]
  29. Stajanca, P.; Cetinkaya, O.; Schukar, M.; Mergo, P.; Webb, D.J.; Krebber, K. Molecular Alignment Relaxation in Polymer Optical Fibers for Sensing Applications. Opt. Fiber Technol. 2016, 28, 11–17. [Google Scholar] [CrossRef]
  30. de la Rosa-Cruz, E.; Dirk, C.W.; RodrÍguez, O.; CastaÑo, V.M. Characterization of Fluorescence Induced by Side Illumination of Rhodamine B Doped Plastic Optical Fibers. Fiber Integr. Opt. 2001, 20, 457–464. [Google Scholar] [CrossRef]
Figure 1. Photos of (a) POFs after doping for 1, 2, 4, 6, 8 h in water dissolved with RhB at 90 °C and (b) the cross-section of the fiber doped for 8 h.
Photonics 11 00966 g001
Figure 2. Diameter increase in POFs after doping in water dissolved with RhB at 90, 100, and 110 °C.
Photonics 11 00966 g002
Figure 3. SEM photo of the POF doped in water at 90 °C for 8 h. The fiber surface becomes wrinkled. Similar surface morphology is observed for fibers doped at 100 and 110 °C, as well as in water/methanol solutions.
Photonics 11 00966 g003
Figure 4. SEM photo of the surface of the fiber core after doping in water at 110 °C for 8 h.
Photonics 11 00966 g004
Figure 5. Transmission spectrum of the POF during doping in water at 90 °C.
Photonics 11 00966 g005
Figure 6. Absorption spectrum of the doping solution (0.5 wt% RhB in water) heated at 110 °C for various amounts of time.
Photonics 11 00966 g006
Figure 7. Emission spectrum of the doped side-excited fiber by a 365 nm light tube.
Photonics 11 00966 g007
Table 1. Measured RhB concentration in the fiber cladding and the core after 8 h of doping at three different temperatures in water and methanol (MeOH) solutions.
Doping
Temperature
(°C)
RhB Concentration of the Cladding (mg/g)RhB Concentration of the Core
(mg/g)
H2OH2O + 10% MeOHH2O + 20% MeOHH2OH2O + 10% MeOHH2O + 20% MeOH
907.904.710.4890.3050.2780.043
10010.37.210.2940.3890.1160.029
11011.58.700.3050.4790.2220.031
Disclaimer/Publisher’s Note: The statements, opinions and data contained in all publications are solely those of the individual author(s) and contributor(s) and not of MDPI and/or the editor(s). MDPI and/or the editor(s) disclaim responsibility for any injury to people or property resulting from any ideas, methods, instructions or products referred to in the content.