Article

Inscription and Thermal Stability of Fiber Bragg Gratings in Hydrogen-Loaded Optical Fibers Using a 266 nm Pulsed Laser

by
Xiangxi Zhu
1,†,
Zixuan Xin
1,†,
Haoming Zhu
1,
Hongye Wang
2,
Xin Cheng
3,
Hwa-Yaw Tam
3,
Hang Qu
1,* and
Xuehao Hu
4,*
1
Research Center for Advanced Optics and Photoelectrics, Department of Physics, College of Science, Shantou University, Daxue Lu 243, Shantou 515063, China
2
The Key Laboratory of In-Fiber Integrated Optics of Ministry of Education, College of Physics and Optoelectronic Engineering, Harbin Engineering University, Harbin 150001, China
3
Department of Electrical and Electronic Engineering, The Hong Kong Polytechnic University, Kowloon, Hong Kong SAR 997700, China
4
Department of Electromagnetism and Telecommunication, University of Mons, Boulevard Dolez 31, 7000 Mons, Belgium
*
Authors to whom correspondence should be addressed.
These authors contributed equally to this work.
Photonics 2024, 11(11), 1092; https://doi.org/10.3390/photonics11111092
Submission received: 16 September 2024 / Revised: 12 November 2024 / Accepted: 18 November 2024 / Published: 20 November 2024

Abstract

:
Fiber Bragg gratings (FBGs) have gained substantial research interest due to their exceptional sensing capabilities. Traditionally, FBG fabrication has required the use of pre-hydrogenated fibers and high-cost laser systems such as excimer lasers at 193 nm or femtosecond lasers. In this study, we present the first instance of FBG inscription in hydrogen-loaded, standard single-mode silica optical fibers using a more affordable 266 nm solid-state pulsed laser combined with a scanning phase mask lithography technique. We systematically explored the effects of pulse energy and scanning speed on the quality and spectral characteristics of the gratings, achieving reflectivities as high as 99.81%. Additionally, we tracked the spectral evolution during the FBG inscription process, demonstrating uniform growth of the core mode. We also investigated the stability of the core mode during a 24-h thermal annealing process up to 150 °C. The sensitivity was 10.7 pm/°C in the range of 0 to 130 °C. Furthermore, strain measurement was conducted based on the FBG annealed at 100 °C, showing a sensitivity of 0.943 pm/µε in the range of 0 to 1667 µε.

1. Introduction

Fiber Bragg gratings (FBGs) include several types of structures such as standard FBGs, tilted FBGs (TFBGs), chirped FBGs, etc. Among these, standard FBGs are the most popular ones, which are optical devices consisting of periodic variations in the refractive index of the fiber core. It selectively reflects specific wavelengths of light, similar to a mirror. Due to this unique property, FBGs are widely used in various applications including telecommunications, sensing, and laser technologies [1,2,3]. FBG sensors offer numerous advantages including a compact structure, immunity to electromagnetic interference, resistance to corrosion, rapid response times, and the ability to perform multi-parameter and quasi-distributed sensing [4,5,6].
FBGs are fabricated by periodically modulating the refractive index along the fiber core. To achieve high Bragg reflectivity, the photosensitivity of the fiber can be enhanced through various methods such as doping with elements like germanium (Ge) or tin (Sn) [7], flame brushing [8], irradiation with 193-nm ArF excimer lasers [9,10,11,12], boron co-doping [13,14], or by loading the fiber with high-pressure hydrogen gas [15]. Among these methods, high-pressure hydrogen loading is recognized as one of the most effective and economical ways to significantly increase the photosensitivity in traditional GeO2-doped fibers [16].
In typical optical fibers, the tensile stress between the core and cladding is fixed due to the rapid cooling process during fiber drawing [17]. The diffusion of hydrogen within the fiber alters this stress [18], increasing the fiber’s photosensitivity by raising the effective refractive index by approximately 0.05% [19]. When hydrogen-loaded optical fibers are exposed to UV light, the hydrogen molecules dissociate and react with germanium-related defects, forming Ge-OH bonds, which occurs exclusively in the fiber core [16]. This reaction depletes hydrogen in the core, reducing the refractive index. However, the diffusion of hydrogen molecules from the cladding to the core restores a dynamic equilibrium in hydrogen concentration, subsequently increasing the refractive index [19]. Additionally, the hydroxyl groups produced by this photochemical process can reduce the residual stress in the fiber [20].
FBG inscription is typically performed using holographic interference or phase mask techniques. The holographic method employs an interferometer to split the laser beam, which is then recombined to produce an interference pattern [21]. However, due to the low coherence length of UV lasers, fabricating FBGs using UV lasers was challenging until 1993, when Hill et al. [22] introduced the phase mask technique based on proximity exposure. This method significantly lowers the spatial coherence requirements of the exposure source, making it ideal for large-scale grating production with a consistent grating period. For grating inscription in hydrogen-loaded fibers using the phase mask technique, previous studies have predominantly employed UV-pulsed lasers with wavelengths of 244 nm [23], 246 nm [24], 248 nm [23,25,26,27], 255 nm [24], and 193 nm [23,28,29], among others. In addition, early work by Åslund et al. [30] and Kohnke et al. [31] demonstrated that for FBG inscription in hydrogen-loaded fibers, pre-exposure by 244-nm, 248-nm, and 193-nm lasers could permanently enhance the fiber photosensitivity. Therefore, the phase mask technique combining UV laser is the most effective way for large-scale grating production. However, lasers used for grating inscription, such as those emitting at 248 nm and 193 nm, tend to be relatively expensive.
This study marks the first reported FBG inscription in hydrogen-loaded optical fibers using a cost-effective 266 nm solid-state pulsed laser combined with scanning phase mask technology. We systematically investigated the effects of pulse energy and laser scanning speed on grating quality, achieving a maximum reflectivity of 99.81%. Additionally, we recorded the dynamic transmission spectra during the inscription process. Post-inscription, the grating was thermally annealed for 24 h up to 150 °C. The sensitivity was 10.7 pm/°C over a range of 0 to 130 °C. Additionally, the strain measurement was performed on the FBG annealed at 100 °C, demonstrating a sensitivity of 0.943 pm/µε over the range of 0 to 1667 µε. This work paves the way for the inscriptions of other types of FBGs, such as TFBGs, chirped gratings, and apodized gratings, at a low cost.

2. Experimental Setup

For our experiments, we utilized a standard single-mode telecommunication fiber (Corning SMF-28, Corning, New York, NY, USA). Prior to the inscription of FBGs, the optical fiber was subjected to hydrogen loading in a controlled environment. The fiber was placed in a hydrogen chamber under a pressure of 12 MPa at a temperature of 70 °C for a duration of 10 days, significantly enhancing its photosensitivity.
The FBG inscription was performed using a 266 nm solid-state pulsed laser (DPS-266-Q, Changchun New Industries Optoelectronics Tech. Co. Ltd., Changchun, China) that features a pulse width of approximately 7 ns, a circular beam diameter of about 2.5 mm at the laser output, and a beam divergence angle of roughly 1 mrad. The pulse repetition rate was fixed at 20 Hz for this work. A phase mask, specifically optimized for a 266 nm wavelength (Phasemask Technology LLC, Fremont, FL, USA) with a grating pitch of 1090 nm, was positioned in close proximity to the fiber to facilitate the inscription process.
The experimental setup is depicted in Figure 1. The beam emitted from the solid-state laser was initially directed by a mirror mounted on a motorized translation stage toward a cylindrical lens. The diameter of the beam at the cylindrical lens was approximately 4 mm, slightly larger than the 2.5 mm at the laser output due to the mild divergence of the laser. The cylindrical lens (focal length: 20 cm) then focused the beam down to a width of about 100 μm along the fiber core, thereby enhancing the power density at the fiber core. The focused beam, featuring 4 mm in its length and 100 μm in its width, was scanned over a 12 mm segment of the fiber, resulting in the formation of a 16 mm-long grating.
During the inscription process, real-time spectral data were recorded using a grating interrogator (FS22SI, HBM Fiber Sensing, Moreira, Portugal), which offers a wavelength resolution of 1 pm and a scanning rate of 1 Hz.

3. FBG Inscriptions

3.1. FBG Inscriptions Scanned at 0.012 mm/s

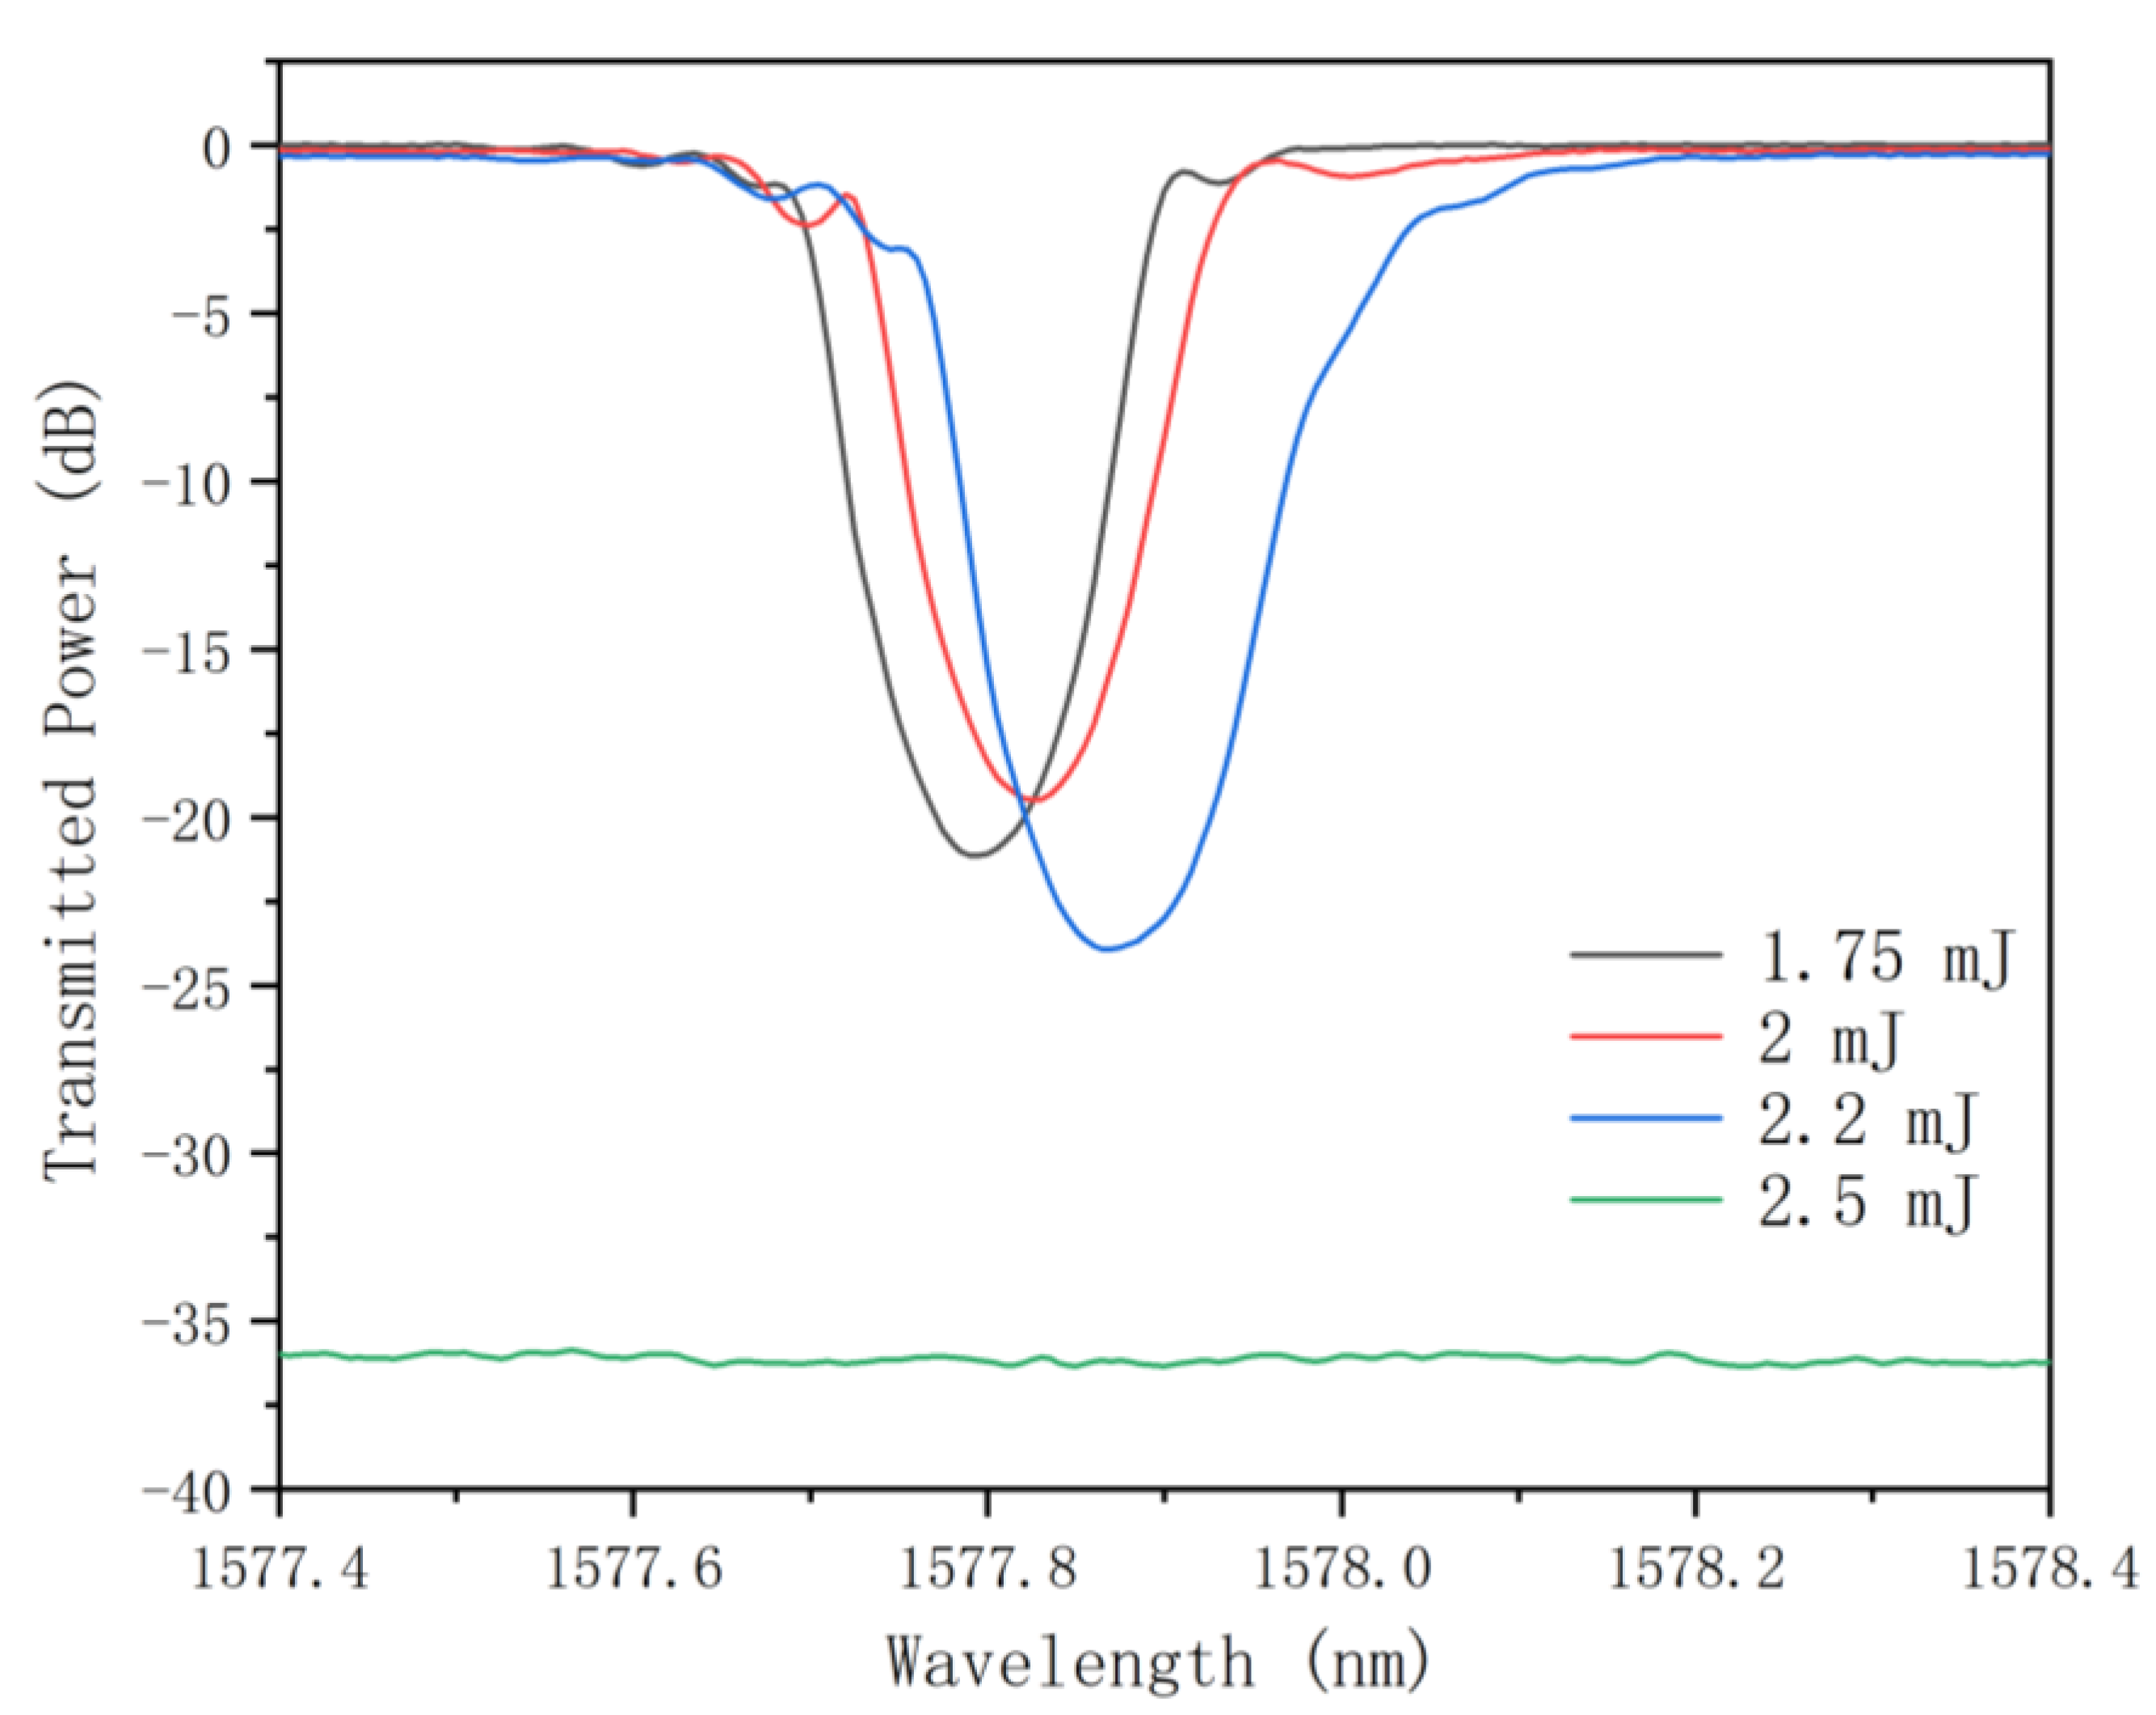
FBGs were inscribed under a fixed pulse repetition rate of 20 Hz and a scanning speed of 0.012 mm/s, with pulse energies ranging from 1.75 mJ to 2.5 mJ. The resulting photo-induced transmission spectra, which displayed the differences between the spectra before and after the grating inscription, are illustrated in Figure 2.
The data show that the out-of-band insertion loss was negligible, while the transmission depths of the core modes were approximately 20 dB for pulse energies of 1.75 mJ and 2 mJ. As the pulse energy increased to 2.2 mJ, the transmission depth improved to 23.9 dB, corresponding to a reflectivity of 99.60%. Additionally, an observable redshift in the Bragg wavelength accompanied the increase in pulse energy.
However, when the pulse energy was further elevated to 2.5 mJ, the fiber experienced breakage due to excessive heat accumulation during the inscription process. The spectrum was severely deformed due to damage inside the fiber induced by the focused laser. This suggests that increasing the pulse energy beyond a certain threshold does not enhance the grating’s performance, but instead causes structural damage to the fiber. Therefore, a pulse energy of 2.2 mJ was deemed optimal for FBG inscription at the specified scanning speed of 0.012 mm/s.
The reflected spectra are presented in Figure 3. As the pulse energy increased from 1.75 mJ to 2.2 mJ, the full width at half maximum (FWHM) first decreased from 0.19 nm to 0.18 nm and then increased to 0.26 nm, while the side-mode suppression ratio (SMSR) decreased from 5.76 dB to 3.06 dB.

3.2. FBG Inscriptions Scanned at 0.01 mm/s

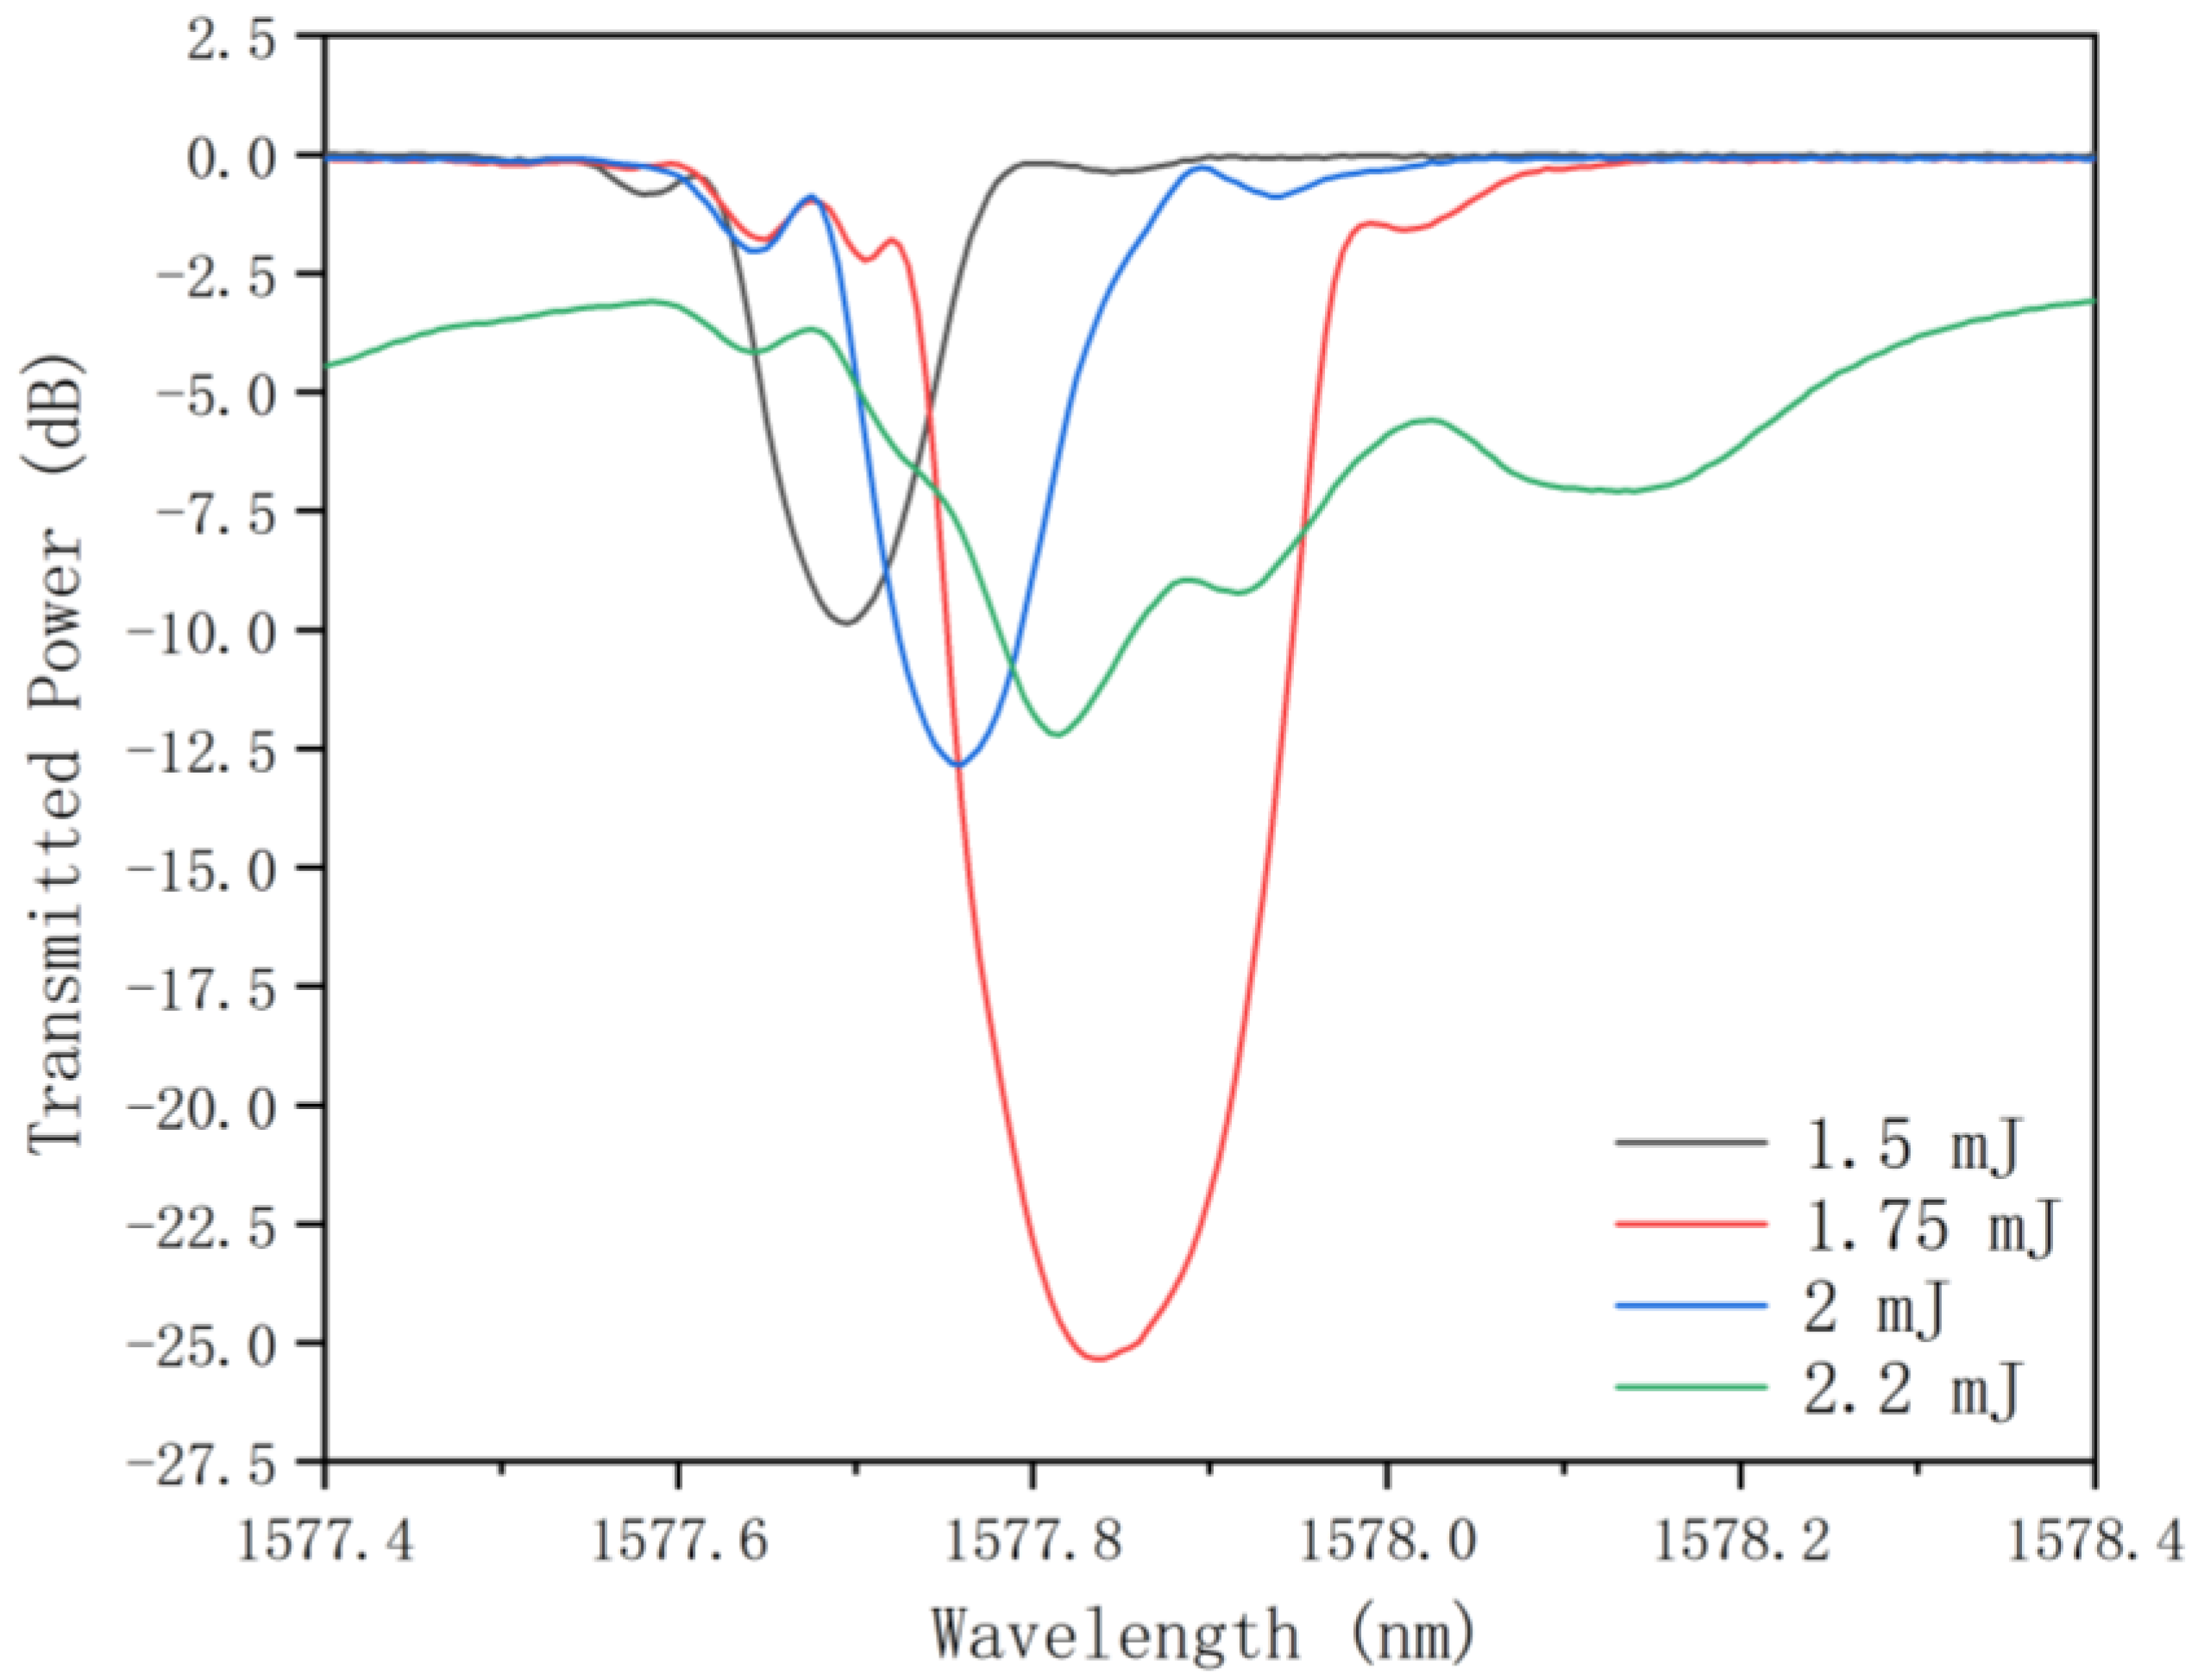
To enhance the reflectivity of the FBG, a lower scanning speed of 0.01 mm/s was employed while maintaining a constant pulse repetition rate of 20 Hz. The pulse energies were varied between 1.5 mJ and 2.2 mJ. The resulting photo-induced transmission spectra are presented in Figure 4.
The data revealed that the transmission depths of the core modes were 9.9 dB, 25.3 dB, and 12.8 dB, with corresponding Bragg wavelengths of 1577.695 nm, 1577.835 nm, and 1577.755 nm for pulse energies of 1.5 mJ, 1.75 mJ, and 2 mJ, respectively. A significant increase in transmission depth was observed when the pulse energy was raised from 1.5 mJ to 1.75 mJ. However, further increasing the pulse energy to 2 mJ resulted in a decrease in transmission depth.
Additionally, the Bragg wavelength showed a redshift as the pulse energy increased from 1.5 mJ to 1.75 mJ. Interestingly, when the pulse energy was increased from 1.75 mJ to 2 mJ, the core mode underwent a blueshift. These counterintuitive results can be attributed to the threshold effect of hydrogen molecule dissociation in the fiber core; once this threshold is reached, further increases in energy do not enhance hydrogen dissociation [32]. Instead, excessive heat accumulation accelerates the diffusion of hydrogen from the cladding to the external environment [33], thereby reducing the refractive index enhancement caused by hydrogen diffusion from the cladding to the core.
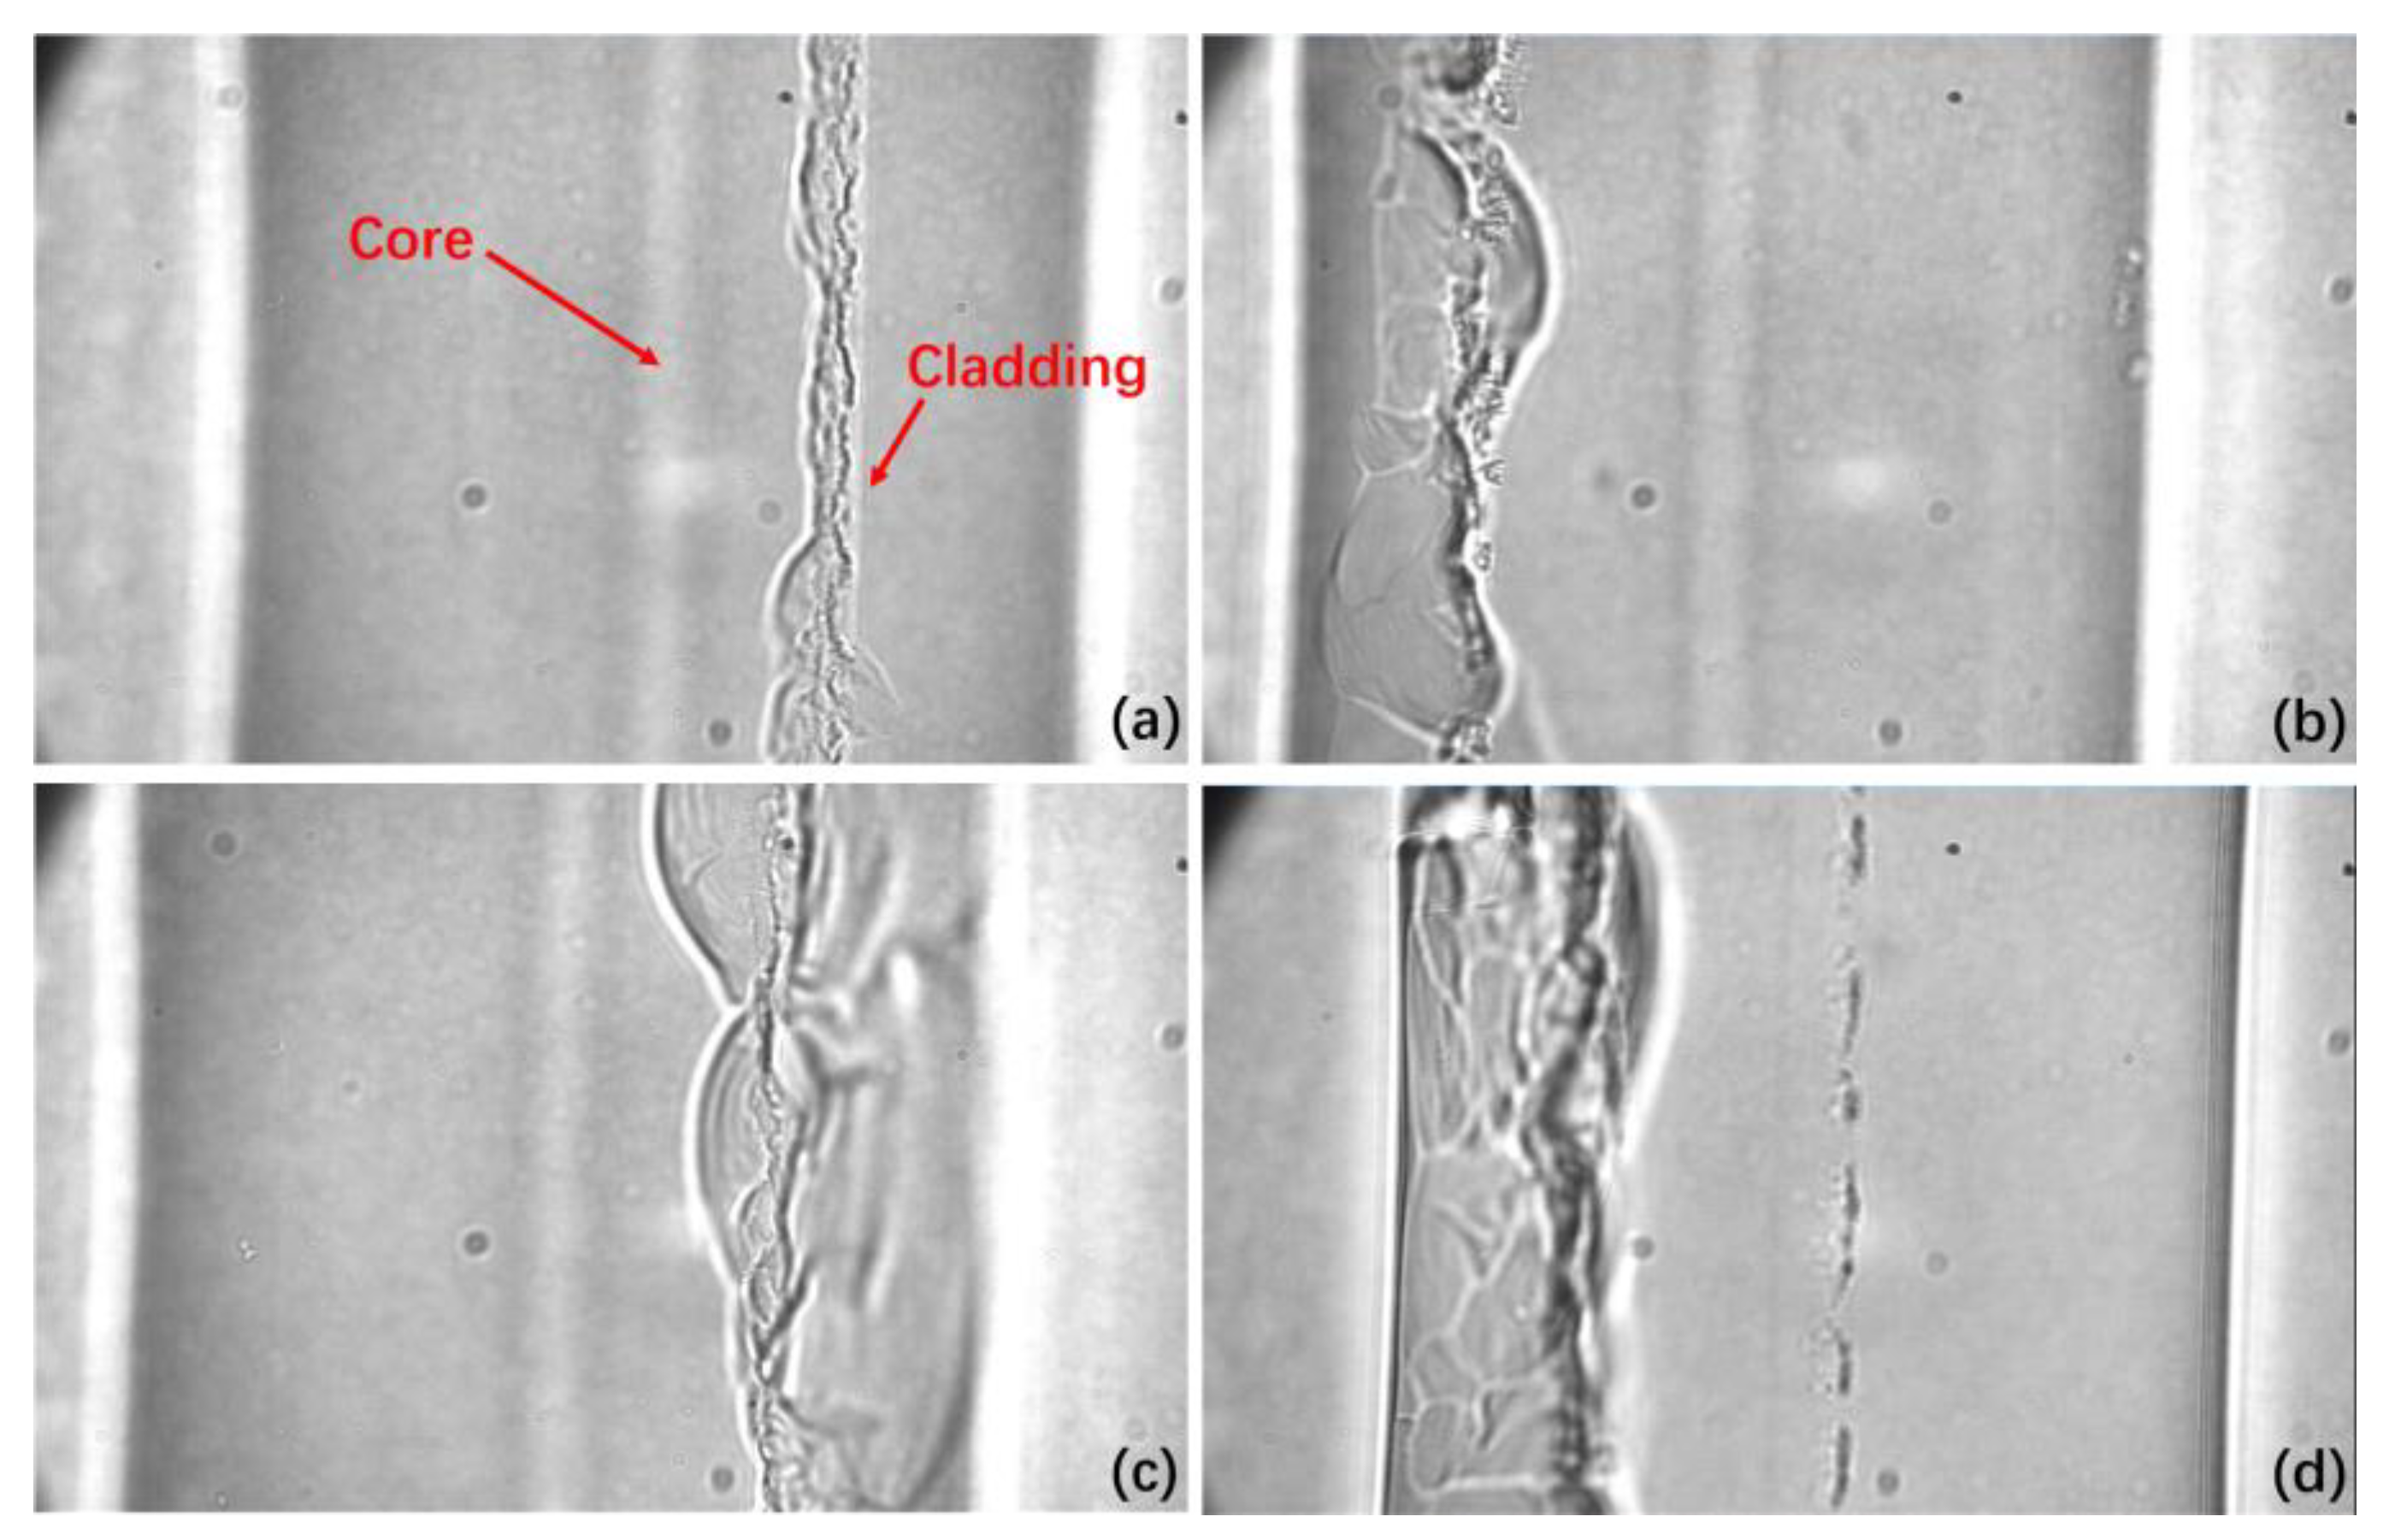
Furthermore, when the pulse energy was increased to 2.2 mJ, the excessive heat accumulation during the writing process caused damage to the silica material of the fiber, rendering the inscription features unobservable. The spectrum was severely deformed due to damage inside the fiber induced by the focused laser. The microscopic images of fibers at different pulse energies are shown in Figure 5. At 1.5 mJ, 1.75 mJ, and 2 mJ, the damaged cladding area expanded with pulse energy, while the fiber core remained intact. However, at 2.2 mJ, in addition to cladding damage, there were noticeable damage points in the fiber core that overlaid or erased the FBG, which would significantly compromise the fiber integrity and FBG performance. Therefore, a pulse energy of 1.75 mJ was considered optimal for FBG inscription at a scanning speed of 0.01 mm/s. It is noteworthy that this optimal pulse energy (1.75 mJ) was lower than the 2.2 mJ required for the higher scanning speed of 0.012 mm/s. Therefore, it was assumed that to achieve a very high reflectivity, the laser pulse energy should be set proportional to the scanning speed. The total energy irradiated on the grating area, forming Ge-OH bonds and generating the core refractive index modulation depth, could determine the quality of the grating.
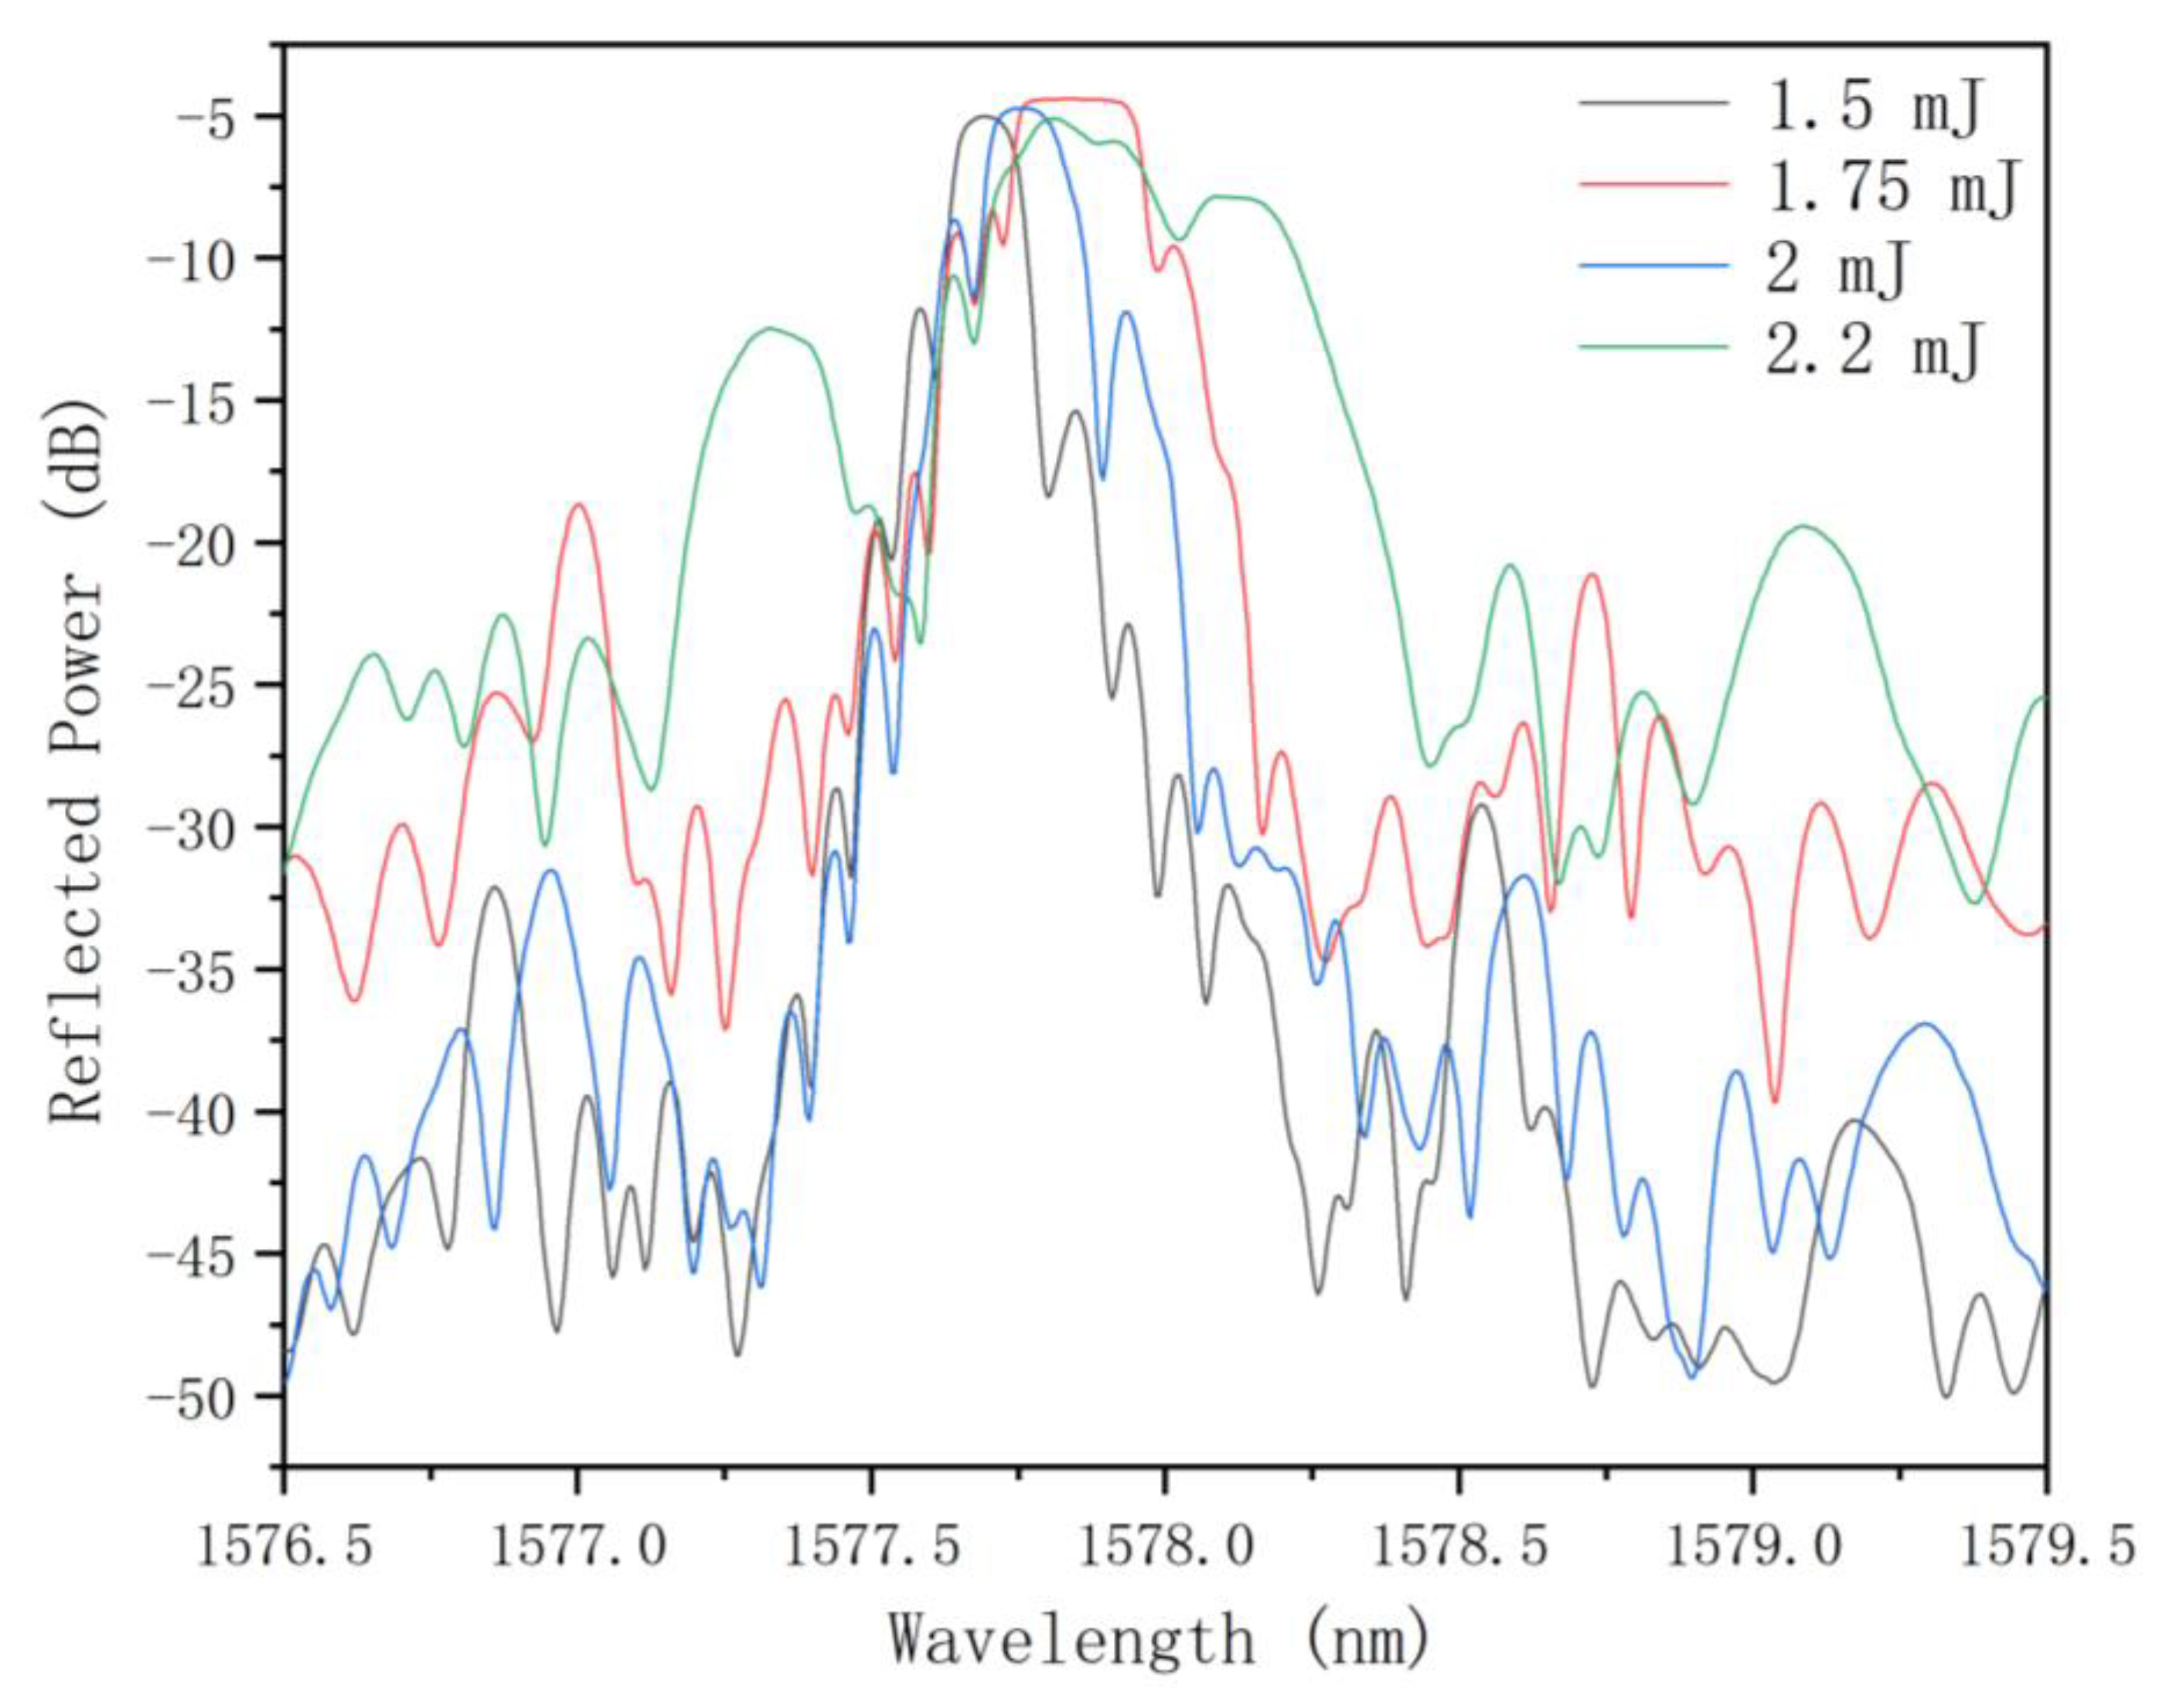
Figure 6 presents the reflected spectra of the FBGs. As the pulse energy increased from 1.5 mJ to 2 mJ, the FWHM first increased from 0.12 nm to 0.23 nm and then decreased to 0.15 nm, while the SMSR decreased from 6.77 dB (1.5 mJ) to ~3.9 dB (1.75 mJ and 2 mJ).

3.3. FBG Inscriptions in Different Scanning Speed

The performance enhancement of the FBG through increased pulse energy is limited due to the fiber’s intrinsic energy tolerance, which restricts further increases in the refractive index modulation amplitude. Consequently, we investigated the impact of different scanning speeds on grating inscription while maintaining a constant pulse repetition rate of 20 Hz and a fixed pulse energy of 1.75 mJ. The scanning speeds were varied between 0.015 mm/s and 0.005 mm/s, resulting in inscription times ranging from 13 min to 40 min for a 12 mm scanning length.
Figure 7 illustrates the performance variations of the FBG with decreasing scanning speed. The results showed that the transmission depth of the grating initially increased from 8.3 dB to 27.1 dB as the scanning speed decreased from 0.015 mm/s to 0.008 mm/s due to enhanced laser irradiation. However, a further reduction in scanning speed to 0.005 mm/s resulted in a decrease in transmission depth, likely due to excessive heat accumulation during the slower inscription process.
Simultaneously, a redshift in the Bragg wavelength was observed as the scanning speed decreased from 0.015 mm/s to 0.005 mm/s, shifting from 1577.690 nm to 1577.935 nm. When the scanning speed was further reduced to 0.003 mm/s, the excessive energy accumulation caused damage to the fiber, compromising the inscription process.
Based on these findings, the optimal combination of parameters for FBG inscription was determined to be a pulse energy of 1.75 mJ and a scanning speed of 0.008 mm/s, which resulted in a reflectivity of 99.81%. Detailed grating data supporting these findings can be found in Table 1.
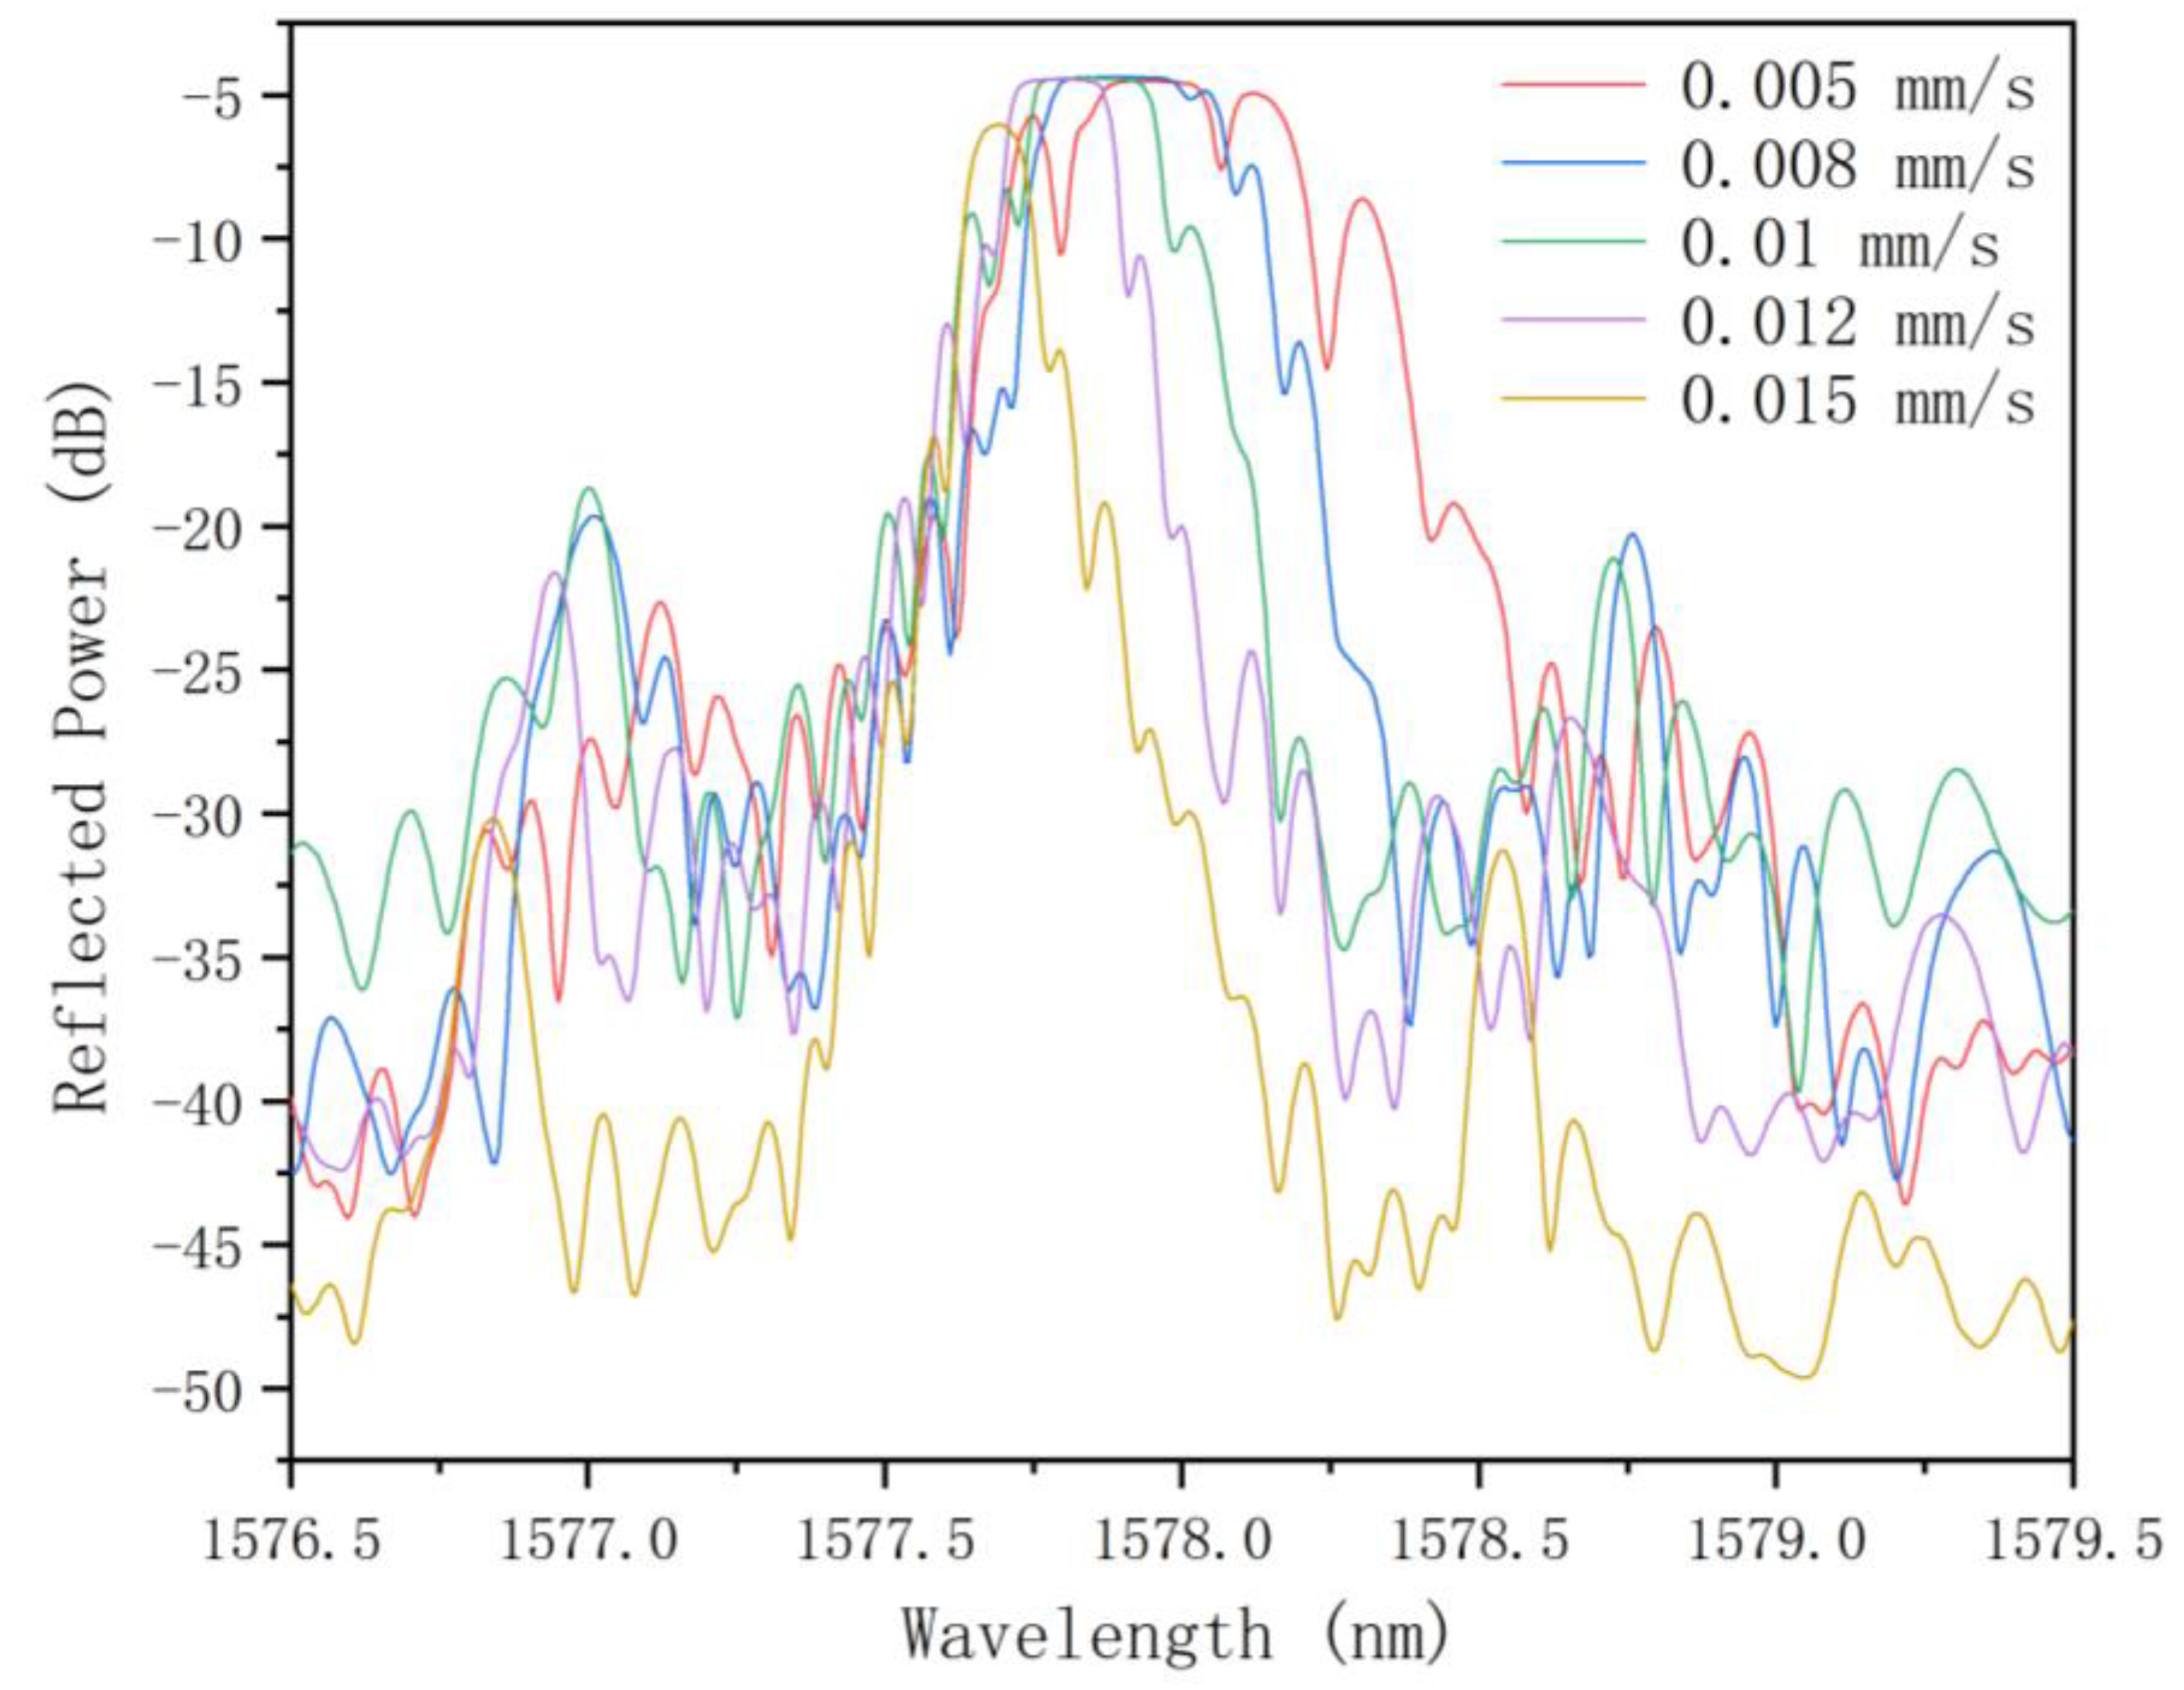
Figure 8 provides the reflected spectra at different scanning speeds. The results showed that as the scanning speed decreased from 0.015 mm/s to 0.008 mm/s, due to the increase in energy accumulation, the FWHM of the reflected spectrum gradually increased from 0.11 nm to 0.33 nm. However, the FWHM decreased to 0.25 nm for the scanning speed of 0.005 mm/s due to the saturation of energy accumulation. However, the SMSR gradually decreased from 7.81 dB to 1.18 dB.
We found that the FWHM corresponded to the reflectivity of the grating. The higher the grating reflectivity, the larger the FWHM. This could be attributed to the large core refractive index modulation depth induced by photo-inscription.

3.4. Dynamic Recording of the Transmitted Spectra During Inscription

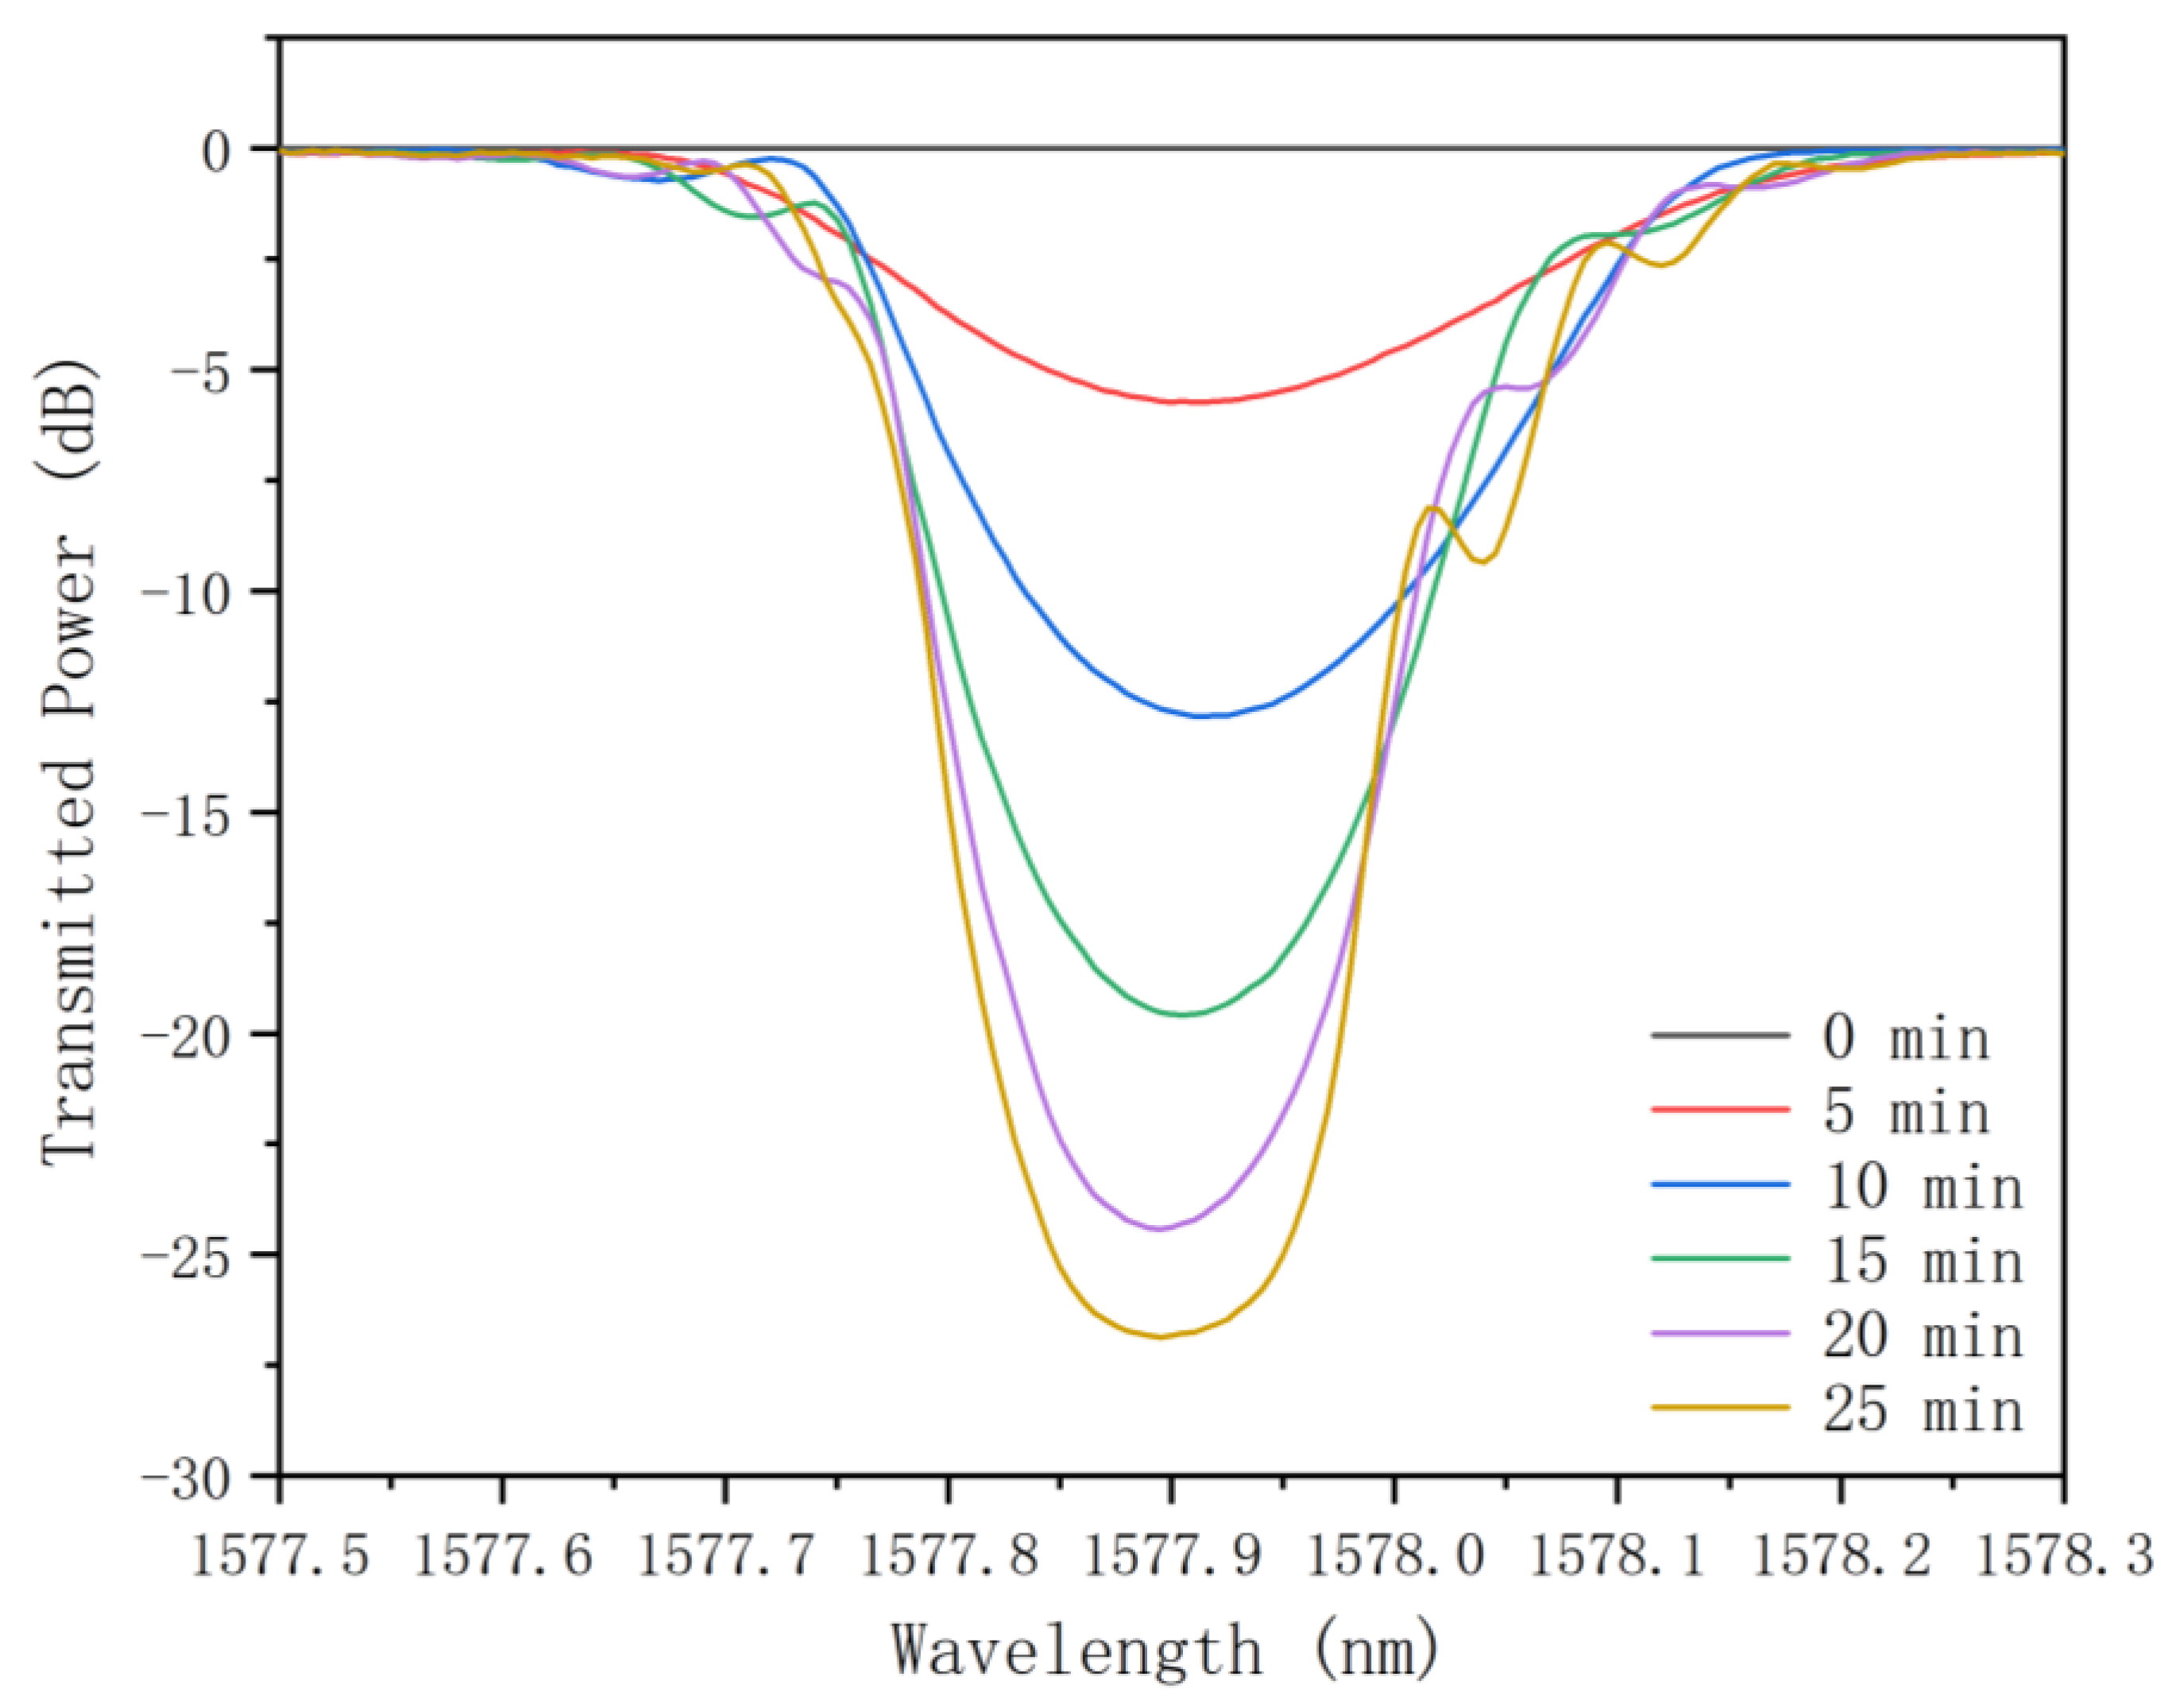
Figure 9 provides an in-depth depiction of the dynamic process of FBG formation, highlighting the evolution of the grating’s transmission spectra as a function of inscription time. The FBG was inscribed using an optimized set of parameters: a scanning speed of 0.008 mm/s, a pulse energy of 1.75 mJ, and a pulse repetition rate of 20 Hz.
During the inscription process, it was evident that the transmission depth of the core mode increased uniformly over time, indicating consistent grating growth. Throughout this period, the central wavelength of the Bragg mode remained remarkably stable, showing minimal variation. This consistency in wavelength suggests that the grating formation is controlled and predictable, leading to the creation of a high-quality FBG with stable spectral characteristics.

4. FBG Thermal Stability and Sensing Applications

4.1. Annealing at 100 °C

Without proper heat treatment, the central wavelength of an FBG inscribed in a hydrogen-loaded fiber exposed to UV laser light tends to shift toward shorter wavelengths over time due to the continuous diffusion of hydrogen out of the fiber [19]. To mitigate the Bragg wavelength drift and enhance the grating’s stability and reliability for practical applications, the FBG, inscribed under optimized conditions (0.008 mm/s, 1.75 mJ, 20 Hz), underwent an annealing process. This process involved heating the grating at 100 °C for half an hour with a linear temperature rise, followed by 24 h at a constant temperature to accelerate the hydrogen out-diffusion.
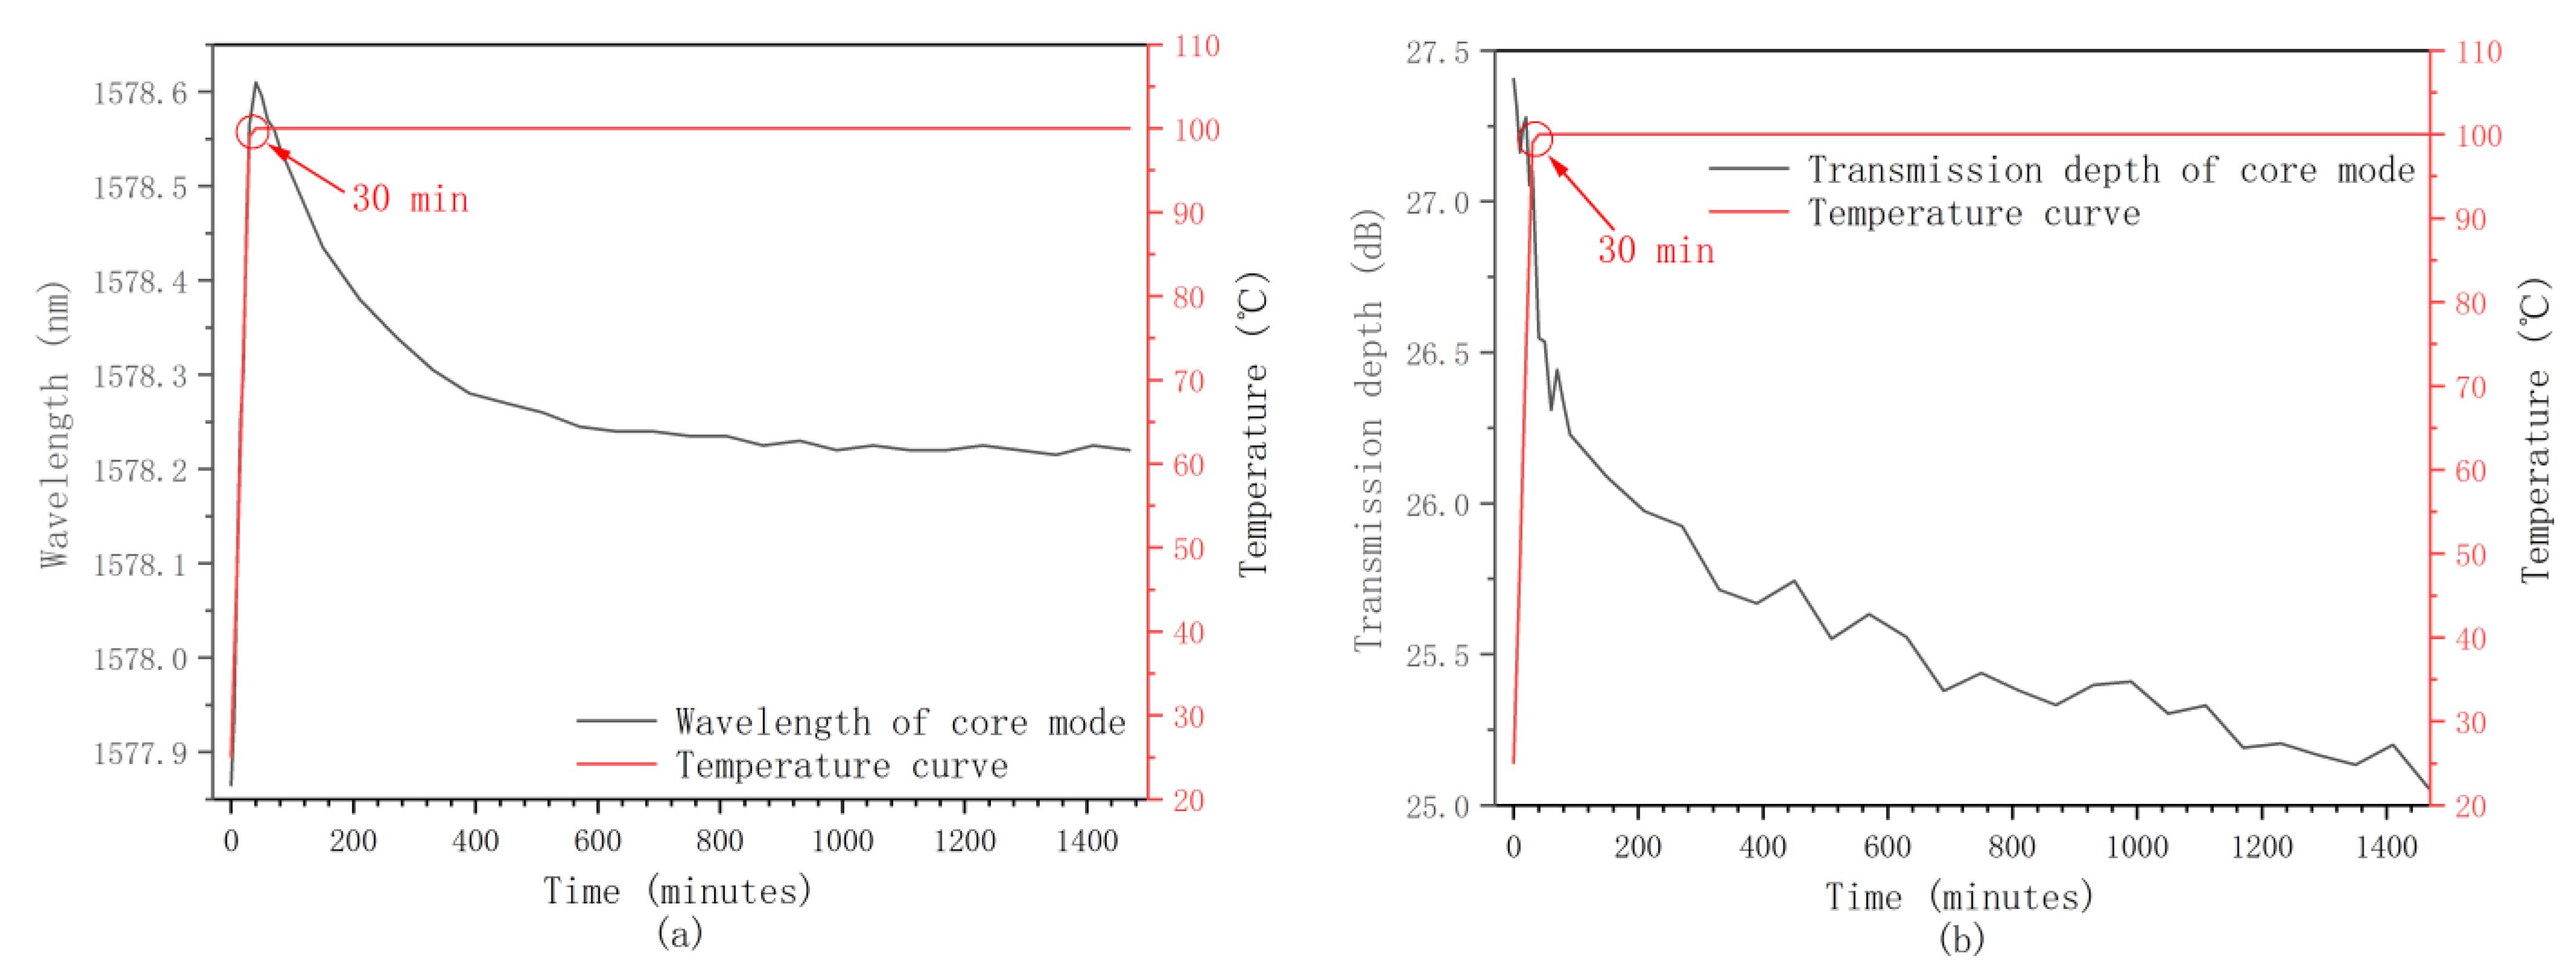
Figure 10a illustrates the temporal evolution of the Bragg wavelength during annealing. Initially, the central wavelength exhibited a significant redshift from 1577.865 nm to 1578.565 nm during the first half-hour of heating, which can be attributed to the temperature-dependent wavelength shift [34]. This was followed by a blueshift from 1578.565 nm to 1578.220 nm during the constant-temperature annealing phase, primarily due to a decrease in the effective refractive index as hydrogen escaped from the fiber at an accelerated rate during heating [19].
Figure 10b depicts the temporal evolution of the transmission depth of the core mode during the annealing process, showing a gradual decrease in transmission depth throughout the entire process. The decrease in transmission depth corresponding to the decrease in grating reflectivity results from the decrease in the core refractive index modulation depth. The latter could also be attributed to the hydrogen escaping from the fiber during the annealing process. These observations are consistent with the previously reported behaviors of FBGs under similar conditions [34].
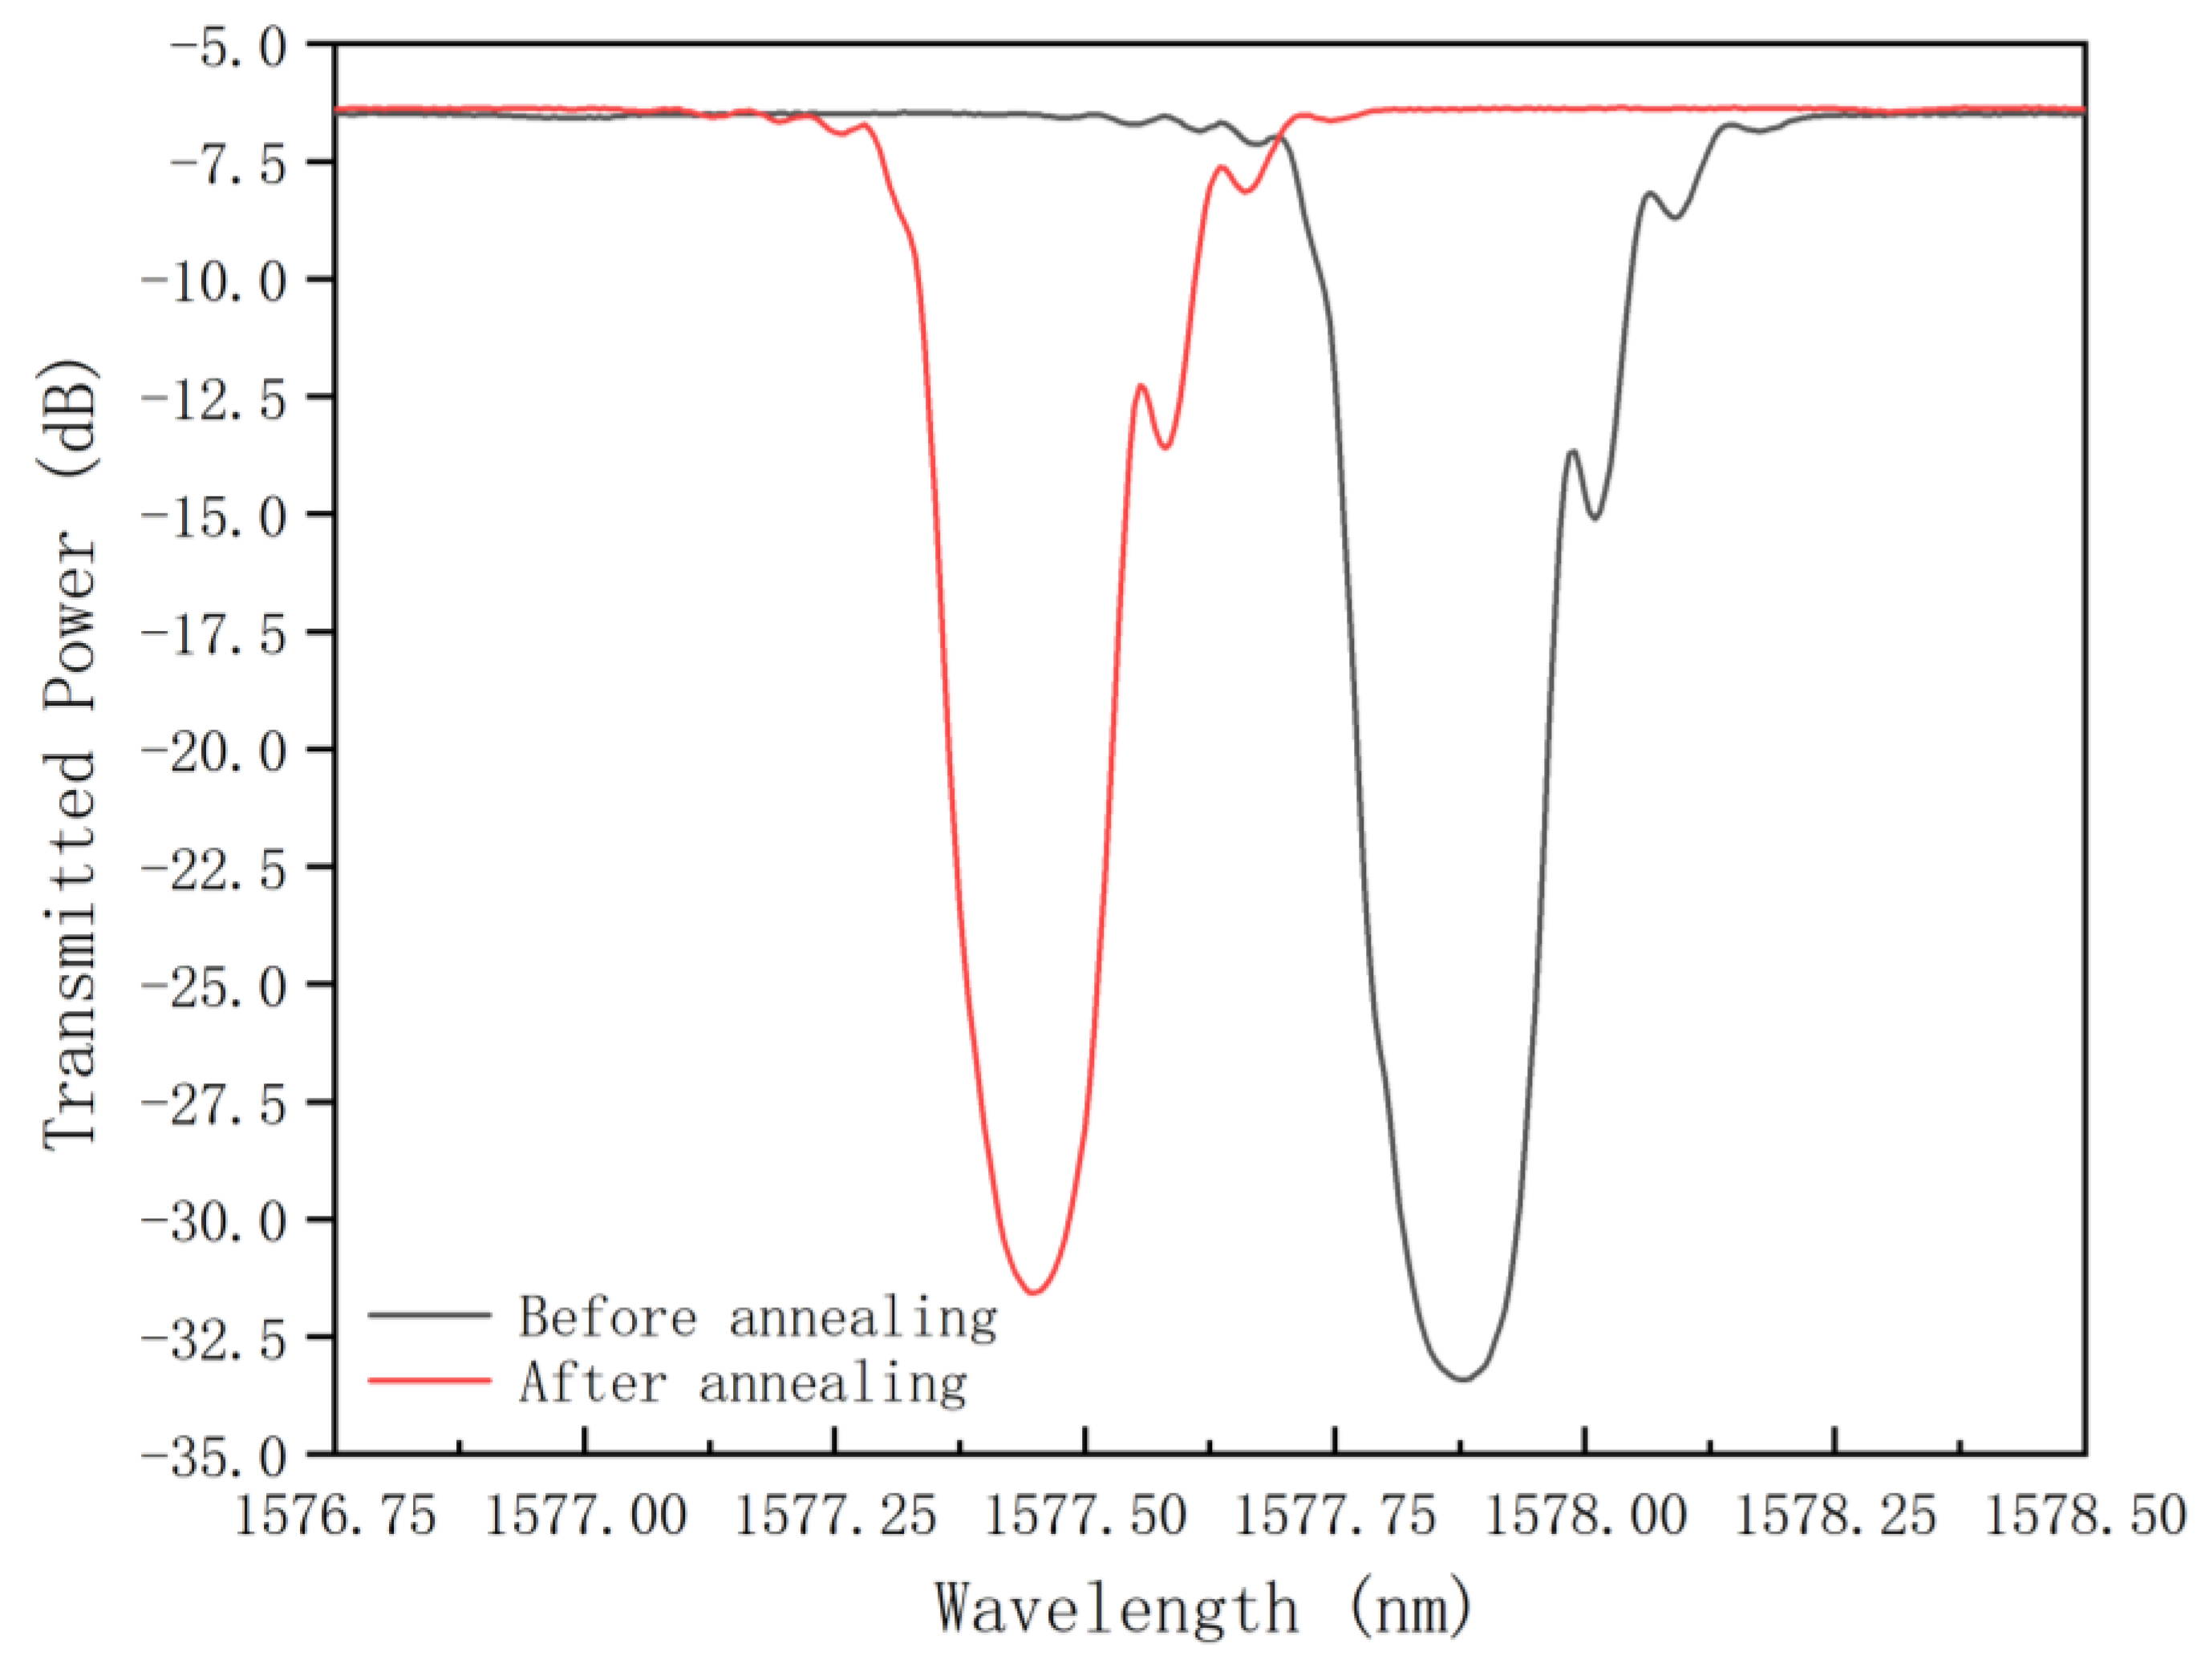
Figure 11 compares the FBG transmission spectra before and after annealing at room temperature. Post-annealing, the spectrum exhibited an overall blueshift from 1577.875 nm to 1577.450 nm, accompanied by a reduction in the transmission depth of the core mode from 27.1 dB to 25.3 dB. This spectral shift and reduction in transmission depth are indicative of the structural and compositional changes in the fiber during annealing, leading to improved long-term stability of the grating.

4.2. FBG Temperature Measurement Within the Temperature Range of 0 to 80 °C

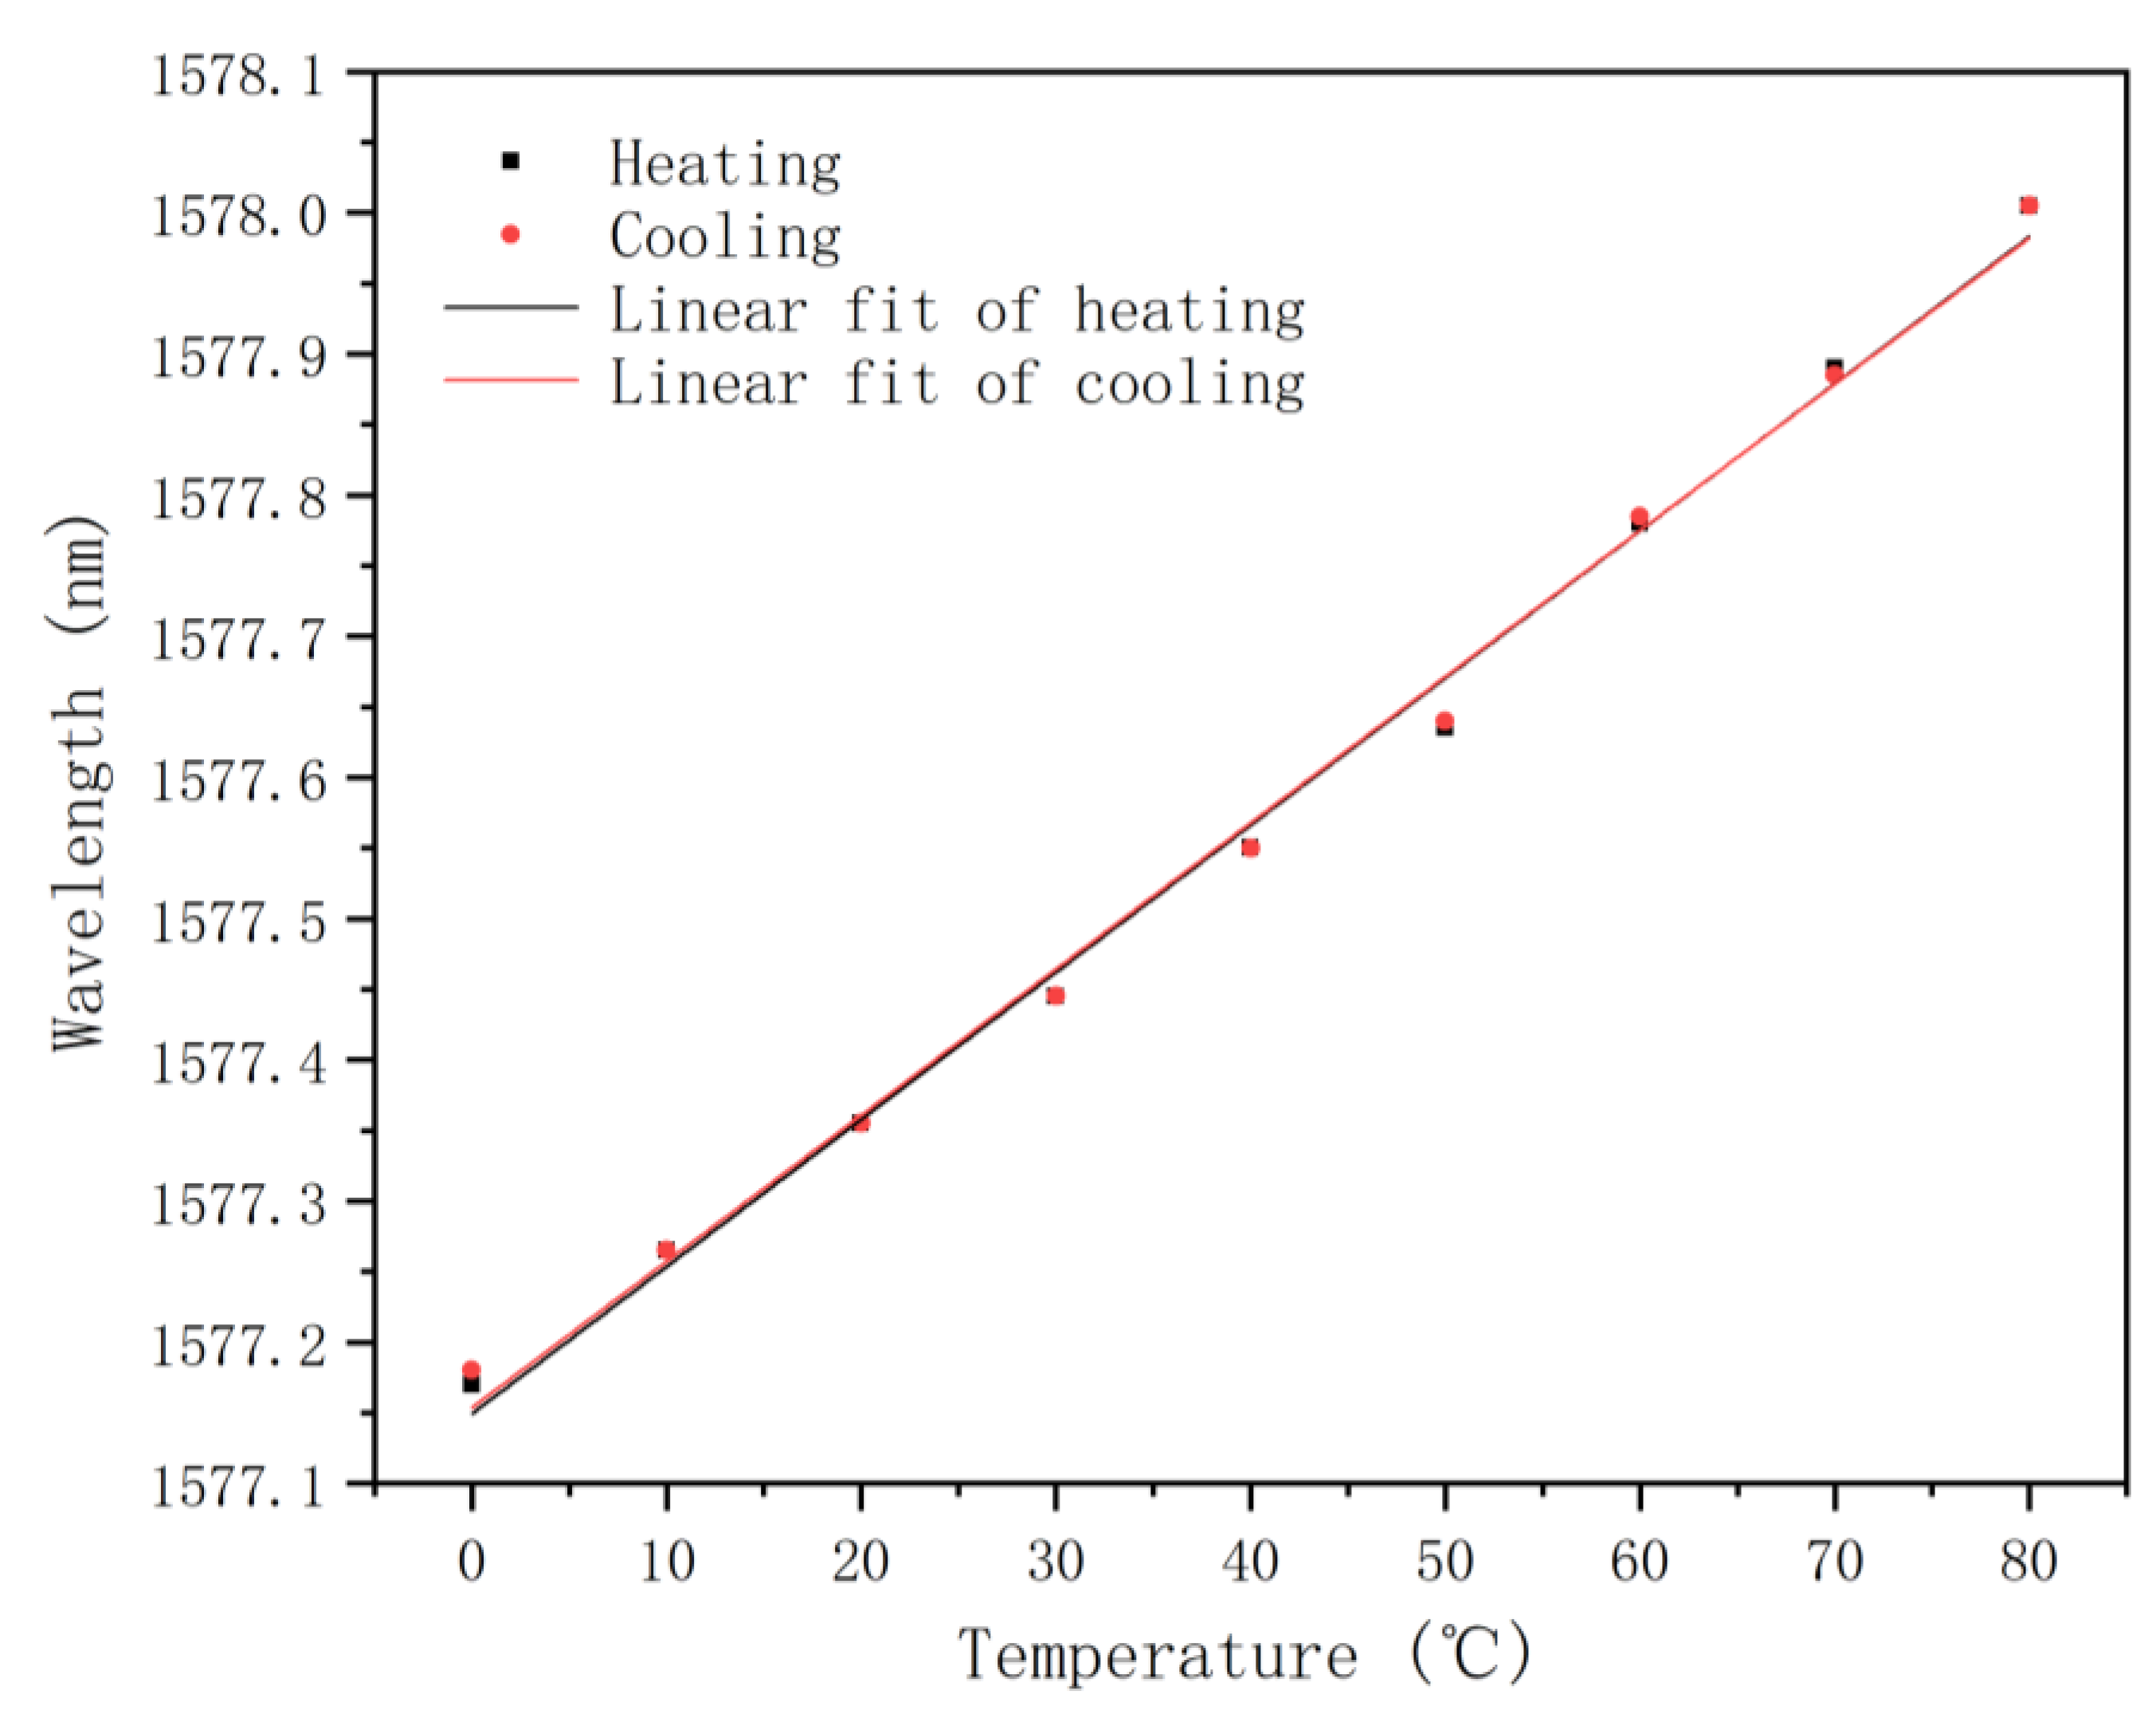
Following the annealing process, temperature characterization of the FBG was performed within the temperature range of 0 to 80 °C, with measurements taken at 10 °C intervals. The results, depicted in Figure 12, showed a consistent redshift in the central wavelength of the core mode as the temperature increased, which aligns with previous studies by Hsiao et al. [35] and Gonzalez-Reyna et al. [36] on FBG temperature sensing.
During both the heating and cooling phases, the central wavelength evolution of the core mode displayed near-coincidence, indicating good thermal reversibility of the FBG. Linear fitting of the data, as illustrated in Figure 13, revealed a consistent temperature sensitivity of 0.0104 ± 0.0003 nm/°C across both heating and cooling phases. This result demonstrates the FBG’s stable optical properties when operated below its annealing temperature [33], suggesting that higher annealing temperatures could further enhance the upper limit of temperature sensing for these gratings.

4.3. Annealing at 150 °C

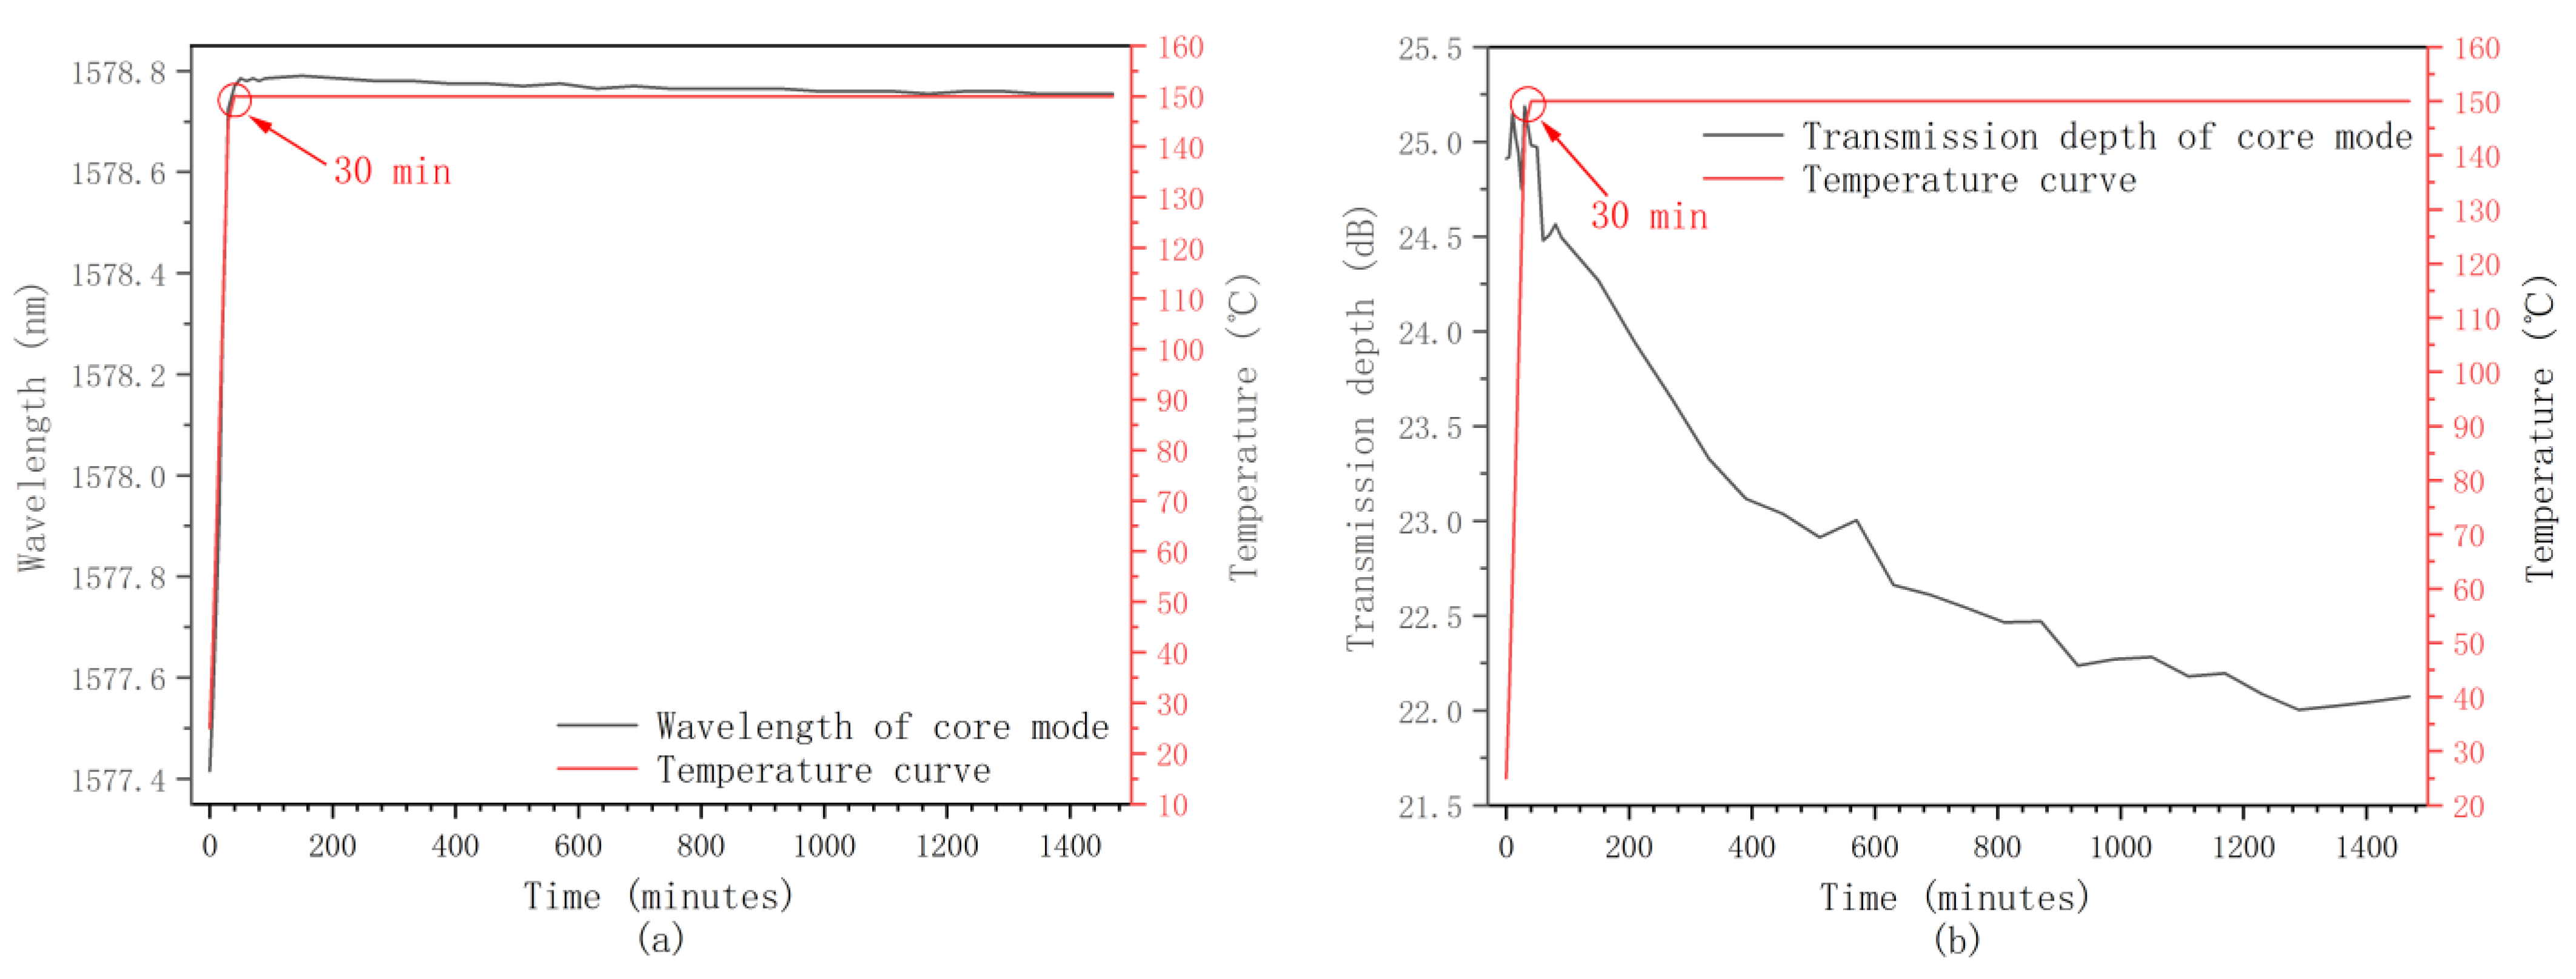
In the previous annealing process at 100 °C, the core mode transmission depth did not stabilize during the 24-h annealing. However, we believe that the core mode transmission depth would eventually stabilize for a longer annealing period. To confirm this, we carried out a second annealing on the same grating. The annealing temperature was raised to 150 °C, lasting for 24 h. Figure 14a,b illustrates the evolutions of the Bragg wavelength and the transmission depth of the core mode during the second annealing, respectively. Finally, both the Bragg wavelength and transmission depth of the core mode tended to stabilize. The decrease in transmission depth corresponding to the decrease in grating reflectivity resulted from the decrease in the core refractive index modulation depth. The latter could also be attributed to the hydrogen escaping from the fiber during the annealing process.

4.4. FBG Temperature Measurement Within the Temperature Range of 0 to 130 °C

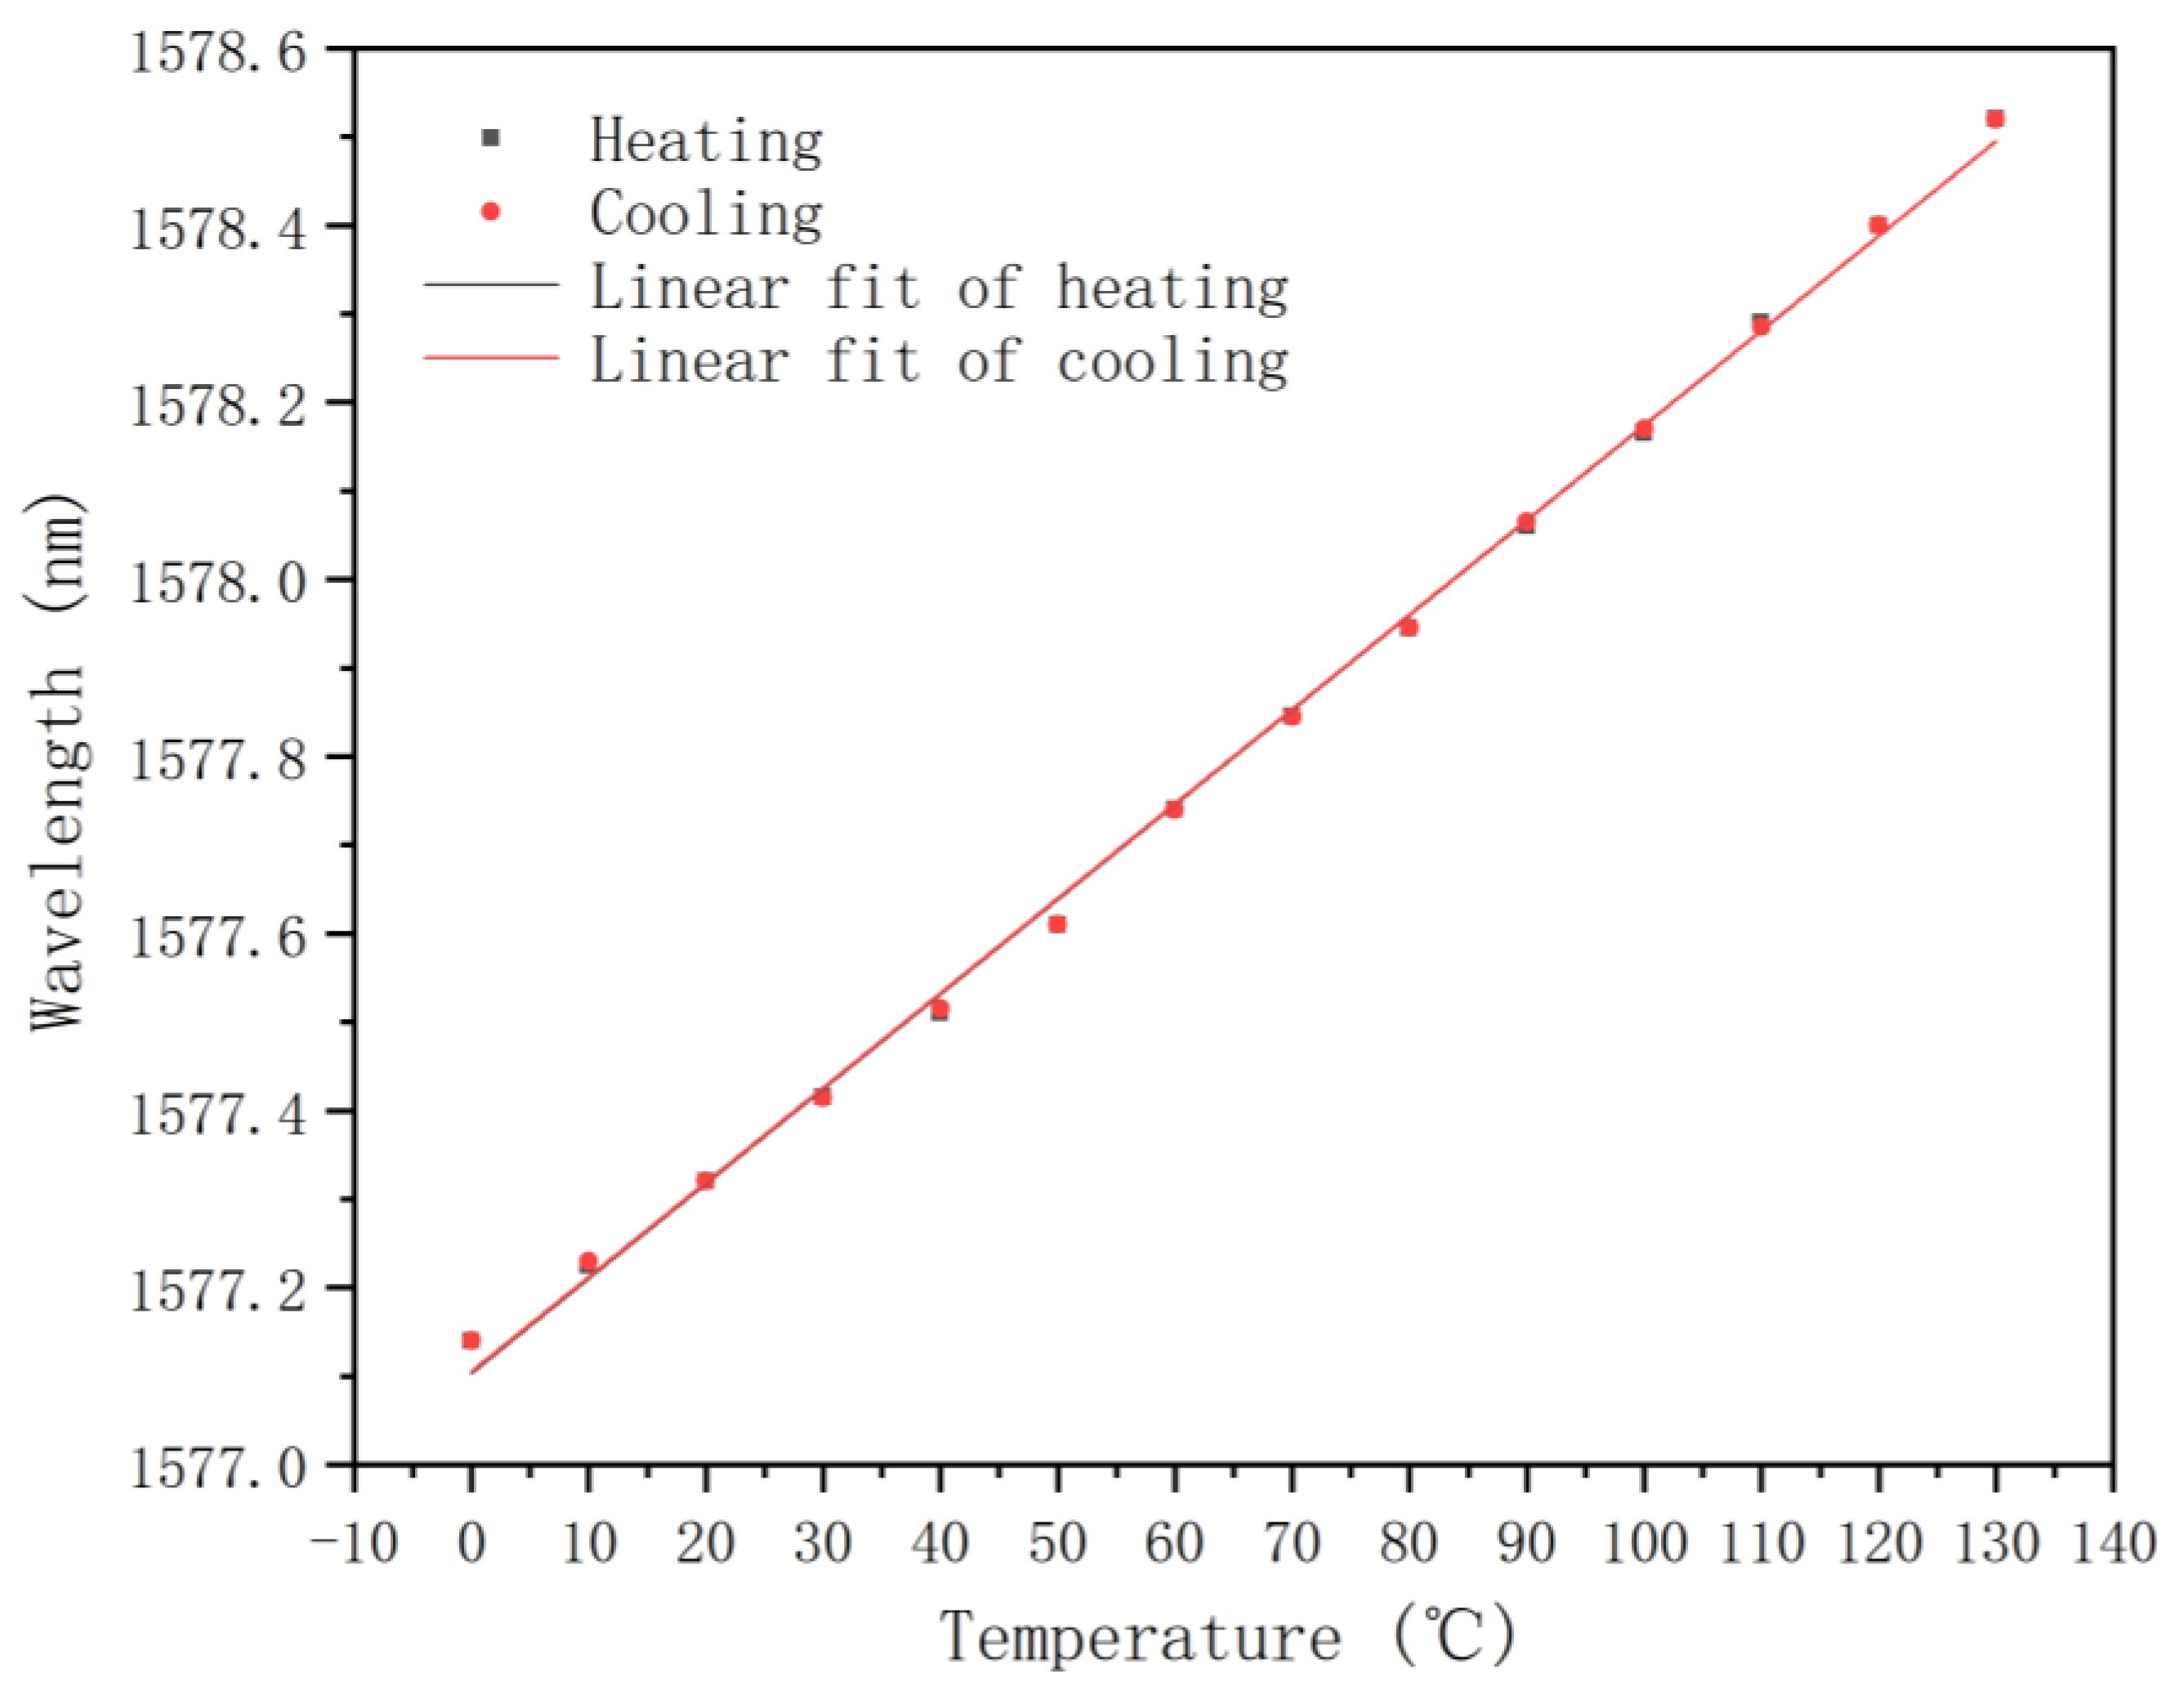
Afterward, a second temperature characterization was conducted within the range of 0 to 130 °C, with a measurement interval of 10 °C. The evolutions of the transmitted spectra and the linear fit of the grating wavelength are shown in Figure 15 and Figure 16, respectively, indicating a temperature sensitivity of 0.0107 ± 0.0001 nm/°C during both the heating and cooling stages, which is consistent with the results from the first temperature characterization within the range of 0 to 80 °C.

4.5. FBG Strain Measurement

Subsequently, we characterized the strain of the grating, written with a pulse energy of 1.75 mJ and a scanning speed of 0.012 mm/s, followed by the 24-h annealing at 100 °C. The experimental results are shown in Figure 17, with a sensitivity of 0.943 ± 0.005 pm/µε. It is worth noting that the grating broke when the strain reached 1667 µε.

5. Conclusions

In this study, we successfully inscribed FBGs in hydrogen-loaded optical fibers using a cost-effective 266 nm UV laser in combination with a scanning phase mask technique. This approach allowed us to investigate the effects of varying scanning speeds and pulse energies on the grating’s central wavelength, transmission depth, and reflected spectrum. Our results showed that the FBGs exhibited uniform growth during the inscription process, and we identified optimal conditions for maximizing reflectivity.
To ensure the stability of the FBGs, we subjected the gratings to a 24-h annealing process up to 150 °C, which effectively stabilized their characteristics. Subsequent temperature measurements within the range of 0 to 130 °C demonstrated a consistent temperature sensitivity of 0.0107 ± 0.0001 nm/°C. This indicates that the FBGs maintained a reliable optical performance when operated below the annealing temperature, making them suitable for various temperature sensing applications. The strain measurement was conducted on the FBG annealed at 100 °C, and a sensitivity of 0.943 pm/µε was achieved over the range of 0 to 1667 µε.
In summary, the grating inscription device used in this project is cost-effective, and the grating fabrication process is straightforward. Additionally, scanning phase mask technology can be employed for the large-scale production of high-reflectivity gratings in hydrogen-loaded fibers. In recent years, TFBGs have gained popularity for biomedical applications. Therefore, in the future, we plan to explore the inscription and characterization of TFBGs in hydrogen-loaded fibers using the same setup. This advancement could significantly reduce the cost of TFBG fabrication.

Author Contributions

Conceptualization, X.H. and H.Q.; Methodology, X.Z. and Z.X.; Validation, X.Z., Z.X. and H.Z.; Investigation, X.Z., Z.X., H.Z., H.W. and X.C.; Writing—original draft preparation, X.Z. and Z.X.; Writing—review and editing, X.Z., Z.X., H.Z., H.W., X.C., H.-Y.T., H.Q. and X.H.; Supervision, H.Q. and X.H.; Funding acquisition, H.Q. and X.H. All authors have read and agreed to the published version of the manuscript.

Funding

This work was supported by National Natural Science Foundation of China (62475140); Guangdong Basic and Applied Basic Research Foundation (2022A1515012571); the Guangxi Key Laboratory of Optoelectronic Information Processing (GD23203); and The Fonds de la Recherche Scientifique (F.R.S.-FNRS) under the Postdoctoral Researcher grant (Chargé de Recherches) of Xuehao Hu.

Institutional Review Board Statement

Not applicable.

Informed Consent Statement

Not applicable.

Data Availability Statement

Data are contained within the article.

Conflicts of Interest

The authors declare no conflicts of interest.

References

  1. Othonos, A. Fiber Bragg gratings. Rev. Sci. Instrum. 1997, 68, 4309–4341. [Google Scholar] [CrossRef]
  2. Osuch, T.; Gąsior, P.; Markowski, K.; Jędrzejewski, K. Development of fiber Bragg gratings technology and their complex structures for sensing, telecommunications and microwave photonics applications. Bull. Pol. Acad. Sci. Tech. Sci. 2014, 62, 627–633. [Google Scholar] [CrossRef]
  3. Dostovalov, A.V.; Wolf, A.A.; Skvortsov, M.I.; Abdullina, S.R.; Kuznetsov, A.G.; Kablukov, S.I.; Babin, S.A. Femtosecond-pulse inscribed FBGs for mode selection in multimode fiber lasers. Opt. Fiber Technol. 2019, 52, 101988. [Google Scholar] [CrossRef]
  4. Huang, J.; Pham, D.T.; Ji, C.; Wang, Z.; Zhou, Z. Multi-parameter dynamical measuring system using fibre Bragg grating sensors for industrial hydraulic piping. Measurement 2019, 134, 226–235. [Google Scholar] [CrossRef]
  5. Li, C.; Tang, J.; Cheng, C.; Cai, L.; Yang, M. FBG arrays for quasi-distributed sensing: A review. Photonic Sens. 2021, 11, 91–108. [Google Scholar] [CrossRef]
  6. Riza, M.A.; Go, Y.I.; Harun, S.W.; Maier, R.R. FBG sensors for environmental and biochemical applications—A review. IEEE Sens. J. 2020, 20, 7614–7627. [Google Scholar] [CrossRef]
  7. Kashyap, R. Fiber Bragg Gratings; Academic Press: Cambridge, MA, USA, 2009. [Google Scholar]
  8. Bilodeau, F.; Malo, B.; Albert, J.; Johnson, D.C.; Hill, K.O.; Hibino, Y.; Abe, M.; Kawachi, M. Photosensitization of optical fiber and silica-on-silicon/silica waveguides. Opt. Lett. 1993, 18, 953–955. [Google Scholar] [CrossRef]
  9. Caucheteur, C.; Guo, T.; Liu, F.; Guan, B.-O.; Albert, J. Ultrasensitive plasmonic sensing in air using optical fibre spectral combs. Nat. Commun. 2016, 7, 13371. [Google Scholar] [CrossRef]
  10. Yazd, N.S.; Chah, K.; Caucheteur, C.; Mégret, P. Thermal regeneration of tilted Bragg gratings UV photo-inscribed in hydrogen-loaded standard optical fibers. J. Light. Technol. 2021, 39, 3582–3590. [Google Scholar] [CrossRef]
  11. Albert, J.; Malo, B.; Bilodeau, F.; Johnson, D.; Hill, K.; Hibino, Y.; Kawachi, M. Photosensitivity in Ge-doped silica optical waveguides and fibers with 193-nm light from an ArF excimer laser. Opt. Lett. 1994, 19, 387–389. [Google Scholar] [CrossRef]
  12. Lao, J.; Sun, P.; Liu, F.; Zhang, X.; Zhao, C.; Mai, W.; Guo, T.; Xiao, G.; Albert, J. In situ plasmonic optical fiber detection of the state of charge of supercapacitors for renewable energy storage. Light Sci. Appl. 2018, 7, 34. [Google Scholar] [CrossRef] [PubMed]
  13. Williams, D.; Ainslie, B.; Armitage, J.; Kashyap, R.; Campbell, R. Enhanced UV photosensitivity in boron codoped germanosilicate fibres. Electron. Lett. 1993, 29, 45–47. [Google Scholar] [CrossRef]
  14. Wen, H.-Y.; Hsu, Y.-C.; Chen, S.-Y.; Chiang, C.-C. The manufacturing process and spectral features of tilted fiber Bragg gratings. Opt. Laser Technol. 2021, 134, 106615. [Google Scholar] [CrossRef]
  15. Hill, K.; Bilodeau, F.; Malo, B.; Kitagawa, T.; Thériault, S.; Johnson, D.; Albert, J.; Takiguchi, K. Chirped in-fiber Bragg gratings for compensation of optical-fiber dispersion. Opt. Lett. 1994, 19, 1314–1316. [Google Scholar] [CrossRef]
  16. Lemaire, P.J.; Atkins, R.; Mizrahi, V.; Reed, W. High pressure h/sub 2/loading as a technique for achieving ultrahigh uv photosensitivity and thermal sensitivity in geo/sub 2/doped optical fibres. Electron. Lett. 1993, 13, 1191–1193. [Google Scholar] [CrossRef]
  17. Yablon, A.D. Optics of Fusion Splicing; Springer: Berlin/Heidelberg, Germany, 2005. [Google Scholar]
  18. Ky, N.H.; Limberger, H.G.; Salathé, R.P.; Cochet, F.; Dong, L. Hydrogen-induced reduction of axial stress in optical fiber cores. Appl. Phys. Lett. 1999, 74, 516–518. [Google Scholar] [CrossRef]
  19. Malo, B.; Albert, J.; Hill, K.; Bilodeau, F.; Johnson, D. Effective index drift from molecular hydrogen diffusion in hydrogen-loaded optical fibres and its effect on Bragg grating fabrication. Electron. Lett. 1994, 30, 442–444. [Google Scholar] [CrossRef]
  20. Canning, J.; Bandyopadhyay, S.; Biswas, P.; Aslund, M.; Stevenson, M.; Cook, K. Regenerated fibre Bragg gratings. Front. Guid. Wave Opt. Optoelectron. 2010, 2010, 22. [Google Scholar]
  21. Zhou, K.; Simpson, A.; Zhang, L.; Bennion, I. Side detection of strong radiation-mode out-coupling from blazed FBGs in single-mode and multimode fibers. IEEE Photonics Technol. Lett. 2003, 15, 936–938. [Google Scholar] [CrossRef]
  22. Hill, K.O.; Malo, B.; Bilodeau, F.; Johnson, D.; Albert, J. Bragg gratings fabricated in monomode photosensitive optical fiber by UV exposure through a phase mask. Appl. Phys. Lett. 1993, 62, 1035–1037. [Google Scholar] [CrossRef]
  23. Barber, D.A.; Rizvi, N.H. Characterization of the effects of different lasers on the tensile strength of fibers during laser writing of fiber Bragg gratings. In Proceedings of the Opto-Ireland 2002: Optics and Photonics Technologies and Applications, Galway, Ireland, 5–6 September 2002; SPIE: Bellingham, WA, USA, 2003; pp. 321–329. [Google Scholar]
  24. Wei, C.; Ye, C.-C.; James, S.W.; Tatam, R.P.; Irving, P.E. The influence of hydrogen loading and the fabrication process on the mechanical strength of optical fibre Bragg gratings. Opt. Mater. 2002, 20, 241–251. [Google Scholar] [CrossRef]
  25. Lee, K.R.; Lin, S.; Sun, C.-T. Mass preparation of photosensitive fibers and 248-nm excimer writing of fiber gratings by use of a pi/2 phase shift mask. In Proceedings of the Optical Fiber Communication, San Jose, CA, USA, 22–27 February 1998; pp. 213–220. [Google Scholar]
  26. Polz, L.; Dörfler, A.; Bartelt, H.; Roths, J. Regeneration experiments with fibre Bragg gratings in hydrogen out-diffused fibres. In Proceedings of the 23rd International Conference on Optical Fibre Sensors, Santander, Spain, 2–6 June 2014; pp. 1057–1060. [Google Scholar]
  27. Chen, K.P.; Herman, P.R.; Tam, R. Strong fiber Bragg grating fabrication by hybrid 157-and 248-nm laser exposure. IEEE Photonics Technol. Lett. 2002, 14, 170–172. [Google Scholar] [CrossRef]
  28. Pissadakis, S.; Livitziis, M.; Violakis, G.; Konstantaki, M. Inscription of Bragg reflectors in all-silica microstructured optical fibres using 248nm, picosecond, and femtosecond laser radiation. In Proceedings of the Photonic Crystal Fibers II, Strasbourg, France, 9–10 April 2008; pp. 88–98. [Google Scholar]
  29. Guan, B.-O.; Tam, H.-Y.; Chan, H.L.; Choy, C.-L.; Demokan, M.S. Growth characteristics of long-period gratings in hydrogen-loaded fibre during and after 193 nm UV inscription. Meas. Sci. Technol. 2001, 12, 818. [Google Scholar] [CrossRef]
  30. Åslund, M.; Canning, J.; Yoffe, G. Locking in photosensitivity within optical fiber and planar waveguides by ultraviolet preexposure. Opt. Lett. 1999, 24, 1826–1828. [Google Scholar] [CrossRef]
  31. Kohnke, G.; Nightingale, D.; Wigley, P.; Pollock, C. Photosensitization of optical fiber by UV exposure of hydrogen loaded fiber. In Proceedings of the OFC/IOOC. Technical Digest. Optical Fiber Communication Conference, 1999, and the International Conference on Integrated Optics and Optical Fiber Communication, San Diego, CA, USA, 21–26 February 1999. [Google Scholar]
  32. Grubsky, V.; Starodubov, D.; Feinberg, J. Mechanisms of index change induced by near-UV light in hydrogen-loaded fibers. In Proceedings of the Bragg Gratings, Photosensitivity, and Poling in Glass Fibers and Waveguides, Williamsburg, VA, USA, 26–28 October 1997; p. JMA. 3. [Google Scholar]
  33. Liou, C.; Wang, L.; Shih, M. Characteristics of hydrogenated fiber Bragg gratings. Appl. Phys. A 1997, 64, 191–197. [Google Scholar] [CrossRef]
  34. Masuda, Y.; Nakamura, M.; Komatsu, C.; Fujita, K.; Yamauchi, M.; Kimura, M.; Mizutani, Y.; Kimura, S.; Suzaki, Y.; Yokouchi, T. Wavelength evolution of fiber Bragg gratings fabricated from hydrogen-loaded optical fiber during annealing. J. Light. Technol. 2004, 22, 934. [Google Scholar] [CrossRef]
  35. Hsiao, T.-C.; Hsieh, T.-S.; Chen, Y.-C.; Huang, S.-C.; Chiang, C.-C. Metal-coated fiber Bragg grating for dynamic temperature sensor. Optik 2016, 127, 10740–10745. [Google Scholar] [CrossRef]
  36. Gonzalez-Reyna, M.A.; Alvarado-Mendez, E.; Estudillo-Ayala, J.M.; Vargas-Rodriguez, E.; Sosa-Morales, M.E.; Sierra-Hernandez, J.M.; Jauregui-Vazquez, D.; Rojas-Laguna, R. Laser temperature sensor based on a fiber Bragg grating. IEEE Photonics Technol. Lett. 2015, 27, 1141–1144. [Google Scholar] [CrossRef]
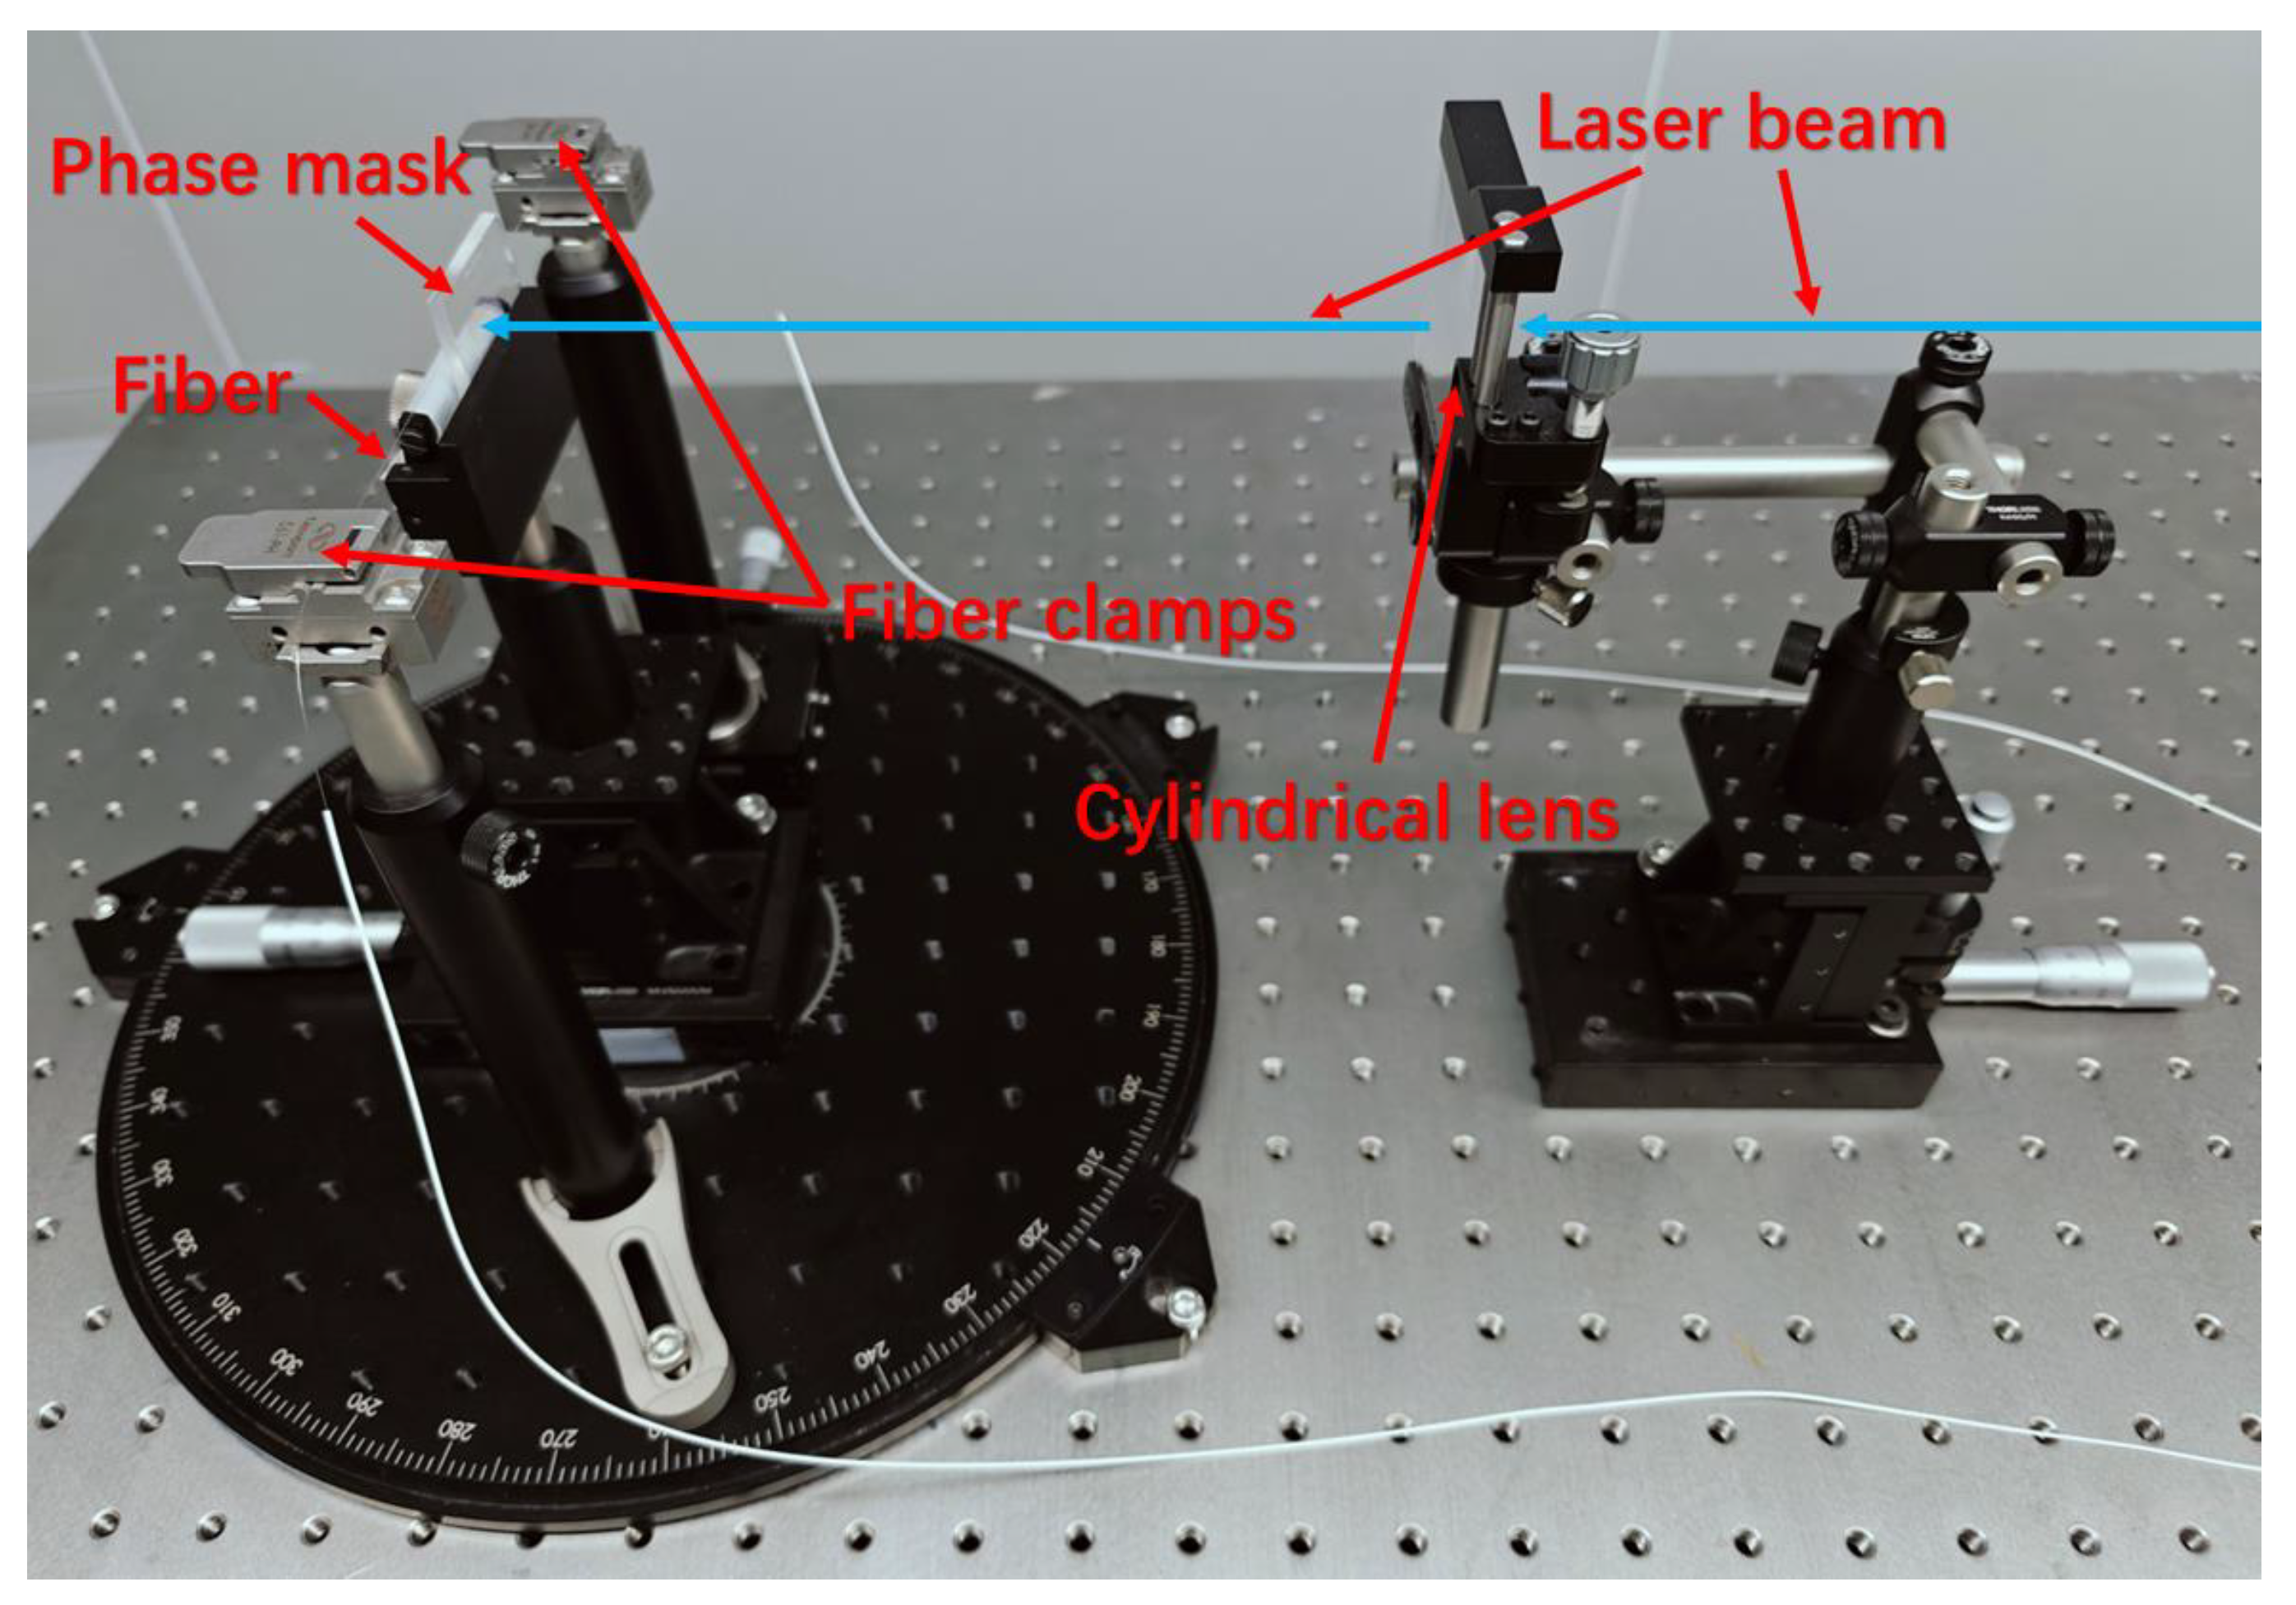
Figure 1. Experimental setup for the inscription of FBGs using 266 nm solid-state laser pulses.
Photonics 11 01092 g001
Figure 2. Photo-induced transmitted spectra of FBGs inscribed with different pulse energies (1.75 mJ, 2 mJ, 2.2 mJ, 2.5 mJ) at a constant scanning speed of 0.012 mm/s and a pulse repetition rate of 20 Hz.
Photonics 11 01092 g002
Figure 3. Photo-induced reflected spectra of FBGs inscribed with different pulse energies (1.75 mJ, 2 mJ, 2.2 mJ, and 2.5 mJ) at a constant scanning speed of 0.012 mm/s and a pulse repetition rate of 20 Hz.
Photonics 11 01092 g003
Figure 4. Photo-induced transmitted spectra of FBGs inscribed with varying pulse energies (1.5 mJ, 1.75 mJ, 2 mJ, and 2.2 mJ) at a constant scanning speed of 0.01 mm/s and a pulse repetition rate of 20 Hz.
Photonics 11 01092 g004
Figure 5. The microscopic images of the fibers with different pulse energies (a) 1.5 mJ, (b) 1.75 mJ, (c) 2 mJ, and (d) 2.2 mJ at a constant scanning speed of 0.01 mm/s and a pulse repetition rate of 20 Hz.
Photonics 11 01092 g005
Figure 6. Photo-induced reflected spectra of FBGs inscribed with varying pulse energies (1.5 mJ, 1.75 mJ, 2 mJ, and 2.2 mJ) at a constant scanning speed of 0.01 mm/s and a pulse repetition rate of 20 Hz.
Photonics 11 01092 g006
Figure 7. Photo-induced transmitted spectra of FBGs inscribed at different scanning speeds (0.005 mm/s, 0.008 mm/s, 0.01 mm/s, 0.012 mm/s, and 0.015 mm/s) with a constant pulse energy of 1.75 mJ and a pulse repetition rate of 20 Hz.
Photonics 11 01092 g007
Figure 8. Photo-induced reflected spectra of FBGs inscribed at different scanning speeds (0.005 mm/s, 0.008 mm/s, 0.01 mm/s, 0.012 mm/s, and 0.015 mm/s) with a constant pulse energy of 1.75 mJ and a pulse repetition rate of 20 Hz.
Photonics 11 01092 g008
Figure 9. Growth of photo-induced FBG transmitted spectra as a function of inscription time, with a scanning speed of 0.008 mm/s, pulse energy of 1.75 mJ, and a pulse repetition rate of 20 Hz.
Photonics 11 01092 g009
Figure 10. Evolution of the FBG inscribed under conditions (0.008 mm/s, 1.75 mJ, 20 Hz) during the annealing process at 100 °C, showing (a) the Bragg wavelength shift and (b) the transmission depth of the core mode.
Photonics 11 01092 g010
Figure 11. Spectral comparison of FBGs inscribed under conditions (0.008 mm/s, 1.75 mJ, 20 Hz) before and after the annealing process.
Photonics 11 01092 g011
Figure 12. Transmitted amplitude spectrum evolution of the core mode as a function of temperature.
Photonics 11 01092 g012
Figure 13. Linear fit of the central wavelength evolution of the core mode as a function of temperature.
Photonics 11 01092 g013
Figure 14. Evolution of FBG inscribed under conditions (0.008 mm/s, 1.75 mJ, 20 Hz) during the annealing process at 150 °C, showing (a) the Bragg wavelength shift and (b) the transmission depth of the core mode.
Photonics 11 01092 g014
Figure 15. Transmitted amplitude spectrum evolution of the core mode as a function of temperature within the range of 0 to 130 °C.
Photonics 11 01092 g015
Figure 16. Linear fit of the central wavelength evolution of the core mode as a function of temperature within the range of 0 to 130 °C.
Photonics 11 01092 g016
Figure 17. Linear fit of the central wavelength evolution of the core mode as a function of strain.
Photonics 11 01092 g017
Table 1. Transmitted and reflected spectral parameters for FBGs inscribed under various conditions.
Pulse Energy (mJ)Scanning Speed (mm/s)Wavelength of Core Mode (nm)Transmission Depth of Core Mode (dB)Reflectivity of the Grating (%)FWHM (nm)SMSR (dB)
1.750.0121577.79021.199.230.195.76
2.000.0121577.82519.598.870.183.81
2.200.0121577.86523.999.600.263.06
1.500.0101577.6959.989.690.126.77
1.750.0101577.83525.399.710.233.85
2.000.0101577.75512.894.770.153.91
1.750.0051577.93519.598.870.251.18
1.750.0081577.90527.199.810.333.07
1.750.0151577.6908.385.070.117.81
Disclaimer/Publisher’s Note: The statements, opinions and data contained in all publications are solely those of the individual author(s) and contributor(s) and not of MDPI and/or the editor(s). MDPI and/or the editor(s) disclaim responsibility for any injury to people or property resulting from any ideas, methods, instructions or products referred to in the content.