Article

Complementary Metal Oxide Semiconductor-Based Optical Detection System for Fluidic Cellular Medium pH Quantification

by
André A. Santos
1,
Gabriel M. Ferreira
1,2,
Paulo J. Sousa
1,3,
Patrícia C. Sousa
2,
Susana O. Catarino
1,3 and
Graça Minas
1,3,*
1
Microelectromechanical Systems Research Unit (CMEMS-UMinho), School of Engineering, Campus de Azurém, University of Minho, 4800-058 Guimarães, Portugal
2
International Iberian Nanotechnology Laboratory (INL), 4715-330 Braga, Portugal
3
LABBELS—Associate Laboratory, 4800-122 Braga, Portugal
*
Author to whom correspondence should be addressed.
Photonics 2024, 11(12), 1130; https://doi.org/10.3390/photonics11121130
Submission received: 9 October 2024 / Revised: 27 November 2024 / Accepted: 27 November 2024 / Published: 29 November 2024
(This article belongs to the Special Issue Optical Sensors for Advanced Biomedical Applications)

Abstract

:
Accurate pH sensing is essential for the effective physiological control of the culture media in organ-on-a-chip (OoC) systems. This work proposes a miniaturized optical detection system, based on optical transmittance, for pH level quantification of the EGM™-2 Endothelial Cell Growth Medium-2 BulletKit™ culture medium. Firstly, using a commercial spectrophotometric setup, a set of wavelengths (500, 560, and 600 nm) was selected, as these wavelengths assure distinctive slope variations for the different pH levels. Then, a current-to-frequency converter, based on a low-power Schmitt trigger model with a voltage enhancer, was proposed as the readout electronics and simulated in Cadence Tools using UMC L180 MM/RF technology. A resolution of 0.002 nA was achieved in the linear range of 30 pA to 3800 nA. A miniaturized system composed of a CMOS n-well/p-substrate photodiode and a polydimethilsiloxane (PDMS) microchannel for the culture media substrate was experimentally tested. For a pH range from 6.6 to 6.2, the results clearly demonstrate a magnitude shift of the slope signal, which becomes negative in basic media and positive in acidic media. Additionally, in the 500–560 nm spectral range, the amplitude of the slopes increases for both basic and acidic culture media. In the 560–600 nm range, the slope decreases progressively as the pH of the medium lowers. This miniaturized system was able to quantify the pH of the culture medium, showing potential to be integrated into an organ-on-a-chip device.

1. Introduction

The organ-on-a-chip (OoC) concept is a revolutionary idea that mimics the complex physiological or pathological processes of human tissues and organs. OoC devices have led to the development of novel technologies for drug discovery and screening, encouraging toxicology research, by emulating the behavior of different cells and organs, such as the heart, lung, liver, brain, intestine, kidney, blood vessels, and lymph nodes, or even multiple organs, in reaction to those drugs [1,2,3]. Additionally, the development of OoC devices has promoted the non-use of animals in initial tests, avoiding ethical and social concerns [1]. Combining those advantages with the system’s small size, low cost, fast analysis, and energy savings and the establishment of more realistic physiological models leads to the conclusion that OoC devices have become more attractive for the advancement of biomedical and biotechnological research [3,4]. In a simplified view, an OoC combines microfluidics, tissue engineering, and lab-on-a-chip (LOC) technologies, with miniaturized cell-culturing environments mimicking the natural conditions of human cells.
The pH is one of the most sensitive parameters in cell culture assays, making its monitoring essential and vital [5] in bioprocess engineering and tissue engineering, where the cell behavior is highly sensitive to the surrounding microenvironments. Additionally, for pharmaceutical applications, monitoring the extracellular pH is used in cell-based drug and toxicity testing to detect changes in metabolic activity resulting from drug or toxin effects [5]. The ideal pH for most cultured cells is around 7.4, although it can vary slightly between cell lines [6,7]. While the optimal pH for cell growth varies slightly among different cell strains, some normal fibroblast lines perform best at a pH between 7.4 and 7.7, whereas transformed cells may thrive better at a pH between 7.0 and 7.4 [7]. Furthermore, it has been reported that epidermal cells can be maintained at a pH of 5.5 [7]. However, some diseases change the pH value of the cells/cellular media when they are proliferating. For example, as the cell is proliferating to a tumor, the extracellular environment decreases its pH from 7.4 to values around 6.5–7.0, and the intracellular environment decreases to an acidic pH of 4.5–5.5 [8]. Therefore, it is crucial to measure the pH of the cellular environment to determine the health of any given cell and the performance of the drug uptake.
In an OoC device, the commercially available media are usually buffered with sodium bicarbonate or HEPES (4-(2-hydroxyethyl)-1-piperazineethanesulfonic acid) to maintain and control their pH. Cellular respiration produces carbon dioxide and lactate, which can acidify the medium over time, impacting the cell microenvironment inside the OoC.
In a microfluidic environment, such as an OoC device, the small volumes of culture medium make direct pH measurement even more challenging. Typically, in these devices, pH sensing is based on electrochemical or optical detection [9]. Optical sensors have been widely used and implemented in OoC technology, mainly for pH, oxygen, and analyte monitorization. They present significant advantages when used in OoC over electrochemical detection (which involves frequent sensor calibration and electrode degradation over time), due to their high sensitivity, remote and non-invasive operation (reducing contamination risks), easy implementation, and integration in microfluidic devices [9]. Optical detection methods require specific optical properties of the materials/samples under analysis [10,11] and excellent transparency support materials for better light transmission, such as the polydimethylsiloxane (PDMS) polymer [11]. Additionally, light detection needs to be directed to an optical transducer to convert and quantify the received light intensity into an electric signal. The current systems that are able to measure pH present some limitations regarding the size for integration [12,13], cost [13,14], sensitivity, and accuracy, which are essential features for integration in an OoC device [15,16,17].
For easy and better integration, and aiming at miniaturization, the use of Complementary Metal Oxide Semiconductor (CMOS) technology is preferred, allowing for the integration of the optical sensors (namely photodiodes) and readout electronics with the microfluidic channels into a single chip. This advancement has significantly improved the manufacturing of integrated sensors, particularly optically sensitive surfaces, circuits, and microchips, over the past few decades [18]. Furthermore, CMOS technology solves the miniaturization and integration problems found in recent methods, which involve complex approaches and difficult integration with microfluidic systems and are based on commercial photodiodes [15], optical fibers [19], sol–gel filters [20] and optical microresonators [13].
In this work, we explored the optical properties of the EGM™-2 Endothelial Cell Growth Medium-2 BulletKit™ at different pH values, using Phenol red as the pH indicator (already included in the culture medium), to develop an optical sensor that is able to distinguish and determine the pH of a culture medium. Phenol red is a common pH indicator in cell culture media and changes color based on the pH, allowing for a quick visual assessment [21]. In the first step, a commercial setup was used to identify and select the most relevant wavelengths for pH detection. Based on the results, an algorithm was used to automatically determine the pH of the sample. Furthermore, CMOS photodiodes and current-to-frequency (IF) converters were proposed and simulated in Cadence Tools, using UMC L180 MM/RF technology rules, for integration into a single chip. Subsequently, using a miniaturized setup, consisting of a CMOS photodiode and a PDMS microchannel, experimental tests for validating the sensor operation were conducted.

2. Materials and Methods

2.1. Optical Wavelength Selection

An optical top-bench setup, comprising a light source, which is a 200 W halogen lamp, a monochromator (Newport Corner Stone 130, Newport Corporation, Irvine, California, USA), an optical fiber (Newport Standard Grade FS), a black blanket to cover the outside light, a picoammeter (Keithley 487, Keithley, Cleveland, Ohio, USA) to acquire the photodiodes’ currents, and a computer to acquire and store the data, was used to achieve the wavelength of interest for detecting pH variations. For these preliminary assays, a commercial photodiode (S1336-5BQ from Hamamatsu, Herrsching, Germany) and a 1 cm optical path cuvette filled with fluidic samples were used. A schematic of the setup is presented in Figure 1.
In the present study, the pH of the culture medium was altered using Hydrochloric acid (HCl) solutions, simulating the pH changes caused by the cells’ disease stage. However, in the final organ-on-a-chip application, the pH sensing system will occur in a chamber positioned after the cell culture chamber (not inside the cell culture chamber itself), thus avoiding the cells interfering with the optical measurements. The samples were prepared combining 6 different HCl solutions, mixed with the medium kit EGM™-2 Endothelial Cell Growth Medium-2 BulletKit™, with the aim of adjusting its pH. The HCl concentrations were adjusted until the pH values of each sample were 8.1, 7.6, 7.2, 6.6, 6.2, and 5.4. These values were measured with a commercial pH meter (HI5222-02 from HANNA instruments, Póvoa de Varzim, Portugal) for pH calibration.
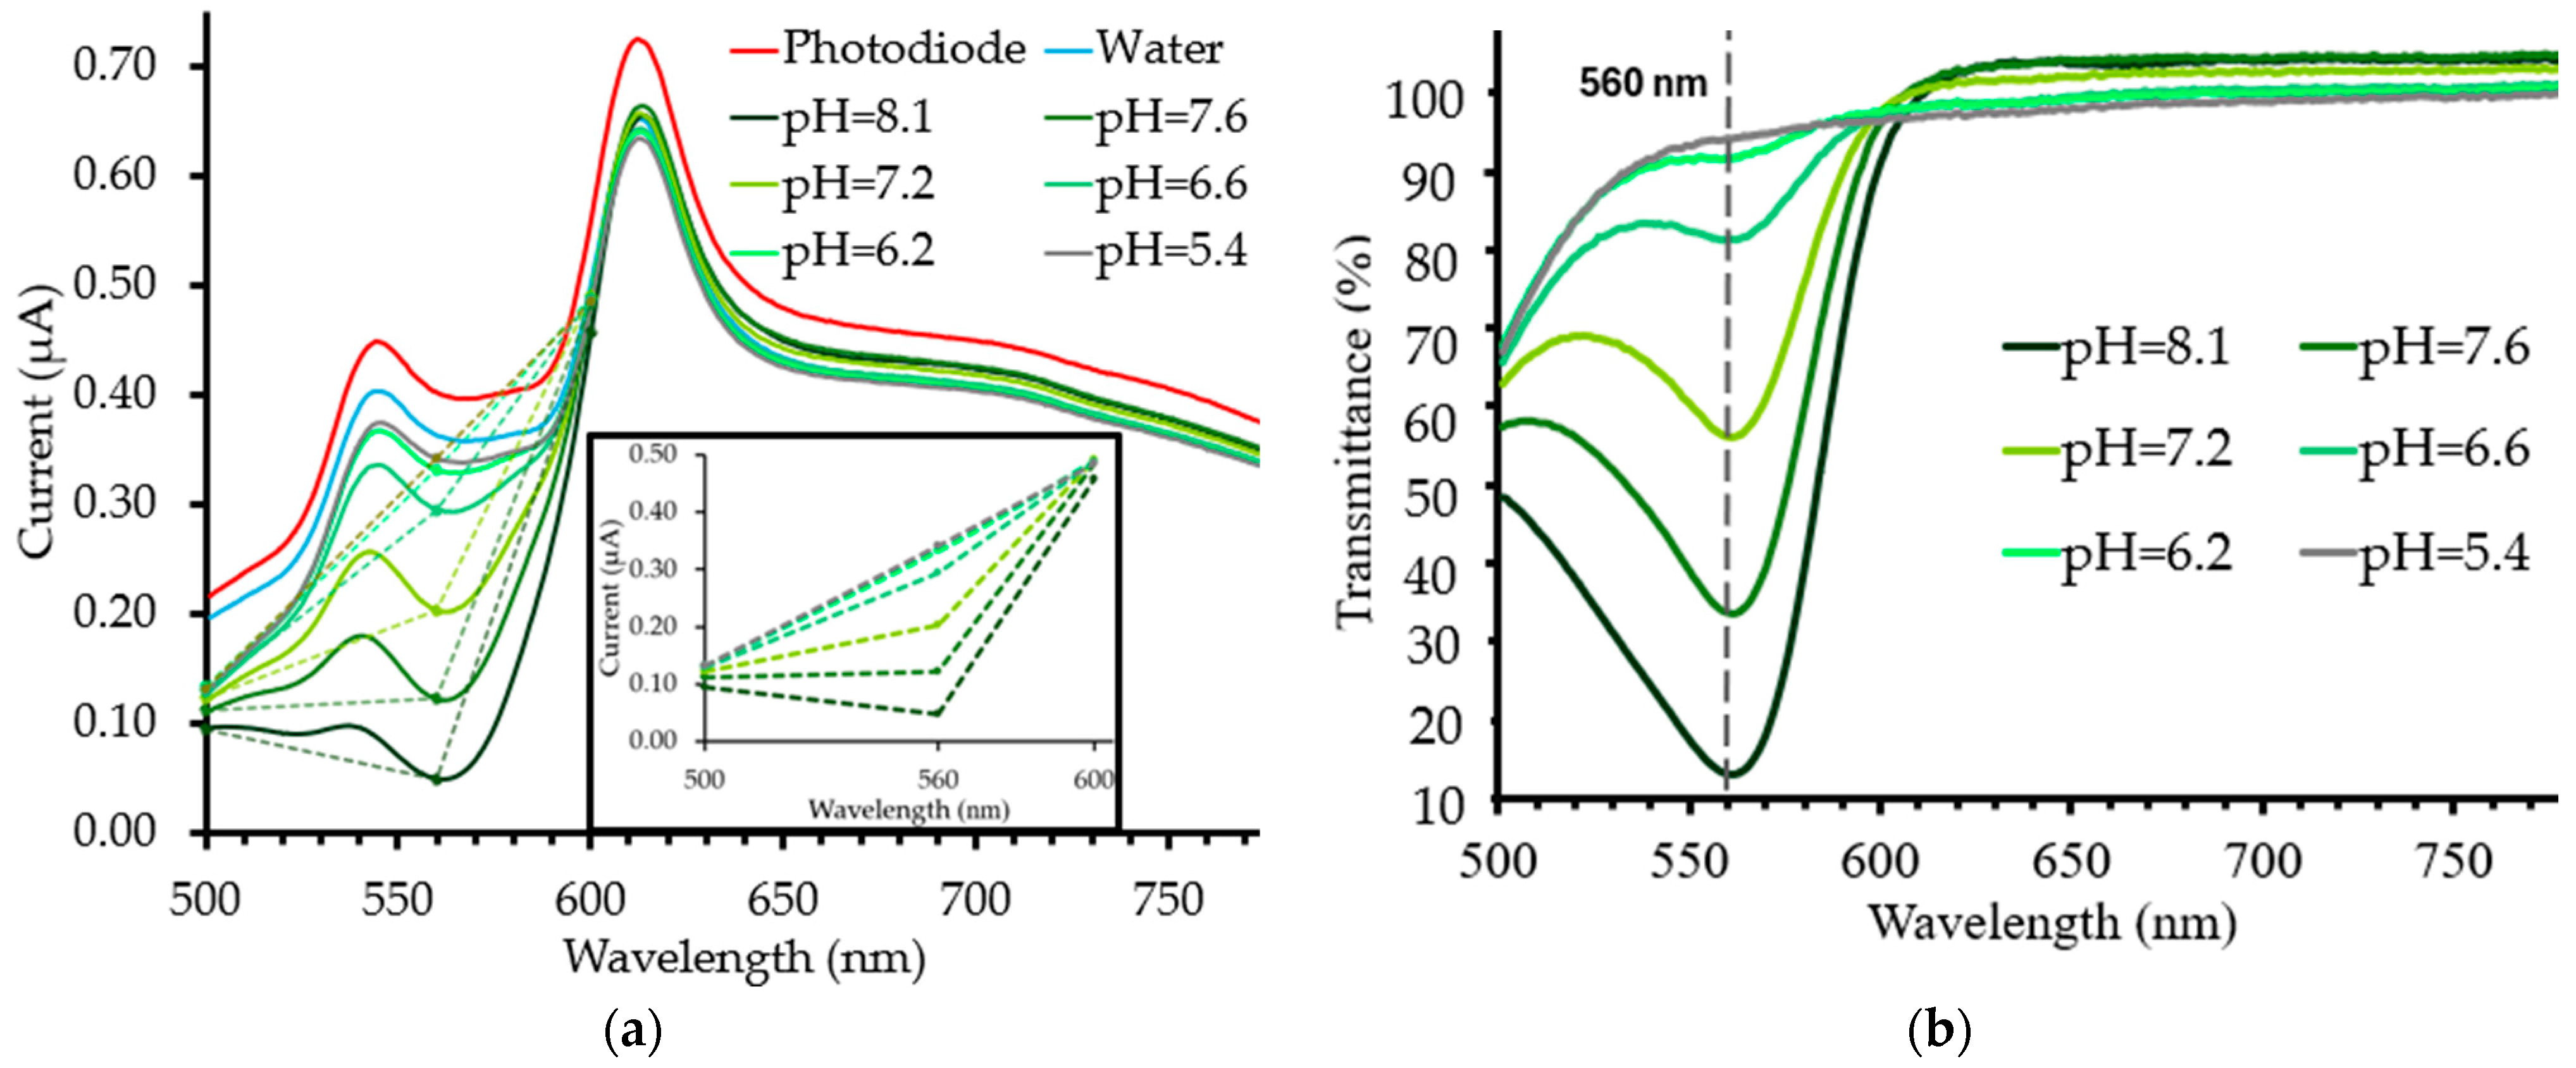
Figure 2a presents the output current signal of the medium solutions and of water, used as reference, which reach the commercial photodiode using a 1 cm optical path cuvette in the optical range between 500 nm and 800 nm, with a 1 nm spectral resolution. Figure 2b presents the corresponding transmittance values using the water sample as a reference (100%). As illustrated in Figure 2b, at 560 nm, the culture medium shows a significant transmittance variation at different pH levels. Based on this observation and in accordance with references [22,23], it was straightforward to define this wavelength as the first one for pH quantification. Then, two additional wavelengths were selected (500 nm and 600 nm), where the transmittance variation was less pronounced, but allowing the slopes of the lines to vary significantly (benefiting from the high sensitivity observed at 560 nm).
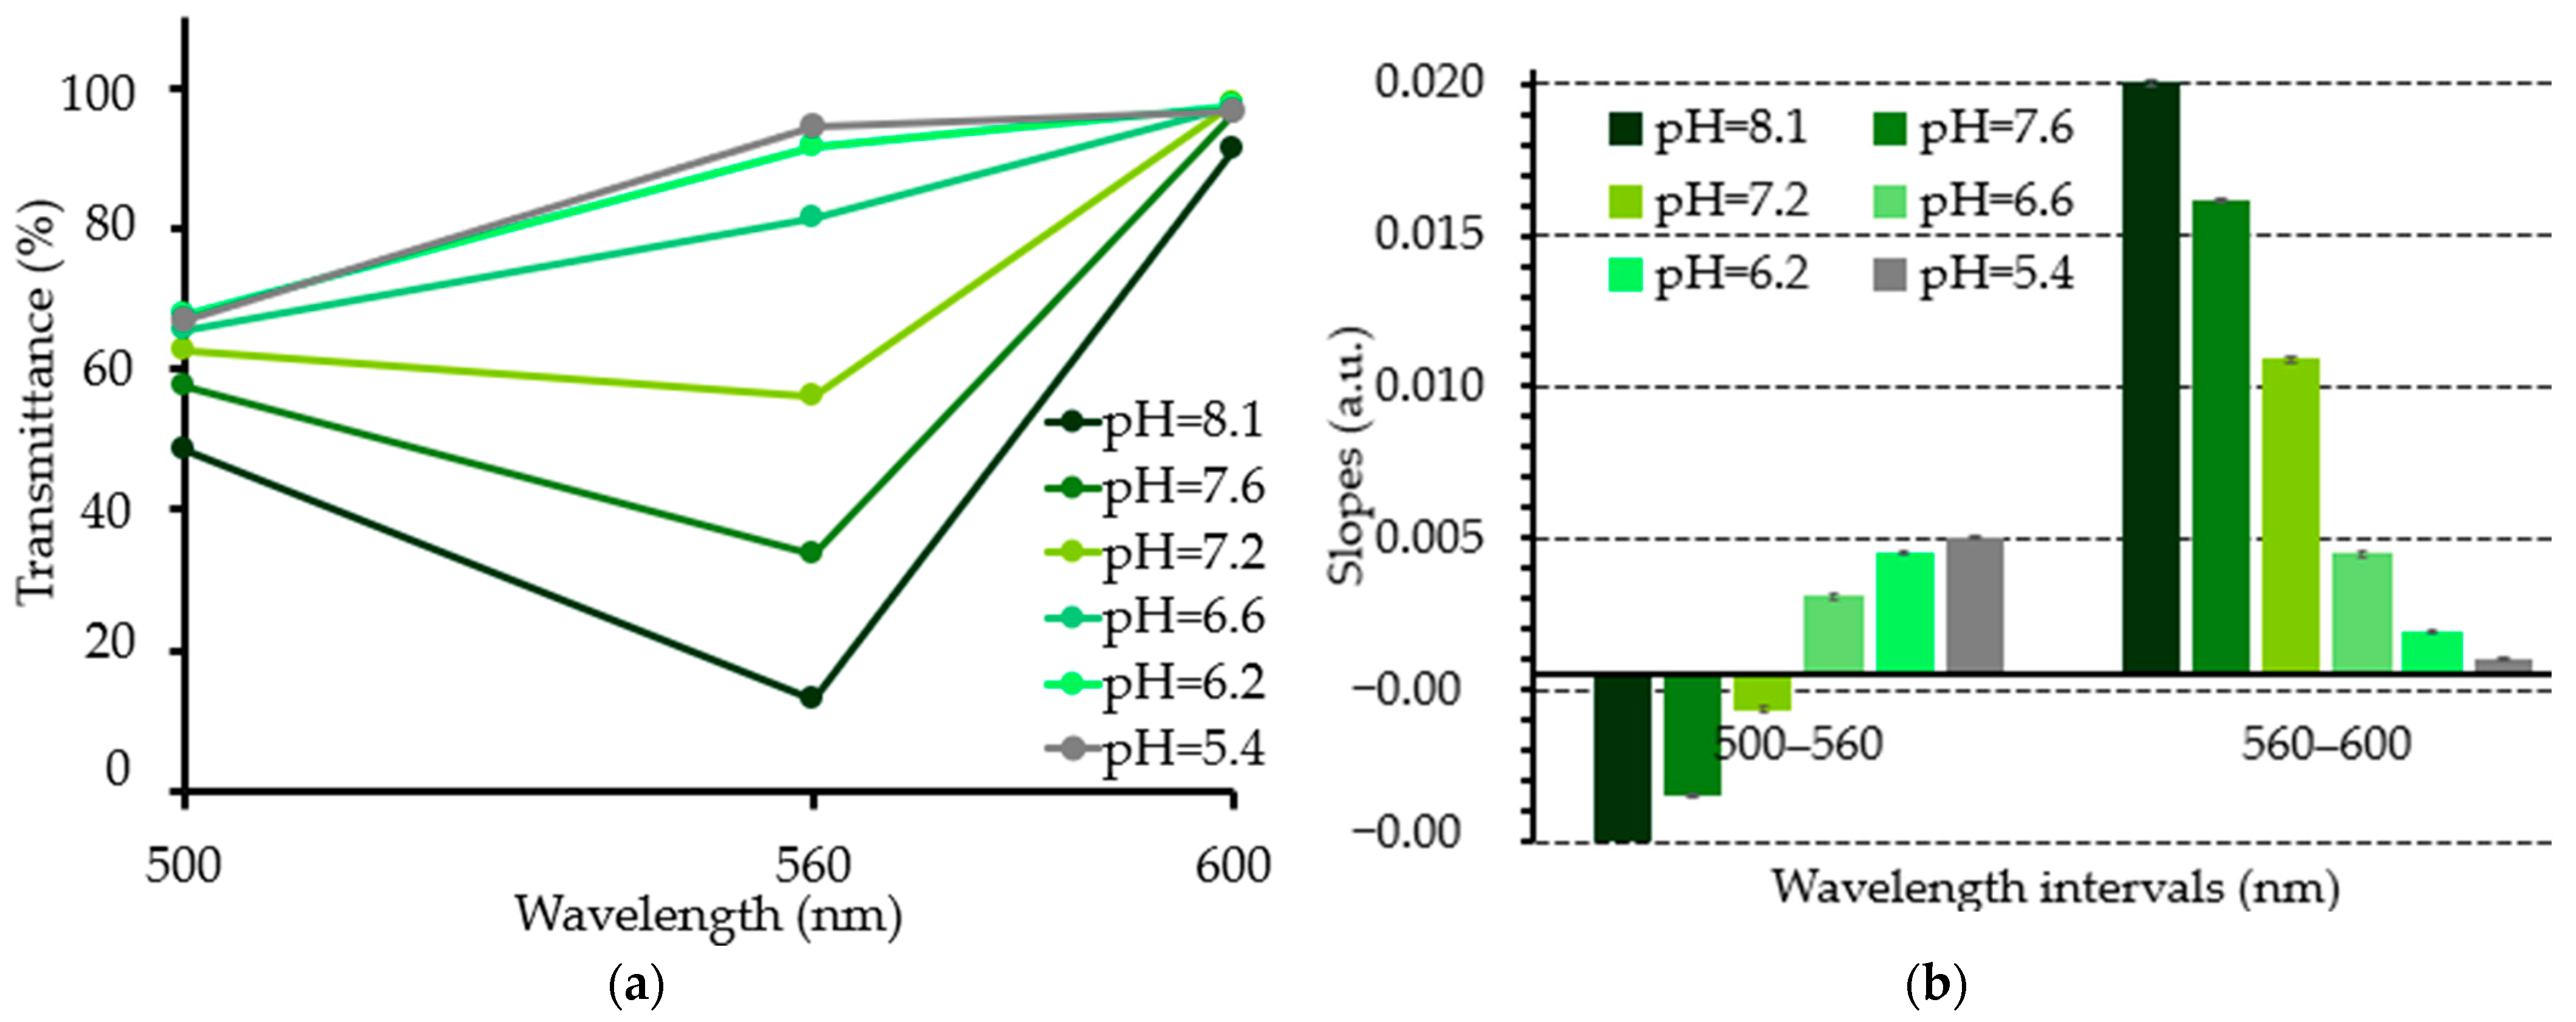
From the obtained current results, and with the goal of establishing an automatic decision algorithm, the transmittance variation between the three wavelengths of 500, 560, and 600 nm was evaluated (Figure 3a). It is possible to observe that the slope between the 400–560 nm and 560–600 nm intervals (dashed lines in Figure 2a) is different for different pH values of the culture medium, as presented in Figure 3b. This result will be used for the selection of the optical detection and signal processing system in the next sections, since the transmittance signal of the culture medium at these three wavelengths will be needed. The standard deviation of the transmittance values and the slopes obtained are presented in Tables S1 and S2 of the Supplementary Materials. Moreover, the results show that if a fourth wavelength was used (at 523 nm), the implemented slope algorithm did not yield improved results for the commercial setup (Figure S1 of the Supplementary Materials).

2.2. Photodiode Specification

CMOS technology allows us to fabricate different types of vertical photodiodes with different p-n junctions, namely a n+/p-substrate, p+/n-well, and n-well/p-substrate. As discussed by Gounella et al. [24] and Ferreira et al. [18], different CMOS processes differ in the dopant concentration and in the junction’s capacitance and consequently have different contributions and impacts on the quantum efficiency. For instance, considering the 0.18 µm CMOS technology, the n-well/p-substate and p+/n-well are the photodiodes’ junctions that achieve the highest quantum efficiencies in the range between 500 nm and 800 nm [24,25]. Therefore, and according to the wavelengths outputted from the previous section, three n-well/p-substrate junction photodiodes will be selected, each with a 100 × 100 µm2 active area, for fabrication using the UMC L180 MM/RF technology.

2.3. Signal Readout Electronics Design

The readout electronics for reading the current outputted by the photodiodes was based on a current-to-frequency (IF) converter, as developed by Ferreira et al. [26], and optimized according to the specifications for this system. The output generated by this converter is a digital signal, which can be acquired by a microcontroller with a frequency that is proportional to the photodiodes’ current. Each photodiode has its own converter integrated into the same die. The main advantages of this topology are its compact size, noise immunity, good repeatability, and robustness, due to its reliance on digital electronics [27]. Its main drawbacks are related to the frequency’s sensitivity to CMOS process doping variations, temperature changes, supply voltage fluctuations, and slow conversion rates at low currents (less than 0.144 pA) [27]. Nevertheless, most of these problems can be mitigated. Process doping variations can be avoided with an initial calibration. In particular, temperature changes can be neglected with a temperature calibration circuit, and supply voltage fluctuations can be managed with a stable reference [27].
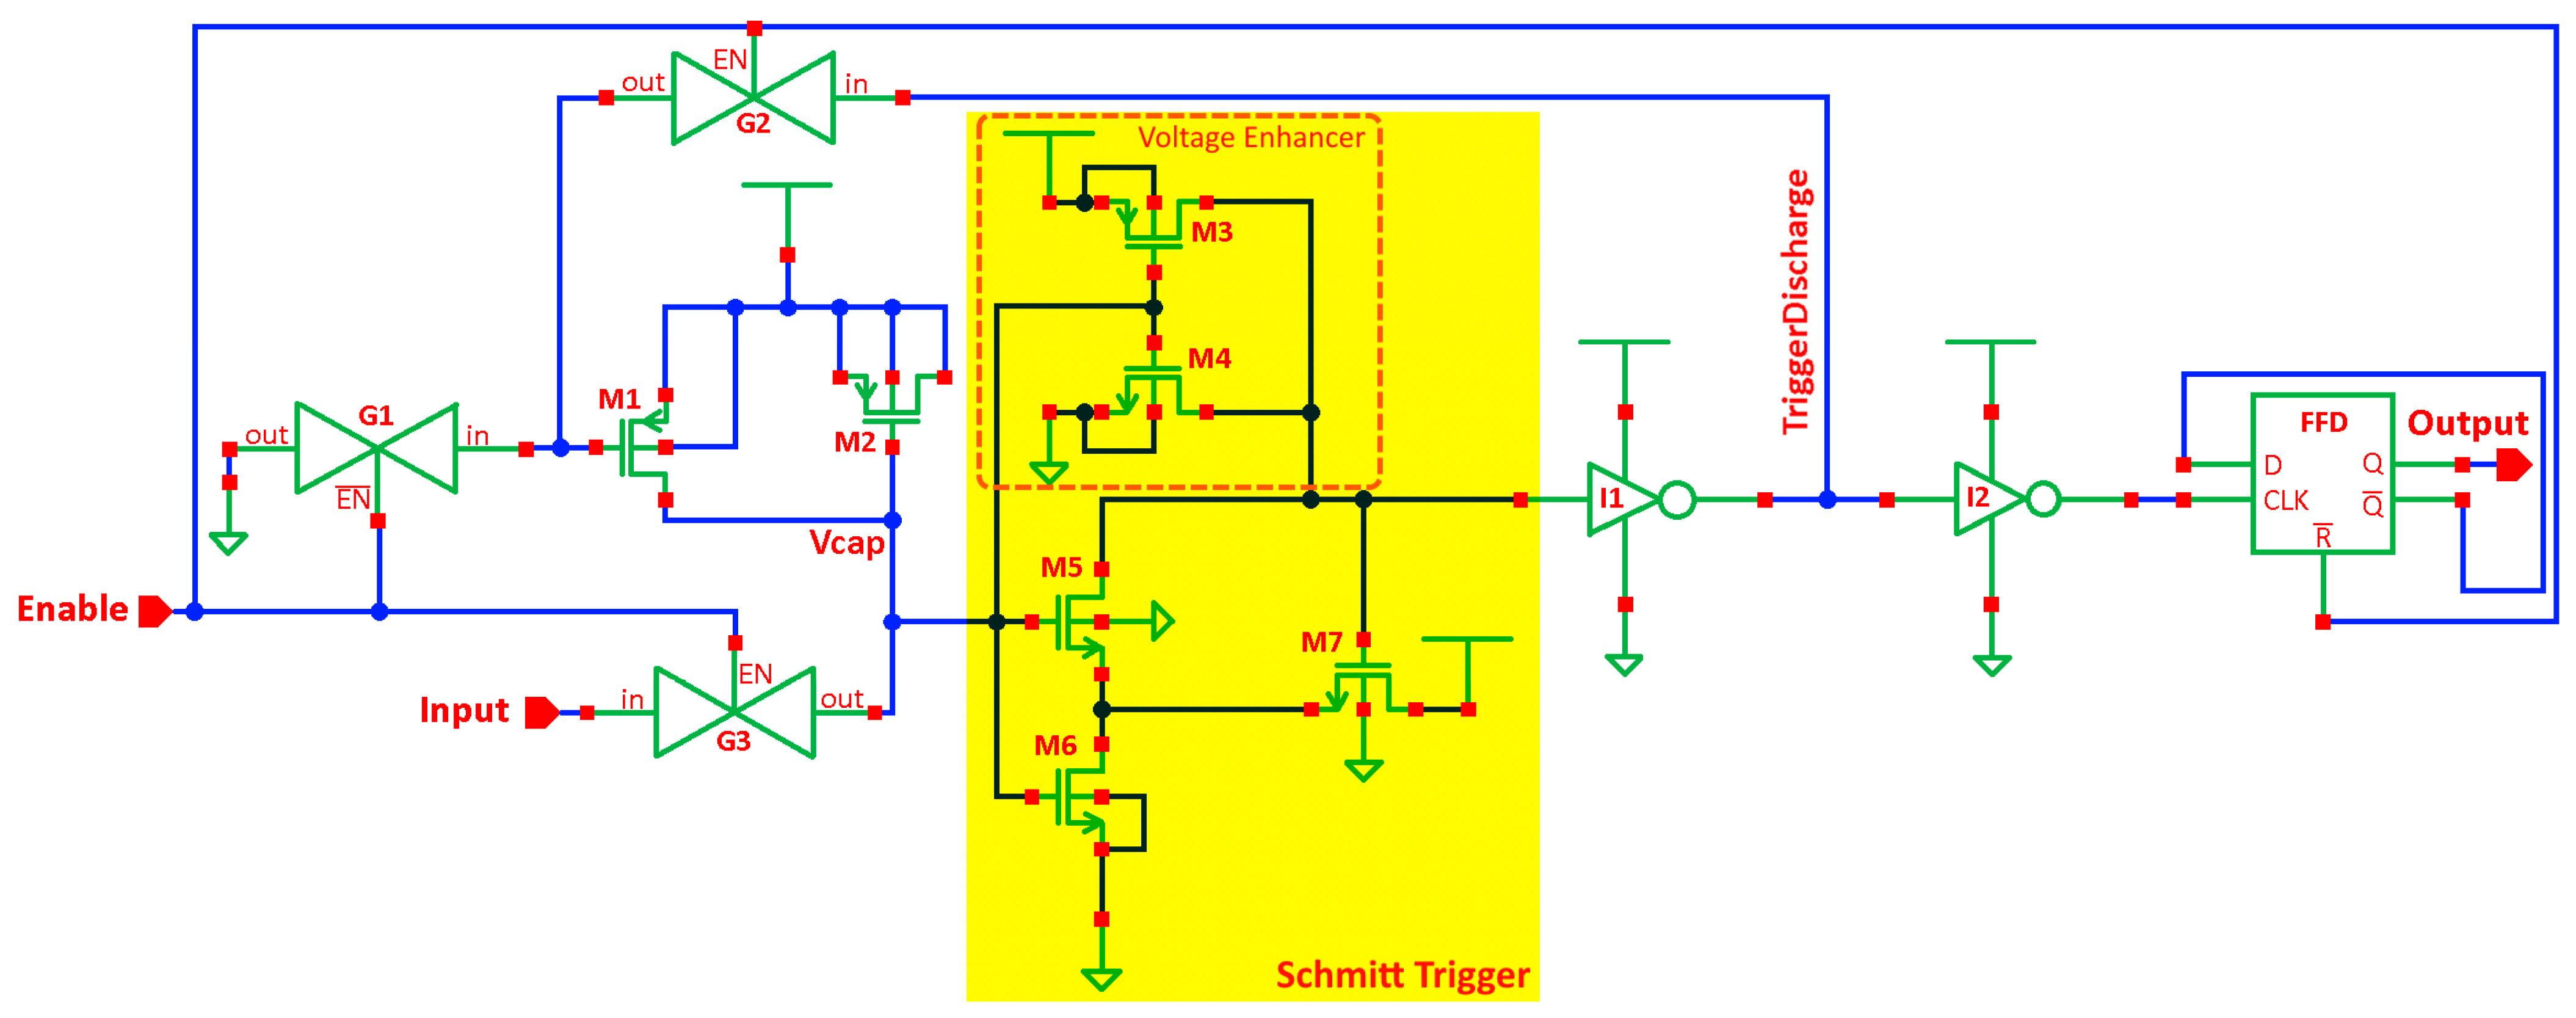
Briefly, this converter (Figure 4) is based on a capacitor, M2, and is used as a storage element. This capacitor is charged by the current outputted by the photodiode, and the converter’s output is obtained through repetitive cycles of the capacitor charging and discharging, which is controlled by a Schmitt trigger (ST). When the capacitor terminal’s voltage VCap exceeds the ST’s upper threshold, the ST’s output is at a high logic level, leading to the discharge of the capacitor through M1 until it reaches the ST’s lower threshold. This causes the ST to switch to a low logic level, charging the capacitor again and repeating the cycle.
For this application, the use of a Schmitt trigger is advantageous over a standard comparator due to its superior noise immunity, which is more reliable for switching between high and low logic levels [26]. Additionally, in this work, instead of using a conventional Schmitt trigger as in [26], we implemented a low-power CMOS-based Schmitt trigger model for each converter, also in the 0.18 µm CMOS technology, as proposed by Jha et al. [28] and highlighted in yellow in Figure 4.
Regarding the design of the converter, the reliability and power consumption of a circuit are crucial factors in determining whether a design should be incorporated. Particularly, the Negative Bias Temperature Instability (NBTI) [29] is a key factor in assessing a circuit’s suitability for use. The NBTI has a greater impact on p-channel MOS (pMOS) devices, leading to a significant shift in the threshold voltage over time, especially at high temperatures (125 °C). This results in a reduced drive current and shortens the circuit’s lifespan [30]. Due to the CMOS inverter’s susceptibility to latch-up and the effects of NBTI on pMOS transistors, an nMOS-only output buffer is often more efficient and practical [28]. The impact of the NBTI can be mitigated by replacing the pMOS pull-up network with a voltage-enhancing circuit. The main drawback of using an nMOS-only pull-up network is that the logic 1 voltage (VDD) is not sharp, which is the reason why a voltage-enhancing circuit is employed using a push–pull amplifier. As such, the proposed improved model of the Schmitt trigger consists of nMOS transistors (M5, M6, M7), aided by a voltage enhancer with one pMOS (M3) and one nMOS (M4). According to Jha et al. [28], this circuit enables a reduction in the silicon area without affecting the performance, a decrease in the NBTI effect, and, above all, a remarkable reduction of 41.94% in power consumption compared to the conventional CMOS Schmitt trigger [28].
The Flip Flop D (FFD) ensures a duty cycle of 50% in the output signal of the current-to-frequency converter and allows the pulses generated by the Schmitt trigger to be synchronized to its clock. The transmission gates (TGs) G1, G2, and G3 are responsible for connecting and disconnecting the circuit [26] through the “Enable” terminal (Figure 4).
The (M2) capacitor discharging time is defined by the capacitance of the pMOS ( C M 2 ). This capacitance value is 0.13 pF, which can be calculated using Equation (1) [31]:
C M 2 = C o x × W × L
where W is the gate width (4 µm), L is the gate length (4 µm), and C o x is the pMOS oxide gate capacitance per square meter, which is calculated using Equation (2) [31]:
C o x = ε o x t o x
where ε o x is the permittivity of the silicon dioxide (3.45 × 10 11 F/m [32]), and t o x is the thickness of the gate oxide layer of the 0.18 µm CMOS technology (4.27 nm) [33].
The microsystem comprises the microelectronics chip, which includes the photodiodes and the current-to-frequency converters, as well as the microfluidic device.

2.4. Optical Detection System Fabrication

The photodiodes and their readout electronics were fabricated using the UMC L180 MM/RF technology from IMEC, Europractice.
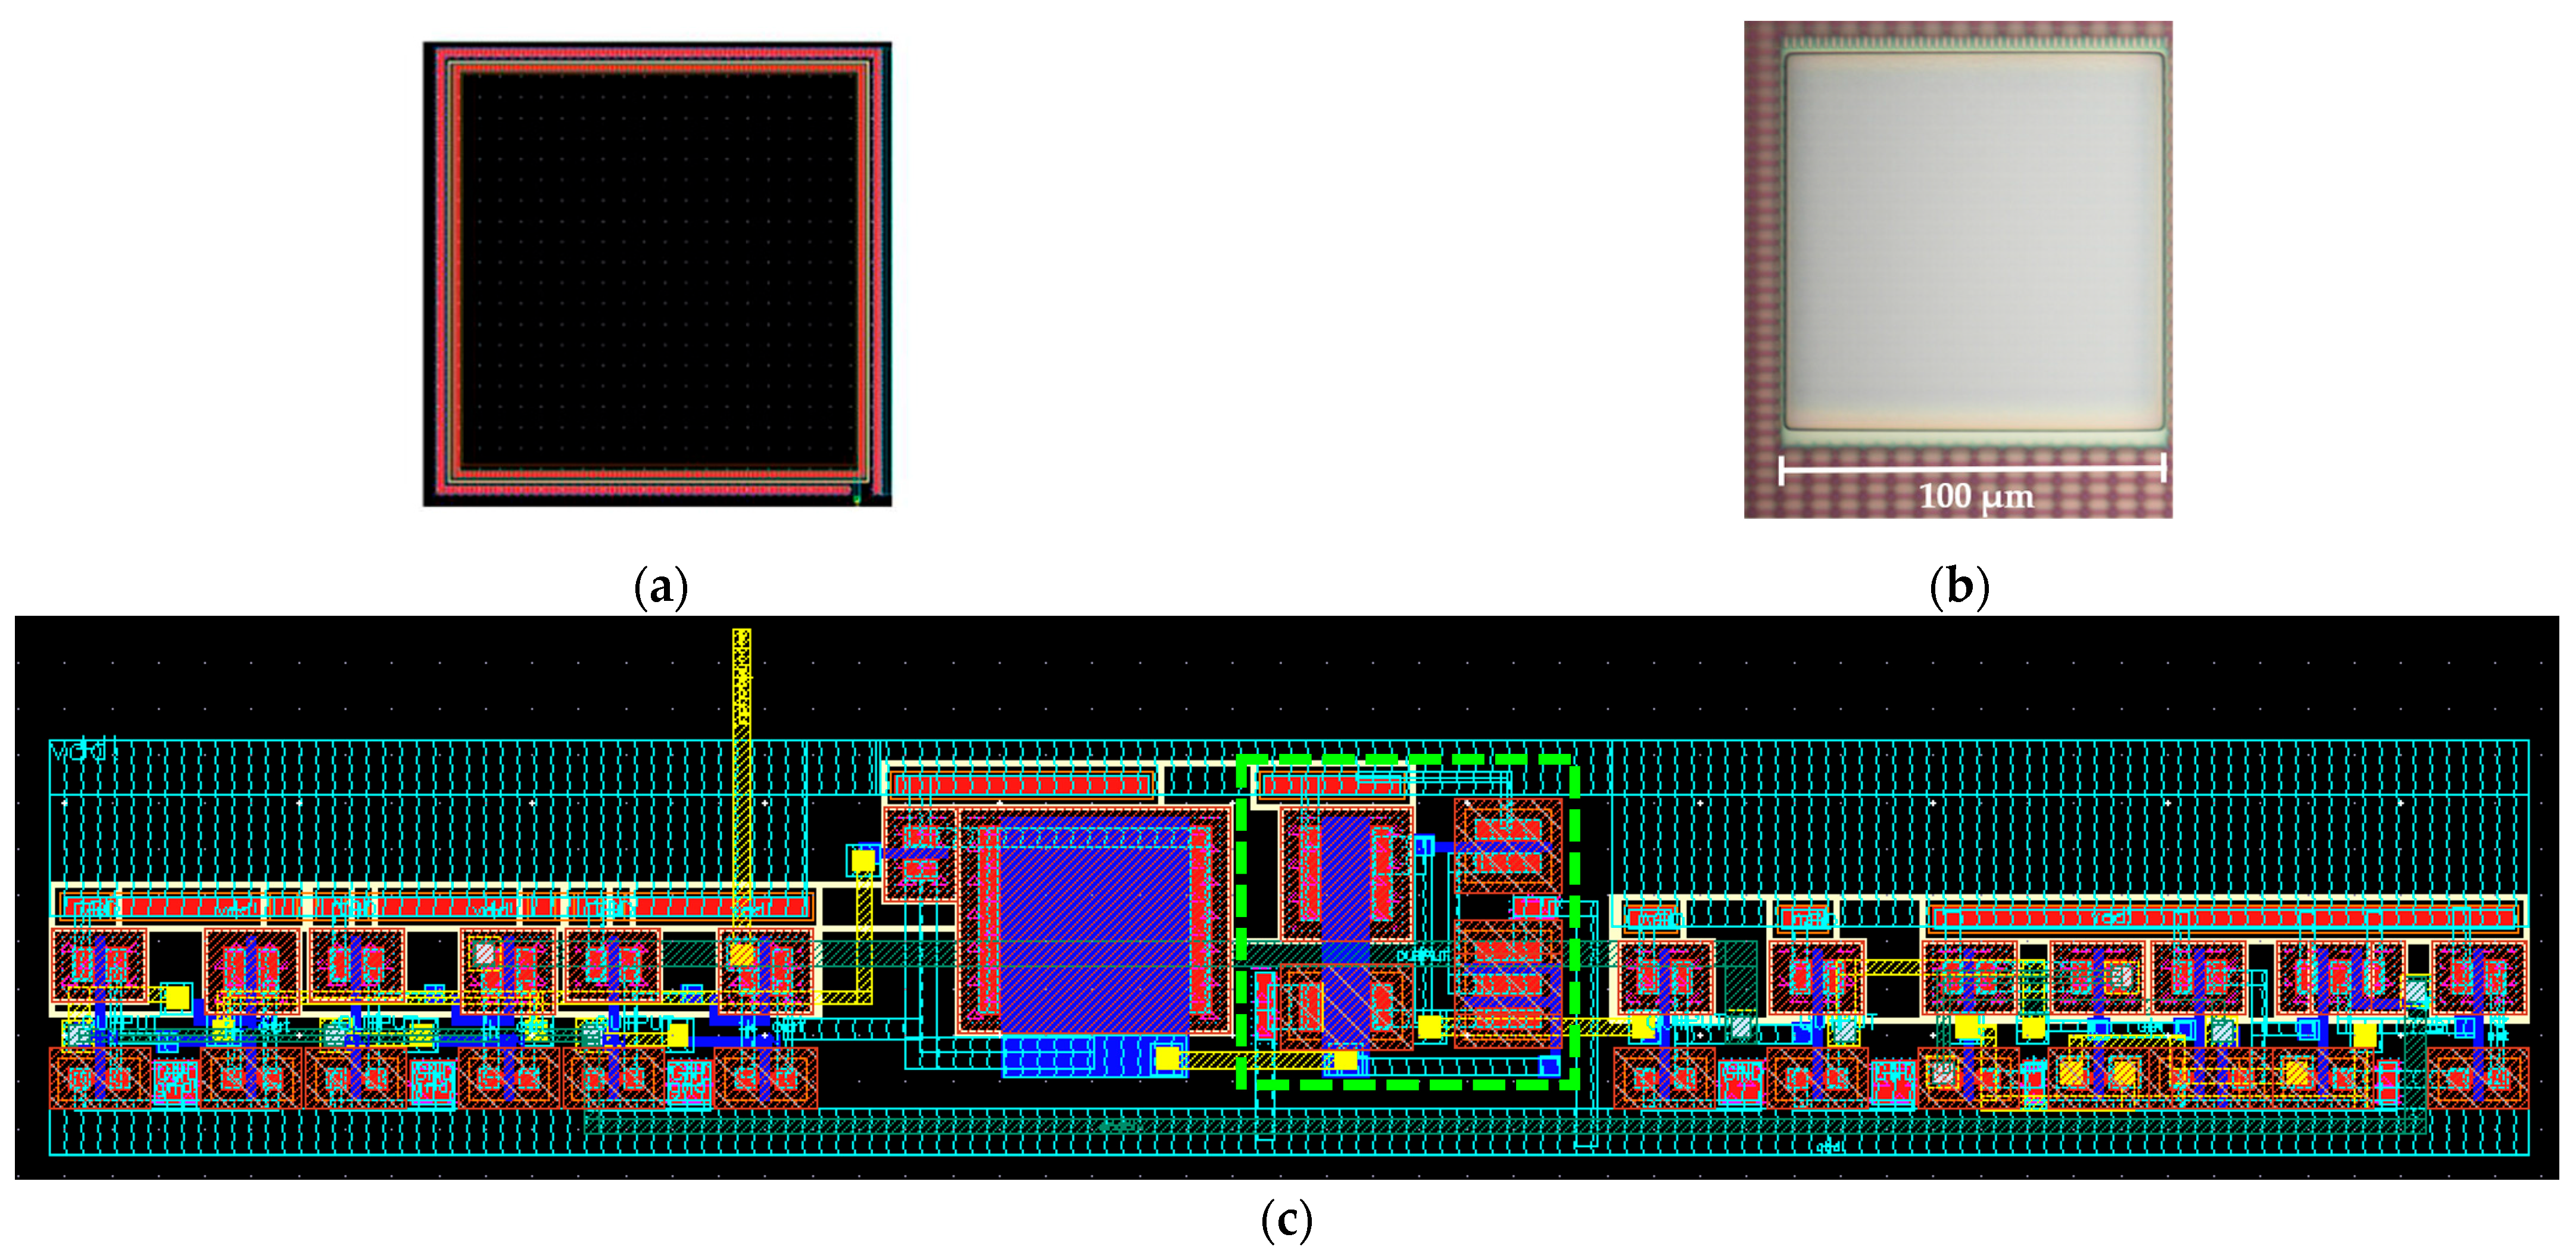
To design the n-well/p-substrate photodiode layout, a diffusion mask was used together with the nplus(n+) and pplus(p+) masks, allowing us to build the cathode and anode of the photodiode, respectively. Furthermore, an n-well layer of 100 × 100 µm2 was used as the active area, with the cathode and anode being located around that n-well layer. Finally, several metal contacts were inserted above the nplus and pplus masks to connect with the metal1 layer, allowing for the complete design of the cathode and anode of the photodiode. Figure 5a presents the layout of the photodiode designed in CADENCE Tools, and Figure 5b shows a microscope photography of the fabricated photodiode. The IF converter layout (Figure 5c) used the same masks’ library as the photodiodes’ layout. Each converter comprises an area of approximately 53.1 × 8.9 µm2.

2.5. Organ-on-a-Chip Microfluidic System Integration

The organ-on-a-chip microfluidic devices that were used to perform the experimental pH measurements were fabricated in polydimethylsiloxane (PDMS) by soft lithography using a mold of polymethyl methacrylate (PMMA) manufactured by laser cutting [12,34]. The process started with the drawing of the mold using the 3D CAD software (Autodesk Fusion 360 v.2.0.18719), which was then imported by the control software of the laser cutter. Using a cutting speed of 5 mm/s and a laser beam power of 12 mA, a sheet of 3 mm of PMMA was cut. In order to make the final PMMA mold, the substrate containing the channels and a base were glued with a high-temperature adhesive (Nural 92, Pattex, Portugal). After the mold fabrication, a PDMS mixture, composed of 1/10% wt of base/curing agent from the Sylgard® 184 Silicone Elastomer Kit (Dow, Midland, Michigan, EUA), was poured over the PMMA mold and cured at 80 °C for 45 min. After the curing of the PDMS, the structure was removed from the mold, and holes were punched to provide access to the inlets and to the outlets in the desired locations. Finally, the channels were closed with a glass slide by oxygen plasma for 30 s at 30 W (Plasma Systems ZEPTO from Diener electronic, Ebhausen, Germany). A schematic of the final PDMS device is shown in Figure 6. The final PDMS device comprises two wells: one was used for culture media at various pH levels, and the other was used to hold the water sample that served as a reference.

3. Results and Discussion

3.1. Measurement Setup and Sample Preparation

The optical setup used for the pH measurements was similar to that described in Section 2.1, but now, the commercial photodiode was replaced by the fabricated CMOS photodiode of the chip, and the 1 cm optical path cuvette was replaced by the 3 mm optical path PDMS microchannels. Additionally, to eliminate the ambient light variations and obtain accurate results, a black box was designed and 3D-printed, with fittings for insertion and alignment of the CMOS chip and the glass substrate with the PDMS microchannel, as shown in Figure 7. Nevertheless, even if such a black box had not been employed, since all measurements were based on the slopes between wavelengths, the absolute light power was not considered, and as the experiment was performed at the same time in a final prototype (three photodiodes), the effect of the ambient light variations will be negligible. Six culture medium samples were prepared as described in Section 2.1, using an initial volume of 15 mL of culture medium (kit EGM™-2 Endothelial Cell Growth Medium-2 BulletKit™), 450 µL of HCl, and 30 mL of water. Then, a quantity of HCl was slowly added to each previous solution to achieve each pH value of interest (7.7, 7.3, 6.6, 6.2, 5.4, and 4.4), and the values were measured with the commercial pH meter. Each culture medium solution was inserted in the microchannel using a syringe (to avoid the formation of bubbles) connected to a Polytetrafluoroethylene (PTFE) tube, while a second PTFE tube was connected to the outlet (Figure 7). For each sample, including the reference sample (water), three assays were performed.

3.2. Readout Electronics Characterization

For the sizing of the nMOS transistors in the Schmitt trigger, the impact on the power consumption, the converter resolution, and the generated output square wave form and its frequency were taken into account. After various iterative combinations, the value of the nMOS transistors (M5, M6, and M7 in Figure 4) were optimized at a width of 1.4 µm and a length of 0.18 µm, which allowed for a satisfactory performance considering the mentioned variables. Regarding the voltage enhancer, the pMOS transistor (M3) had a width of 2 µm and a length of 1 µm, while the nMOS transistor (M4) had a width of 1 µm and a length of 1 µm.
The chosen values for the M2 and M1 transistors were 4 µm/4 µm and 0.72 µm/0.18 µm, respectively. The converter’s characteristic curve is described by the mathematical expression F = 0.033 i 2 + 5303.143 i + 3,949,640.687 , where F and i correspond to the converter’s output frequency and current, respectively (Figure 8a). The converter presented a linear range within the current range of 30 pA to 3800 nA, as shown in Figure 8b.
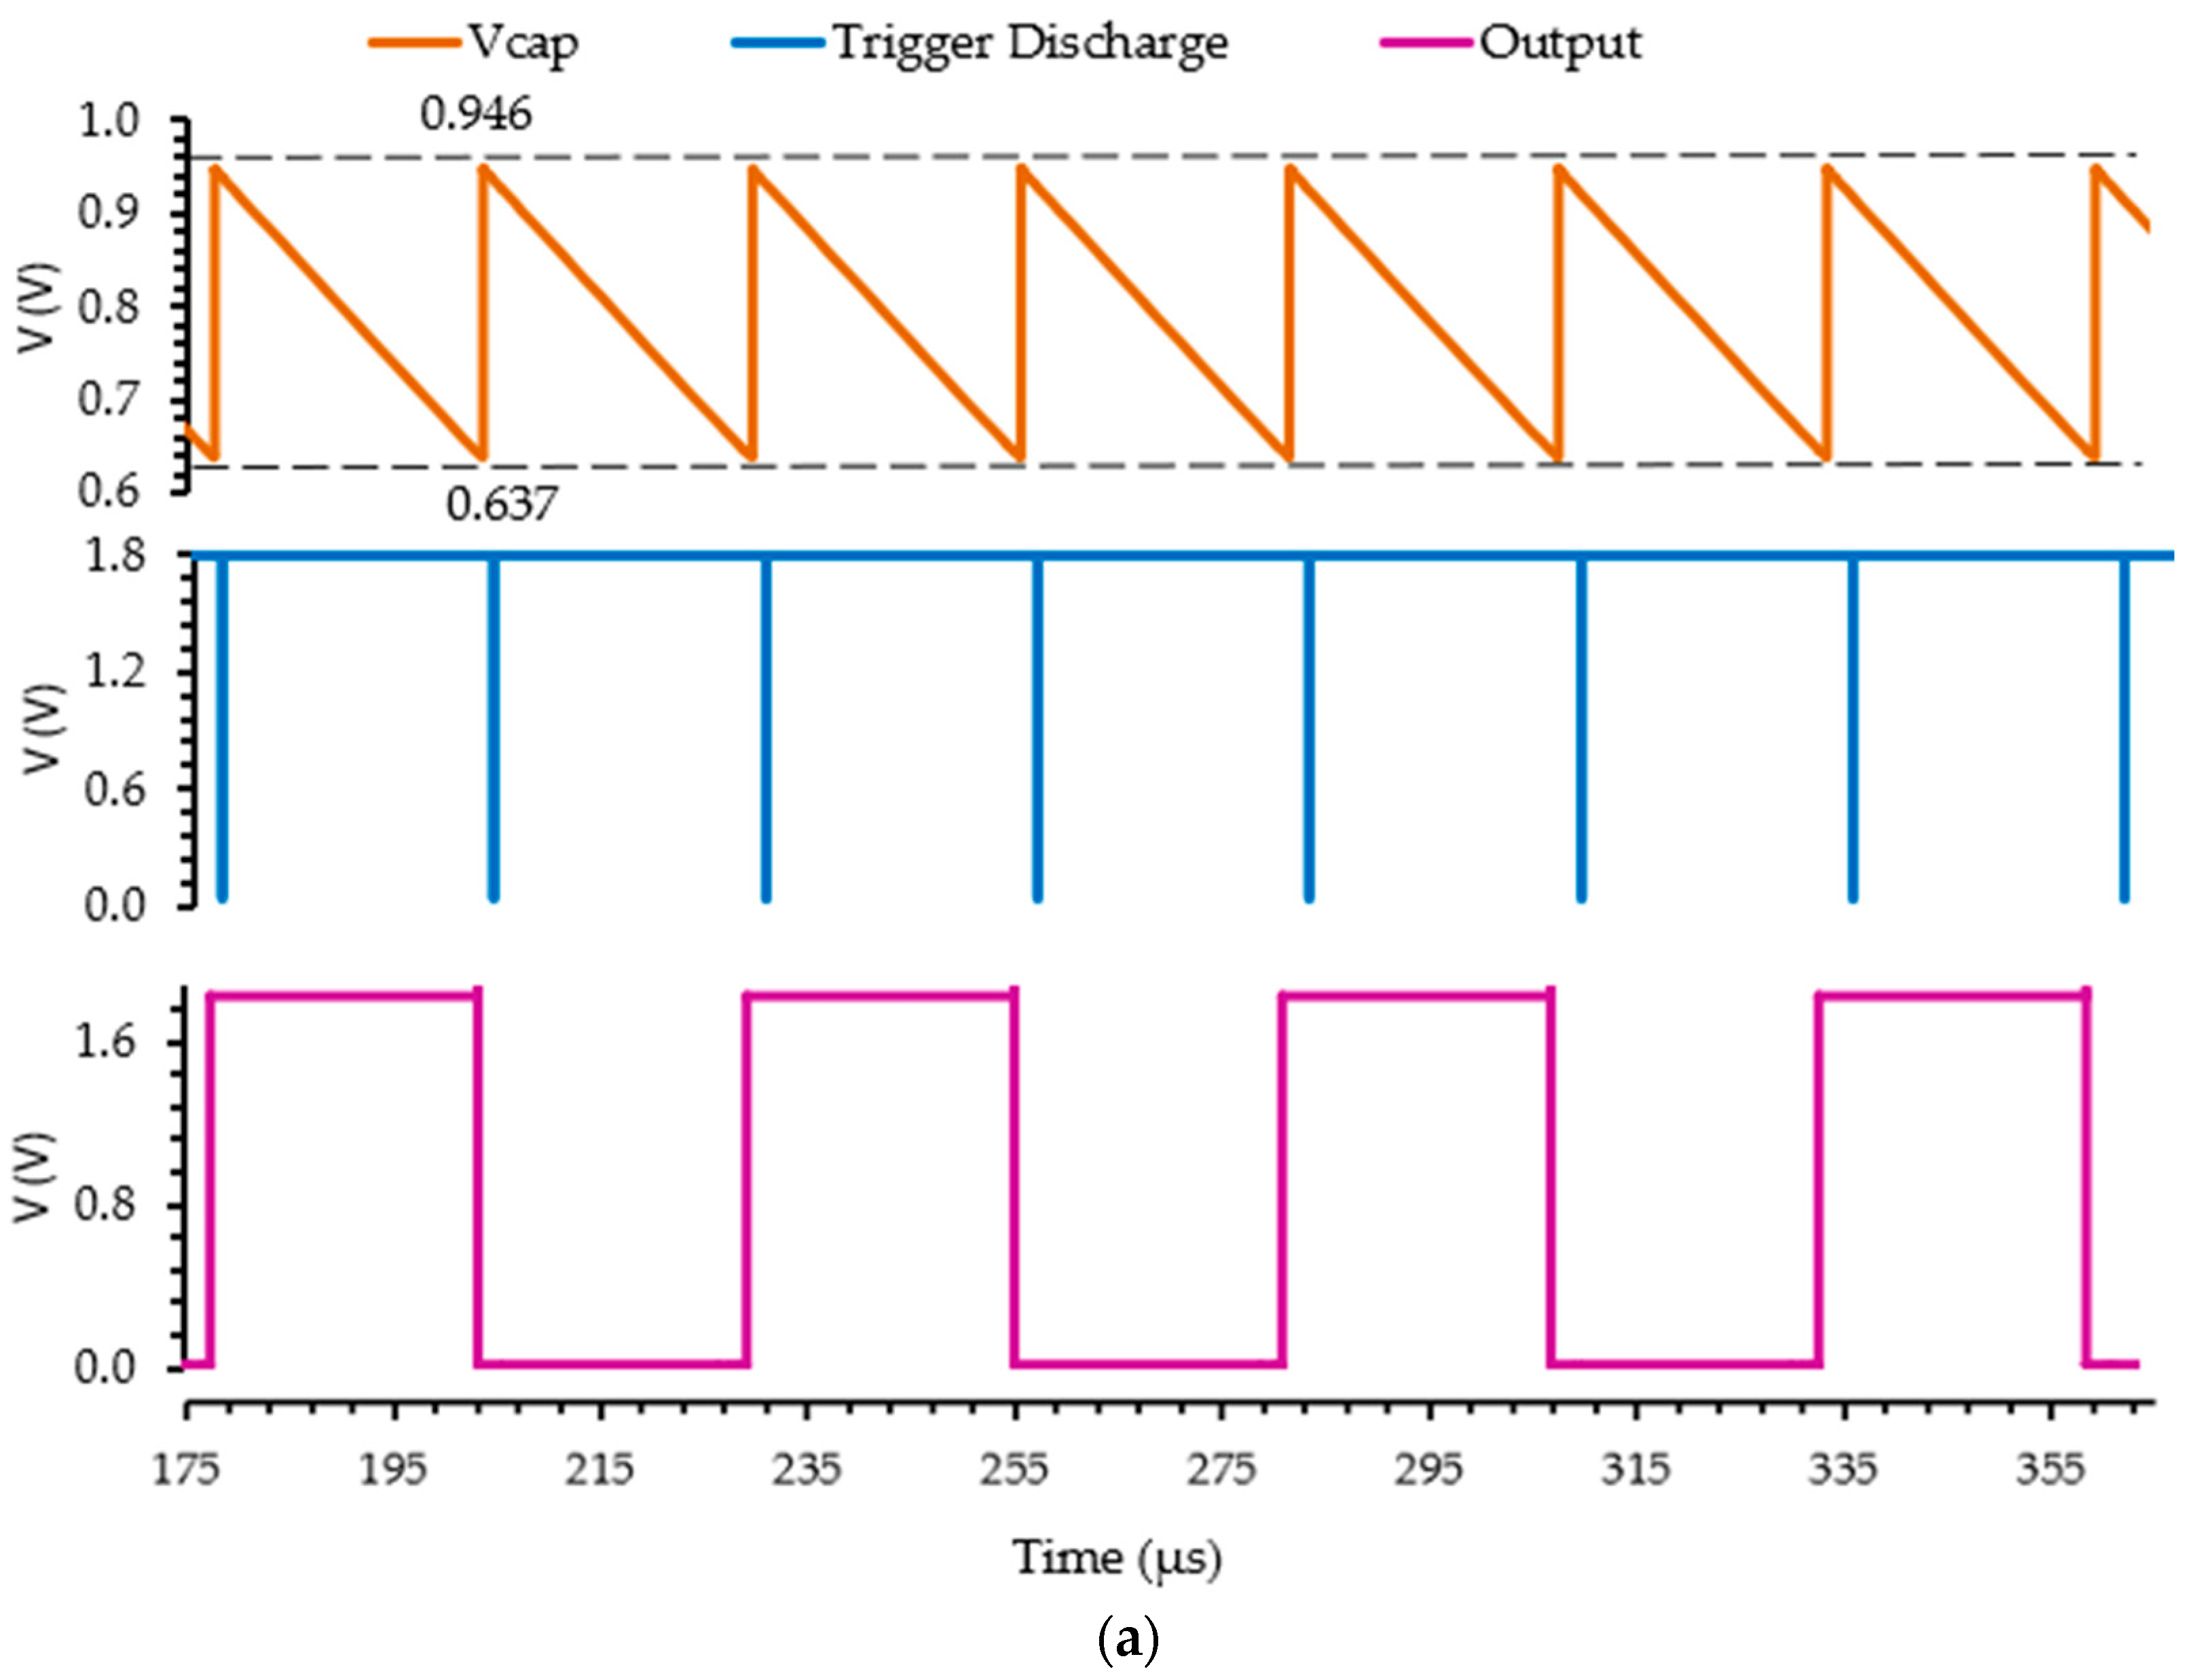
Figure 9 presents the simulated result obtained using a current source of 2 nA (the input terminal in Figure 4) for simulating the photodiode’s current. This current value comprises the range of the n-well/p-substrate junction photodiode currents, 0.2 to 2 nA, measured using the setup described in Section 3.1.
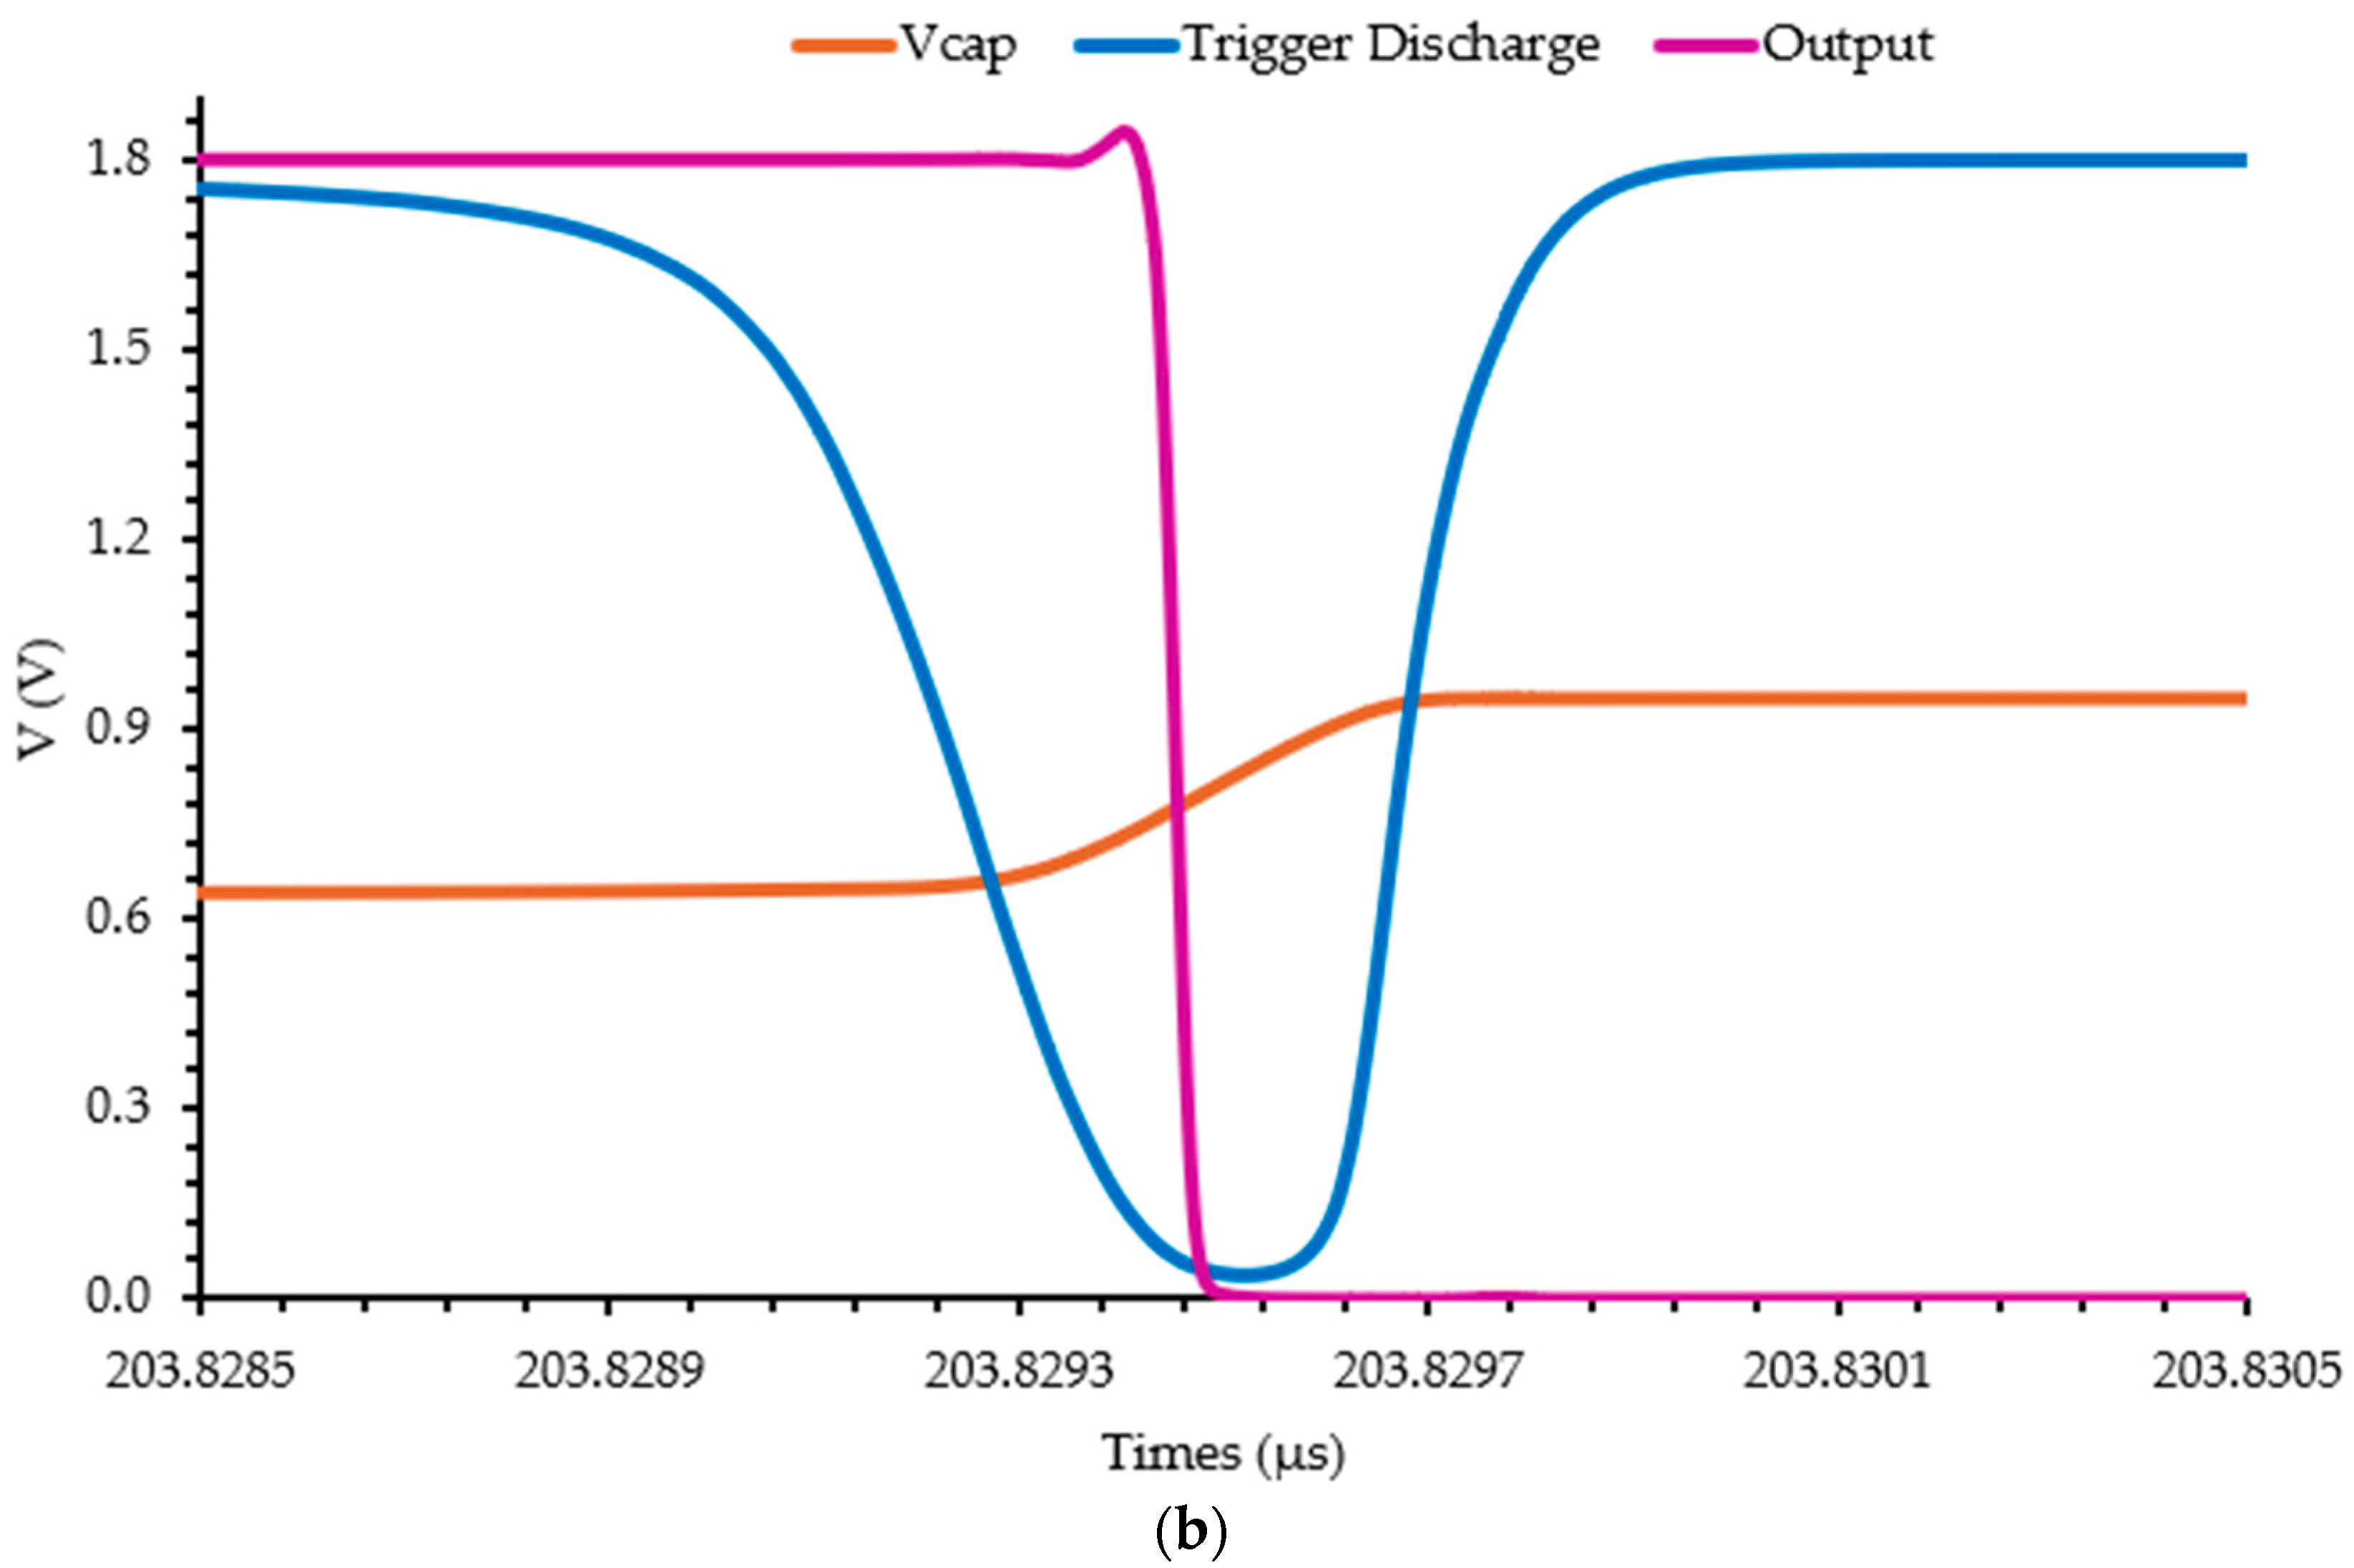
The Vcap signal corresponds to the M2 gate voltage, “Trigger Discharge” is the Schmitt trigger output signal that is responsible for discharging the M2 capacitor, and “Output” is the current-to-frequency converter’s output signal with a 50% duty cycle and a frequency that is proportional to the input current (photodiode’s current). In Figure 9a, the Schmitt trigger’s upper and lower threshold voltages are 946 mV and 637 mV, respectively. Figure 9b presents a zoomed-in view of a region that clearly shows the capacitor discharging for approximately 0.4 ns.

3.3. Experimental pH Measurements

Using the measurement setup and the samples presented in Section 3.1, the transmittance of the culture medium was obtained.
Firstly, the selected 100 × 100 µm2 n-well/p-substrate junction photodiode was fabricated and characterized using the optical setup described in Section 3.1. The responsivity and quantum efficiency of this photodiode in the optical range between 400 nm and 850 nm are presented in Figure 10.
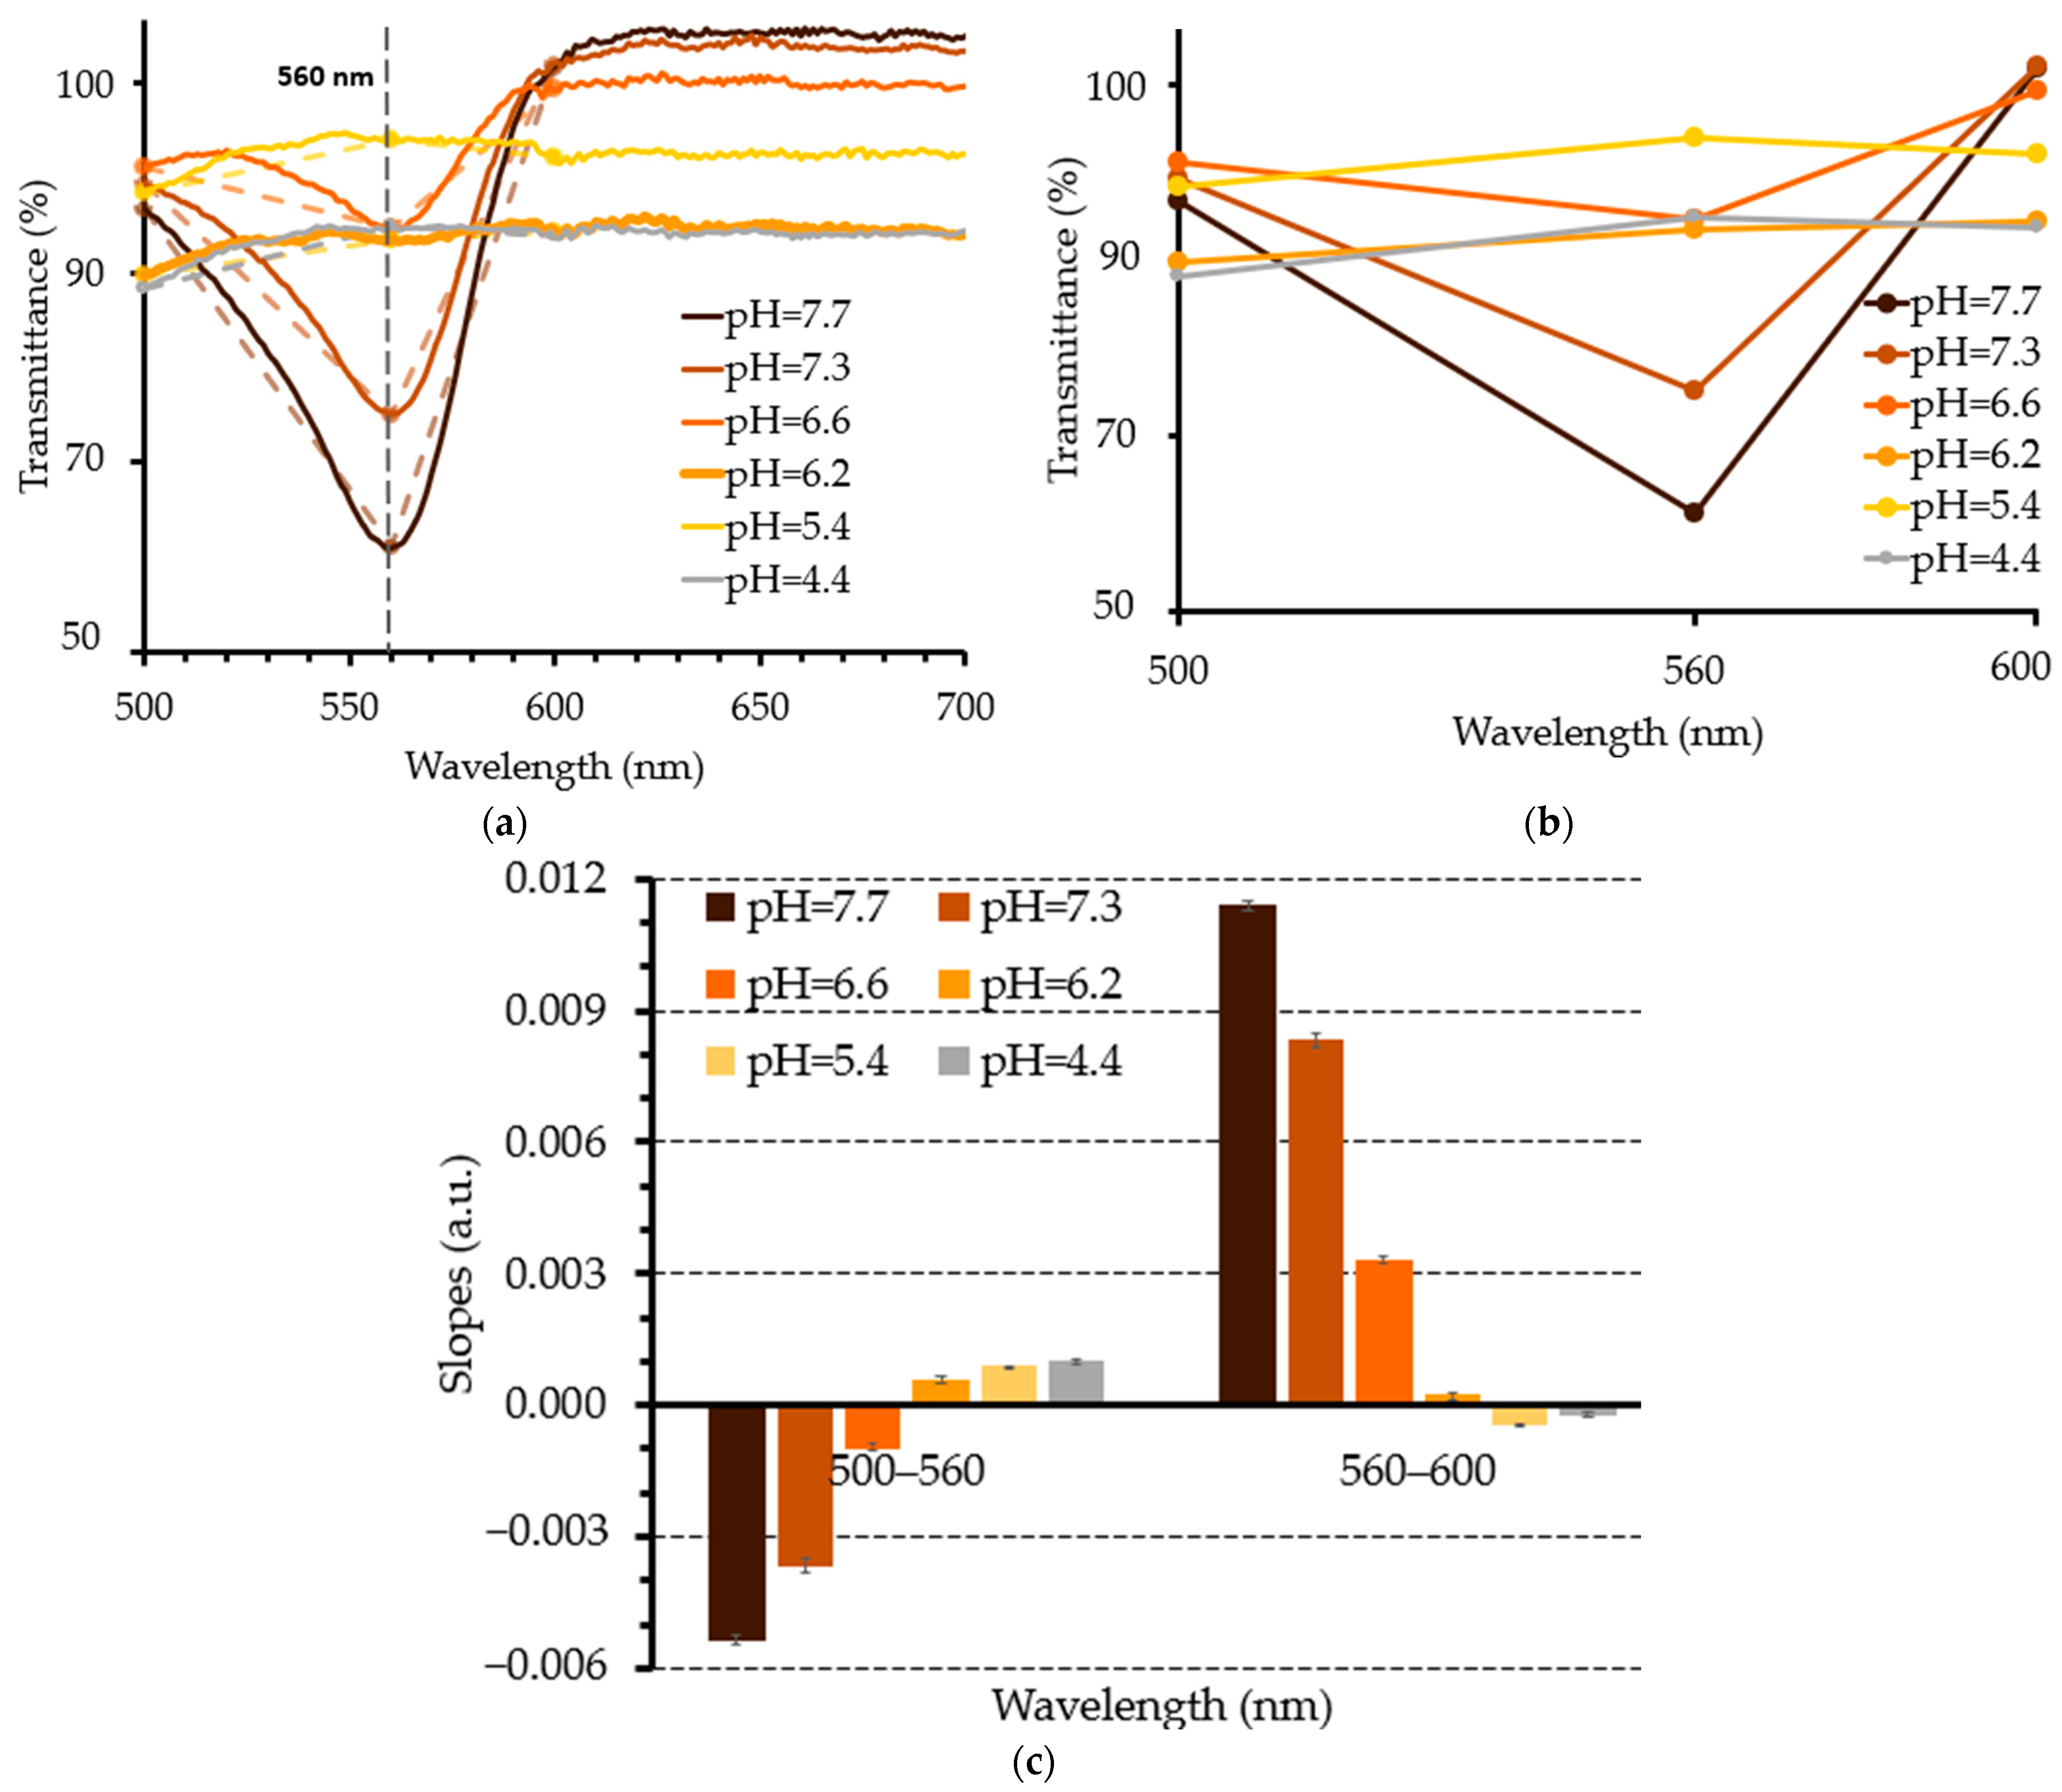
The performance of the developed microsystem was demonstrated through transmittance spectrophotometry using culture media samples with varying pH values (7.7, 7.3, 6.6, 6.2, 5.4, and 4.4) that were inserted into the microfluidic chambers of the organ-on-a-chip microfluidic device mentioned in Section 2.5. The results revealed that the transmittance varied with the pH of the medium and the wavelength range, leading to distinct slope features between different wavelengths.
Figure 11 highlights the system’s capability to detect and differentiate pH variations in the culture medium. Figure 11a,b present the average transmittance of the samples at different pH levels. The transmittance was calculated by dividing each measured current signal by the reference current signal (water sample), yielding nine transmittance values per sample. From these, 81 slopes were calculated for each sample across the studied wavelength ranges.
In the 500–560 nm range, the amplitude of the slope magnitude increased for both acidic and basic media, indicating higher sensitivity at these pH extremes. A significant transition in the slope signal magnitude was observed between a pH of 6.6 and 6.2, where the slopes shifted from negative in basic media to positive in acidic media. This behavior is shown in Figure 11c, which illustrates the average slopes across the 81 slopes per pH level, with a maximum standard deviation of 0.00034. The standard deviations of the experimental results are presented in Tables S3 and S4 of the Supplementary Results.
In the 560–600 nm range, the slopes consistently decreased as the pH became more acidic, further emphasizing the distinct behavior of the slopes as a function of pH in different spectral ranges. These findings confirm that pH variations significantly affect the optical properties of the medium, with clear spectral dependencies.
The developed system was able to detect and differentiate pH variations in the culture medium. The use of three wavelengths allows for a reduction in the number of photodiodes that are required for detecting the light transmitted by the samples, thereby decreasing the space occupied on the final CMOS chip [35].

4. Conclusions

This study presents the design and characterization of an optical microsystem for pH detection in the EGM™-2 Endothelial Cell Growth Medium-2 BulletKit™, aiming for integration into an organ-on-a-chip system. Spectrophotometric macroscopic measurements identified significant slope variations between the transmittance values in the range of 500–560 nm and the range of 560–600 nm. Three transmittance values at 500 nm, 560 nm, and 600 nm were sufficient to determine these slopes.
The microsystem includes three 100 × 100 µm2 n-well/p-substrate photodiodes, fabricated using CMOS UMC L180 MM/RF technology. A CMOS IF converter was designed and optimized for integration with each photodiode, achieving a resolution of 0.002 nA with a linear range from 30 pA to 3800 nA.
Performance testing was conducted using culture media samples with varying pH values (7.7, 7.3, 6.6, 6.2, 5.4, and 4.4) that were inserted into the microfluidic chambers of an organ-on-a-chip device. The results showed distinct transmittance variations based on the pH and wavelength. In the 500–560 nm range, the slope magnitudes increased for both acidic and basic media, with a notable transition between a pH of 6.6 and 6.2. In the 560–600 nm range, the slopes decreased with a decreasing pH.
In conclusion, this study presents a novel optical microsystem that is capable of real-time pH detection in culture media, leveraging CMOS photodiodes and IF converters for high sensitivity and resolution. Tested across pH values from 7.7 to 4.4, the system effectively distinguishes pH levels using transmittance slopes at specific wavelengths, particularly 500 nm, 560 nm, and 600 nm. Its compact design and precise spectrophotometric analysis make it suitable for integration into microfluidic substrates of organ-on-a-chip platforms, enabling highly sensitive, real-time pH monitoring of culture media, which is critical for maintaining optimal cell culture conditions and advancing tissue engineering applications. In this context, the implemented CMOS-based optical sensor represents a clear upgrade from all the existing systems. It demonstrates excellent integration between photodiodes and the readout electronics, ensuring efficient and seamless operation. Furthermore, its compactness, scalability, and ability to be integrated directly into microfluidic platforms make it a superior choice for real-time pH monitoring in systems like organ-on-a-chip devices. The CMOS photodiode-based sensor balances high resolution, robustness, a low cost, and ease of manufacturing. Moreover, the CMOS-based pH optical sensors demonstrated potential for diverse applications, including medical practices, such as continuous monitoring of blood pH and gas levels [36,37]; industrial processes, where they enable precise monitoring and control [37]; and environmental monitoring, such as measuring the pH of rainwater [38].

Supplementary Materials

The following supporting information can be downloaded at https://www.mdpi.com/article/10.3390/photonics11121130/s1: Figure S1: (a) Transmittance of the culture medium at different pH (8.1, 7.6, 7.2, 6.6, 6.2, 5.4) at the wavelengths under study (500, 523, 560 and 600 nm). (b) Slopes of the lines shown in (a), between wavelengths 500–523 nm, 523–560 nm and 560–600 nm. For each measurement n = 3; Table S1: Standard deviation of the transmittance values obtained at 500, 560 and 600 nm using the commercial setup.; Table S2: Standard deviation of the slopes using the commercial setup; Table S3: Standard deviation of the transmittance values obtained at 500, 560 and 600 nm using the proposed miniaturized system; Table S4: Standard deviation of the slopes using the proposed miniaturized system.

Author Contributions

Conceptualization, A.A.S., G.M.F., S.O.C. and G.M.; methodology, A.A.S., G.M.F., P.J.S., S.O.C. and G.M.; validation and analysis, A.A.S., G.M.F., S.O.C. and G.M.; investigation, A.A.S. and G.M.F. resources, S.O.C. and G.M.; writing—original draft preparation, A.A.S., G.M.F. and P.J.S.; writing—review and editing, P.C.S., S.O.C. and G.M.; supervision, P.C.S., S.O.C. and G.M.; project administration, G.M.; funding acquisition, G.M. All authors have read and agreed to the published version of the manuscript.

Funding

This work was supported by the project PTDC/EEI-EEE/2846/2021 (https://doi.org/10.54499/PTDC/EEI-EEE/2846/2021), and partially by 2022.02165.PTDC (https://doi.org/10.54499/2022.02165.PTDC) and 2022.06207.PTDC (https://doi.org/10.54499/2022.06207.PTDC), through national funds (OE), within the scope of the Scientific Research and Technological Development Projects (IC&DT) program in all scientific domains (PTDC), through the Foundation for Science and Technology, I.P. (FCT, I.P). The authors also acknowledge the partial financial support from the R&D Unit Project Scope UIDB/04436/2020 and UIDP/04436/2020. Gabriel M. Ferreira thanks FCT for his Ph.D. grant with reference 2022.10519. BD. Susana Catarino and Paulo Sousa thank FCT for their contractual funding provided through 2020.00215.CEECIND (https://doi.org/10.54499/2020.00215.CEECIND/CP1600/CT0009) and 2021.01086.CEECIND (https://doi.org/10.54499/2021.01086.CEECIND/CP1664/CT0008), respectively.

Institutional Review Board Statement

Not applicable.

Informed Consent Statement

Not applicable.

Data Availability Statement

All data are available upon request to the corresponding author.

Conflicts of Interest

The authors declare no conflicts of interest. The funders had no role in the design of the study; in the collection, analyses, or interpretation of data; in the writing of the manuscript; or in the decision to publish the results.

References

  1. Danku, A.E.; Dulf, E.H.; Braicu, C.; Jurj, A.; Berindan-Neagoe, I. Organ-On-A-Chip: A Survey of Technical Results and Problems. Front. Bioeng. Biotechnol. 2022, 10, 840674. [Google Scholar] [CrossRef] [PubMed]
  2. Feitor, J.F.; Brazaca, L.C.; Lima, A.M.; Ferreira, V.G.; Kassab, G.; Bagnato, V.S.; Carrilho, E.; Cardoso, D.R. Organ-on-a-Chip for Drug Screening: A Bright Future for Sustainability? A Critical Review. ACS Biomater. Sci. Eng. 2023, 9, 2220–2234. [Google Scholar] [CrossRef] [PubMed]
  3. Sun, W.; Chen, Y.-Q.; Luo, G.-A.; Zhang, M.; Zhang, H.-Y.; Wang, Y.-R.; Hu, P. Organs-on-chips and Its Applications. Chin. J. Anal. Chem. 2016, 44, 533–541. [Google Scholar] [CrossRef]
  4. Clarke, G.A.; Hartse, B.X.; Niaraki Asli, A.E.; Taghavimehr, M.; Hashemi, N.; Abbasi Shirsavar, M.; Montazami, R.; Alimoradi, N.; Nasirian, V.; Ouedraogo, L.J.; et al. Advancement of Sensor Integrated Organ-on-Chip Devices. Sensors 2021, 21, 1367. [Google Scholar] [CrossRef] [PubMed]
  5. Wu, M.-H.; Lin, J.-L.; Wang, J.; Cui, Z.; Cui, Z. Development of high throughput optical sensor array for on-line pH monitoring in micro-scale cell culture environment. Biomed. Microdevices 2009, 11, 265–273. [Google Scholar] [CrossRef]
  6. Magnusson, E.B.; Halldorsson, S.; Fleming, R.M.T.; Leosson, K. Real-time optical pH measurement in a standard microfluidic cell culture system. Biomed. Opt. Express 2013, 4, 1749. [Google Scholar] [CrossRef]
  7. Freshney, R.I. Culture of Animal Cells; Wiley: Hoboken, NJ, USA, 2010. [Google Scholar]
  8. Gonçalves, I.M.; Carvalho, V.; Rodrigues, R.O.; Pinho, D.; Teixeira, S.F.C.F.; Moita, A.; Hori, T.; Kaji, H.; Lima, R.; Minas, G. Organ-on-a-Chip Platforms for Drug Screening and Delivery in Tumor Cells: A Systematic Review. Cancers 2022, 14, 935. [Google Scholar] [CrossRef]
  9. Tawade, P.; Mastrangeli, M. Integrated Electrochemical and Optical Biosensing in Organs-on-Chip. ChemBioChem 2024, 25, e202300560. [Google Scholar] [CrossRef]
  10. Kilic, T.; Navaee, F.; Stradolini, F.; Renaud, P.; Carrara, S. Organs-on-chip monitoring: Sensors and other strategies. Microphysiol. Syst. 2018, 1, 1–32. [Google Scholar] [CrossRef]
  11. Chen, H.; Luo, Z.; Lin, X.; Zhu, Y.; Zhao, Y. Sensors-integrated organ-on-a-chip for biomedical applications. Nano Res. 2023, 16, 10072–10099. [Google Scholar] [CrossRef]
  12. Pinto, V.C.; Araújo, C.F.; Sousa, P.J.; Gonçalves, L.M.; Minas, G. A low-cost lab-on-a-chip device for marine pH quantification by colorimetry. Sens. Actuators B Chem. 2019, 290, 285–292. [Google Scholar] [CrossRef]
  13. Saetchnikov, A.V.; Tcherniavskaia, E.A.; Saetchnikov, V.A.; Ostendorf, A. Two-photon polymerization of optical microresonators for precise pH sensing. arXiv 2024, arXiv:2403.15117. [Google Scholar] [CrossRef]
  14. Duan, M.; Zhong, X.; Zhao, X.; El-Agnaf, O.M.; Lee, Y.-K.; Bermak, A. An Optical and Temperature Assisted CMOS ISFET Sensor Array for Robust E. coli Detection. IEEE Trans. Biomed. Circuits Syst. 2021, 15, 497–508. [Google Scholar] [CrossRef] [PubMed]
  15. Zhang, Y.S.; Aleman, J.; Shin, S.R.; Kilic, T.; Kim, D.; Shaegh, S.A.M.; Massa, S.; Riahi, R.; Chae, S.; Hu, N.; et al. Multisensor-integrated organs-on-chips platform for automated and continual in situ monitoring of organoid behaviors. Proc. Natl. Acad. Sci. USA 2017, 114, E2293–E2302. [Google Scholar] [CrossRef]
  16. Lee, S.; Ibey, B.L.; Coté, G.L.; Pishko, M.V. Measurement of pH and dissolved oxygen within cell culture media using a hydrogel microarray sensor. Sens. Actuators B Chem. 2008, 128, 388–398. [Google Scholar] [CrossRef]
  17. Yang, W.; Li, T.; Liao, S.; Zhou, J.; Huang, L. Organ-on-a-chip platforms integrated with biosensors for precise monitoring of the cells and cellular microenvironment. TrAC Trends Anal. Chem. 2024, 172, 117569. [Google Scholar] [CrossRef]
  18. Ferreira, G.M.; Silva, V.; Minas, G.; Catarino, S.O. Simulation Study of Vertical p–n Junction Photodiodes’ Optical Performance According to CMOS Technology. Appl. Sci. 2022, 12, 2580. [Google Scholar] [CrossRef]
  19. Chandrasekharan, H.K.; Wlodarczyk, K.L.; MacPherson, W.N.; Maroto-Valer, M.M. In-situ multicore fibre-based pH mapping through obstacles in integrated microfluidic devices. arXiv 2023, arXiv:2308.02967. [Google Scholar] [CrossRef]
  20. Cao, M.; Mahto, S.K.; Yadid-Pecht, O. Real-Time Optical pH Sensor With CMOS Contact Imaging and Microfluidics. IEEE Sens. J. 2016, 16, 3611–3619. [Google Scholar] [CrossRef]
  21. Morgan, A.; Babu, D.; Reiz, B.; Whittal, R.; Suh, L.Y.K.; Siraki, A.G. Caution for the routine use of phenol red—It is more than just a pH indicator. Chem. Biol. Interact. 2019, 310, 108739. [Google Scholar] [CrossRef]
  22. Raffay, R.; Husin, N.; Omar, A.F. Spectrophotometry and colorimetry profiling of pure phenol red and cell culture medium on pH variation. Color. Technol. 2022, 138, 640–659. [Google Scholar] [CrossRef]
  23. Sharma, K.; Fizet, K.J.; Montgomery, K.R.; Smeltzer, N.A.; Sikorski, M.H.; Brown, K.G.; Beyke, B.J.; Burkhart, R.C.; Lynn, A.N.; Grandinetti, G. A simple colorimetric experiment using mammalian cell culture to study metabolism. Biochem. Mol. Biol. Educ. 2021, 49, 271–277. [Google Scholar] [CrossRef] [PubMed]
  24. Gounella, R.; Ferreira, G.M.; Amorim, M.L.M.; Soares, J.N.; Carmo, J.P. A Review of Optical Sensors in CMOS. Electronics 2024, 13, 691. [Google Scholar] [CrossRef]
  25. Koklu, G.; Etienne-Cummings, R.; Leblebici, Y.; De Micheli, G.; Carrara, S. Characterization of standard CMOS compatible photodiodes and pixels for Lab-on-Chip devices. In Proceedings of the 2013 IEEE International Symposium on Circuits and Systems (ISCAS), Beijing, China, 19–23 May 2013; pp. 1075–1078. [Google Scholar] [CrossRef]
  26. Ferreira, G.M.; Baptista, V.; Silva, V.; Veiga, M.I.; Minas, G.; Catarino, S.O. CMOS spectrophotometric microsystem for malaria detection. IEEE Trans. Biomed. Eng. 2023, 70, 2318–2328. [Google Scholar] [CrossRef] [PubMed]
  27. Correia, R.G.; Pimenta, S.; Minas, G. CMOS Integrated Photodetectors and Light-to-Frequency Converters for Spectrophotometric Measurements. IEEE Sens. J. 2017, 17, 3438–3445. [Google Scholar] [CrossRef]
  28. Jha, S.K.; Verma, P.; Taleja, M. Design of Low Power CMOS Based Schmitt Trigger in 180 nm Technology. In Proceedings of the 2019 4th International Conference on Internet of Things: Smart Innovation and Usages (IoT-SIU), Ghaziabad, India, 18–19 April 2019; pp. 1–5. [Google Scholar] [CrossRef]
  29. Schroder, D.K. Negative bias temperature instability: What do we understand? Microelectron. Reliab. 2007, 47, 841–852. [Google Scholar] [CrossRef]
  30. Alam, M.A.; Mahapatra, S. A comprehensive model of PMOS NBTI degradation. Microelectron. Reliab. 2005, 45, 71–81. [Google Scholar] [CrossRef]
  31. Baker, R.J. CMOS: Circuit Design, Layout, and Simulation, 3rd ed.; Wiley: Hoboken, NJ, USA, 2010. [Google Scholar]
  32. Bucher, M.; Lallement, C.; Enz, C.; Théodoloz, F.; Krummenacher, F. The EPFL-EKV MOSFET Model Equations for Simulation; Technical Report; Eletronics Laboratory, Swiss Federal Institute of Technology: Zurich, Switzerland, 1997. [Google Scholar]
  33. Lu, T.T.; Li, Z.; Luo, C.; Xu, J.; Kong, W.; Guo, G. Characterization and Modeling of 0.18μm Bulk CMOS Technology at Sub-Kelvin Temperature. IEEE J. Electron Devices Soc. 2020, 8, 897–904. [Google Scholar] [CrossRef]
  34. Miranda, I.; Souza, A.; Sousa, P.; Ribeiro, J.; Castanheira, E.M.S.; Lima, R.; Minas, G. Properties and Applications of PDMS for Biomedical Engineering: A Review. J. Funct. Biomater. 2021, 13, 2. [Google Scholar] [CrossRef]
  35. Costa, M.S.; Baptista, V.; Ferreira, G.M.; Lima, D.; Minas, G.; Veiga, M.I.; Catarino, S.O. Multilayer Thin-Film Optical Filters for Reflectance-Based Malaria Diagnostics. Micromachines 2021, 12, 890. [Google Scholar] [CrossRef]
  36. Badugu, R.; Kostov, Y.; Rao, G.; Tolosa, L. Development and application of an excitation ratiometric optical pH sensor for bioprocess monitoring. Biotechnol. Prog. 2008, 24, 1393–1401. [Google Scholar] [CrossRef] [PubMed]
  37. Lin, J. Recent development and applications of optical and fiber-optic pH sensors. TrAC Trends Anal. Chem. 2000, 19, 541–552. [Google Scholar] [CrossRef]
  38. Marinenko, G.; Koch, W.F. A critical review of measurement practices for the determination of pH and acidity of atmospheric precipitation. Environ. Int. 1984, 10, 315–319. [Google Scholar] [CrossRef]
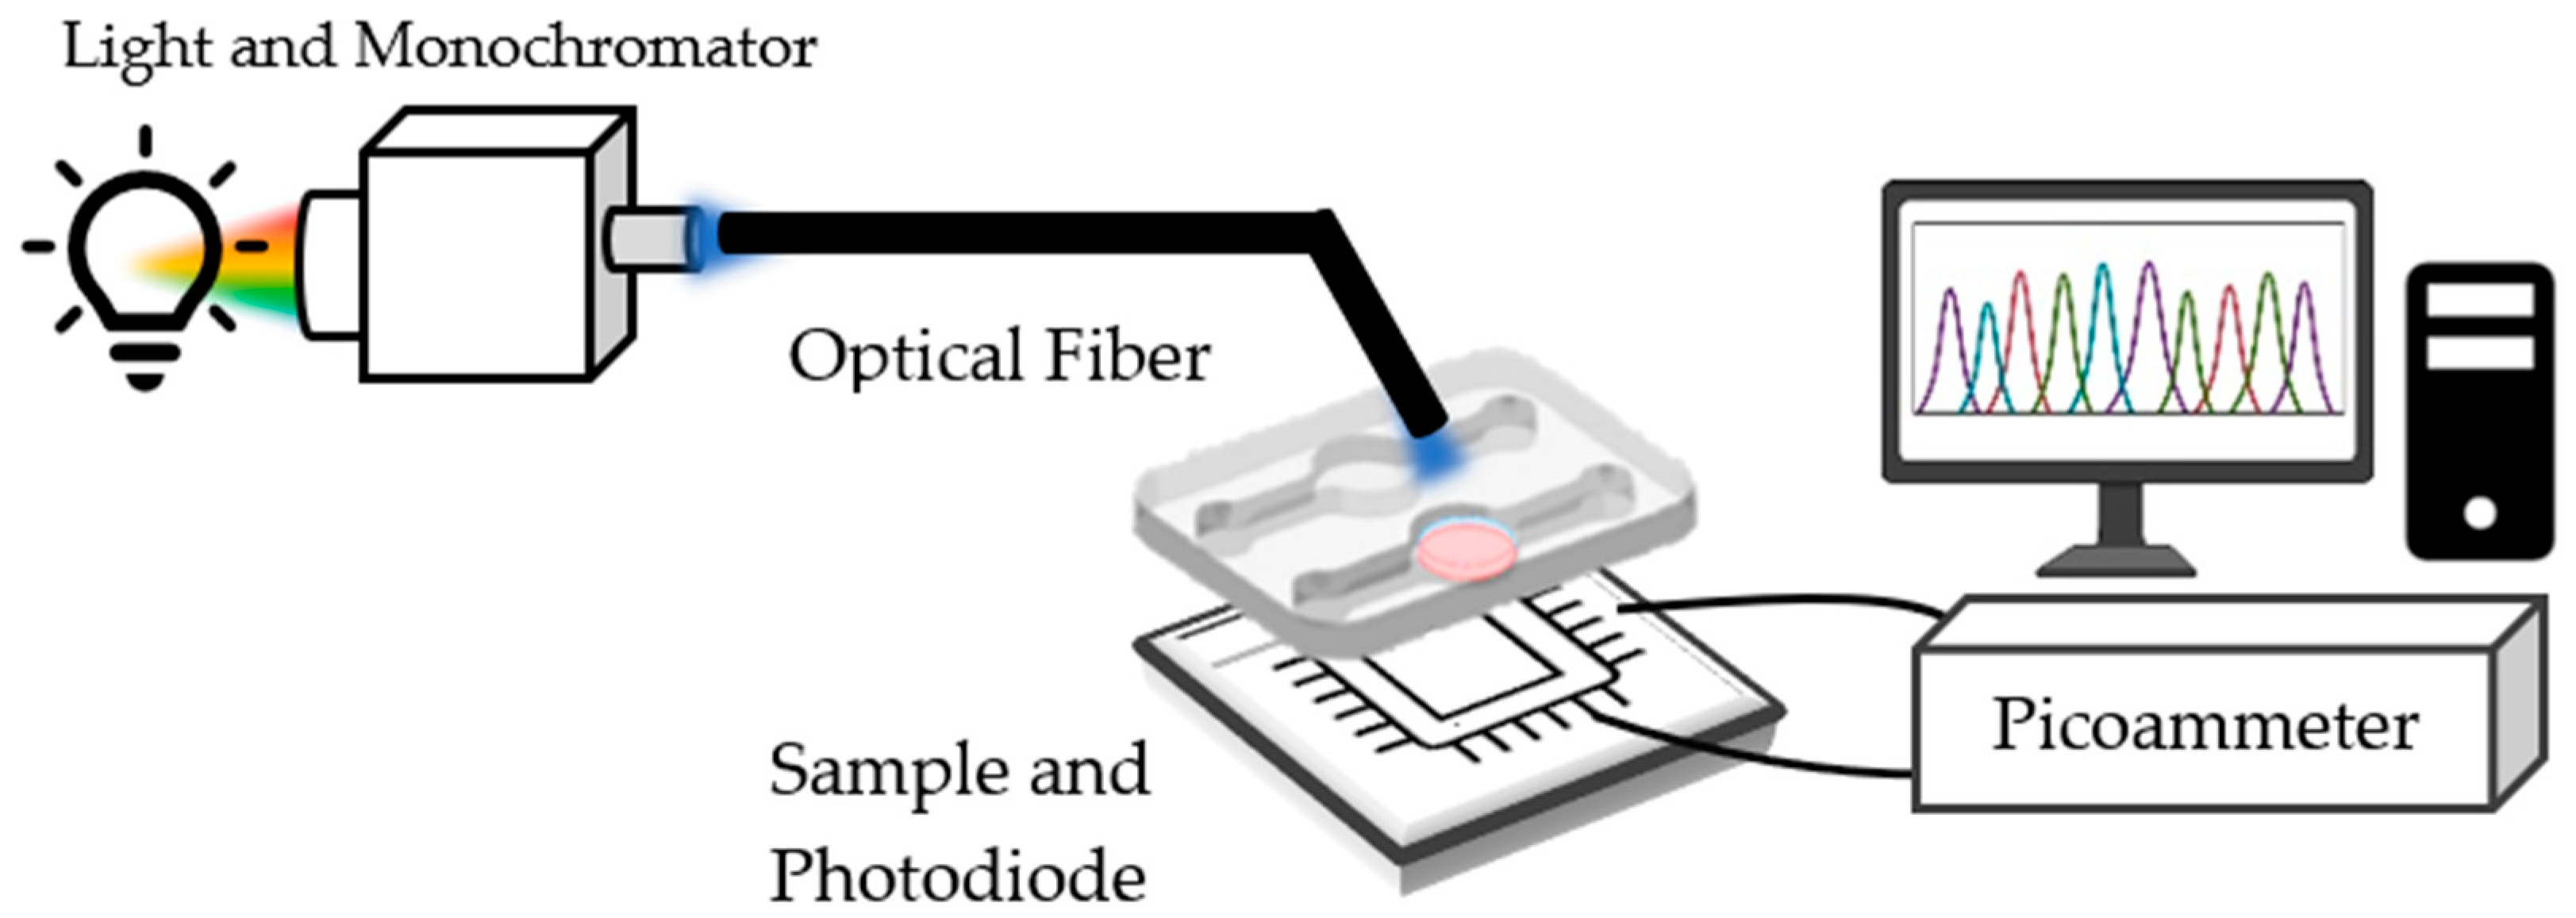
Figure 1. Schematic of the optical setup used to measure the transmittance of each sample in this analysis.
Photonics 11 01130 g001
Figure 2. (a) The current (µA) outputted by the commercial photodiode for a cuvette filled with water and with culture medium at different pH values (8.1, 7.6, 7.2, 6.6, 6.2, and 5.4). The zoomed plot represents the slopes of the same pH curves. (b) The transmittance of the culture medium at different pH values, using a water sample as a reference. For each measurement, n = 3.
Photonics 11 01130 g002
Figure 3. (a) The transmittance of the culture medium at different pH values (8.1, 7.6, 7.2, 6.6, 6.2, and 5.4) at 500 nm, 560 nm, and 600 nm. (b) The slopes of the lines shown in (a) between the wavelengths of 500–560 nm and 560–600 nm. For each measurement, n = 3.
Photonics 11 01130 g003
Figure 4. Schematic circuit of the implemented current-to-frequency converter (extracted from CADENCE Tools Virtuoso). The power supply (VDD) is 1.8 V, and the Schmitt trigger comparator (in yellow) references values are 946 mV and 637 mV.
Photonics 11 01130 g004
Figure 5. (a) Layout of the n-well/p-substrate photodiode using UMC L180 MM/RF masks, designed in Cadence Tools. (b) Optical microscope view of the fabricated n-well/p-substrate photodiode. (c) Layout of the IF converter using UMC L180 MM/RF masks, designed in Cadence Tools. The inside of the green rectangle is represented by the St.
Photonics 11 01130 g005
Figure 6. CAD drawing of the PDMS microchannels with a height of 3 mm, a well of 8 mm in diameter, and a channel of 2 mm in width, all above a 76 × 52 mm2 glass slide.
Photonics 11 01130 g006
Figure 7. Setup for the transmittance measurements. On the bottom right side, there is a photo of the PDMS microchannels that were fabricated as described in Section 2.5.
Photonics 11 01130 g007
Figure 8. (a) Simulation characteristics of the frequency vs. current for the IF converter. (b) Zoomed-in view, from 30 pA up to 3800 nA.
Photonics 11 01130 g008
Figure 9. (a) Simulated Vcap, “Trigger Discharge”, and “Output” signals in CADENCE Tools Virtuoso with an input current of 2 nA; (b) zoomed-in view of the waveforms showing the discharging of the capacitor (M2) over time.
Photonics 11 01130 g009aPhotonics 11 01130 g009b
Figure 10. Responsivity and quantum efficiency of the n-well/p-substrate photodiode fabricated using UMC L180 MM/RF technology.
Photonics 11 01130 g010
Figure 11. Transmittance of the culture medium at different pH levels (7.7, 7.3, 6.6, 6.2, 5.4, 4.4): (a) between 500 and 700 nm and (b) at the wavelengths under study (500, 560, and 600 nm). (c) Slopes of the lines shown in (b) between wavelengths of 500–560 nm and 560–600 nm. For each measurement, n = 3.
Photonics 11 01130 g011
Disclaimer/Publisher’s Note: The statements, opinions and data contained in all publications are solely those of the individual author(s) and contributor(s) and not of MDPI and/or the editor(s). MDPI and/or the editor(s) disclaim responsibility for any injury to people or property resulting from any ideas, methods, instructions or products referred to in the content.