Article

Design of High-Q-Gradient Dielectric Nanoparticle Chain Surface Plasmonic Cavities

1
Engineering Research Center for Semiconductor Integrated Technology, Institute of Semiconductors, Chinese Academy of Sciences, Beijing 100083, China
2
Center of Materials Science and Optoelectronics Engineering, University of Chinese Academy of Sciences, Beijing 100049, China
3
School of Electronic, Electrical and Communication Engineering, University of Chinese Academy of Sciences, Beijing 100049, China
4
College of Materials Science and Opto-Electronics Technology, University of Chinese Academy of Sciences, Beijing 100049, China
5
School of Integrated Circuits, University of Chinese Academy of Sciences, Beijing 100049, China
6
Key Laboratory of Semiconductor Materials Science, Beijing Key Laboratory of Low Dimensional Semiconductor Materials and Devices, Institute of Semiconductors, Chinese Academy of Sciences, Beijing 100083, China
7
State Key Laboratory of Superlattices and Microstructures, Institute of Semiconductors, Chinese Academy of Sciences, Beijing 100083, China
8
Beijing Academy of Quantum Information Sciences, Beijing 100193, China
9
Beijing Engineering Research Center of Semiconductor Micro-Nano Integrated Technology, Beijing 100083, China
*
Authors to whom correspondence should be addressed.
Photonics 2024, 11(2), 117; https://doi.org/10.3390/photonics11020117
Submission received: 25 December 2023 / Revised: 23 January 2024 / Accepted: 25 January 2024 / Published: 27 January 2024
(This article belongs to the Section Lasers, Light Sources and Sensors)

Abstract

:
Surface plasmonic cavities consisting of dielectric nanoparticle chains directly placed on a metal substrate are designed and studied, including a periodic nanoparticle chain (PNC) cavity and several different surface plasmon trap (SPT) cavities. The SPT cavities are designed by adjusting the nanoparticle sizes and the spacing between nanoparticles. Among them, the nanoparticle sizes range from 10 nm to 140 nm, and the spacings between the nanoparticles range from 200 nm to 280 nm. Compared to the PNC cavity, the SPT cavities support a single mode operation with higher Q factors within a relatively wide bandwidth. In particular, when the particle size and the spacing between the particles of the chain are set to vary in a parabolic gradient profile, the Q factor of the SPT cavity can be improved up to 85% compared to the PNC cavity. Our designs can be applied in the development of high-Q-factor plasmonic nanolasers.

1. Introduction

Laser miniaturization is a requirement for the development of integrated optics. In conventional lasers with photonic modes, neither the mode size nor the physical size can be smaller than half the wavelength, hindering the process of miniaturization and integration. Surface plasmon polaritons (SPPs) are coherent electron oscillations at the interface between metal and dielectric materials [1,2]. Lasers based on SPP modes can break the diffraction limit and shrink down to deep subwavelength scales, and they have become a major driving force in the development of nanoscale lasers. They have the advantages of good localization, a fast response time, a small mode volume, a high Purcell factor, etc. [1,3]. Over the past two decades, SPP lasers with different microcavity structures have emerged, such as nanoparticle SPP lasers [4,5], nanoparticle array SPP lasers [6,7,8,9], nanowire SPP lasers [10,11,12,13,14,15], nanosquare SPP lasers [16], and nanodisk SPP lasers [17]. One of the typical SPP lasers operates by optical pumping to generate excitons in the gain medium, which transfer energy to surface plasmons that then oscillate and are amplified in the nanocavity [18].
Among them, nanoparticle array SPP lasers have attracted more attention because of their simple structures. A nanoparticle array SPP laser with high-density states and low optical loss can effectively couple and resonate with the income wave, significantly reducing the linewidth of the output signal. Therefore, it is a useful method to achieve high-performance lasers [9]. Currently, the majority of nanoparticle array SPP laser cavities are constructed using metallic nanoparticles and various dielectric gain materials [6,7,8,9]. Meanwhile, dielectric nanoparticle structures have been applied in some optical devices, such as sensors [19], photonic crystals [20], waveguides [21], and antennas [22]. However, there have been few reports on the cavity structures of SPP lasers in which dielectric nanoparticles are directly placed onto metal substrates [23]. Dielectric nanoparticles on a metal substrate can turn the electric dipole resonance into a magnetic mode and strongly enhance the optical response. Therefore, it is necessary and meaningful to study this type of structure. In this paper, one-dimensional (1D) dielectric nanoparticle chains directly placed on a metal substrate are analyzed as surface plasmonic cavities.
In the following, the band structure (including the band gap and band edge position) of 1D periodic nanoparticle chain (PNC) structures are studied in Section 2. The band edge mode of the 1D PNC structure is investigated, which shows a weak mode confinement capability [24,25]. In Section 3, three different surface plasmon trap (SPT) cavity structures are designed by altering the nanoparticle sizes. The concept of a surface plasmon trap here is similar to that of a photon trap [26,27,28,29,30,31]. The effects of the depth of SPT on the Q factors of the cavities are studied. These SPT cavity structures have relatively high Q factors and can be operated in a single mode within a relatively wide bandwidth. In Section 4, more complex SPT cavity structures are studied by changing both the nanoparticle sizes and the spacing between nanoparticles. Finally, in the conclusion, we summarize the research results of the paper.

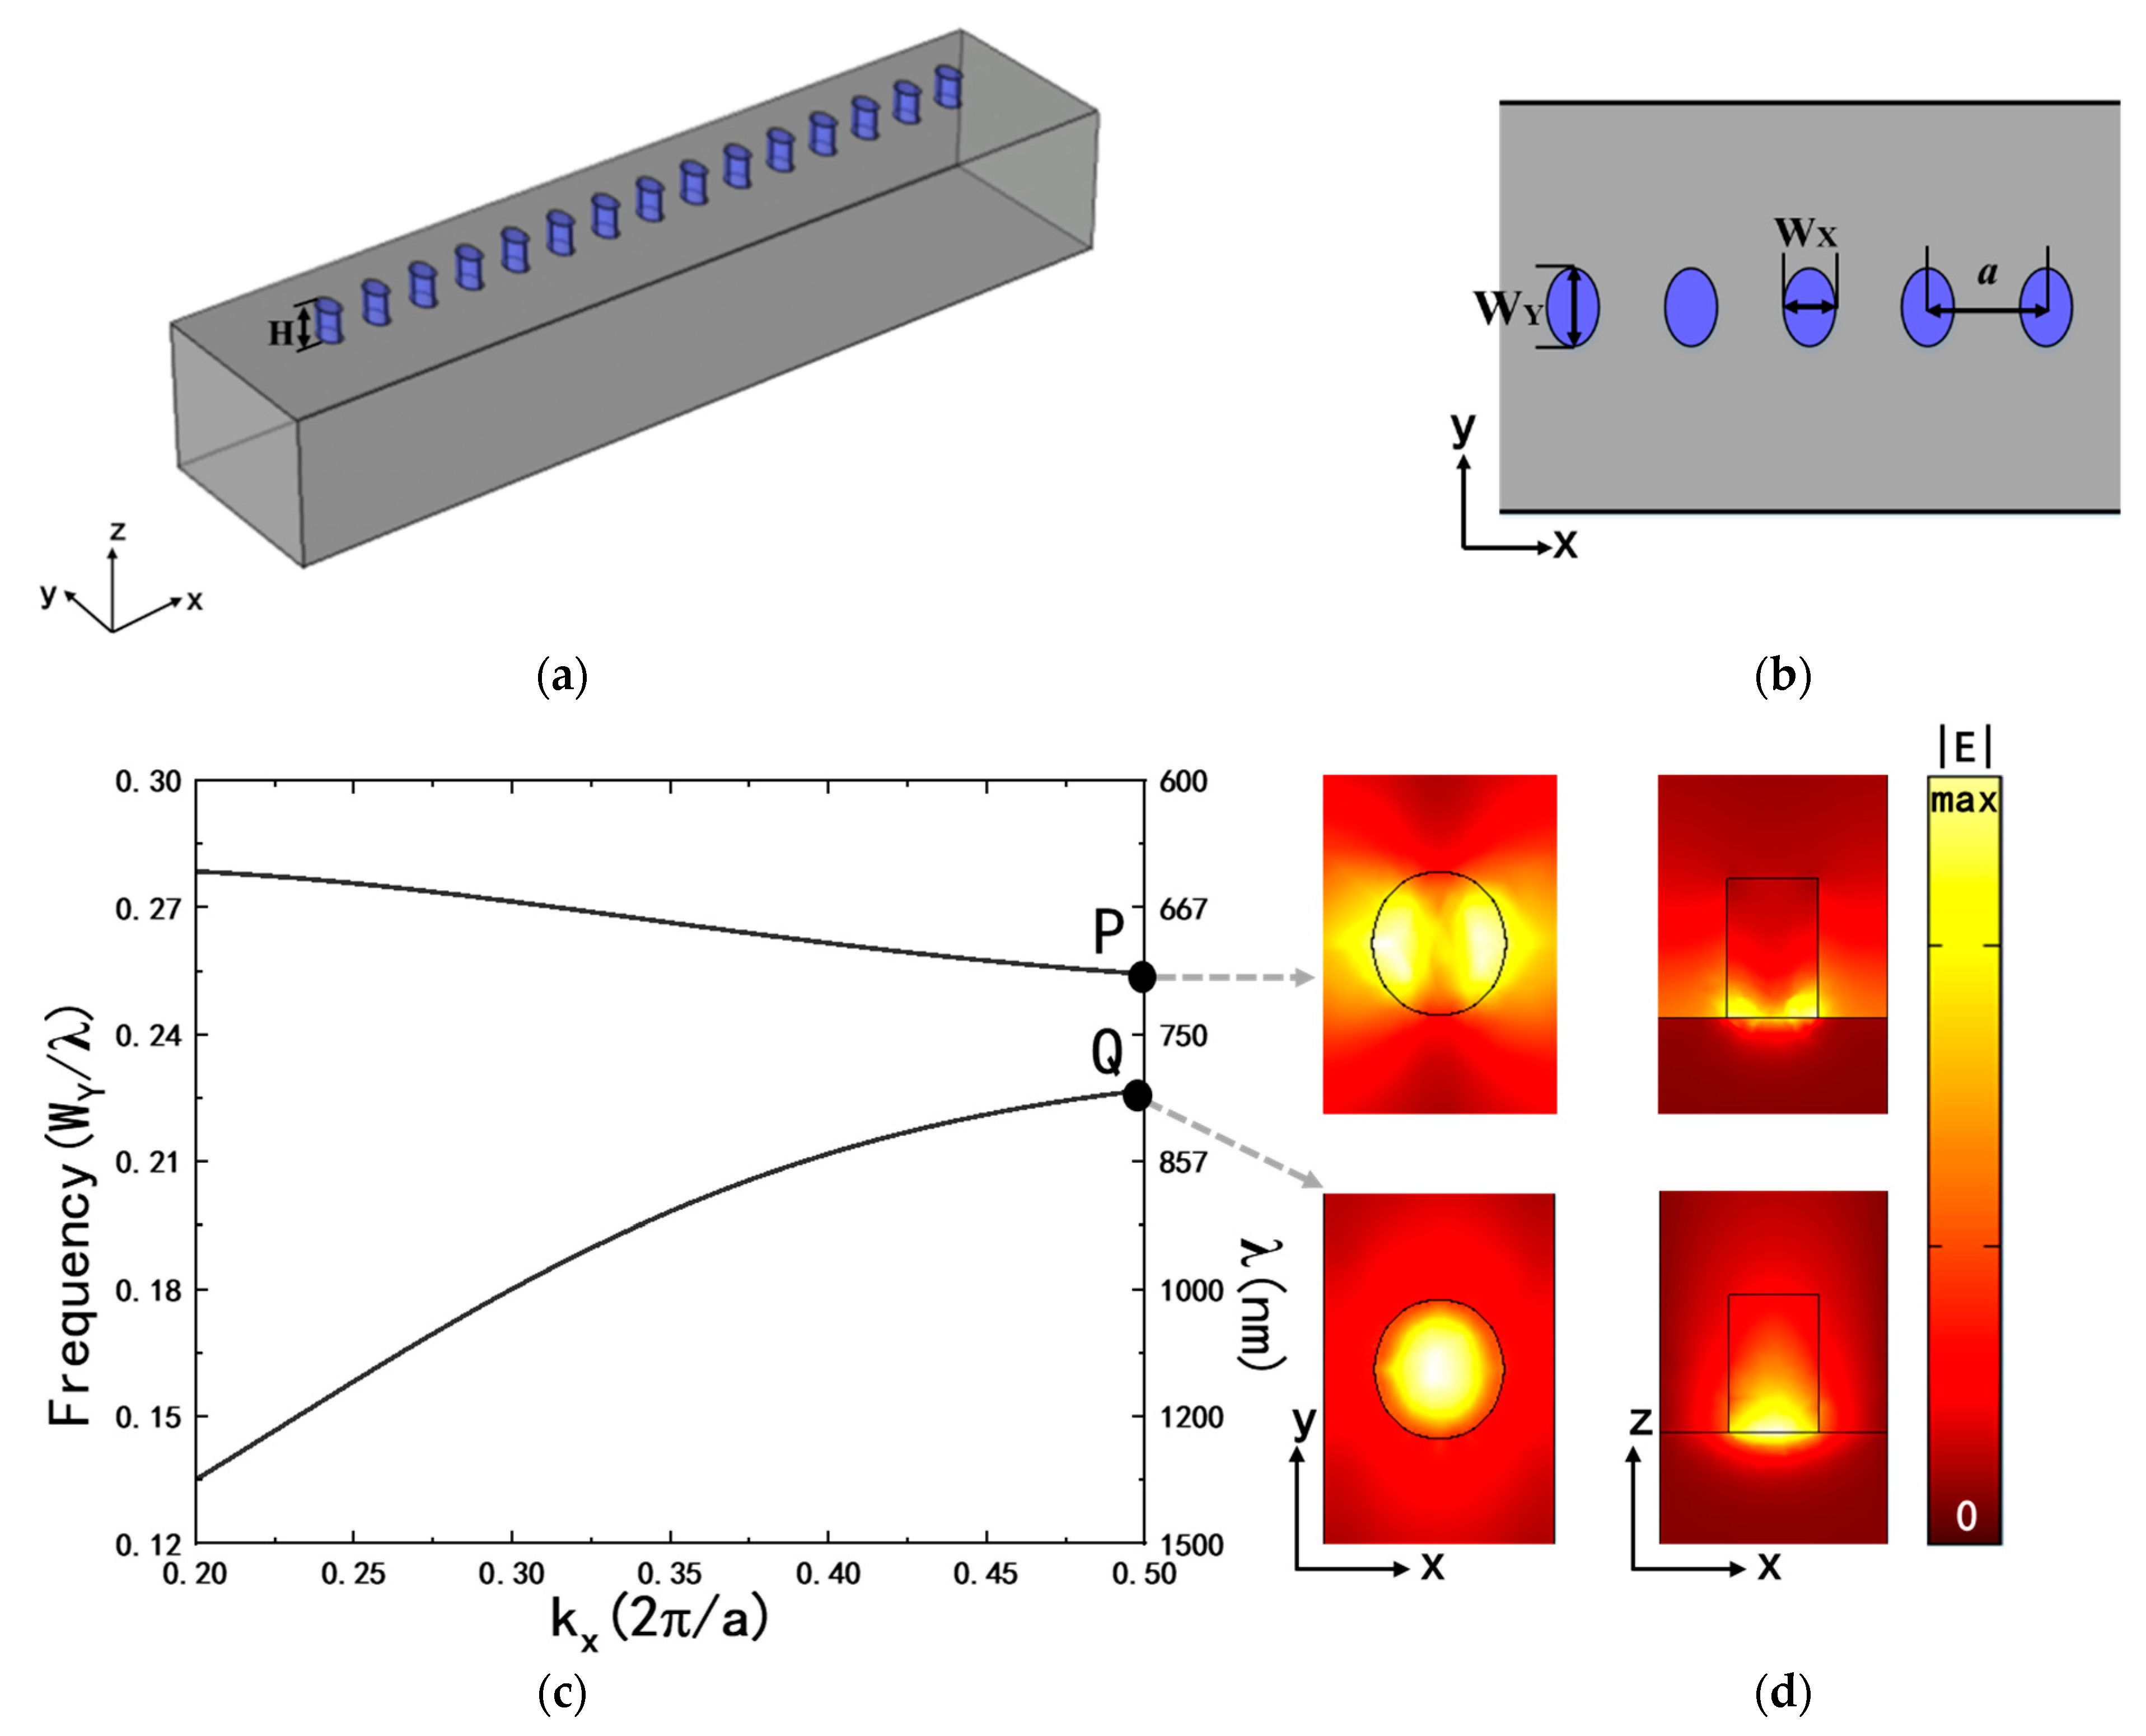
2. Band Edge Mode of Periodic Nanoparticle Chain Structure

The PNC structure is illustrated in Figure 1a. The nanoparticles are dielectric elliptical cylinders with the same size and are placed directly onto the metal substrate. An elliptical cylindrical structure with its major axis along the transverse direction is selected due to its large bandgap and high reflectivity which limit the optical mode [32,33]. The PNC structure and the SPT structures in the following sections are studied by the finite element method (FEM) using COMSOL Multiphysics 5.6 software. Perfectly matching layers (PMLs) are applied to absorb electromagnetic fields and eliminate boundary scattering. In the calculation of the band structures in Section 2, the periodic boundary conditions are employed for the boundaries perpendicular to the x-axis direction. In the calculation of the energy spectra in Section 3 and Section 4, a circular magnetic current is placed around the central dielectric nanoparticle of the microcavity to generate the resonance mode in which the electric field is concentrated in the region of the dielectric nanoparticles. A tetrahedron mesh is used. The minimum mesh size is 5 nm.
The metal substrate is set as silver for its low absorption loss. The relative permittivity is fitted using the Drude–Lorentz dispersion model, referring to the experimental results within the wavelength range of 600–800 nm [34]. The fitting parameters include the background dielectric constant ε = 3.75, the plasma frequency ωp = 1.325 × 10¹⁶ rad/s, and the collision frequency γ = 1.384 × 10¹⁴ rad/s. The material of the dielectric nanoparticles is selected as a typical lead halide perovskite (CH3NH3PbI3, MAPbI3), which has broad application prospects as a direct bandgap material with a high optical gain [35]. This perovskite material has a gain spectrum from approximately 720 to 790 nm [36]. In our simulations, the real part of the dielectric refractive index is set as n = 2.566 and the imaginary part is set as k = −0.015, representing the gain effect [37,38]. The entire structure is placed in the air. The height, major axis, and minor axis of the elliptical cylinder nanoparticle are H = 150 nm, WY = 180 nm, and WX = 140 nm, respectively. The periodic constant is a = 280 nm as shown in Figure 1a,b.
The dispersion relation of the PNC structure is analyzed and plotted in Figure 1c. In the figure, kx is normalized to the periodic constant a in the horizontal axis. The frequency is normalized to the unit of WY, where λ is the wavelength of the optical wave, and the major axis WY = 180 nm remains unchanged throughout this paper. Meanwhile, the periodic constant a is a changeable parameter for the optimization of the following content. According to Figure 1c, it can be found that there is a band gap between the two bands in the wavelength range of 708 nm to 796 nm. The two band edges are located at kx = 0.5(2π/a), which are denoted by points P and Q, respectively. At the two points, the electromagnetic (EM) waves have a group velocity of Vg = dω/dk = 0, which can be applied to band edge mode lasers [39]. The points P and Q are the band edges of the upper and lower bands, respectively, whose electric field diagrams are shown in unit cells, as shown in Figure 1d. It can be seen that both modes are SPP modes, with the electric field confined at the interface between the dielectric particles (or air) and the metal substrate. Among them, the EM field at the lower band edge Q is mainly located in the nanoparticles, while the EM field at the upper band edge P has a node at the center of the nanoparticle and more energy distributes in the air region. Usually, the band edge mode corresponding to P is suitable to be used in sensors [40]. On the other hand, the band edge mode corresponding to Q is suitable in applications as lasers because the field is concentrated in the dielectric gain medium region. Moreover, the wavelength of the band edge mode of Q should be adjusted to be within the gain bandwidth of the gain medium.
The band edge frequency and the position of the band gap can be tuned by changing the structural parameters of the PNC. In the following, when the major axis WY and the height H remain unchanged, the minor axis WX of the elliptical cylinders and the periodic constant a of the chain are adjusted to optimize the band structure. Figure 2a shows the dispersion relation curves for different WX values ranging from 80 to 140 nm when a is kept constant at 280 nm. It can be seen that the band edge frequency gradually decreases with the increase in WX, as shown in Figure 2b. Figure 2c demonstrates the dispersion relation curves for different a values ranging from 220 to 280 nm when WX is kept constant at 140 nm. Similarly, it can be found that the band edge frequency decreases as a becomes larger, as shown in Figure 2d.
A segment of the PNC structure can act as a microcavity supporting the band edge mode. Figure 3a shows the energy spectrum of a PNC cavity consisting of 15 nanoparticles, with a = 280 nm, WX = 140 nm, WY = 180 nm, and H = 150 nm, respectively. There are two resonant peaks located at 802 nm and 815 nm, respectively. The peak at 802 nm corresponds to the band edge mode, which is very close to the band edge point of Q (796 nm) in Figure 1c. The electric field modulus (|E|) of the band edge mode of the chain cavity is shown in the top panel of Figure 3b. The electric field modulus (|E|) of the mode at 815 nm is shown in the bottom panel of Figure 3b. These two modes are close to each other and might be detrimental to the realization of a laser capable of single-mode operation. Based on the above analysis, some geometric parameters (including WX and a) will be optimized to improve the characteristics of the nanoparticle chain cavities in the following sections.

3. Three Surface Plasmon Trap Cavities Made by Engineering Particle Sizes

Based on the results of Section 2, we designed three different SPT structures by engineering the particle sizes while keeping the periodic constant a = 280 nm unchanged, as shown schematically in Figure 4. Typically, an SPT structure consists of three segments: the two end segments are PNC structures and the middle segment is the trap region. The PNC segments act as reflectors for the cavity and the wavelength of the cavity mode should lie in their band gap. The PNC segments in the three structures are identically composed of four nanoparticles. Their differences lie in the trap segments of the three SPT structures. Figure 4a shows the square trap which is made of seven identical nanoparticles, and their particle size is smaller than that of the PNC segments. According to Figure 2a, this trap segment can support a mode with a wavelength shorter than the band edge of the PNC segments. Figure 4b shows the triangle trap which is made of seven nanoparticles whose parameter WX varies linearly [41]. Figure 4c shows the parabolic trap which is made of seven nanoparticles whose parameter WX varies parabolically [42]. The sizes of the nanoparticles in the two traps of Figure 4b,c are all smaller than that of the PNC segments, and therefore these two traps can also support modes with a wavelength shorter than the band edge of the PNC segments. In the above three SPT structures, the parameters of WY = 180 nm, H = 150 nm, and a = 280 nm are kept constant. The position of the nanoparticle in the chain is denoted by the letter i. The position number of the middle particle is set to i = 0. WX(i) denotes the parameter WX of the i-th particle counted from the middle one. The detailed parameters of the minor axis WX of the three SPT structures are summarized in the following equations.
For the square trap structure:
W X ( i ) = W X ( 0 ) , W X ( 4 ) , | i | [ 0 , 3 ] | i | [ 4 , 7 ]
For the triangle trap structure:
W X ( i ) = W X ( 0 ) + i ( W X ( 4 ) W X ( 0 ) ) 4 , W X ( 4 ) , | i | [ 0 , 3 ] | i | [ 4 , 7 ]
For the parabolic trap structure:
W X ( i ) = W X ( 0 ) + i 2 ( W X ( 4 ) W X ( 0 ) ) 16 , W X ( 4 ) , | i | [ 0 , 3 ] | i | [ 4 , 7 ]
Here, WX(4) = 140 nm, and the band structure of the PNC segments is the same as that of Figure 1c. WX(0) is set to 100 nm, and Figure 5a shows the WX profiles of three different SPT structures. Figure 5b shows the energy spectra of the three SPT structures. Comparing to the result of Figure 3a for the pure PNC structure, the three SPT structures support only one resonant mode in the bandwidth ranging from 740 nm to 800 nm. Figure 5c demonstrates the electric field distribution diagrams corresponding to the resonant peaks in Figure 5b for the three SPT structures.
The quality (Q) factors of the square trap, triangle trap, and parabolic trap structures are 207, 193, and 211, respectively. These Q factors are all much higher than that of the band edge mode of the PNC structure in Figure 3a (its Q factor is equal to 133 at a wavelength of 802 nm). Moreover, it can be found that within the bandwidth of 740 nm–800 nm, there is only one resonant mode for each SPT structure. Compared to the results in Figure 3b, the electric field distributions of the modes for the SPT structures shown in Figure 5c are more concentrated in the middle parts of the nanoparticle chains. However, the resonant wavelengths of the three SPT structures are different. Specifically, the resonant wavelengths of the square trap, triangle trap, and parabolic trap structures are 769 nm, 782 nm, and 776 nm, respectively. Thus, it is hard to conclude which SPT structure is better for the improvement of the cavity Q factors. This is because the PNC segment at the cavity end has a different reflection coefficient at different wavelengths. In order to further elucidate the characteristics of the three SPTs, the depths of the three different traps are scanned so that the resonant wavelength can be shifted within the band gap of the PNC segment. Modifying the depths of the traps actually changes the value of WX(0) in Equations (1)–(3). Meanwhile, the other parameters are not changed.
Figure 6a,c,e show the variations in WX(i) profiles for the square trap, triangle trap, and parabolic trap structures, respectively. Figure 6b,d,f show the Q factors and resonant wavelengths of the three SPT structures when the depths of the traps vary. The range of the resonant wavelengths of the three SPT structures is from 708 nm to 796 nm, corresponding to the band gap of the PNC segments at the end (refer to Figure 1c). For the three trap structures, the resonant wavelengths increase steadily when WX(0) increases. However, the Q factors reach the maxima when WX(0) is near the value of 100 nm. Among the three SPT structures, the parabolic trap structure possesses the highest Q factor (21) with WX(0) being 95 nm. The maximum Q factor of the triangle trap structure (193) is smaller than that of the other two structures (207 and 213). This might be due to the field distribution of its mode having a relatively high radiation loss. The resonant wavelengths corresponding to the maximum Q factors of the three structures are 771 nm, 784 nm, and 773 nm, respectively.
In order to further increase the Q factor of the SPT structure, in the next section, we will optimize the other parameter, the spacing a(i) between nanoparticles based on the parabolic trap structure with the highest Q factor. Here, the spacing a(i) in the trap varies for different i values; therefore, we no longer call it a periodic constant.

4. Size-gradient and Spacing-gradient Surface Plasmon Trap Cavity

Based on an analysis of our results in the former sections, a size-gradient and spacing-gradient surface plasmon trap structure(SS-SPT) is designed. Referring to the parabolic trap structure of Figure 4c, the SS-SPT structure is shown in Figure 7a schematically. The minor axis WX(i) varies according to Equation (3), with WX(0) = 95 nm and WX(4) = 140 nm. The spacing a(i) between nanoparticles is adjusted to parabolic trap profiles according to the following equation:
a ( i ) = a ( 0 ) + i 2 ( a ( 4 ) a ( 0 ) ) 16 , a ( 4 ) , | i | [ 0 , 3 ] | i | [ 4 , 6 ]
when i ≥ 0, a(i) marks the spacing between the i-th and (i + 1)-th nanoparticles, and the whole structure is symmetrical with respect to the central particle (with a minor axis of WX(0)). It should be noted that there are two a(0) values due to the symmetry of the whole structure. Here, a(4) = 280 nm, and other parameters (H, WY) of the SS-SPT structure are the same as the parameters of the parabolic trap structure above. Figure 7b shows the variations in the a(i) profiles when a(0) varies from 205 nm to 275 nm for the SS-SPT structure. Figure 7c shows the Q factors and resonant wavelengths of the SS-SPT structure when the depth of the trap varies.
The variation range of a(0) is from 205 to 275 nm. In this range, the resonant wavelength increases steadily when a(0) increases, and the Q factors reach the maximum (246) when a(0) is 242.5 nm, at which point the resonant wavelength is 740 nm. The highest Q factor of the SS-SPT structure is 15.5% higher than the Q factor (213) of the parabolic trap structure in Section 3, as shown in Figure 8a specifically. As a(0) lies in the range from 230 to 260 nm, the Q factor of the SS-SPT structure remains above 230.
By optimizing the parameters of the trap structure, the Q factor of the SS-SPT structure is 85% higher than the Q factor of the PNC structure cavity in Section 2. Figure 8b shows the electric field modulus (|E|) of the optimized parabolic trap structure and the SS-SPT structure. Comparing the results of Figure 8 and Figure 3, the SS-SPT structure is better in terms of both mode selection and mode confinement than the PNC structure.

5. Discussion

The synthesis of single-crystal perovskite materials applied in this article can be achieved through surface-initiated solution growth strategies [43,44]. And perovskite nanoparticles can be transferred onto a substrate to fabricate nanoparticle chain cavities. For the selection of materials, in addition to using lead halide perovskite dielectric materials and silver substrates, nanoparticle chain plasmon cavity structures are also suitable for other gain materials (such as III–V semiconductors, etc.) and different metal substrates corresponding to different wavelength bands.
Furthermore, inspired by nanoparticle chain structures, a microcavity structure consisting of a perforated perovskite nanobeam on a metal substrate can be attempted. The positions and sizes of air holes may be similar to the shapes of the elliptical cylinders studied in this article. By changing the sizes of the air holes and the spacing between adjacent air holes, the performance of the cavity can be optimized. The gain material of this type of air hole structure is more than that of the nanoparticle chain structure, and its mode will be different from that of the nanoparticle chain structure.

6. Conclusions

In this paper, surface plasmonic 1D nanoparticle chain cavities are studied. The structures consist of dielectric elliptical cylinder nanoparticles directly placed on a metal substrate. The band structure of the surface plasmonic periodic nanoparticle chain (PNC) is investigated. The band gap and the band edge position can be tuned by changing the particle size and the periodic constant (or the spacing between nanoparticles).
By changing the nanoparticle size (the minor axis of the elliptical nanoparticles), three types of surface plasmon trap (SPT) structures are designed, including the square trap structure, triangle trap structure, and parabolic trap structure. The PNC cavity has more than one mode, and there are few adjustable factors for optimization. Compared to the PNC cavity, the SPT cavities can achieve single-mode operation in a relatively wide band width. At the same time, the particle sizes can be flexibly adjusted to effectively manipulate the electric field distribution. Furthermore, the Q factors of the SPT cavities are much higher than that of the PNC cavity (133). Among the three SPT structures, the parabolic trap structure results in the highest Q factor (213). Its Q factor is 60% higher than the Q factor of the PNC structure.
Moreover, based on the optimized parabolic trap structure, a plasmon trap structure with a size gradient and spacing gradient surface (SS-SPT) is designed to further increase the Q factor. In an SS-SPT, the minor axis (WX) and spacing a are both set in parabolic profiles. Our numerical results show that the Q factor of the SS-SPT structure can be even higher than the optimized parabolic trap structure. Its Q factor (246) is 15.5% higher than that of the parabolic trap structure and 85% higher than the Q factor of the PNC structure. The SS-SPT structure can also operate in single mode with good mode confinement. The designs in this paper may contribute to research on surface plasmon cavities and SPP nanolasers in the future.

Author Contributions

Conceptualization, J.L. and Z.L.; validation, J.L. and X.P.; writing—original draft preparation, J.L. and Z.L.; writing—review and editing, X.P. and Y.K.; visualization, J.L.; supervision, Z.L.; project administration, X.M., W.Y. and Y.Z.; funding acquisition, K.L., F.Y. and Z.L. All authors have read and agreed to the published version of the manuscript.

Funding

This work was mostly supported by the National Key R&D Program of China (2018YFE0204000) and partially supported by the National Natural Science Foundation of China (Grant Nos. 61971395, 52075519).

Institutional Review Board Statement

Not applicable.

Informed Consent Statement

Not applicable.

Data Availability Statement

Data are contained within the article.

Conflicts of Interest

The authors declare no conflicts of interest.

References

  1. Bergman, D.J.; Stockman, M.I. Surface Plasmon Amplification by Stimulated Emission of Radiation: Quantum Generation of Coherent Surface Plasmons in Nanosystems. Phys. Rev. Lett. 2003, 90, 027402. [Google Scholar] [CrossRef] [PubMed]
  2. Wang, Y.; Zhao, B.; Min, C.; Zhang, Y.; Yang, J.; Guo, C.; Yuan, X. Research progress of femtosecond surface plasmon polariton. Chin. Phys. B 2020, 29, 027302. [Google Scholar] [CrossRef]
  3. Berini, P.; De Leon, I. Surface plasmon–polariton amplifiers and lasers. Nat. Photonics 2012, 6, 16–24. [Google Scholar] [CrossRef]
  4. Noginov, M.A.; Zhu, G.; Belgrave, A.M.; Bakker, R.; Shalaev, V.M.; Narimanov, E.E.; Stout, S.; Herz, E.; Suteewong, T.; Wiesner, U. Demonstration of a spaser-based nanolaser. Nature 2009, 460, 1110–1112. [Google Scholar] [CrossRef] [PubMed]
  5. Meng, X.; Kildishev, A.V.; Fujita, K.; Tanaka, K.; Shalaev, V.M. Wavelength-Tunable Spasing in the Visible. Nano Lett. 2013, 13, 4106–4112. [Google Scholar] [CrossRef]
  6. Zhou, W.; Dridi, M.; Suh, J.Y.; Kim, C.H.; Co, D.T.; Wasielewski, M.R.; Schatz, G.C.; Odom, T.W. Lasing action in strongly coupled plasmonic nanocavity arrays. Nat. Nanotechnol. 2013, 8, 506–511. [Google Scholar] [CrossRef]
  7. Wang, D.; Bourgeois, M.R.; Lee, W.-K.; Li, R.; Trivedi, D.; Knudson, M.P.; Wang, W.; Schatz, G.C.; Odom, T.W. Stretchable Nanolasing from Hybrid Quadrupole Plasmons. Nano Lett. 2018, 18, 4549–4555. [Google Scholar] [CrossRef]
  8. Yang, A.; Hoang, T.B.; Dridi, M.; Deeb, C.; Mikkelsen, M.H.; Schatz, G.C.; Odom, T.W. Real-time tunable lasing from plasmonic nanocavity arrays. Nat. Commun. 2015, 6, 6939. [Google Scholar] [CrossRef] [PubMed]
  9. Huang, Z.-T.; Yin, C.-W.; Hong, Y.-H.; Li, H.; Hong, K.-B.; Kao, T.S.; Shih, M.-H.; Lu, T.-C. Hybrid Plasmonic Surface Lattice Resonance Perovskite Lasers on Silver Nanoparticle Arrays. Adv. Opt. Mater. 2021, 9, 2100299. [Google Scholar] [CrossRef]
  10. Wang, J.; Jia, X.; Wang, Z.; Liu, W.; Zhu, X.; Huang, Z.; Yu, H.; Yang, Q.; Sun, Y.; Wang, Z.; et al. Ultrafast plasmonic lasing from a metal/semiconductor interface. Nanoscale 2020, 12, 16403–16408. [Google Scholar] [CrossRef] [PubMed]
  11. Tao, T.; Zhi, T.; Liu, B.; Dai, J.; Zhuang, Z.; Xie, Z.; Chen, P.; Ren, F.; Chen, D.; Zheng, Y.; et al. Manipulable and Hybridized, Ultralow-Threshold Lasing in a Plasmonic Laser Using Elliptical InGaN/GaN Nanorods. Adv. Funct. Mater. 2017, 27, 1703198. [Google Scholar] [CrossRef]
  12. Repp, D.; Barreda, A.; Vitale, F.; Staude, I.; Peschel, U.; Ronning, C.; Pertsch, T. Lasing modes in ZnO nanowires coupled to planar metals. Opt. Express 2023, 31, 3364. [Google Scholar] [CrossRef]
  13. Wang, J.; Jia, X.; Guan, Y.; Ren, K.; Yu, H.; Wang, Z.; Qu, S.; Yang, Q.; Lin, J.; Wang, Z.; et al. The Electron–Hole Plasma Contributes to Both Plasmonic and Photonic Lasing from CH3NH3PbBr3 Nanowires at Room Temperature. Laser Photonics Rev. 2021, 15, 2000512. [Google Scholar] [CrossRef]
  14. Chou, Y.-H.; Wu, Y.-M.; Hong, K.-B.; Chou, B.-T.; Shih, J.-H.; Chung, Y.-C.; Chen, P.-Y.; Lin, T.-R.; Lin, C.-C.; Lin, S.-D.; et al. High-Operation-Temperature Plasmonic Nanolasers on Single-Crystalline Aluminum. Nano Lett. 2016, 16, 3179–3186. [Google Scholar] [CrossRef]
  15. Wu, Z.; Chen, J.; Mi, Y.; Sui, X.; Zhang, S.; Du, W.; Wang, R.; Shi, J.; Wu, X.; Qiu, X.; et al. All-Inorganic CsPbBr 3 Nanowire Based Plasmonic Lasers. Adv. Opt. Mater. 2018, 6, 1800674. [Google Scholar] [CrossRef]
  16. Huang, C.; Sun, W.; Fan, Y.; Wang, Y.; Gao, Y.; Zhang, N.; Wang, K.; Liu, S.; Wang, S.; Xiao, S.; et al. Formation of Lead Halide Perovskite Based Plasmonic Nanolasers and Nanolaser Arrays by Tailoring the Substrate. ACS Nano 2018, 12, 3865–3874. [Google Scholar] [CrossRef] [PubMed]
  17. Kwon, S.-H.; Kang, J.-H.; Seassal, C.; Kim, S.-K.; Regreny, P.; Lee, Y.-H.; Lieber, C.M.; Park, H.-G. Subwavelength Plasmonic Lasing from a Semiconductor Nanodisk with Silver Nanopan Cavity. Nano Lett. 2010, 10, 3679–3683. [Google Scholar] [CrossRef]
  18. Stockman, M.I. The spaser as a nanoscale quantum generator and ultrafast amplifier. J. Opt. 2010, 12, 024004. [Google Scholar] [CrossRef]
  19. Zhang, L.; Ge, C.; Zhang, K.; Tian, C.; Fang, X.; Zhai, W.; Tao, L.; Li, Y.; Ran, G. Lattice plasmons in dielectric nanoparticle arrays arranged on metal film. J. Opt. 2016, 18, 125002. [Google Scholar] [CrossRef]
  20. Qi, D.; Tang, S.; Wang, L.; Dai, S.; Shen, X.; Wang, C.; Chen, S. Pulse laser-induced size-controllable and symmetrical ordering of single-crystal Si islands. Nanoscale 2018, 10, 8133–8138. [Google Scholar] [CrossRef]
  21. Shen, B.; Huang, Y.; Duan, X.; Ren, X.; Zhang, X.; Wang, Q. Subwavelength Energy Transport Along a Dielectric Nanoparticle Chain in a Metal Slot. IEEE Photonics J. 2013, 5, 4500309. [Google Scholar] [CrossRef]
  22. Krasnok, A.; Li, S.; Lepeshov, S.; Savelev, R.; Baranov, D.G.; Alu, A. All-Optical Switching and Unidirectional Plasmon Launching with Nonlinear Dielectric Nanoantennas. Phys. Rev. Appl. 2018, 9, 14015. [Google Scholar] [CrossRef]
  23. Sun, Y.; Zhao, D.; Zhang, Z.; Garg, N.; Bogdanov, B.V.; Senyushkin, P.R.; Su, M.; Zuev, D.A.; Kumar, S.; Ganguli, A.K.; et al. Green printed hybrid optical dielectric nanostructures on a mirror. Photonics Nanostruct. Fundam. Appl. 2023, 55, 101147. [Google Scholar] [CrossRef]
  24. Oudich, M.; El-Jallal, S.; Pennec, Y.; Djafari-Rouhani, B.; Gomis-Bresco, J.; Navarro-Urrios, D.; Sotomayor Torres, C.M.; Martínez, A.; Makhoute, A. Optomechanic interaction in a corrugated phoxonic nanobeam cavity. Phys. Rev. B 2014, 89, 245122. [Google Scholar] [CrossRef]
  25. Bordas, F.; Steel, M.J.; Seassal, C.; Rahmani, A. Confinement of band-edge modes in a photonic crystal slab. Opt. Express 2007, 15, 10890. [Google Scholar] [CrossRef]
  26. Goncharov, A.P.; Gorelik, V.S. Probe Raman spectroscopy in photon traps. Bull. Lebedev Phys. Inst. 2008, 35, 257–263. [Google Scholar] [CrossRef]
  27. Dong, P.; Dai, D.; Shi, Y. Low-index-mode photonic crystal nanobeam cavity for refractive index sensing at the 2 μm wavelength band. Appl. Opt. 2019, 58, 3059. [Google Scholar] [CrossRef]
  28. Alagappan, G.; Krivitsky, L.A.; Png, C.E. Purcell enhancement of light emission in nanodiamond using a trenched nanobeam cavity. J. Opt. 2020, 22, 025401. [Google Scholar] [CrossRef]
  29. Cheng, Z.; Dong, J.; Zhang, X. Ultracompact optical switch using a single semisymmetric Fano nanobeam cavity. Opt. Lett. 2020, 45, 2363. [Google Scholar] [CrossRef]
  30. He, Z.; Chen, B.; Hua, Y.; Liu, Z.; Wei, Y.; Liu, S.; Hu, A.; Shen, X.; Zhang, Y.; Gao, Y.; et al. CMOS Compatible High-Performance Nanolasing Based on Perovskite–SiN Hybrid Integration. Adv. Opt. Mater. 2020, 8, 2000453. [Google Scholar] [CrossRef]
  31. Yang, D.-Q.; Duan, B.; Liu, X.; Wang, A.-Q.; Li, X.-G.; Ji, Y.-F. Photonic Crystal Nanobeam Cavities for Nanoscale Optical Sensing: A Review. Micromachines 2020, 11, 72. [Google Scholar] [CrossRef] [PubMed]
  32. Gao, Y.-H.; Xu, X.-S. High- Q cavity based on gradated one-dimensional photonic crystal. Chin. Phys. B 2014, 23, 114205. [Google Scholar] [CrossRef]
  33. Quan, Q.; Burgess, I.B.; Tang, S.K.Y.; Floyd, D.L.; Loncar, M. High-Q, low index-contrast polymeric photonic crystal nanobeam cavities. Opt. Express 2011, 19, 22191–22197. [Google Scholar] [CrossRef] [PubMed]
  34. Palik, E.D.; Ghosh, G. (Eds.) Handbook of Optical Constants of Solids; Academic Press: San Diego, CA, USA, 1998; ISBN 978-0-12-544420-0. [Google Scholar]
  35. Yu, H.; Ren, K.; Wu, Q.; Wang, J.; Lin, J.; Wang, Z.; Xu, J.; Oulton, R.F.; Qu, S.; Jin, P. Organic-inorganic perovskite plasmonic nanowire lasers with a low threshold and a good thermal stability. Nanoscale 2016, 8, 19536–19540. [Google Scholar] [CrossRef] [PubMed]
  36. Segovia, R.; Qu, G.; Peng, M.; Sun, X.; Shi, H.; Gao, B. Evolution of Photoluminescence, Raman, and Structure of CH3NH3PbI3 Perovskite Microwires Under Humidity Exposure. Nanoscale Res. Lett. 2018, 13, 79. [Google Scholar] [CrossRef] [PubMed]
  37. Löper, P.; Stuckelberger, M.; Niesen, B.; Werner, J.; Filipič, M.; Moon, S.-J.; Yum, J.-H.; Topič, M.; De Wolf, S.; Ballif, C. Complex Refractive Index Spectra of CH3NH3PbI3 Perovskite Thin Films Determined by Spectroscopic Ellipsometry and Spectrophotometry. J. Phys. Chem. Lett. 2015, 6, 66–71. [Google Scholar] [CrossRef]
  38. Li, W.; Peng, X.; Jia, L.; Yan, W.; Yang, F.; Li, Z. Designs for improving plasmonic nanowire microcavity quality factor. In Proceedings of the 5th Optics Young Scientist Summit (OYSS 2022); Lu, C.-Y., Chen, F., Li, Z., Cai, Y., Eds.; SPIE: Fuzhou, China, 2022; p. 74. [Google Scholar]
  39. Kim, S.; Ahn, B.-H.; Kim, J.-Y.; Jeong, K.-Y.; Soo, K.; Lee, Y.-H. Nanobeam photonic bandedge lasers. Opt. Express 2011, 19, 24055–24060. [Google Scholar] [CrossRef]
  40. Yang, D.; Tian, H.; Ji, Y. High-Q and high-sensitivity width-modulated photonic crystal single nanobeam air-mode cavity for refractive index sensing. Appl. Opt. 2015, 54, 1. [Google Scholar] [CrossRef]
  41. Yu, P.; Qi, B.; Xu, C.; Hu, T.; Jiang, X.; Wang, M.; Yang, J. An improved surface-plasmonic nanobeam cavity for higher Q and smaller V. Chin. Sci. Bull. 2012, 57, 3371–3374. [Google Scholar] [CrossRef]
  42. Yao, K.; Shi, Y. High-Q width modulated photonic crystal stack mode-gap cavity and its application to refractive index sensing. Opt. Express 2012, 20, 27039. [Google Scholar] [CrossRef]
  43. Zhu, H.; Fu, Y.; Meng, F.; Wu, X.; Gong, Z.; Ding, Q.; Gustafsson, M.V.; Trinh, M.T.; Jin, S.; Zhu, X.-Y. Lead halide perovskite nanowire lasers with low lasing thresholds and high quality factors. Nat. Mater. 2015, 14, 636–642. [Google Scholar] [CrossRef] [PubMed]
  44. Li, Q.; Li, J.; Zhang, S.; Yi, C.; Xu, Z. Novel CH3NH3PbI3/polyimide composites with enhanced film-forming and electrical conductive properties. High Perform. Polym. 2018, 30, 847–855. [Google Scholar] [CrossRef]
Figure 1. (a) Schematics of the surface plasmonic PNC structure. H = 150 nm. (b) Partial top view of PNC structure. WY = 180 nm, WX = 140 nm, and a = 280 nm. (c) Dispersion relation of the PNC structure. (d) Top view and front view of electric field modules (|E|) of the modes corresponding to P and Q points in (c).
Photonics 11 00117 g001
Figure 2. (a) Dispersion relation of the PNC structure when minor axis WX changes from 80 nm to 140 nm while maintaining a = 280 nm. (b) Normalized band edge frequency versus minor axis WX obtained from (a). (c) Dispersion relation of the PNC structure when a changes from 220 nm to 280 nm while maintaining WX = 140 nm. (d) Normalized band edge frequency versus a obtained from (c).
Photonics 11 00117 g002
Figure 3. (a) Total energy spectra of PNC structure with WX = 140 nm. (b) Top view of the electric field modulus (|E|) of the band edge mode (top panel, 802 nm) near the Q point of Figure 1c and a mode (bottom panel, 815 nm) close to the band edge. The geometric parameters are a = 280 nm, WX = 140 nm, WY = 180 nm, and H = 150 nm. The red and blue colors represent the maximum and zero values of the electric field modulus, respectively. The color gradient from red to blue indicates the gradual decrease of the electric field modulus.
Photonics 11 00117 g003
Figure 4. Top view of the SPT structure cavities. The position number of the middle nanoparticle is i = 0. (a) Square trap structure; (b) Triangle trap structure; and (c) Parabolic trap structure. The detailed WX(i) parameters are set in Equations (1)–(3), respectively. Other geometrical parameters are H = 150 nm, WY = 180 nm, and a = 280 nm.
Photonics 11 00117 g004
Figure 5. (a) Minor axis WX versus position number i of the SPT structure as shown in Figure 4. Three curves correspond to square trap, triangle trap, and parabolic trap structures, respectively. (b) Energy spectra of the three SPT structures. (c) Top view of electric field modulus of the three SPT structures—top panel: square trap structure; middle panel: triangle trap structure; and bottom panel: parabolic trap structure.
Photonics 11 00117 g005aPhotonics 11 00117 g005b
Figure 6. (a) Minor axis WX(i) versus position number i of the square trap structure when WX(0) varies. (b) Q factor (red dots) and resonant wavelength (black squares) of the square trap structure versus WX(0). (c) Minor axis WX(i) versus position number i of the triangle trap structure when WX(0) varies. (d) Q factor (red dots) and resonant wavelength (black squares) of the triangle trap structure versus WX(0). (e) Minor axis WX(i) versus position number i of the parabolic trap structure when WX(0) varies. (f) Q factor (red dots) and resonant wavelength (black squares) of the parabolic trap structure versus WX(0).
Photonics 11 00117 g006
Figure 7. (a) Top view of the SS-SPT structure cavities. The position number of the middle nanoparticle is i = 0. (b) Spacing a(i) versus position number i of the SS-SPT structure when a(0) varies. (c) Q factor (red dots) and resonant wavelength (black squares) of the SS-SPT structure versus a(0).
Photonics 11 00117 g007
Figure 8. (a) Total energy spectra of the optimized parabolic trap structure and SS-SPT structure, and their corresponding Q factors (red dots with respect to the right vertical axis). (b) Top view of the electric field modulus (|E|) of the parabolic trap structure (top panel) and the SS-SPT structure (bottom panel).
Photonics 11 00117 g008
Disclaimer/Publisher’s Note: The statements, opinions and data contained in all publications are solely those of the individual author(s) and contributor(s) and not of MDPI and/or the editor(s). MDPI and/or the editor(s) disclaim responsibility for any injury to people or property resulting from any ideas, methods, instructions or products referred to in the content.

