Article

CO2 Measurement under Different Pressure and Vibration Conditions Using Tunable Diode Laser Absorption Spectroscopy

State Key Laboratory of Dynamic Measurement Technology, North University of China, Taiyuan 030051, China
*
Author to whom correspondence should be addressed.
Photonics 2024, 11(2), 146; https://doi.org/10.3390/photonics11020146
Submission received: 19 December 2023 / Revised: 17 January 2024 / Accepted: 2 February 2024 / Published: 4 February 2024
(This article belongs to the Special Issue Technologies and Applications of Spectroscopy)

Abstract

:
The greenhouse effect resulting from fuel combustion has drawn growing attention, and CO2 emissions from fossil fuel power stations are one of the main sources of greenhouse gases. It is crucial to monitor the concentration of CO2 in the flue gas ducts of these stations. However, pressure and vibration caused by the combustion of boilers make the measurement of CO2 in flue gas ducts extremely challenging. In this study, tunable diode laser absorption spectroscopy (TDLAS) combined with Wave Modulation Spectroscopy (WMS) was employed to measure the concentration of CO2 under different pressure and vibration conditions in the laboratory. The absorption line of CO2 at the wavenumber 6357.38 cm−1 was recorded under varying pressure conditions ranging from 0 to 1.4 atm, acceleration conditions ranging from 0 to 7.7 m/s2, and a combination of both. Firstly, a negative linear correlation was found between the pressure and the amplitude of the second harmonic, with a maximum relative error of 4.645% observed at a pressure of 1.4 atm. Secondly, the maximum acceleration that the system can withstand was determined to be 7.3 m/s2, as it was not possible to provide a sufficiently low fitting error at higher accelerations. For the combined effects of the pressure and vibration, a dramatic increase in the relative error of amplitude can be observed within the acceleration range of 5.0~6.0 m/s2 while under the pressure conditions of 0.6 atm, 1.0 atm, and 1.4 atm. Moreover, the maximum endurable acceleration decreases with the increase in pressure, which infers that effective measurements can be achieved when the acceleration is below 5 m/s2 within the pressure range of 0~1.4 atm. This suggests that TDLAS combined with WMS possesses a potential for online measuring of CO2 concentrations in flue gas ducts within a certain acceleration range. This work can provide some insights for stable gas detection using TDLAS under varied pressure and vibration conditions.

1. Introduction

With industrial development and progress, energy consumption has increased dramatically and received widespread attention. Unfortunately, traditional fossil fuels are still the main source of energy, causing severe environmental pollution. The massive CO2 emissions resulting from fuel combustion significantly contribute to global warming. If left unaddressed, this phenomenon will pose a threat to human development. Specifically, fossil fuel power stations and heat supply industries account for approximately 50% of the nationwide CO2 emissions, making it imperative to monitor CO2 levels in the flue gas ducts of these facilities. Unfortunately, there exist sorely variable pressures and vibrations in the gas ducts during boiler operation, affecting the sensitivity and accuracy of the general means of measurement. Accordingly, it is necessary to find a suitable method to investigate the pressure and vibration and their combined effect on the measurements of CO2 concentrations. Since contact sensors are susceptible to the degradation of sensitivity and accuracy due to the erosion of pipeline gases, non−contact optical technology is currently being utilized to achieve remote online measurements of gas concentrations. There are several methods available for gas monitoring, such as Raman spectroscopy, fluorescence spectroscopy, tunable diode laser absorption spectroscopy (TDLAS), etc. TDLAS is favored by numerous researchers for its high selectivity, sensitivity, and anti−interference. Direct Absorption Spectroscopy (DAS) and Wave Modulation Spectroscopy (WMS) can be combined with TDLAS to perform detection in different environments. The former is used to directly invert the gas concentration through the absorbance of spectral absorption and has advantages of high sensitivity and simple calculation procession, whereas the system noise will cause a great impact on the limit of detection. The latter is achieved by superimposing a high−frequency sinusoidal on the low−frequency sawtooth wave signal, which can significantly improve the system’s anti−interference and detection ability. From the above, we can see that DAS is suitable for precise measurements under stable conditions, while WMS is able to detect in noisy and complex environments. Due to the harsh environment in this work, WMS is more suitable to be employed for studying the effects of pressures and vibrations on the absorption spectra of TDLAS.
Currently, spectrometry has been extensively applied in the field of combustion and flame temperature detection [1,2,3,4,5,6]. As a key factor in practical application that cannot be ignored, the pressure has also drawn considerable attention in related research. For instance, Jingyi et al. analyzed the effect of ambient pressure on CO concentration measurements combined with WMS. They used both polynomial correction and backpropagation (BP) neural networks to calibrate CO concentrations [7]. Al−Manea et al. have combined TDLAS with the inverse Abel transform to reveal the supersonic vapor flow characteristics using the microwave structure of the ultrasonic jet and the shear layer structure. Finally, the radial distributions of pressure, temperature, and water vapor concentration were obtained [8]. Buchholz et al. investigated the absorption peak of vapor around 7299.4 cm−1 at ambient pressure from 15 to 80 kPa. They provided a detailed analysis of the factors influencing pressure broadening and the sources of error in the measurements [9]. The first approach to applying TDLAS for the precise measurement of partial pressures in a high vacuum environment was reported by E Lanzinger et al., which determined the absolute partial pressures of CO with an uncertainty of about 3% [10]. Deng et al. performed coal mine gas detection at different temperatures and pressures, and the results showed that the detection concentration decreased as the pressure increased. A correction formula is provided for this phenomenon combined with the pressure effect, and the maximum relative error in the corrected results is 2%, which greatly improves the measurement accuracy [11]. Burkle et al. studied the pressure broadening and shift of four gases, including H2O, CO2, C2H2, and CH4, and the self− and foreign−induced pressure shift coefficients were measured with relative uncertainties ranging from 0.7% to 1.5% and 0.6% to 1.6%, respectively [12]. The average error of 3.99% was obtained by Cai et al. when measuring CO2 concentration using WMS at 5 atm/500 K and 10 atm/1000 K, respectively [13,14]. The detection effect among the direct absorption for the first and second harmonics was compared by Li et al., which indicated that the second harmonic is more sensitive, more reliable, and has a higher resolution, and the pressure effect was investigated and corrected to achieve a lower detection limit of 0.29 ppm [15]. Absorption spectra of static CO2 and engine operating process bursting gas within the pressure range of 1~10 atm were experimentally analyzed by Li et al. using wave division multiplexing techniques, demonstrating that a single DFB laser is capable of measuring mixed CO2 spectra from 6330 cm−1 to 6337 cm−1 [16]. Most of the current efforts have focused on the effect of environmental pressures on TDLAS spectra, while little research has addressed the effect of vibrations. It is clear from the above that TDLAS is already well performed in terms of measuring pressures. However, the effect of pressures in the flue gas ducts with serious vibrations toward CO2 detection using TDLAS has yet to be revealed, which is also significant for the appliance of TDLAS in on−site detection. Consequently, it is essential to understand the combined effects of pressures and vibrations on the TDLAS monitoring system.
The purpose of this work is to investigate the performance of TDLAS applied to CO2 measurement combined with the WMS technique under a condition with pressures and vibrations, and the level of vibration was represented by the acceleration. The absorption spectral characteristics were investigated under the pressure conditions of 0~1.4 atm, the acceleration conditions of 0~7.7 m/s2, and the combination of both, respectively. We demonstrated the different disturbance effects of pressures and vibrations on the TDLAS spectra, followed by the comparative analysis of relative errors and signal−to−noise ratios of spectra under different conditions.

2. Theory and Method

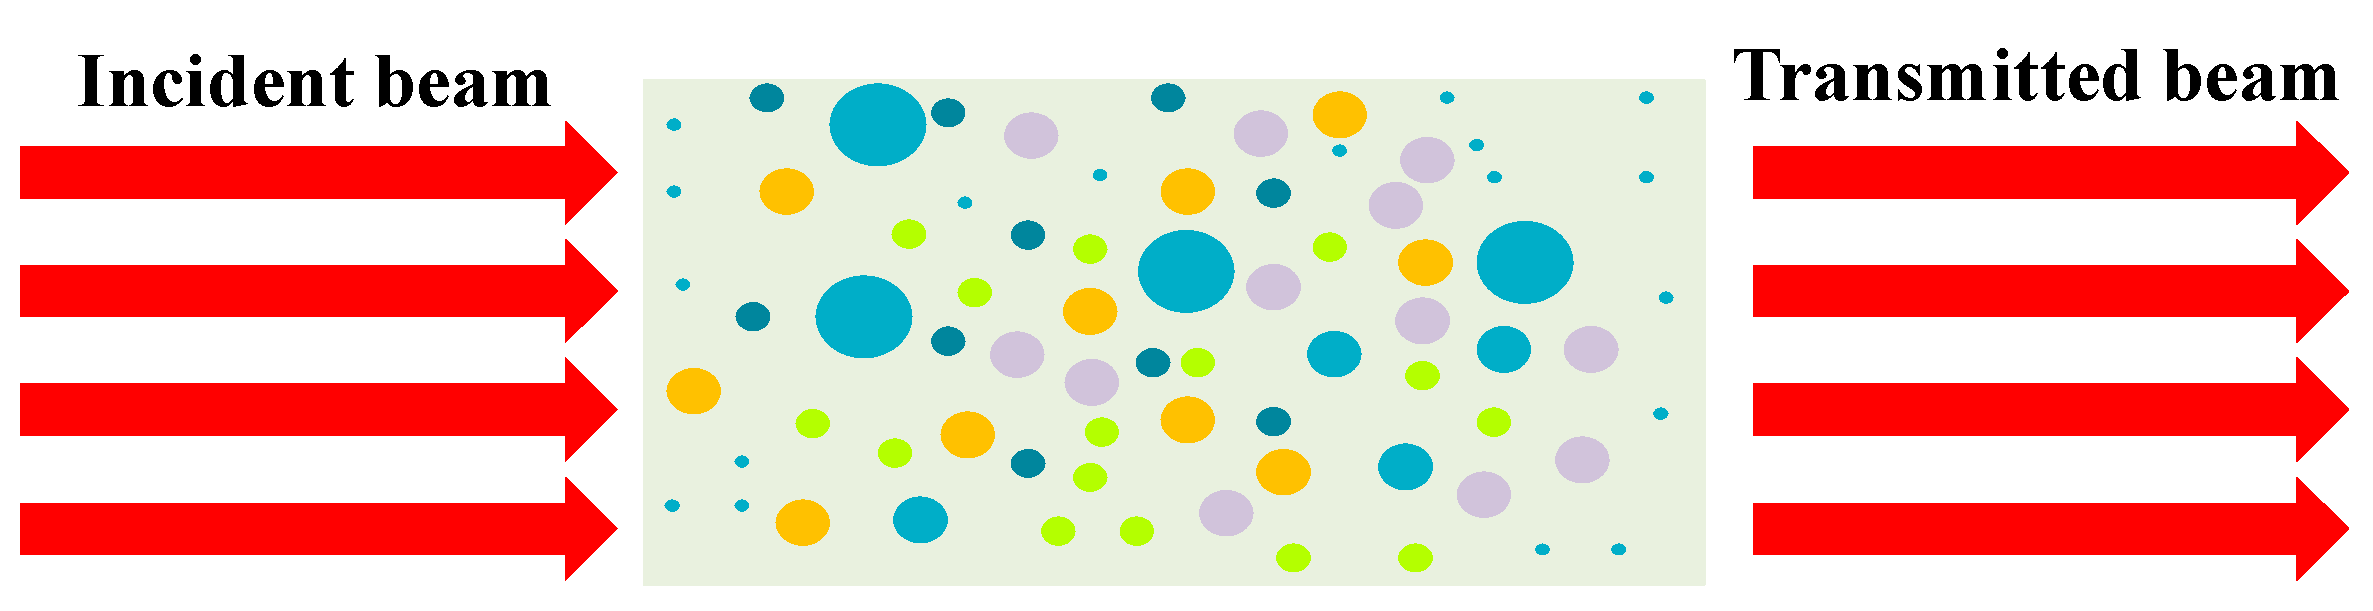
2.1. Lambert–Beer Law

According to the Lambert–Beer law [17,18,19], when a parallel monochromatic beam passes through a homogeneous non−scattering sample, the absorbance is proportional to the concentration and thickness of the sample, as indicated in Figure 1.
I t = I 0 · e P S ( T ) Φ C L
where I t is the measured light intensity transmitted to the sample; I 0 denotes the light intensity of the incident beam; P is the gas pressure, which affects the molecular motion and results in a Doppler shift; C is the gas concentration; L is the effective absorption path length; Φ is the lineshape function; and S ( T ) is the function of line strength, which is a parameter that indicates the absorption intensity of light by gas molecules, and the expression is as follows:
S ( T ) = S ( T 0 ) Q ( T 0 ) Q ( T ) T 0 T exp [ h c E i k ( 1 T 1 T 0 ) ] × 1 exp ( h c v 0 k T ) 1 exp ( h c v 0 k T 0 )
S ( T 0 ) signifies the spectral intensity at the reference temperature, which is generally taken as a reference from the HITRAN spectral database at T0 = 296 K; Q ( T ) is the partition function of the absorbing molecule; h represents the Planck constant; c stands for the lightspeed; k is the Boltzmann constant; E i is the lower energy level of the absorbing gas molecule; and v 0 is the central frequency of the absorption line.

2.2. Experimental Setup

The schematic diagram of the experimental setup for the measurement of CO2 concentrations using TDLAS is shown in Figure 2. The light source we used was the DFB (Distributed Feedback Laser) with a wavelength of 1572.974 nm, whose modulating signal was generated by a laser driver (LDTC520) controlled by a computer. CO2 and N2 gases, both with 99.99% concentration, were mixed thoroughly in a gas distribution system and then fed into the Herriott gas cell (HC10L−M02, Thorlabs). The incident beam was reflected 26 times to reach a maximum optical path length of 10.4 m after entering the gas cell and emitted from the other end of the gas cell to be received by a photodetector. The detected signal was demodulated by a homemade lock−in amplifier, and the reference signal was provided by the computer. The demodulated signal was finally displayed on an oscilloscope (Tektronix, DPO 4104).
To confirm a constant pressure level within the gas cell, a piezometer was placed at the inlet of the gas cell to record the inlet pressure, while a pressure controller was placed at the outlet to record and regulate the pressure inside the gas cell. The pressure experiment was initiated only when the readings of the piezometer and the pressure controller were in agreement. It is necessary to emphasize that all pressure tests in this work were pressurized at the basis of atmospheric pressure, i.e., 0 atm, which is the atmospheric pressure. All the instruments and devices are fixed on an optical platform, and a vibration source was utilized to provide acceleration to the platform. This work is aimed at an on−site measurement of CO2 concentrations in flue gas ducts where the vicinity is characterized by strong vibrations; thus, it is necessary to set up all components in a collective vibrating environment to better simulate the field environment. A magnetic accelerometer was employed to measure the acceleration of the gas cell in real time. All tests were started after ventilating 20 min to the gas cell.

3. Results

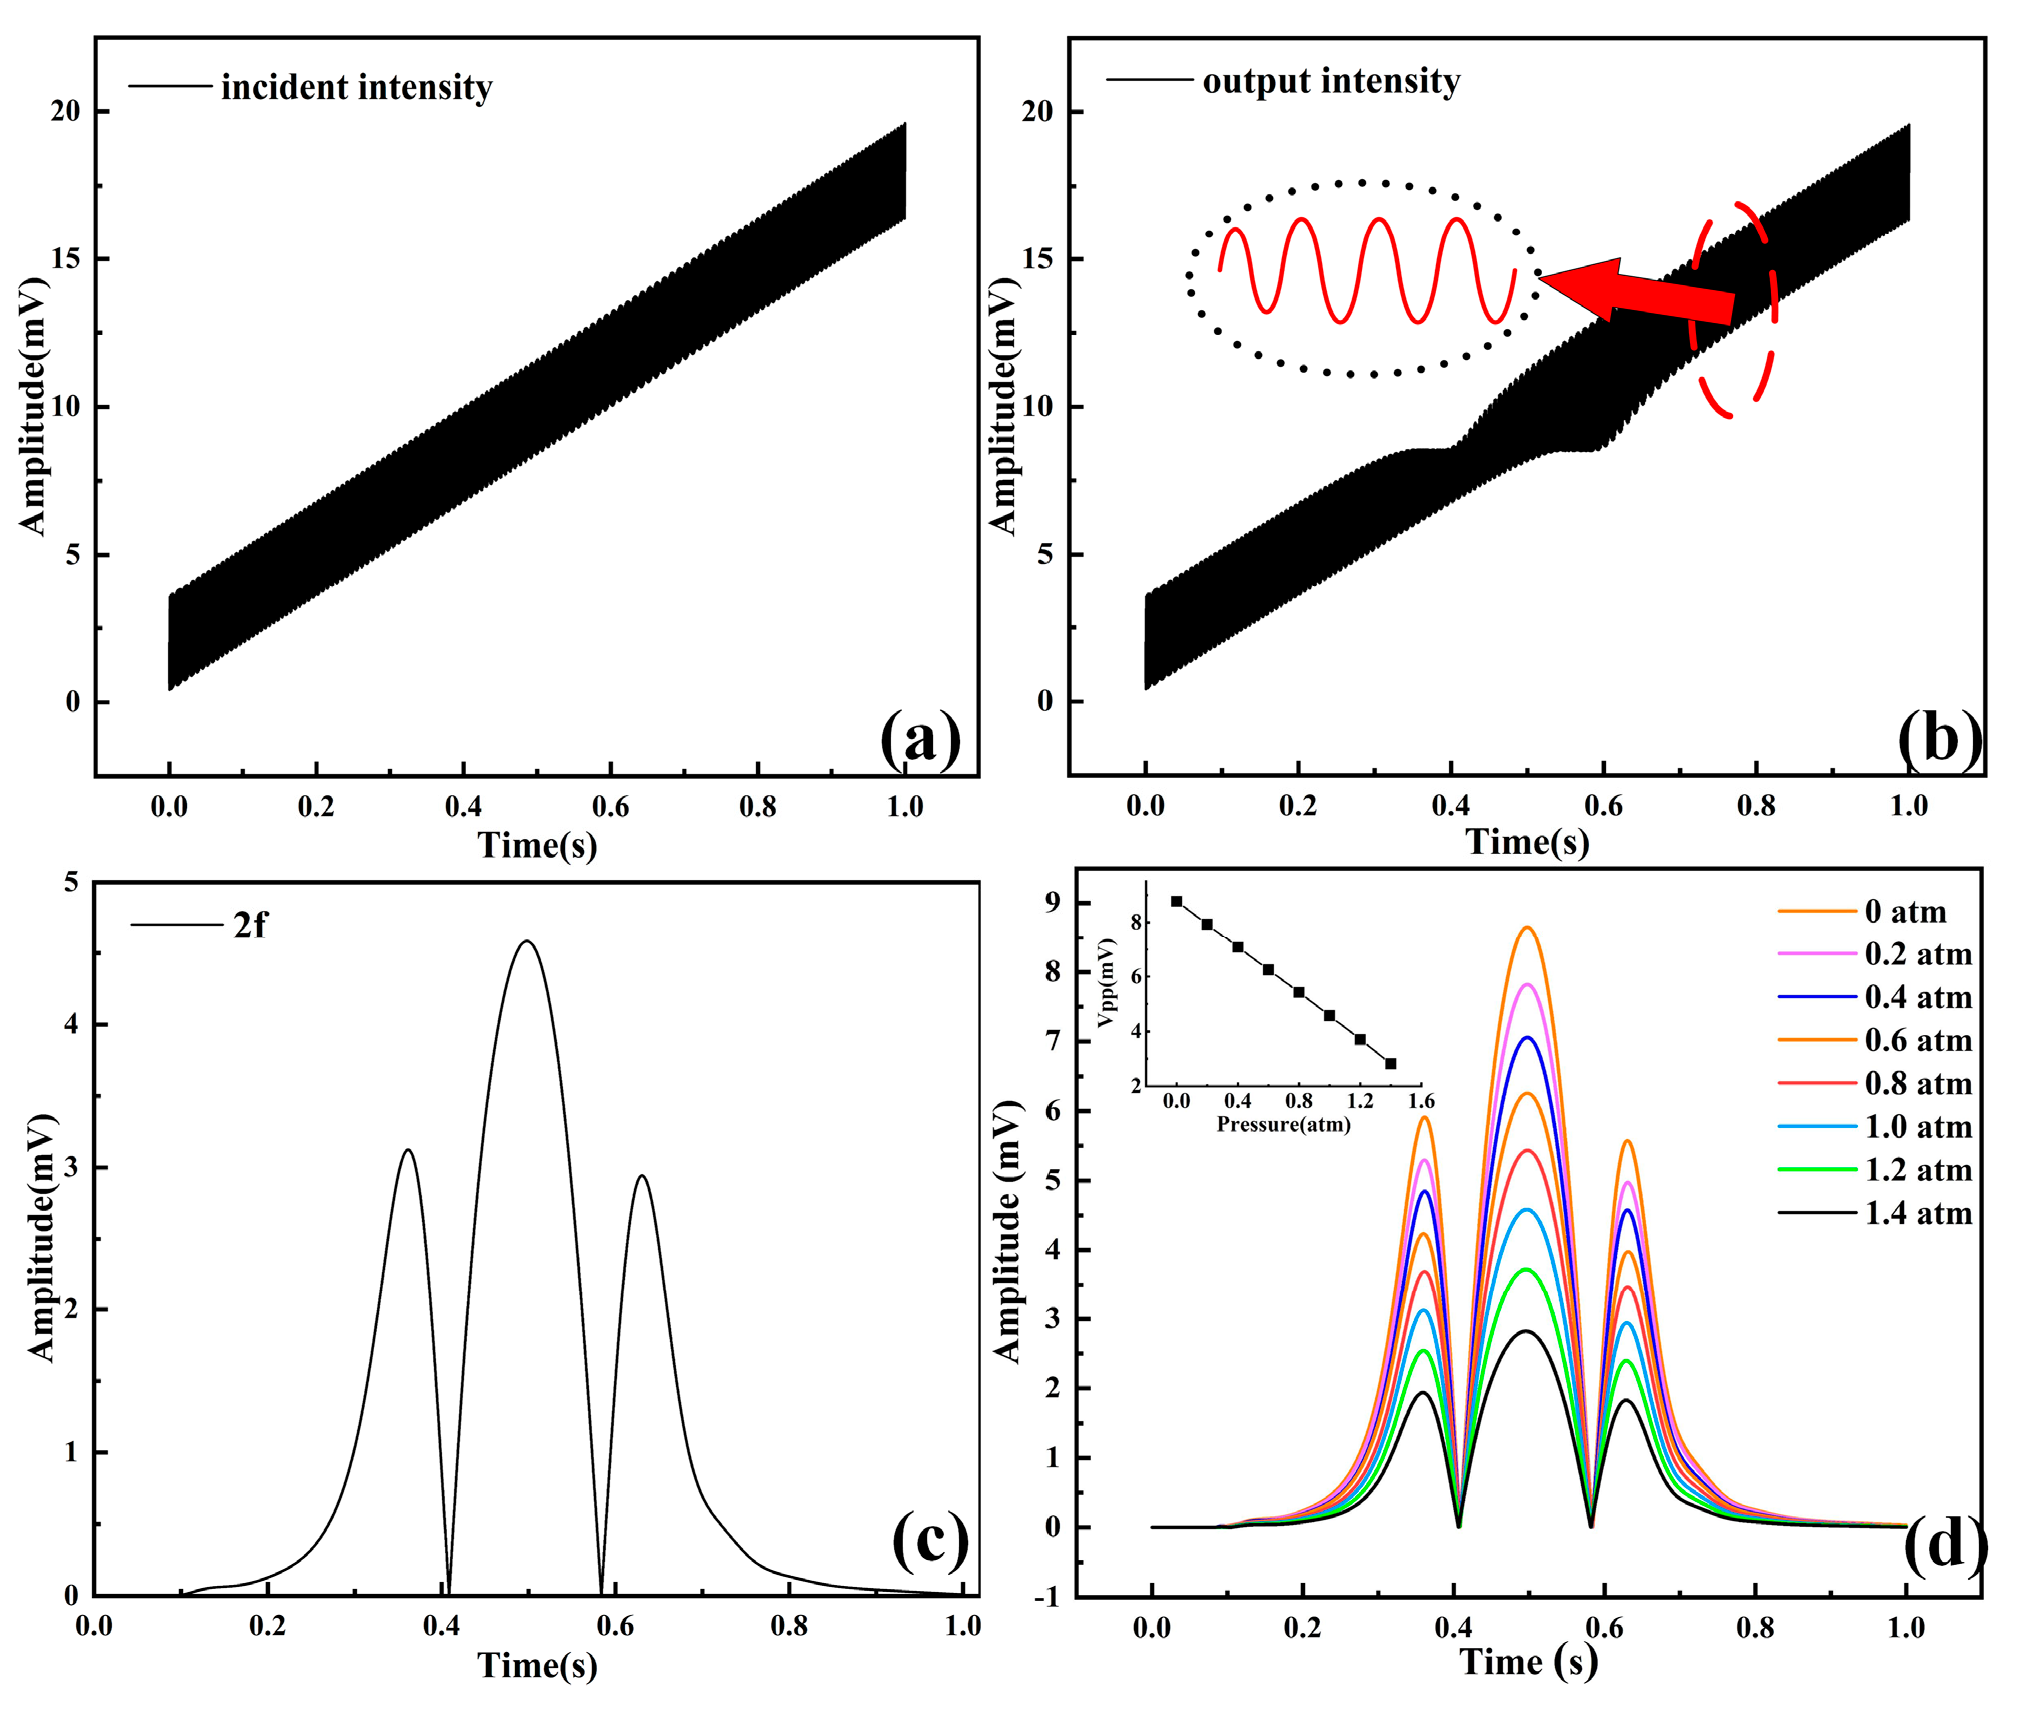
3.1. Determination of Main Parameters

In this work, the wavelength of 1572.974 nm was chosen as the central wavelength of the absorption spectral line, which can be converted to a wave number of 6357.38 cm−1 for ease of calculation. The absorption coefficients within the wavenumber range of 6353–6360 cm−1 at different pressures are shown in Figure 3a; the peak marked with a red box was the selected line, and it can be seen that there are few strong absorption lines of CO2 around 6357.38 cm−1 within the range of ±0.5 cm−1 according to the HITRAN database [20], which indicates that the selected line is barely affected by the nearby lines of CO2. The absorption coefficients show that the peak remains constant while the trough decreases with increasing pressure, illustrating that the absorption capacity on both sides of the center wavenumber will be enhanced by pressures, whereas those of the center wavenumber are nearly unaffected. A simulation of the absorption depression of the incident light intensity is shown in Figure 3b. It is evident that the width of the absorption depression increases with increasing pressures, followed by a diminishing peak to peak. Consequently, it can be inferred that the pressure will expand the line broadening, while the line intensity exhibits the opposite.
In terms of basic parameter settings, an appropriately high modulation frequency could improve the signal−to−noise ratio (SNR) and the anti−interference capability of the harmonic signal [21] yet also increase the non−linear modulation amplitude and the complexity of data processing. As such, a suitable modulation frequency of 5 kHz and a tuning frequency of 1 Hz were adopted. Regarding the phase selection, the transmitted beam was captured by the photodetector and converted to a voltage signal, which was demodulated by the lock−in amplifier to acquire two components with a phase difference of 90°, called the X−component and Y−component. The X− and Y−components and second harmonics within the phase range of 0~90° are shown in Figure 4. It can be clearly seen that an initially increasing trend of the peak to peak of the X−component with phase angle was observed, followed by a gradual decrease when reaching a phase of 50°, while a continuous decrease for the central peak of the Y−component can be found. The relationship between the second harmonic employed in this work and the two components can be described as follows:
R = X 2 + Y 2
As shown in Figure 4c, the peak of the second harmonic remained almost constant while reaching a maximum at 50°. Actually, although the X− and Y−components were strongly influenced by the phase angle, the second harmonic signal was minimally affected. Moreover, despite the fact that there is a maximum value for both the X−component and the second harmonic at a phase angle of 50°, it is difficult to observe the Y−component at this phase due to an indistinct peak that can be obtained. At 90°, on the other hand, both components and the second harmonic have clear waveforms. As a consequence, 90° was chosen as the preset value for the phase angle. The following experiments are based on the aforementioned parameters.

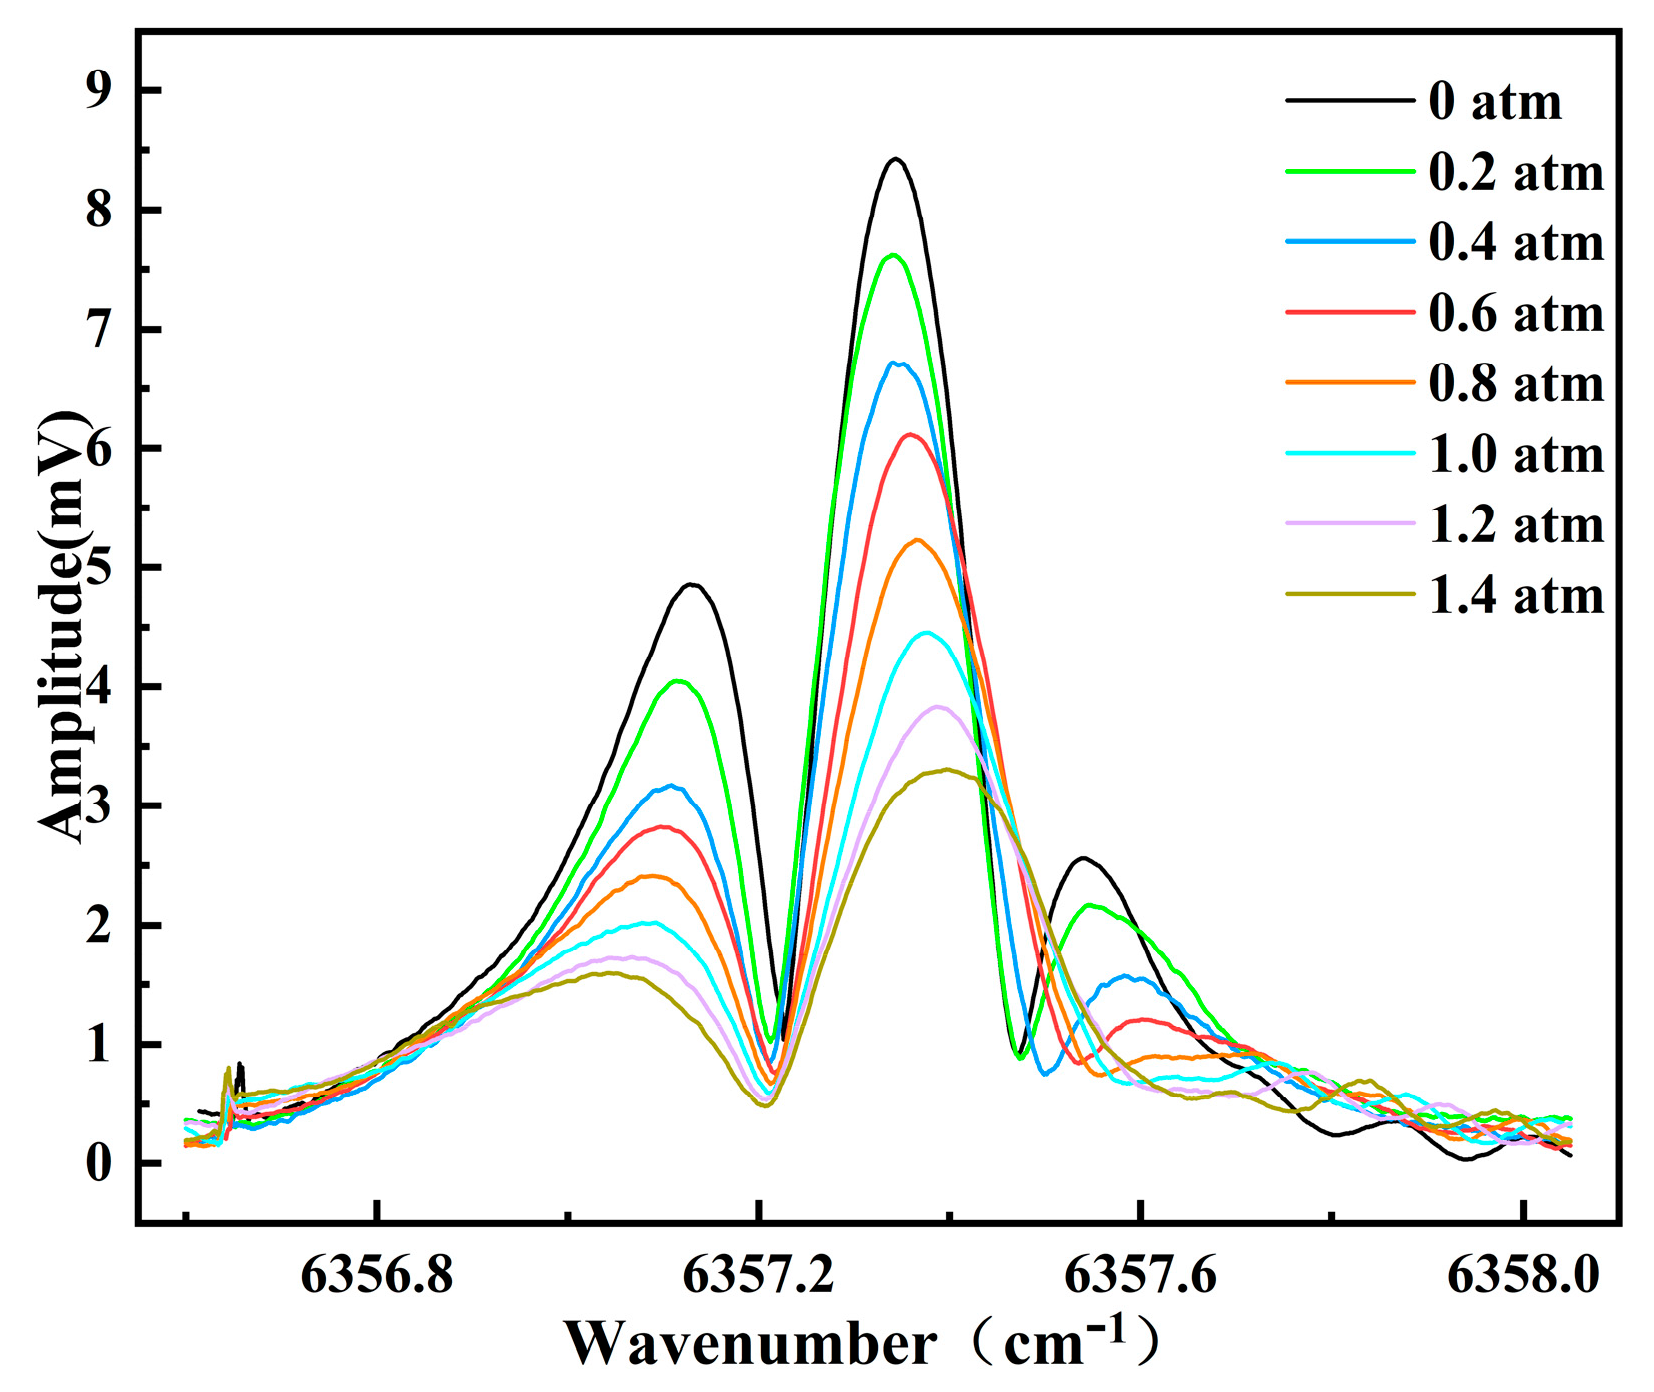
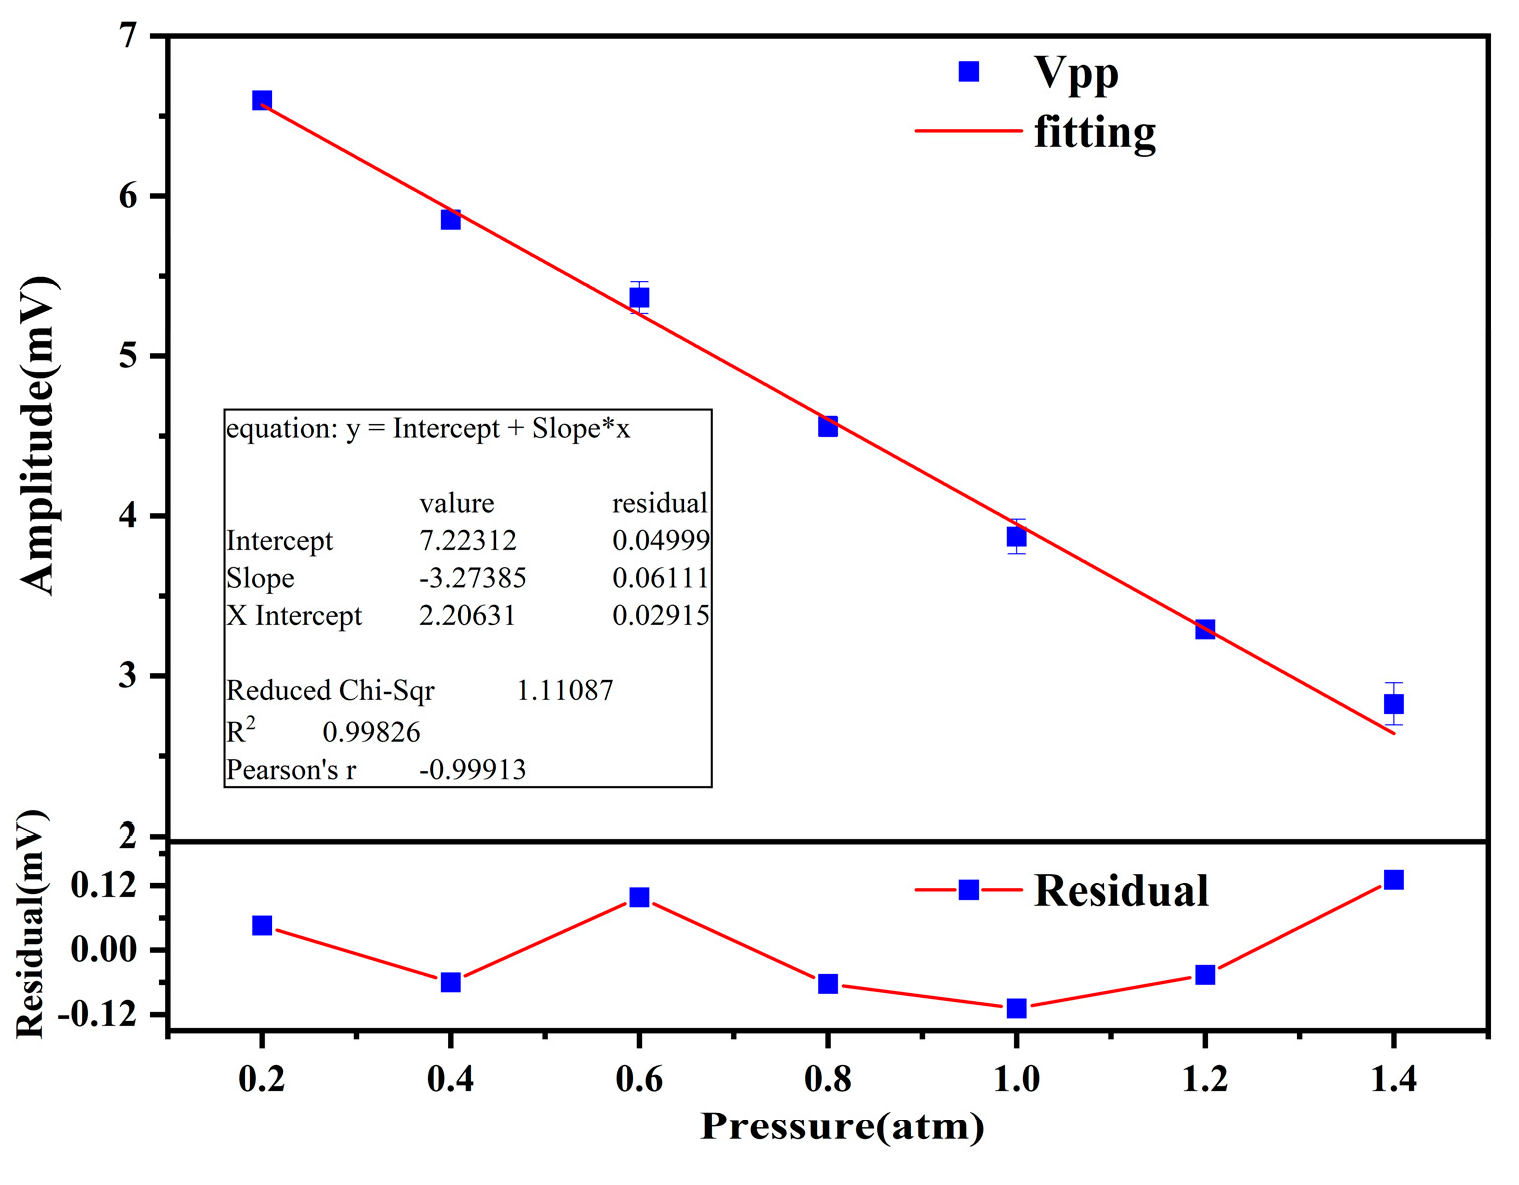
3.2. Pressure Testing

Since the pressure in the flue gas ducts fluctuates frequently, it is necessary to consider the effectiveness of extracting the second harmonic under different pressure conditions. The effect of pressures on the TDLAS signals will be analyzed by simulation and experiment, respectively. Firstly, Simulink was utilized to simulate the absorption spectra of TDLAS under different pressure conditions, as well as the second harmonic generated when combined with WMS, as depicted in Figure 5. The output intensity absorbed by the gas cell produces a noticeable depression, and the obtained second harmonic (Figure 5c) gets quite close to the theoretical model [22]. Figure 5d illustrates that the peak of the second harmonic is negatively correlated with pressures and exhibits a strong linear relationship within the pressure, ranging from 0 atm to 1.4 atm.
Secondly, an experimental system was configured to validate the simulation results. The 99.99% N2 was fed into the gas cell, and then the transmitted beam was measured by a photodiode after ventilating for 20 min. As shown in Figure 6a,b, the X− and Y−components with remarkable fluctuations obtained at a CO2 concentration of 0% demonstrate that there exists a background signal, which is due to the instrument noise and the presence of impurities in gases. The absorption signal was acquired and demodulated after the 30% CO2−N2 mixture mixed by the gas distribution system was continuously vented into the gas cell for 20 min. Both the original X− and Y−components are accompanied by relatively large fluctuations, while a smoother signal was derived by deducting the corresponding background, as depicted in Figure 6c,d, and a more symmetrical second harmonic, as depicted in Figure 7.
To perform TDLAS signal detection under different pressure conditions, the pressure controller fixed at the outlet of the gas cell was adjusted to maintain the pressure in the gas cell at a predetermined level. Usually, the pressure in flue gas ducts will not exceed 1.6 atm. In order to ensure the safety of the instrumentations, it was decided to conduct pressure tests within the range of 0~1.4 atm. As can be seen in Figure 8, there is a regular decline that the amplitude of the second harmonic exhibits as the pressure increases, which is consistent with the results of the simulation. Furthermore, one can observe that the central wavenumber shifts to a larger value while the spectral line becomes broader with the increasing pressure. The phenomenon of the former is possibly due to the elimination of the right−sided lobe with increasing pressures, resulting in a reduction in the symmetry of the waveform. The trend of the latter coincides with the absorption coefficient discussed in Section 3.1, indicating that the waveform of the second harmonic will be impacted by the absorption coefficient. Due to the absence of waveform symmetry, the right−sided lobe almost vanishes when the pressure increases to 1.0 atm, while the left−sided lobe remains distinct, even when the pressure reaches 1.4 atm. Consequently, the value of peak to peak was calculated by the left trough, and the central peak of the second harmonic was defined as the amplitude.

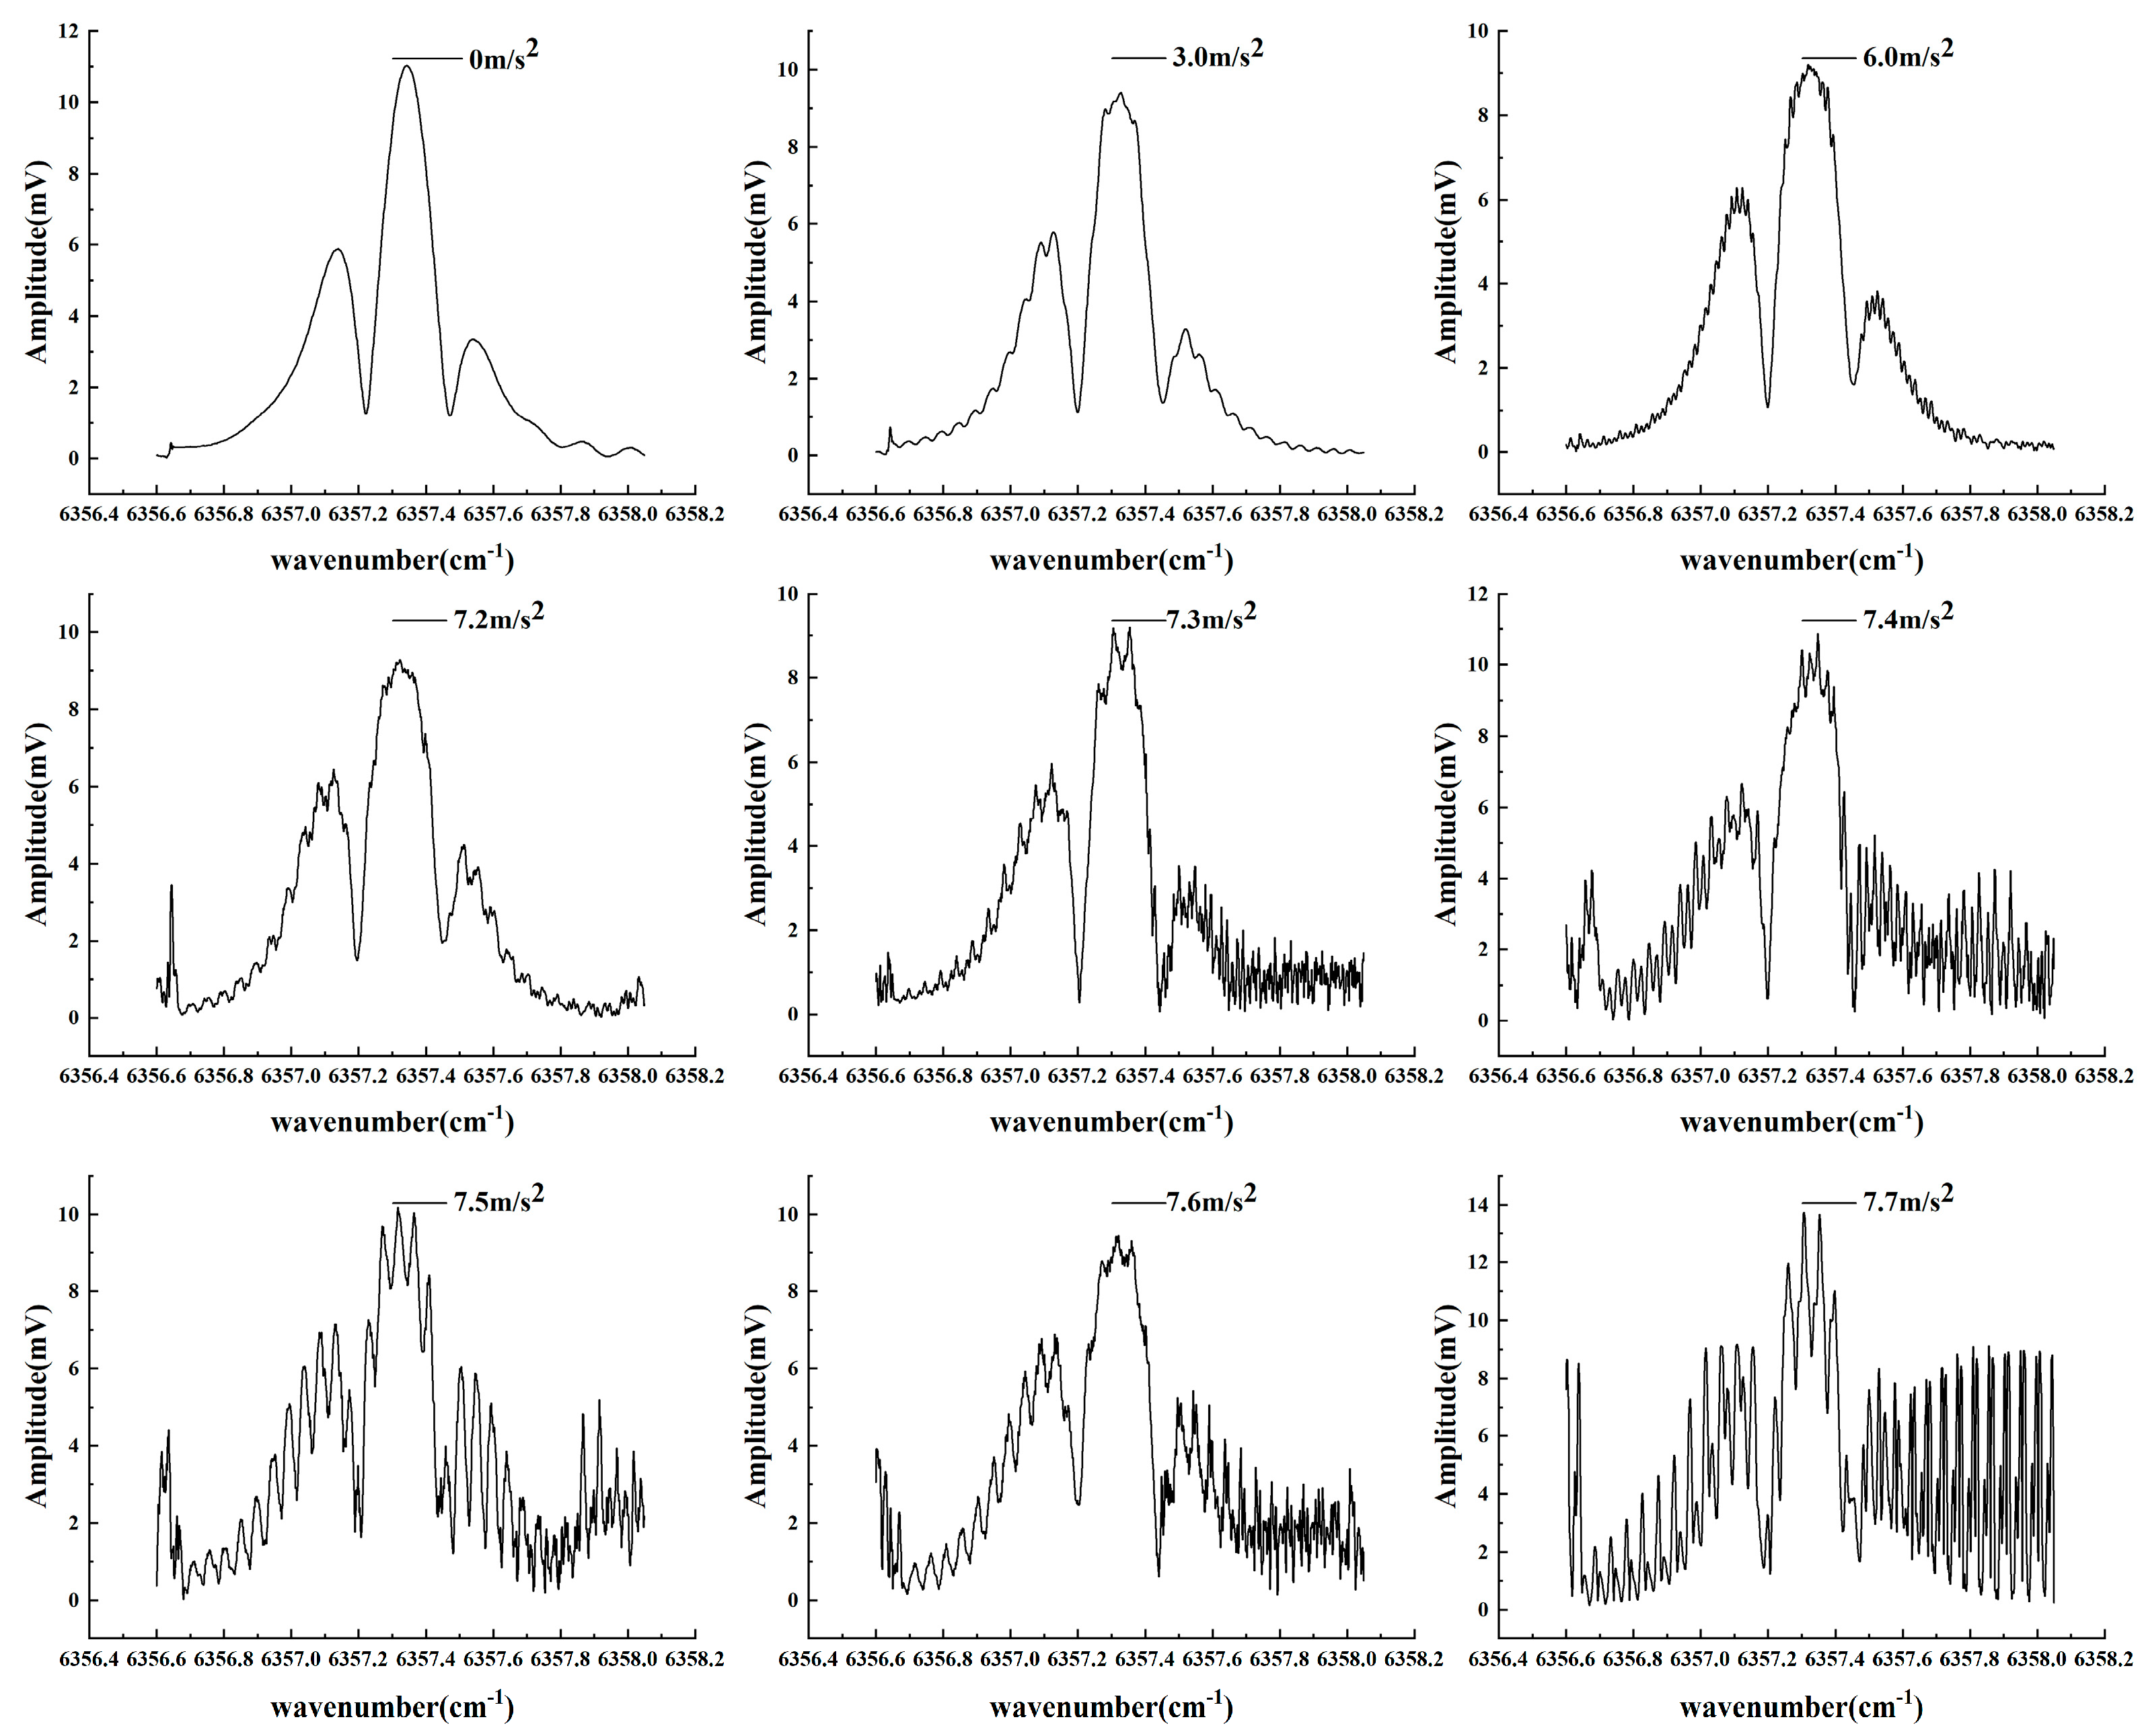
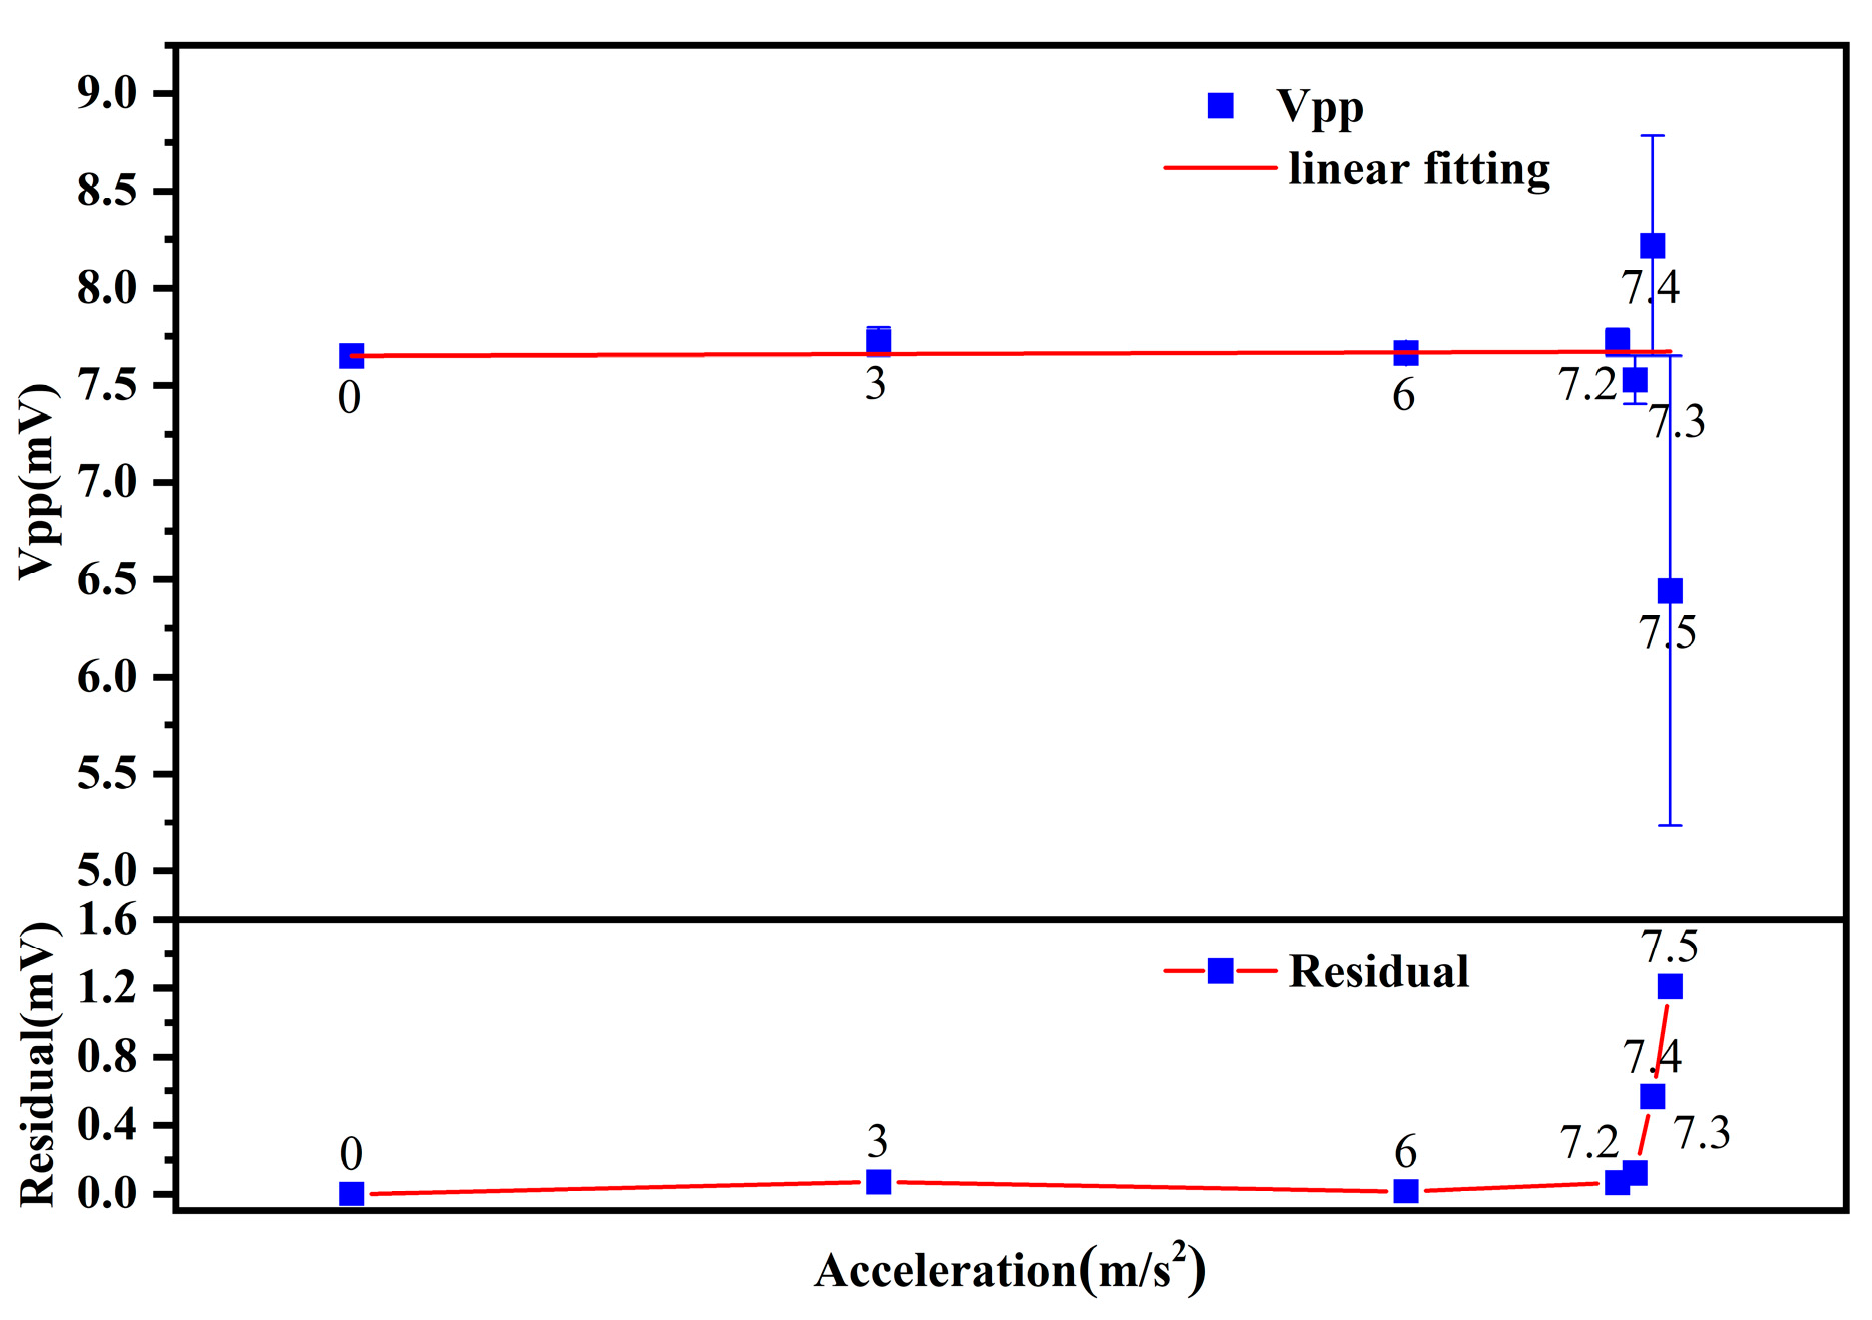
3.3. Vibration Testing

In addition to pressures, a large number of vibrations can also be produced during the operational process of the boiler, which can bring serious deflections and noises into the flue gas ducts. Accordingly, the evaluation of the adaptability of TDLAS employed in vibration environments cannot be ignored. To simulate the vibration of flue gas ducts, a vibration source was configured on the experimental platform to generate an acceleration ranging from 0 m/s2 to 7.7 m/s2. Similarly, a 30% CO2−N2 mixture was ventilated into the gas cell and then tested with different vibrations, i.e., different accelerations, and the acceleration of the gas cell was measured by a magnetic accelerometer. In addition, the pressure in the gas cell was maintained at the atmospheric pressure by the pressure controller. The corresponding second harmonics in the acceleration range of 0~7.7 m/s2 are shown in Figure 9.
It can be seen in Figure 10 that the vibration causes a significant disturbance to the second harmonic, and even inflicts a serious deformation to the waveform when reaching an acceleration of 7.3 m/s2, which will have a considerable impact on the calculation of the amplitude. Thus, a noise reduction method needs to be employed to minimize the impact of noise.
Wavelet transform is a time–frequency analysis method that decomposes a signal into wavelet coefficients at different scales and frequencies and filters out the noise in the signal by adjusting the thresholds of wavelet coefficients while preserving the main signal components. There are a variety of wavelet basis functions to be chosen, such as Haar, sym (Symlet), coif (Coiflet), bior (Biorthogonal), and so on. In addition, the level of layers can be adjusted to achieve a finer signal decomposition and noise removal. Based on multiple tests, bior3.6 was chosen as the wavelet basis function and the layer level was set to 5. The second harmonic obtained under vibration conditions were all de−noised by wavelet transform in this work. As shown in Figure 10, it is obvious that the noise is effectively suppressed until an acceleration of 7.3 m/s2. Unfortunately, a remarkable distortion of the de−noised signal can be noticed when the acceleration increases to 7.4 m/s2, indicating that it is no longer effective to de−noise at this acceleration level.

4. Discussion

4.1. Analysis of Pressures

In order to investigate the correlation between the amplitude of the second harmonic and the pressure, a scatter plot of the amplitude versus the pressure of the mixture gas was produced, as shown in Figure 11, while a linear fitting was performed. The R2 of 0.998 suggests that there is a strong linear relationship between the amplitude and the pressure. Combining Figure 11 and Table 1, the residual is relatively low when the pressure is below 1.4 atm. The result shows that, although the pressure causes the right−sided lobe of the second harmonic to almost disappear with increasing pressures, it does not affect the accurate calculation of the amplitude using the left trough and the central peak. Once again, a significant negative linear correlation between the amplitude and the pressure was observed. The relative error of 4.645% at a pressure of 1.4 atm with a residual of 0.1312 mV exceeds the ideal relative error of 3%, suggesting that the pressure that this system can withstand should not be higher than 1.4 atm. To sum up, the combination of TDLAS with WMS has demonstrated high adaptability in diverse pressure environments, making it well suited for precise spectral measurements within specific pressure ranges.

4.2. Analysis of Vibrations

Since the concentration of the CO2−N2 mixture was kept constant at 30% during the vibration experiment, the amplitude of the second harmonic should theoretically remain at the same level. By calculating and fitting the amplitude at different accelerations, residuals were found to rise as acceleration increased, as shown in Figure 12. Residuals were maintained within the desirable range of ±0.2 mV when the acceleration did not exceed 7.3 m/s2. As indicated in Table 2, a poor SNR and residual were acquired at an acceleration of 7.4 m/s2, where an accurate measurement could no longer be made due to the huge error. Notably, there is a distinct advance in the SNR when the acceleration increases to 7.5 m/s2, which is better than that of 7.4 m/s2. The phenomenon is probably due to the fact that the wavelet transform has a better effect of noise reduction on the former, and the de−noised waveform had already been severely distorted. In summary, the maximum acceleration that the system can sustain under the current experimental conditions is 7.3 m/s2.

4.3. The Combined Effects of Pressures and Vibrations

Actually, it is a combination of pressures and vibrations in the flue gas ducts during the boiler running that lead to a more complicated working environment. Accordingly, it is crucial to understand the comprehensive impact of pressures and vibrations on the features of absorption spectra. To validate the effectiveness of TDLAS in such a complex circumstance, a vibration test was conducted at different pressures, including 0.6 atm, 1.0 atm, and 1.4 atm, respectively. The results, as shown in Figure 13 illuminate that the amplitude of the second harmonic still shows a downward trend with rising pressures. Furthermore, the sustained increase in the second harmonic amplitude within the range of 5.0–6.0 m/s2 may be attributed to the vibration in the pressurized environment, which makes the second harmonic distorted after the noise reduction using the wavelet transform and leads to an unexpected increasing trend of the amplitude in this acceleration range. Hence, it can be inferred that the system is capable of achieving outstanding detection performance for flue gas ducts with certain pressures and vibrations up to a maximum acceleration of 5 m/s2 within the pressure range of 0~1.4 atm. The results show that the detection capability of the system is compromised when affected by both pressures and vibrations, compared to that when affected by a single factor. In summary, this study provides insight into the comprehensive impact of pressure and vibration on absorption spectral features and offers a valuable reference for monitoring flue gas ducts in challenging operating environments.

5. Conclusions

In conclusion, we have investigated the effects of pressures and vibrations on TDLAS signals for CO2 measurement. The different pressure conditions of 0~1.4 atm and acceleration conditions of 0~7.7 m/s2 were employed for analysis. For the effect of pressures, it was shown by simulation that the amplitude of the second harmonic exhibits an approximately linear decrease with pressures, with a correlation coefficient of 0.98. The relative error in the pressure range of 0~1.2 atm is within the ideal value of 3%, except for 4.645% at the pressure of 1.4 atm, indicating that the system can perform accurate measurements in the pressure range of 0~1.2 atm. During the vibration test, the residuals remained within the range of 0~0.2 mV when the acceleration did not surpass 7.3 m/s2. However, when the acceleration exceeds this value, the SNR and residuals are worse, and accurate measurements cannot be carried out. Consequently, the maximum acceleration tolerance of the system was determined to be 7.3 m/s2.
In the presence of both pressure and vibration, the error increases sharply in the acceleration range of 5.0~6.0 m/s2 for all three pressure conditions (0.6 atm, 1.0 atm, 1.4 atm). The detection capability decreases with increasing pressure, indicating that valid measurements can be made at accelerations up to 5 m/s2 when the pressure varies within the range of 0~1.4 atm under the existing experimental conditions, which is sufficient for flue gas ducts with slight vibrations. This demonstrates that TDLAS combined with WMS could achieve satisfactory detection performance despite the effects of pressures and vibrations, particularly for flue gas ducts with slight vibrations. Further work will be carried out to investigate the extraction of spectra under high noise conditions and improve the monitoring capability of the system.

Author Contributions

D.B.: formal analysis and writing—original draft. N.L.: conceptualization, data curation, and writing—review and editing. Y.Z.: conceptualization, resources, and writing—review and editing. C.X.: supervision and funding acquisition. All authors have read and agreed to the published version of the manuscript.

Funding

This research was supported by the Fundamental Research Program of Shanxi Province (202103021222012), Shanxi “1331 Project” Key Subject Construction (1331KSC), the National Natural Science Foundation of China (62305314), the Research Project Supported by the Shanxi Scholarship Council of China (2023-132), and the Central Guidance on Local Science and Technology Development Fund of Shanxi Province (YDZJSX2022A031).

Institutional Review Board Statement

Not applicable.

Informed Consent Statement

Not applicable.

Data Availability Statement

The data that support the findings of this study are available from the corresponding author upon reasonable request.

Conflicts of Interest

The authors declare no conflicts of interest.

References

  1. Mahamuni, G.; Rutherford, J.; Davis, J.; Molnar, E.; Posner, J.D.; Seto, E.; Korshin, G.; Novosselov, I. Excitation–Emission Matrix Spectroscopy for Analysis of Chemical Composition of Combustion Generated Particulate Matter. Environ. Sci. Technol. 2020, 54, 8198–8209. [Google Scholar] [CrossRef] [PubMed]
  2. Weiser, V.; Eisenreich, N. Fast Emission Spectroscopy for a Better Understanding of Pyrotechnic Combustion Behavior. Propellants Explos. Pyrotech. 2005, 30, 67–78. [Google Scholar] [CrossRef]
  3. Makowiecki, A.S.; Hoghooghi, N.; Strong, E.F.; Cole, R.K.; Ycas, G.; Giorgetta, F.R.; Lapointe, C.B.; Glusman, J.F.; Daily, J.W.; Hamlington, P.E.; et al. Mid-infrared dual frequency comb spectroscopy for combustion analysis from 2.8 to 5 µm. Proc. Combust. Inst. 2021, 38, 1627–1635. [Google Scholar] [CrossRef]
  4. Brackmann, C.; Bood, J.; Afzelius, M.; Bengtsson, P.E. Thermometry in internal combustion engines via dual-broadband rotational coherent anti-Stokes Raman spectroscopy. Meas. Sci. Technol. 2004, 15, R13. [Google Scholar] [CrossRef]
  5. Bolshov, M.A.; Kuritsyn, Y.A.; Romanovskii, Y.V. Tunable diode laser spectroscopy as a technique for combustion diagnostics. Spectrochim. Acta Part B At. Spectrosc. 2015, 106, 45–66. [Google Scholar] [CrossRef]
  6. Lee, J.; Bong, C.; Yoo, J.; Bak, M.S. Combined use of TDLAS and LIBS for reconstruction of temperature and concentration fields. Opt. Express 2020, 28, 21121–21133. [Google Scholar] [CrossRef] [PubMed]
  7. Du, J.; Yin, C.; Deng, J.; Wang, W.; Cai, C. Study on influence of temperature and pressure in TDLAS trace CO detection. In Proceedings of the 2017 IEEE 2nd Information Technology, Networking, Electronic and Automation Control Conference (IT-NEC), Chengdu, China, 15–17 December 2017; pp. 213–217. [Google Scholar]
  8. Al-Manea, A.; Buttsworth, D.; Saleh, K.; Malpress, R.; Leis, J. Measurement of turbulent supersonic steam jet flow characteristics using TDLAS. Flow Meas. Instrum. 2022, 87, 102212. [Google Scholar] [CrossRef]
  9. Buchholz, B.; Afchine, A.; Ebert, V. Rapid, optical measurement of the atmospheric pressure on a fast research aircraft using open-path TDLAS. Atmos. Meas. Tech. 2014, 7, 3653–3666. [Google Scholar] [CrossRef]
  10. Lanzinger, E.; Jousten, K.; Kühne, M. Partial pressure measurement by means of infrared laser absorption spectroscopy. Vacuum 1998, 51, 47–51. [Google Scholar] [CrossRef]
  11. Deng, J.; Chen, W.-L.; Wang, W.-F.; He, Y.; Zhang, B.-L. Study on Online Detection Method of Methane Gas in Coal Mine Based on TDLAS Technology; Springer: Singapore, 2019; pp. 318–332. [Google Scholar]
  12. Burkle, S.; Walter, N.; Wagner, S. Laser-based measurements of pressure broadening and pressure shift coefficients of combustion-relevant absorption lines in the near-infrared region. Appl. Phys. B-Lasers Opt. 2018, 124, 121. [Google Scholar] [CrossRef]
  13. Cai, T.D.; Gao, G.Z.; Wang, M.R.; Wang, G.S.; Gao, X.M. Measurements of CO2 Concentration at High Temperature and Pressure Environments Using Tunable Diode Laser Absorption Spectroscopy. Spectrosc. Spect. Anal. 2014, 34, 1769–1773. [Google Scholar]
  14. Cai, T.D.; Gao, G.Z.; Wang, M.R.; Wang, G.S.; Liu, Y.; Gao, X.M. High-Pressure Measurements of Temperature and CO2 Concentration Using Tunable Diode Lasers at 2 μm. Appl. Spectrosc. 2016, 70, 474–484. [Google Scholar] [CrossRef] [PubMed]
  15. Li, C.L.; Wu, Y.F.; Qiu, X.B.; Wei, J.L.; Deng, L.H. Pressure-Dependent Detection of Carbon Monoxide Employing Wavelength Modulation Spectroscopy Using a Herriott-Type Cell. Appl. Spectrosc. 2017, 71, 809–816. [Google Scholar] [CrossRef] [PubMed]
  16. Li, N.; Lu, X.J.; Weng, C.S. Laser intensity and absorbance measurements by tunable diode laser absorption spectroscopy based on non-line fitting algorithm. Acta Phys. Sin. Ch. Ed. 2018, 67, 057801. [Google Scholar]
  17. Nwaboh, J.A.; Werhahn, O.; Ortwein, P.; Schiel, D.; Ebert, V. Laser-spectrometric gas analysis: CO2–TDLAS at 2 µm. Meas. Sci. Technol. 2013, 24, 015202. [Google Scholar] [CrossRef]
  18. Witzel, O.; Klein, A.; Meffert, C.; Wagner, S.; Kaiser, S.; Schulz, C.; Ebert, V. VCSEL-based, high-speed, in situ TDLAS for in-cylinder water vapor measurements in IC engines. Opt. Express 2013, 21, 19951–19965. [Google Scholar] [CrossRef] [PubMed]
  19. Pogány, A.; Ott, O.; Werhahn, O.; Ebert, V. Towards traceability in CO2 line strength measurements by TDLAS at 2.7 µm. J. Quant. Spectrosc. Radiat. Transf. 2013, 130, 147–157. [Google Scholar] [CrossRef]
  20. Gordon, I.E.; Rothman, L.S.; Hill, C.; Kochanov, R.V.; Tan, Y.; Bernath, P.F.; Birk, M.; Boudon, V.; Campargue, A.; Chance, K.V.; et al. The HITRAN2016 molecular spectroscopic database. J. Quant. Spectrosc. Radiat. 2017, 203, 3–69. [Google Scholar] [CrossRef]
  21. Zhang, R.; Li, C.R.; Wang, Y.; Bai, W. Research on modulation frequency and scanning frequency parameters selection of TDLAS system. In Proceedings of the International Conference on Industrial Technology EDEP, Beijing, China, 11–12 June 2016; pp. 1–6. [Google Scholar]
  22. Li, H.; Liu, J.; He, Y.; He, J.; Yao, L.; Xu, Z.Y.; Chen, J.Y.; Yuan, S.; Kan, R.F. Simulation and analysis of second-harmonic signal based on tunable diode laser absorption spectroscopy. Spectrosc. Spectr. Anal. 2013, 33, 881–885. [Google Scholar]
Figure 1. Schematic of the Lambert–Beer law.
Photonics 11 00146 g001
Figure 2. Schematic diagram of the experimental setup for the measurement of CO2 concentrations under different pressure and vibration conditions.
Photonics 11 00146 g002
Figure 3. (a) Simulation of absorption coefficients at different pressures within the range wavenumber of 6353–6360 cm−1; (b) simulation of absorption depressions at different pressures in one period.
Photonics 11 00146 g003
Figure 4. Simulation of X−components, Y−components, and second harmonics at different phase angles: (a) X−components; (b) Y−components; (c) second harmonics.
Photonics 11 00146 g004
Figure 5. Simulation of the absorption spectra and second harmonic: (a) the incident intensity; (b) the output intensity after absorbing by a simulated gas; (c) the second harmonic; (d) the second harmonic at different pressures.
Photonics 11 00146 g005
Figure 6. (a,b) The X− and Y−components background signal; (c,d) the X− and Y−components pre− and post−subtraction of the background signal.
Photonics 11 00146 g006
Figure 7. The second harmonic before and after background removal with atmospheric pressure.
Photonics 11 00146 g007
Figure 8. Second harmonics at different pressures ranging from 0 atm to 1.4 atm under experimental conditions.
Photonics 11 00146 g008
Figure 9. Second harmonics acquired within the acceleration range of 0–7.7 m/s2 with atmospheric pressure.
Photonics 11 00146 g009
Figure 10. Second harmonics de−noised using the wavelet transform within the acceleration range of 3.0–7.5 m/s2.
Photonics 11 00146 g010
Figure 11. A linear fitting for the amplitude of the second harmonic and the corresponding residuals at different pressures.
Photonics 11 00146 g011
Figure 12. Amplitude fitting and the corresponding residuals within the acceleration range of 0–7.5 m/s2.
Photonics 11 00146 g012
Figure 13. The amplitude of the second harmonic within the acceleration range of 0–8 m/s2 at the pressures of 0.6 atm, 0.8 atm, and 1.4 atm.
Photonics 11 00146 g013
Table 1. Residuals and relative errors of the second harmonic amplitude at different pressures.
Pressure (atm)Residual (mV)Relative Error (%)
0.20.046020.697
0.4−0.060051.026
0.60.098621.838
0.8−0.063051.383
1.0−0.108792.811
1.2−0.046191.404
1.40.13124.645
Table 2. SNR and residuals of the de−noised second harmonic at different accelerations.
Acceleration (m/s2)SNRResidual
3.028.56460.07225
6.028.26360.01474
7.223.57690.06814
7.318.32900.12298
7.44.81840.56725
7.513.72391.20948
Disclaimer/Publisher’s Note: The statements, opinions and data contained in all publications are solely those of the individual author(s) and contributor(s) and not of MDPI and/or the editor(s). MDPI and/or the editor(s) disclaim responsibility for any injury to people or property resulting from any ideas, methods, instructions or products referred to in the content.

