Article

Adaptive Optics Methods to Rat Eye Properties: Impact of Pupil Diameter on Wavefront Detection

1
School of Biomedical Engineering (Suzhou), Division of Life Sciences and Medicine, University of Science and Technology of China, Hefei 230027, China
2
Jiangsu Key Laboratory of Medical Optics, Suzhou Institute of Biomedical Engineering and Technology, Chinese Academy of Sciences, Suzhou 215163, China
3
Center for Excellence in Brain Science and Intelligence Technology, Chinese Academy of Sciences, Shanghai 200031, China
4
Key Laboratory of Myopia of State Health Ministry, Key Laboratory of Visual Impairment and Restoration of Shanghai, Shanghai 200031, China
*
Authors to whom correspondence should be addressed.
Photonics 2024, 11(4), 359; https://doi.org/10.3390/photonics11040359
Submission received: 12 March 2024 / Revised: 5 April 2024 / Accepted: 11 April 2024 / Published: 12 April 2024
(This article belongs to the Special Issue Adaptive Optics: Methods and Applications)

Abstract

:
Achieving a high-quality wavefront sensing light spot and accurate wavefront estimation of the rat eye is still challenging due to its large ocular aberrations and the back reflections from fundus multilayer. Simulation and experiments of rat eye wavefront sensing are conducted to improve the quality of sensing spot for accurate wavefront estimation. The simulation results show that a smaller pupil diameter leads to a high quality of wavefront sensing light spot, and the model rat eye reaches diffractive limitation when the pupil diameter is 0.8 mm. However, the experimental results indicate a different conclusion. Consistent with the simulation results, the quality of the sensing light spot significantly improves when the pupil diameter decreases from 3.6 mm to 1.8 mm. The full width at half maximum (FWHM) of the sensing light spots decreases from 77.36 ± 8.95 μm to 26.78 ± 3.25 μm, and the calculated Strehl ratio increases from 0.007 to 0.396. As the pupil diameter continues to decrease to 1.2 mm, the sensing spot and calculated Strehl ratio continue to improve, while the detected low-order aberrations exhibit a significant increase in both value and variance. This observation suggests that using a half-filled pupil for rat wavefront detection may be a more favorable choice, which assists in obtaining high-resolution retinal images in the rat eye using adaptive optics technology.

1. Introduction

Many diseases, such as glaucoma [1,2], Alzheimer’s disease [3], and diabetic retinopathy [4], show pathological changes on retinal fine structures in their early stages. Ophthalmoscopy adopting adaptive optics technology presents an ideal method with cellular resolution for studying the pathological development, disease progression, and therapeutic effectiveness of retinal diseases in vivo [5,6,7,8,9]. Accurate wavefront detection is the basis for achieving high-resolution images with adaptive optics technology [9,10,11]. The Shack–Hartman wavefront sensor (SHWS) is the most widely used instrument for ocular wavefront detection [12,13,14]. It collects backscattered light from the fundus to produce the sensing light spot for estimating the wavefront aberration, so the quality of sensing light spot will directly impact the accuracy of wavefront estimation.
As one of the most popular model animals used in eye disease research, the high numerical aperture and dioptric power of the rat eye provide a great potential for high-resolution retinal imaging [15], but also cause far greater residual aberration in the presence of errors in sensing plane, sensing wavelength, and corrector position, presenting challenges in precise wavefront detection [16]. Previous research into the rat eye mostly focuses on low-order aberrations, such as refractive error, and relatively little quantitative information about the high-order aberrations of rat eyes is available. However, adaptive optics technology has been applied to rat eyes, e.g., for detecting the wavefront of the rat eye with a fluorescent signal [17,18], or obtaining high-resolution rat fundus images with wavefront senseless adaptive optics [19,20]. Further investigations are essential to understand the complexities of rat ocular aberrations and optimize wavefront sensing systems for these unique biological models.
Rat eye aberration rises as the entry pupil diameter expands [21]. It is generally acknowledged that a small pupil can mitigate the impact of aberrations on imaging. However, the high ocular diopter may lead to an inaccurate wavefront measurement when the pupil is too small. For instance, in the wavefront detection of the mouse eye, which is about half the size of the rat eye [22], a pupil-filled beacon light is used to reduce the depth of focus and prevent stray light. This is necessary because a high diopter power and a small pupil size can elongate the light spot in the Shack–Hartmann wavefront sensor, leading to poor quality wavefront sensing and inaccurate wavefront estimation [23]. Hence, the pupil used for wavefront sensing in the rat eye should be chosen carefully to manage the elongation of sensing light spots due to the extensive depth of focus and the blurred sensing spot generated by ocular aberration.
The aim of this study is to investigate the impact of pupil diameter on wavefront estimation in the rat eye in order to achieve a high-quality wavefront sensing light spot and accurate rat ocular aberration estimation. Simulation and experimental results indicate that the light spot quality improves as the pupil size used for wavefront detection decreases. But the detected aberrations exhibit a large low-order aberration value and significant variance between measurements when the pupil size continues to decrease, which may be attributed to the multilayer structure of the rat eye and the large depth of focus associated with a small pupil. This finding suggests that using a half-filled pupil diameter strikes the right balance to enhance the quality of the wavefront sensing light spot and improve the accuracy of ocular wavefront estimation in the rat eye, making it possible to obtain high-resolution images of the rat retina.

2. Simulation

2.1. Rat Eye Model and Optical Simulation

The quality of focal light spot on the rat retina directly affects the quality of wavefront sensing light spot, as the SHWS collects the back-scattered light from the retina. A rat eye model is constructed to investigate this relationship. The model is developed from previous studies, the radius of curvature and gradient index lens (GRIN) data were obtained from Campbell and Hughes, and the refractive index is calculated from dispersion data from Chaudhuri et al. [24,25]; the parameters are shown in Table 1. The core lens of the rat eye model is designed as a GRIN lens, and the refractive index variation of the core lens is described by Equation (1).
n r = n 0 + n r 1 r + n r 2 r 2
where n r represents the refractive index and r is the distance from the lens center to edge. n 0 , n r 1 , and n r 2 are the constants decided by wavelength, and the values are 1.486, 0, and −0.038 at 735 nm. The pupil diameter decreases from 3.6 mm (equivalent to the dilated pupil diameter of the rat) to 0 mm, and parameters are calculated for estimating the light spot quality as the pupil diameter varies. It must be emphasized that the simulation is carried out to find out the trend of light spot, and the calculated result may not precisely align with the detected measurements in practical experiments.

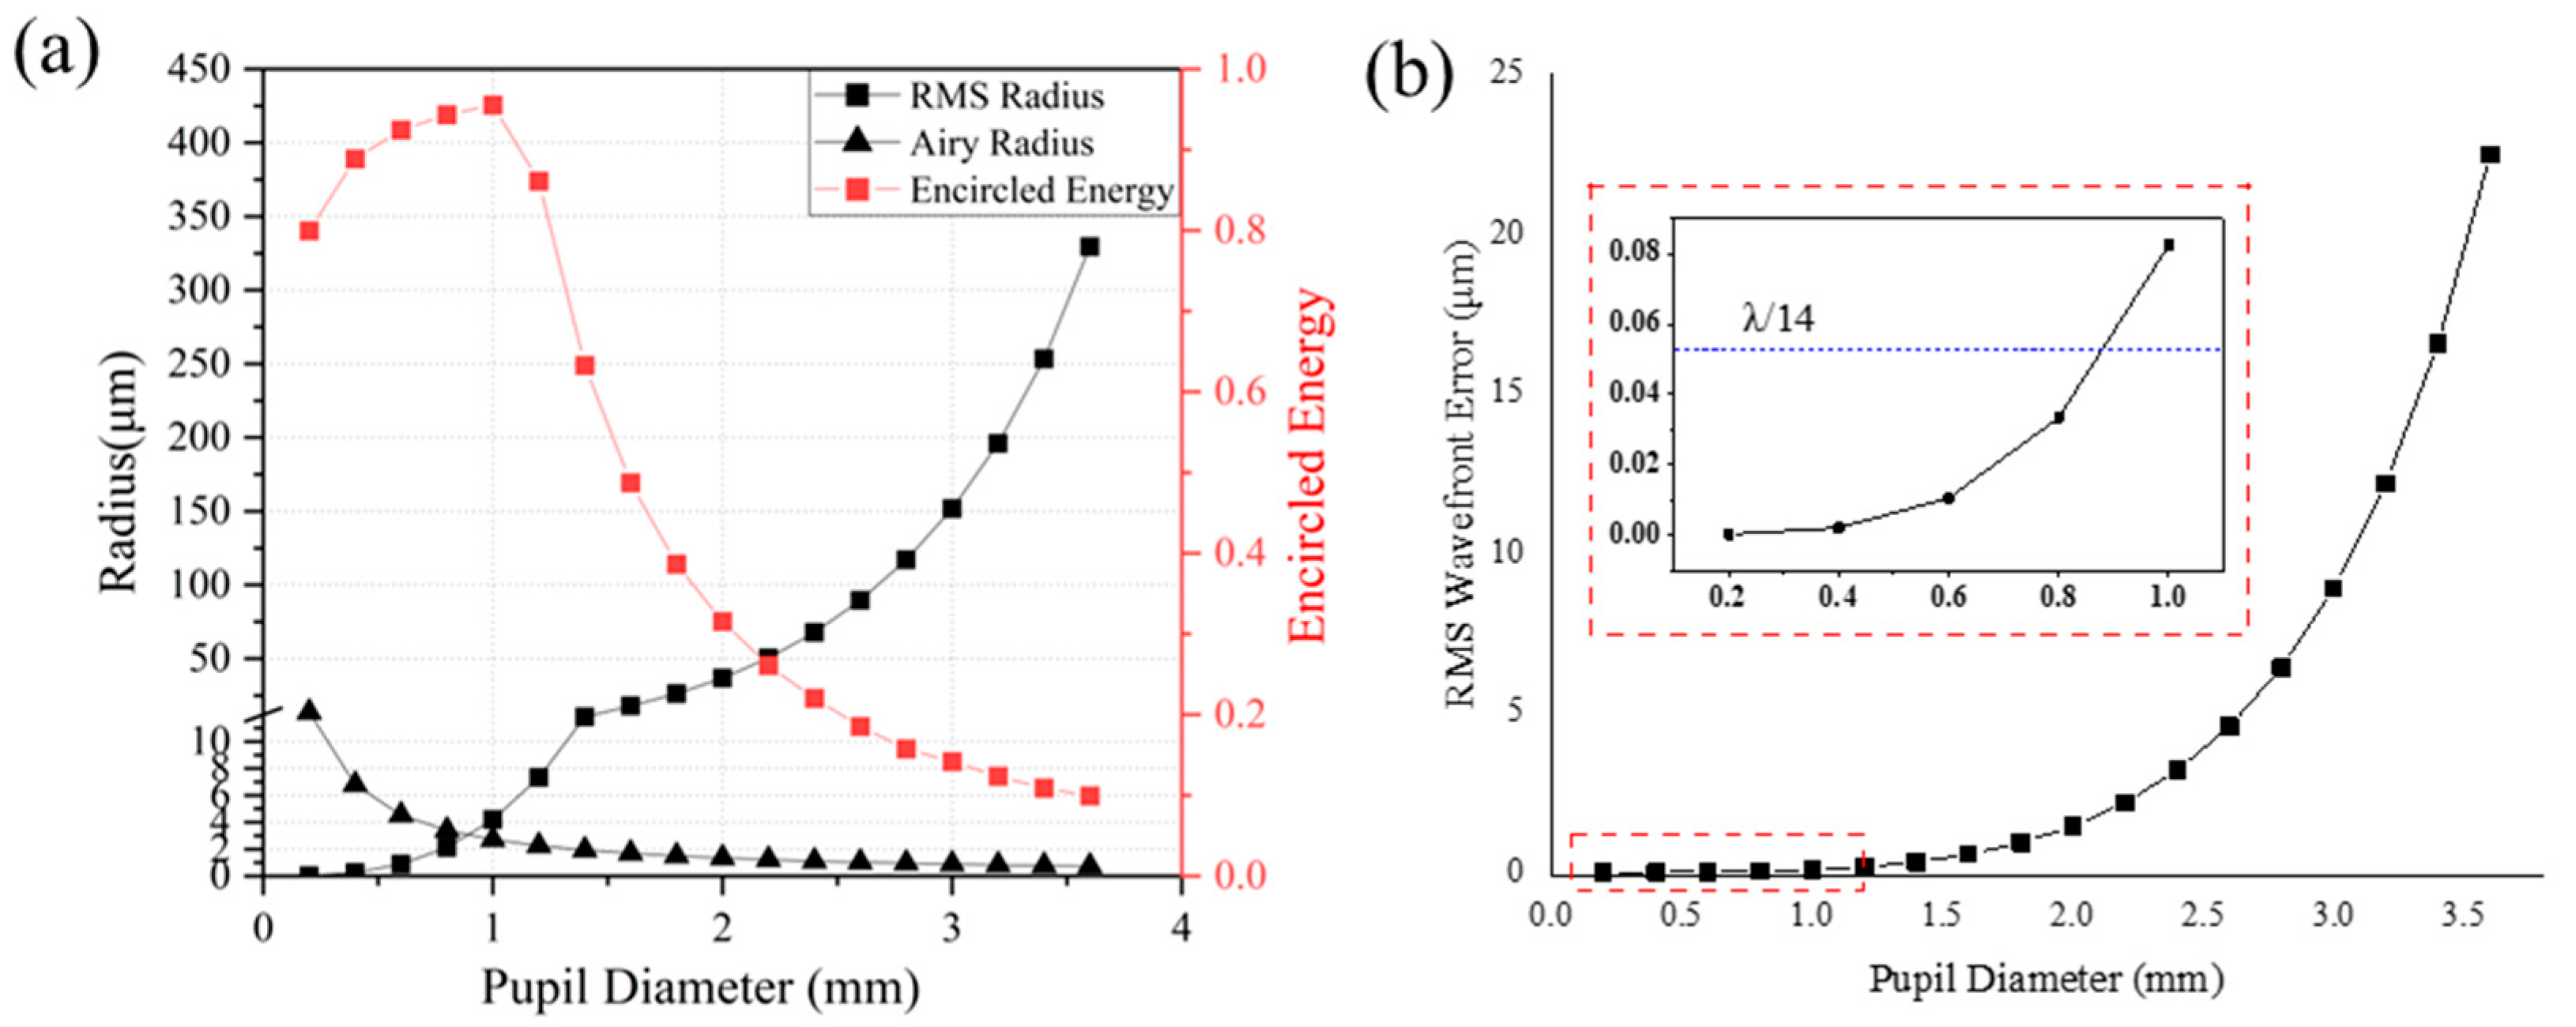
2.2. Simulation Results

Figure 1a displays the trends of the light spot radius and the Airy disk radius as the rat pupil diameter changes. The size of the Airy disk is inversely related to the pupil diameter according to the Airy disk formula, while the root mean square (RMS) radius of the light spot decreases dramatically with the rat pupil diameter. In particular, when the pupil diameter is 3.6 mm, the RMS radius is 329.435 μm, which is approximately 450 times larger than the radius of the Airy disk. At a pupil diameter of 0.8 mm, the size of the light spot is smaller than that of the Airy disk, suggesting that the optical system has reached its diffraction limit.
It is understandable that a smaller light spot results in higher light energy concentration and increased light intensity within a specific range. The encircled energy within 10 μm of the light spot is used to indicate the level of light energy concentration. The simulation results in Figure 1a demonstrate that the encircled energy increases when the pupil diameter decreases. The encircled energy reaches a maximum value when the pupil diameter is 1 mm, and gradually drops as the pupil diameter decreases further. This phenomenon can be attributed to the system reaching the diffraction limit when the pupil diameter is less than 1 mm, where the distribution of light energy on the focal plane follows the diffraction principles.
Figure 1b illustrates the RMS value of the wavefront error around the focal spot. At a pupil diameter of 3.6 mm, the wavefront error is approximately 23 μm, which is approximately 438 times larger than λ/14, the minimum required for achieving diffraction-limited resolution according to the Maréchal criteria. Decreasing pupil diameter results in a reduction in RMS wavefront error. Eventually, the system reaches the diffraction limit, and the RMS wavefront error becomes less than λ/14 when the pupil diameter is 0.8 mm. This observation aligns perfectly with the conclusion drawn from the light spot radius.
The simulation results indicate that a large pupil diameter results in a light spot on the retina with low quality, scattered energy, and considerable aberrations. Conversely, the light spot quality improves as the pupil diameter decreases, and reaches the diffraction limit when the pupil diameter is around 0.8 mm. The results are consistent with the widely known fact that a smaller pupil diameter produces a better quality light spot in the rat eye model. However, the simulation only accounts for the impacts of dioptric power and pupil size, without including multiple retinal layers or the depth of focus.

3. Wavefront Detection Experiments

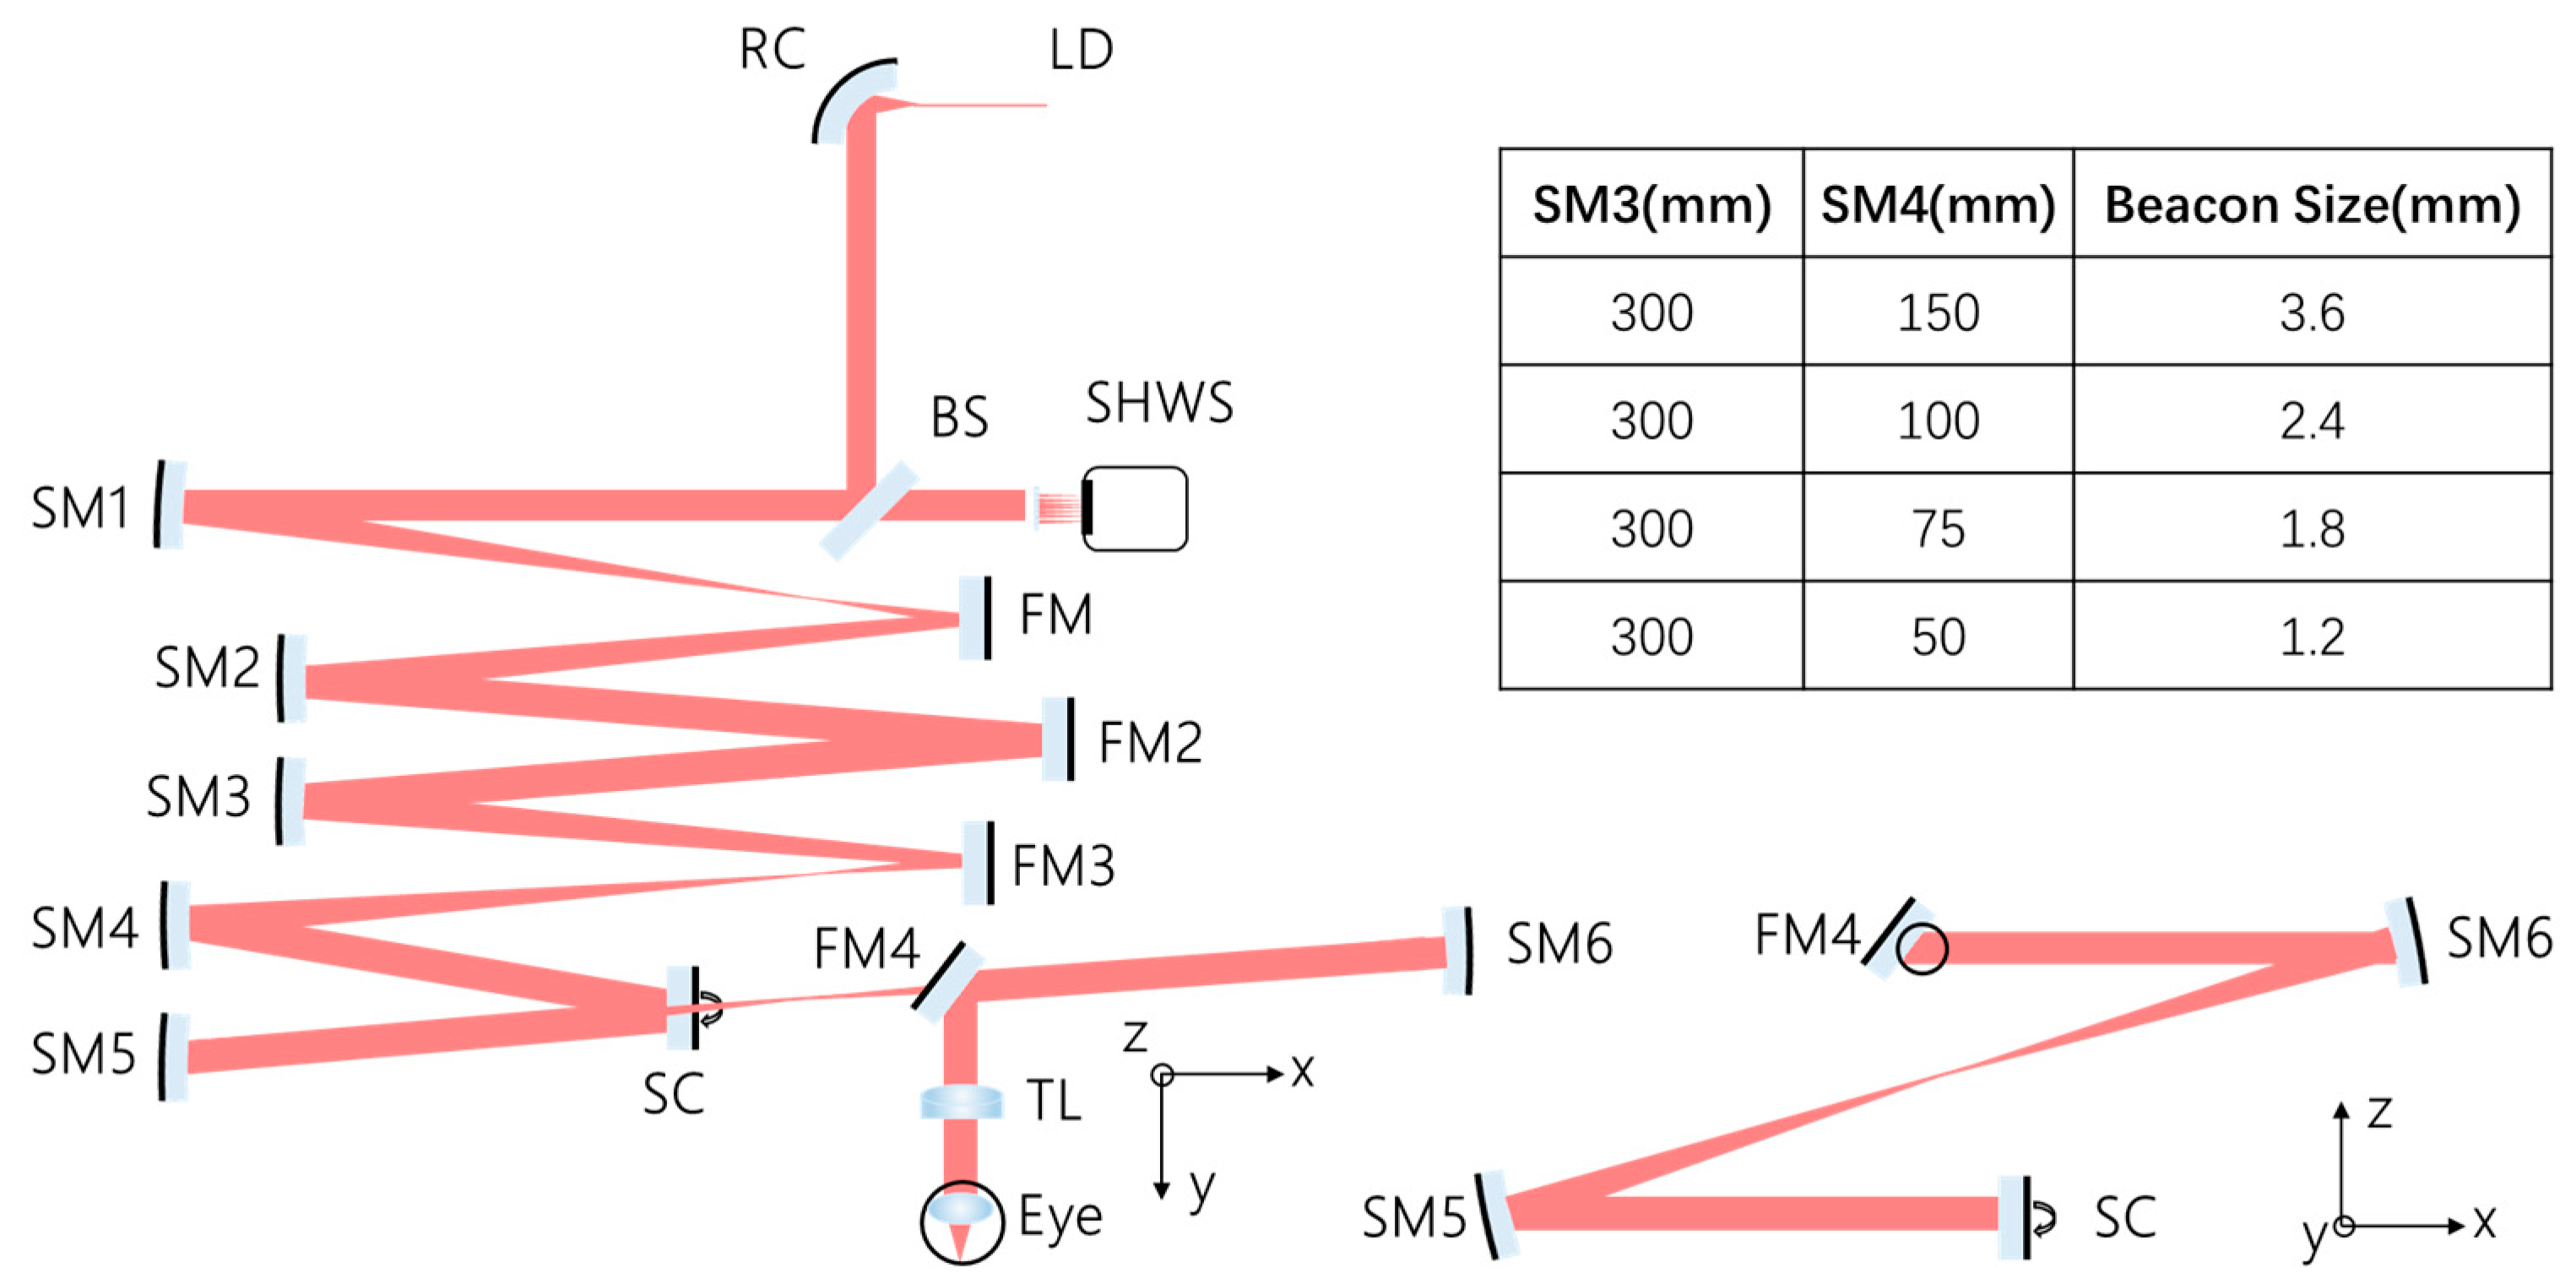
3.1. Optical System and Wavefront Detection

Figure 2 depicts the diagram of the wavefront sensing system, which is a modified version of a system initial developed for human use. The light source is a single-mode fiber-coupled 735 nm semiconductor laser diode (LD), with a light power at the rat cornea below 100 μW, which is approximately 1/20 of the ANSI MPE (Maximum Permissible Exposure) for a duration of 2 h [26]. The laser source is collimated using a reflective collimator and reflected by a beam splitter. Through the utilization of an afocal system consisting of spherical lenses, the collimated light is transmitted to the scanning mirrors and the rat pupil, ultimately focusing on the fundus. The backscattered light from the rat fundus retraces its path, passing through the beam splitter before being collected by the SHWS. The light source, scanning mirrors, and wavefront sensor are interconnected through an off-axis spherical mirror afocal telescope, all of which are conjugated to the rat eye pupil. The system is designed with a non-planar alignment, with optimization of the angles and distances between the mirrors to minimize systemic aberrations.
The custom-made SHWS consists of a lenslet array (MCR-150, 150 × 150 μm pitch, 5 mm focal length, Thorlabs, Newton, NJ, USA) and a digital CCD camera (acA1300-60gm, 1282 × 1026 pixel, 5.3 μm pixel size, Basler AG, Ahrensburg, Germany), and provides high-dynamic-range aberration measurements with a speed of 60 Hz. The beacon light is resized by means of spherical mirror pairs (shown as Figure 2) to detect rat eyes with different pupil sizes, and the backscattered light is resized for fully utilizing the pupil diameter of the SHWS sensor. According to the simulation results, four different pupil diameters from 3.6 mm to 1.2 mm are selected for the wavefront sensing experiment. The calculated results obtained with larger pupil diameters are truncated and renormalized to analyze the aberrations with smaller pupil diameters.
In front of the rat eye, a tunable lens is positioned to compensate for refractive errors, similar to the spectacle lens used in retinoscopy. The dioptric power of the TL can be adjusted within a range of −18D to +18D, which covers the reported refractive error of the rat eye. Assuming the rat has hyperopia, the TL is initially set to the maximum diopter value (+18D). Then, the TL is fine-tuned until the estimated defocus aberration in the SHWS is close to zero. At this point, the diopter of the TL is considered equivalent to that of the rat eye.

3.2. Animal Preparation

Four 16-week-old Long–Evans rats are used for wavefront measurements with different beacon light sizes. Before experiments, rats are anesthetized by means of an intraperitoneal injection of ketamine (60 mg/kg) and xylazine (5 mg/kg). Eye drops containing topical anesthetic (proxymetacaine hydrochloride eye drop, 0.1 mg/mL; Alcon Laboratories) and mydriatic (0.5% tropicamide-phenylephrine eye drop, 5 mg/mL; Alcon Laboratories) are used for corneal local anesthesia and pupil dilation.
The anesthetized rat is positioned on a custom-made platform that offers adjustable height, position, and angle settings to align the optical axis of the rat eye and the optical system precisely. During wavefront measurements, a warm pad is utilized to maintain the rat’s body temperature, and saline drops are intermittently applied to keep the cornea moist. The optical system is adjusted for different beacon light diameters after all rats have been tested.

3.3. Wavefront Sensing and Aberration Analysis

The wavefront sensing results are shown as the wavefront map on the sensor and the estimated Zernike coefficients with the custom-made software, which is expressed in terms of Zernike coefficients up to the 7th order, following the ANSI standard [27]. Notably, the Zernike coefficients of each rat are averaged from ten consecutive measurements after the application of a saline drop, and there are minimal variabilities among the images. The aberration information with smaller pupil diameters is calculated from the truncated and renormalized wavefront map. Strehl ratios and modulation transfer functions are subsequently calculated based on the average of the estimated Zernike coefficients. These metrics provide valuable insights into the optical performance and image quality of the system.

4. Results

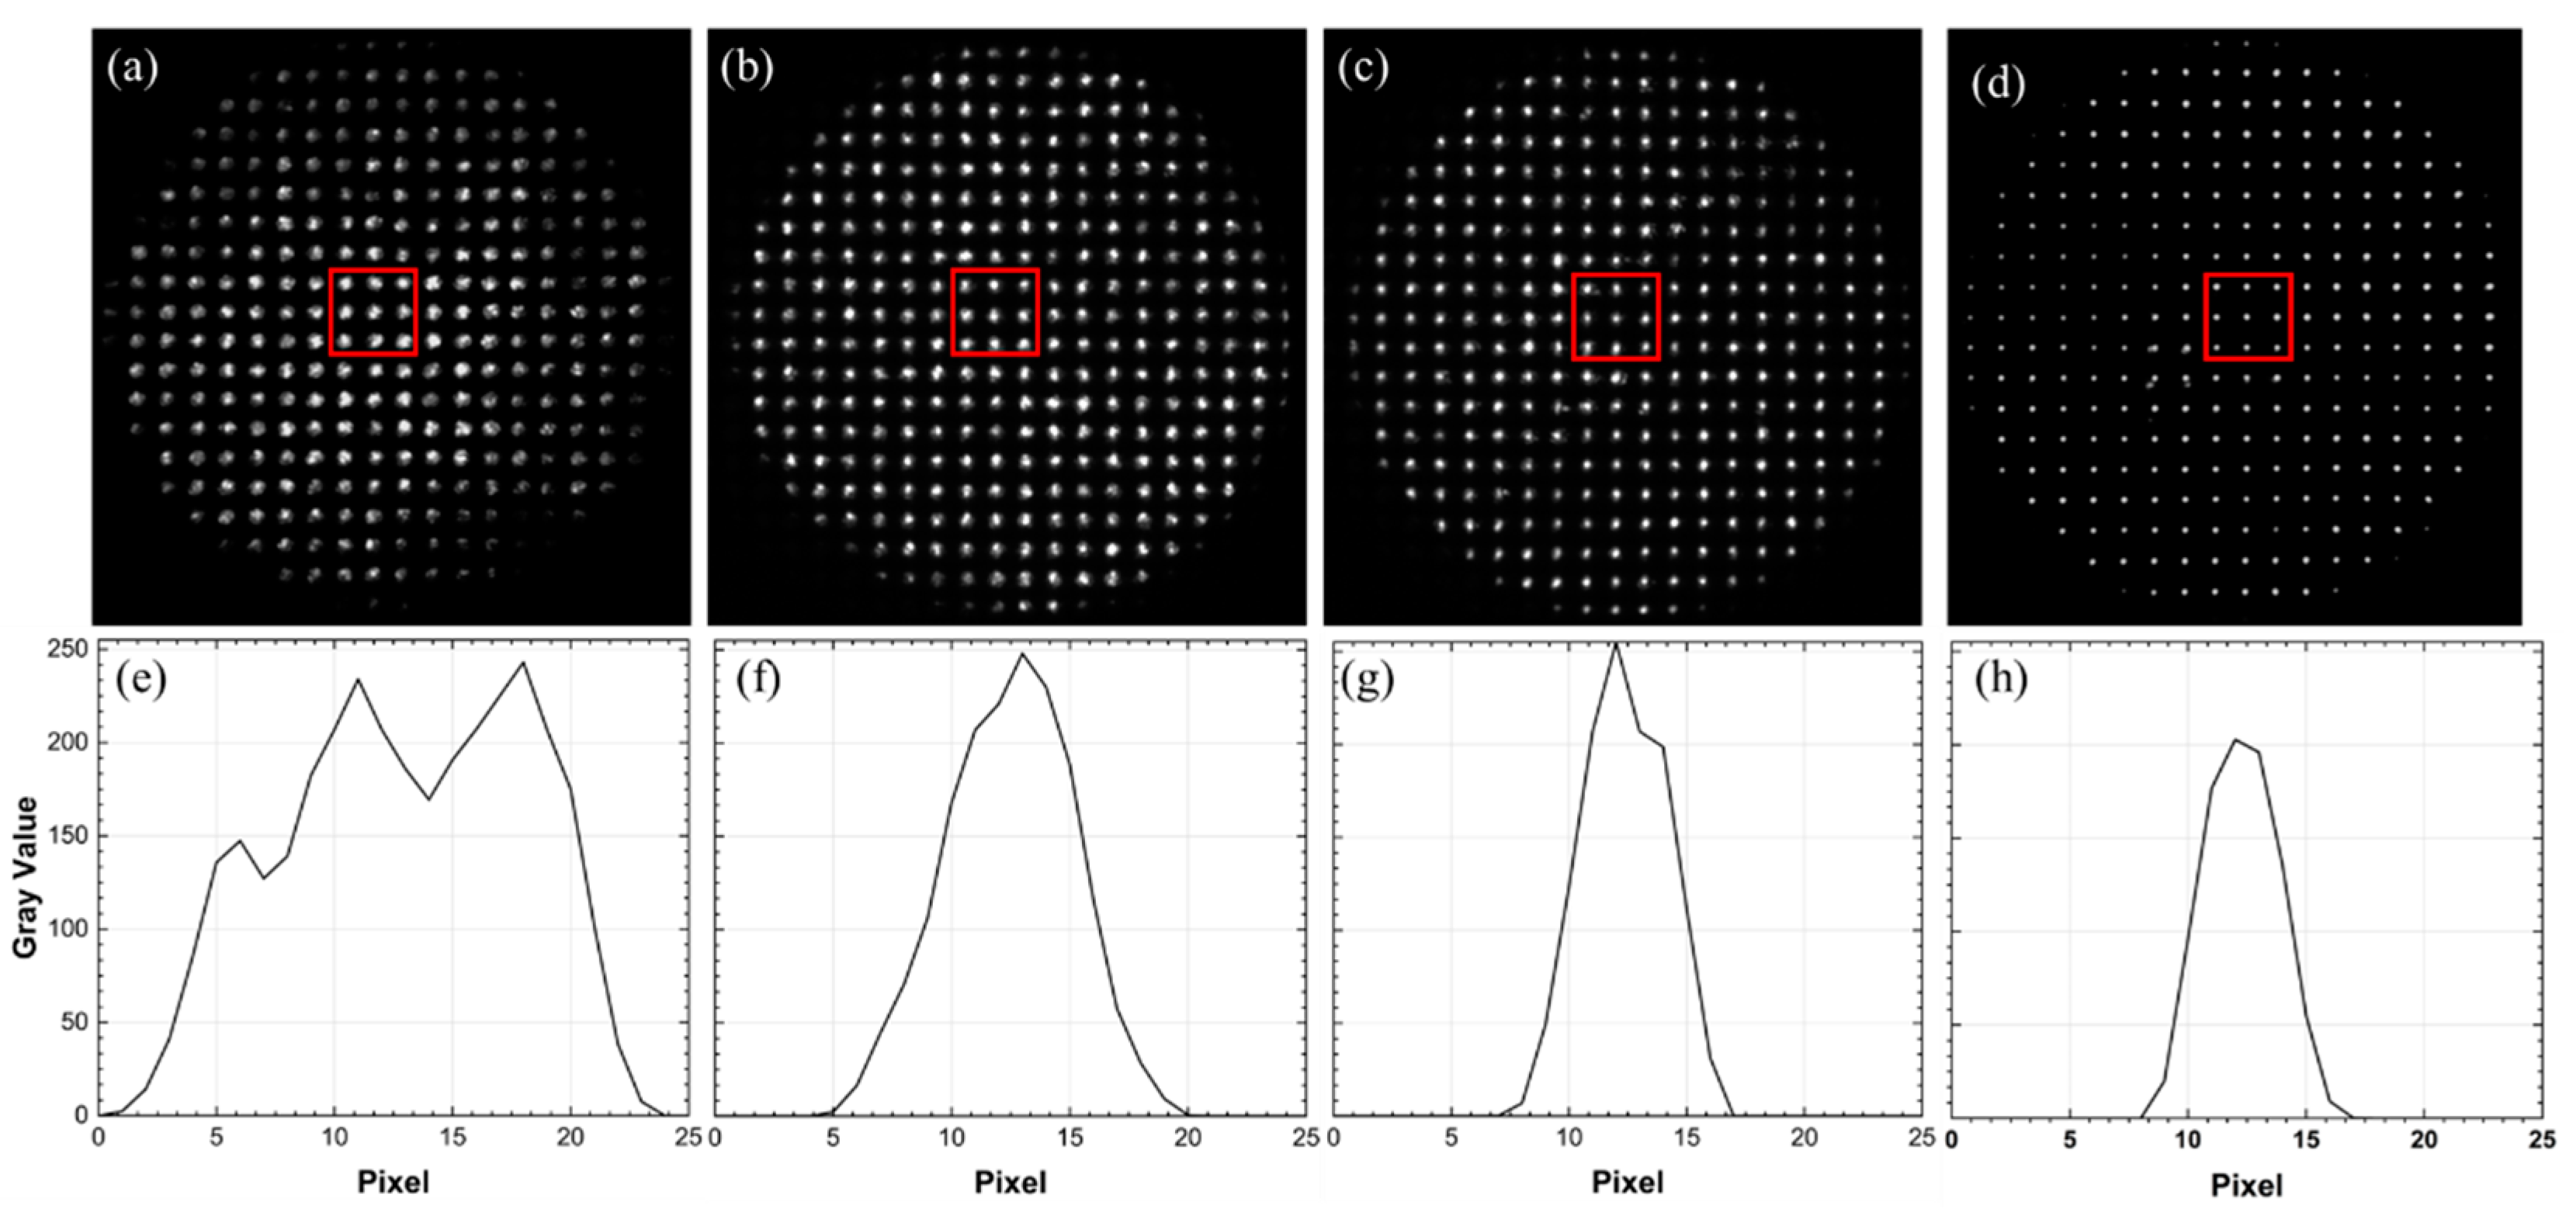
4.1. Wavefront Sensing

Figure 3 presents typical wavefront sensing map patterns obtained with different pupil diameters. In Figure 3a, the light spot obtained with a 3.6 mm pupil shows a poor quality. The light spot within each sub-aperture is blurred and scattered, with irregular shapes. The light intensity across the image is uneven, with brighter patches in the middle area compared to the outer area. Moreover, there are some absent bright areas in the photograph.
Using a 2.4 mm pupil considerably enhances the quality of the light spot in photographs, as depicted in Figure 3b. Each light spot grows more consistent and brighter, and the cross-section of the light spots in Figure 3f indicates that the light intensity conforms to a normal distribution. The brightness of the light spots is uniformly spread over the image. Nevertheless, several areas on the outer edge still display uneven shapes and multiple patterns.
The light spot map acquired using a 1.8 mm pupil diameter shows finer and sharper light spot shapes, with the intensity distribution within the spots following a normal distribution. The brightness of light spots exhibits minimal fluctuation throughout the photograph. However, there are small areas where the light spots display an uneven shape.
The quality of light spots improves steadily with a 1.2 mm pupil diameter. However, the light spot’s maximum intensity is lower than others, maybe due to the reduced pupil size. The light spot on the left side of the image appears to be slightly weaker compared to the light spots in other areas. Additionally, there are artificial light spots in the image, possibly resulting from scattered light from different fundus layers.
After that, the cross-sectional gray values of a single light spot within the wavefront maps are measured with ImageJ software and shown as Figure 3e–h. The light spot obtained from a 3.6 mm pupil diameter exhibits a multimodal pattern with a large variation in the distribution of light intensity. In contrast, pupil diameters of 2.4 mm to 1.2 mm result in light spots with a unimodal pattern and a light intensity that conforms to a normal distribution. The FWHM of nine light spots within the red box at the center of the four images is measured as follows: 77.36 ± 8.95 μm for the 3.6 mm pupil diameter, 36.55 ± 8.64 μm for the 2.4 mm pupil diameter, 26.78 ± 3.25 μm for the 1.8 mm pupil diameter, and 22.86 ± 1.65 μm for the 1.2 mm pupil diameter. Additionally, the radius of the Airy disk of the lenslet array is determined to be 29.89 μm; the smaller light spot size may be due to lower light intensity.

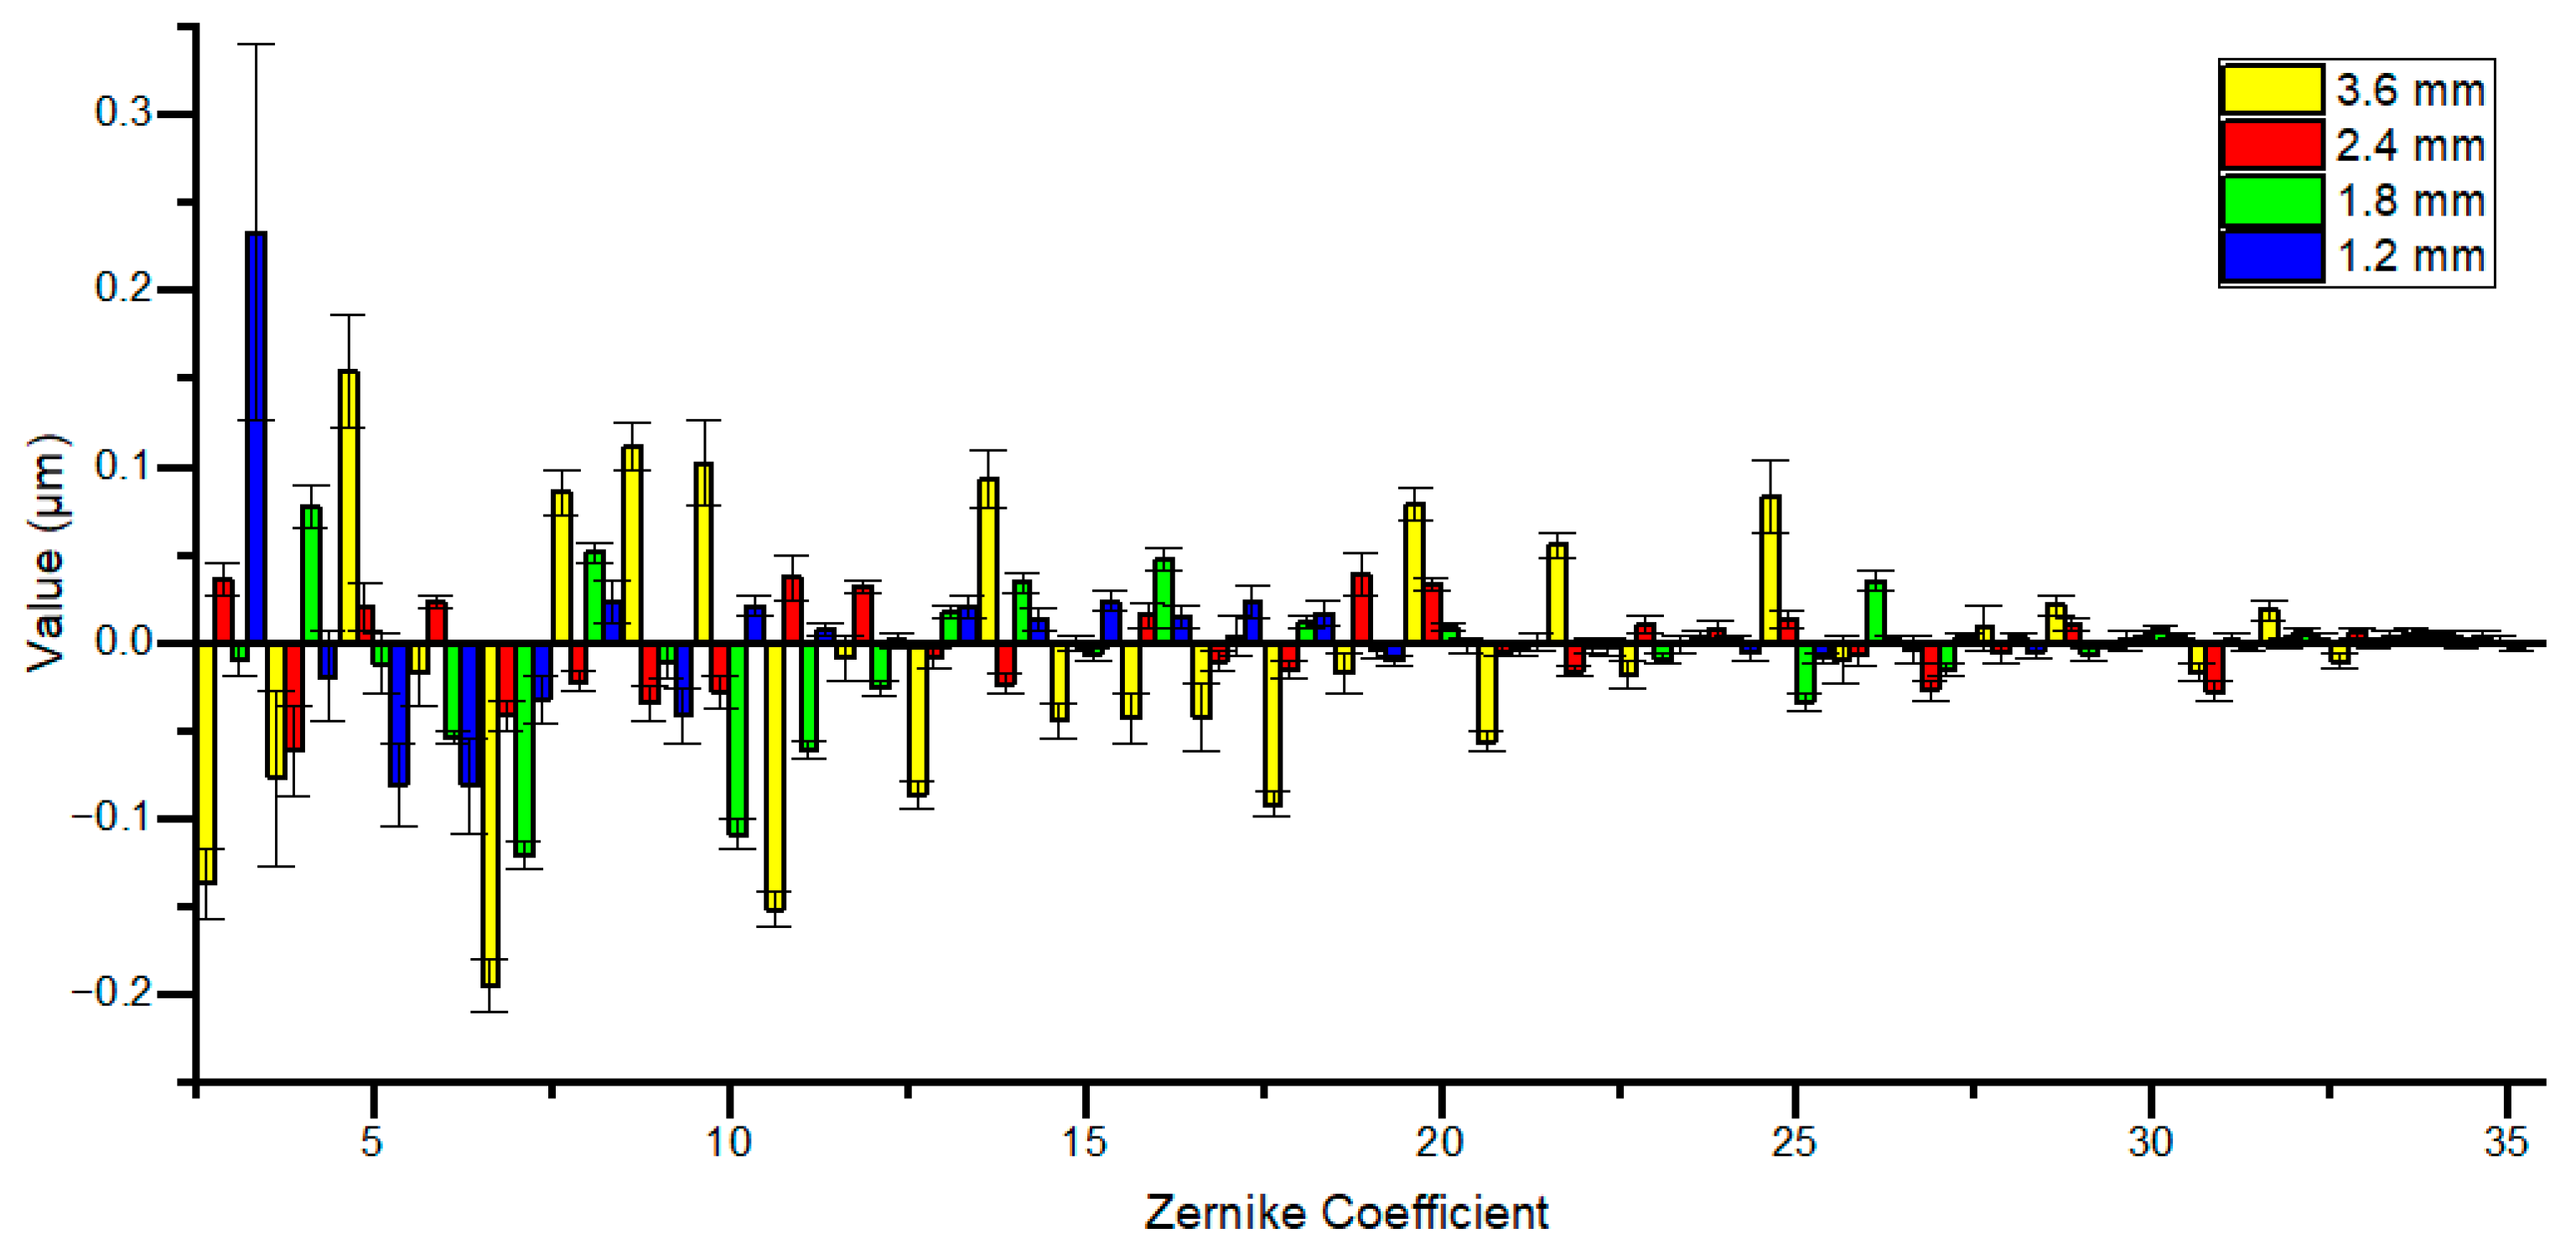
4.2. Zernike Coefficients

Figure 4 shows the Zernike coefficients calculated from the wavefront measurements, excluding piston and tilt aberrations. While the tunable lens can correct most of the defocus aberration, lower order aberrations such as defocus and astigmatism remain prevalent and are the main types of aberrations, mirroring the wavefront measurement of the human eye. Trefoil aberration and spherical aberration consistently have the greatest values among the higher order aberrations in all measurements. Aberrations are largest when measured with a 3.6 mm pupil diameter but drop dramatically in the other three measures. Overall, there is a continuous pattern of reduced aberrations as the pupil diameter decreases, although some aberrations may be slightly more pronounced with a small pupil diameter. Measurements taken with a 1.2 mm pupil diameter show higher values for lower order aberrations and significant variances in each measurement, which could be attributed to the elongated sensing spot caused by the large depth of focus, leading to substantial variability in the aberration measurement.

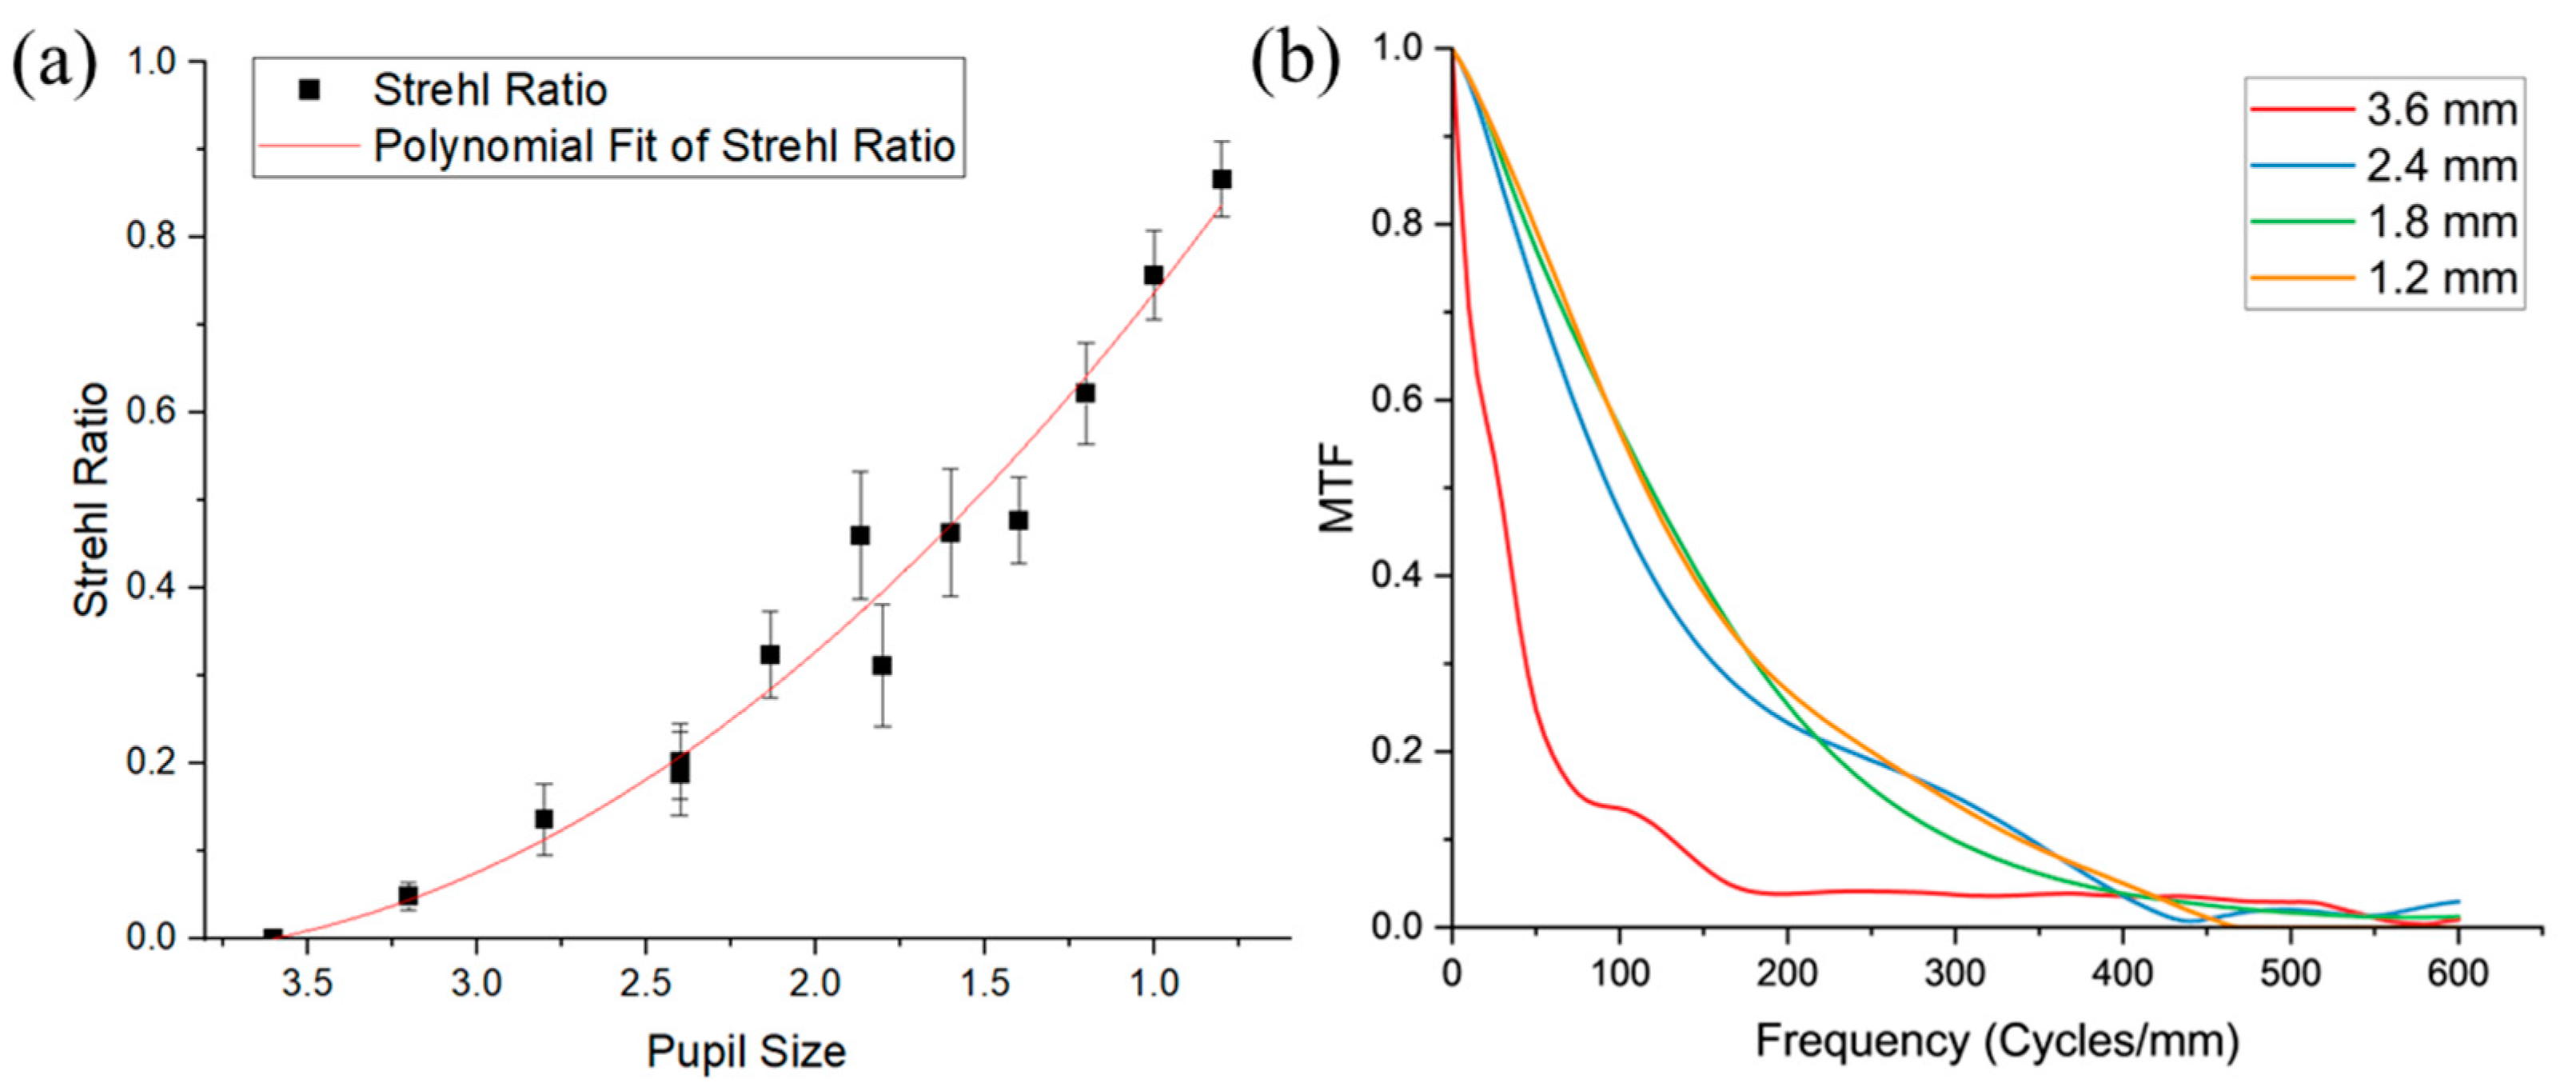
4.3. Strehl Ratio and Modulation Transfer Functions

Figure 5a shows the Strehl ratio calculated from the detected wavefront and the results for the undetected pupil obtained from the truncated wavefront map. The Strehl ratio increases as the pupil diameter decreases, and the estimated values show a good fit with a quadratic function. At a pupil diameter of 2.4 mm, there is little difference between the measured and truncated results, with values of 0.18 ± 0.047 and 0.20 ± 0.043, respectively. Although a noticeable variance is observed between the truncated and measured results at a pupil diameter of approximately 1.8 mm, the average value of these two results aligns well with the fitting result. Additionally, when the pupil diameter is reduced to 0.8 mm, the Strehl ratio is expected to exceed 0.8, which is consistent with the simulation results obtained with the rat eye model.
Figure 5b displays the calculated MTF for different pupil diameters. The 3.6 mm diameter exhibits the lowest MTF performance across all spatial frequencies, with a significant decrease in value that approaches zero for frequencies above 200 cycles/mm. For frequencies below 200 cycles/mm, the MTF value is higher for a 1.2 mm pupil compared to a 2.4 mm pupil and almost equal to a 1.8 mm pupil. As the frequency increases, the MTF value for a 1.2 mm pupil remains higher than that of a 1.8 mm pupil and nearly equal to that of a 2.4 mm pupil. When the frequency exceeds 450 cycles/mm, the MFT values for all pupil sizes are nearly identical.

5. Discussion

5.1. Simulation

According to previous studies about the optical properties of rodent animals’ eyes, the pupil diameter has a direct effect on the quality of the light spot on the retina and wavefront sensor. Therefore, we first perform a simulation to determine the trends of light spot quality as the pupil diameter varies. The simulation results indicate that a pupil-filled beacon light is unsuitable for detecting wavefronts in the rat eye due to the potential for a larger light spot size, increased dispersed light energy, and significant ocular aberrations. The spherical aberration is the most significant high-order aberration in the rat eye model, and its value is directly related to the fourth power of the pupil diameter. It can be inferred that reducing the pupil size used for wavefront detection is a straightforward and effective method to enhance the quality of the light spot. As the pupil size decreases, the light spot size becomes smaller, light energy concentrates, and aberration lowers; the eye model achieves the diffraction limit at a pupil size of 0.8 mm.
However, the pupil diameter and the depth of focus in the model eye have an inverse relationship. In the wavefront measurement of mouse eyes, the decreased pupil diameter leads to a larger depth of focus, which results in backscattered light from the retinal multilayer and artificial sensing spots on the wavefront sensor. This phenomenon may occur during the wavefront sensing process of a rat’s eye. On the other hand, a smaller pupil used for wavefront detection leads to less ocular aberration information. Determining an accurate pupil diameter from simulation data is challenging due to the presence of multilayer dispersed light, significant ocular aberration, and the depth of focus. After analyzing the simulation findings and the optical path of the system, four beacon sizes are chosen for experimental wavefront detection.

5.2. Wavefront Detection

The experimental results align with the simulation in that sensing light spots on the Shack–Hartmann wavefront sensor improve as the pupil diameter decreases. A larger pupil diameter can result in low-quality light spots, which makes it difficult to accurately identify centroids within sub-apertures of the sensor and leads to inaccuracies in calculating Zernike coefficients. When detecting with a small pupil diameter, the backscattered light from unwanted layers is minimized. This results in clear and sharp sensing light spots, with energy distribution across the light spot approaching the diffraction limit. However, the reduced pupil diameter not only enhances the quality of the light spot, but also weakens the reflected light intensity from the retina. Despite the incident light intensity remaining constant, the detected light intensity is weaker at a 1.2 mm pupil diameter, leading to a reduction in the estimation accuracy.
This study suggests that the main reason for the poor quality of the light spot in the rat eye is the presence of large ocular aberrations, especially lower order aberrations. For instance, by solely compensating for defocus aberration, the calculated Strehl ratio of the light spot improves from approximately 0.225 to 0.670 for a 2.4 mm pupil diameter and from 0.396 to 0.645 for a 1.8 mm pupil diameter. However, with a 3.6 mm pupil diameter, the Strehl ratio shows minimal improvement even with defocus aberration compensation, and when all lower order aberrations are corrected, the Strehl ratio actually decreases, which suggests that the aberrations measured with a 3.6 mm pupil diameter may be incorrect.
It is observed that the aberration decreases as the pupil diameter decreases. However, the increased depth of focus simultaneously leads to the creation of an artificial light spot on the sensor. Shown as a wavefront map obtained with a 1.2 mm pupil diameter, the increased depth of focus leads to multiple back reflections from the optically thick rat retina, which may cause incorrect centroid detection within sub-apertures of SHWS, contributing to the large low-order aberration value and significant variance in measurements. In addition, the MTF value for the 1.2 mm pupil is supposed to be larger than others at low frequencies, but the computed result is practically the same as that for the 1.8 mm pupil, which may be owing to the poor wavefront sensing spot intensity.
The use of a half-filled pupil for wavefront detection in rats is a more favorable choice compared with other tested pupil diameters, providing a high-quality sensing light spot and sufficient aberration information for accurate wavefront detection and high-resolution retinal imaging.

5.3. Comparison of Wavefront Measurement for the Human, Mouse, and Rat Eye

Wavefront measurement for the human eye was introduced into ophthalmoscopy decades ago, and has been widely used in high-resolution retinal imaging [5,6,7,8]. In wavefront detection of the human eye, a large-diameter beacon light is used to reduce the depth of focus for higher axial resolution and to focus on the retinal layer of interest [9]. But in some commercial instruments, a small-diameter light beam is typically used so that the light spots on the wavefront sensor are less susceptible to focus and aberration artifacts on the first surface of the eye [28]. For wavefront sensing in the mouse eye, the pupil-filling beacon light is used to reduce the depth of focus to avoid backscatter from multiple retinal layers.
Referring to the wavefront detection of the human and mouse eye, we carry out simulations and experiments of wavefront detection in the rat eye. The results show that a small-diameter beacon light provides a high-quality sensing light spot and accurate wavefront estimation. However, the high dioptric power of the rat lens prevents wavefront sensing with too small a beacon size due to the large depth of focus and backscattered light. By choosing a proper sensing beam size, it is possible to detect and compensate the aberrations in the rat eye for high resolution retinal imaging. The numerical aperture of a dilated rat eye is about 2.5 times that of the human eye, and the resolution of rat retinal imaging is higher than that of the human eye in theory, which is sufficient for observing fine structures in the retina, analyzing pathological and physiological features at the early stage of disease, or finding the mechanism of treatment.

6. Conclusions

To achieve high-quality wavefront sensing and accurate wavefront estimation in the rat eye, our research involved simulations and experiments to investigate the trends in sensing light spots. The simulation results indicate that a smaller pupil diameter leads to improved light spot quality. The experiments agree with the simulating results that detecting with a smaller pupil diameter is a successful strategy for enhancing the quality of the light spot and accurately assessing wavefront aberrations. However, when the pupil size became too small, the detected aberrations exhibited large low-order aberration values and significant differences between measurements, which could be attributed to the multilayer structure of the rat eye and the large depth of field associated with the small pupil size. Therefore, adopting a half-filled detecting pupil can provide effective wavefront detection for the rat eye, enabling high-resolution retinal imaging and the continuous observation of disease progression or treatment efficacy.

Author Contributions

Conceptualization, W.K. and Y.H.; methodology, W.K. and Y.H.; software, J.H. and W.K.; validation, W.K. and J.H.; formal analysis, W.K.; investigation, W.K.; resources, W.K.; data curation, W.K. and J.H.; writing—original draft preparation, W.K.; writing—review and editing, Y.H.; visualization, W.K. and J.H.; supervision, Y.H. and G.S.; project administration, Y.H. and G.S; funding acquisition, Y.H. and G.S. All authors have read and agreed to the published version of the manuscript.

Funding

This work is supported by the National Key R&D Program of China under Grant No. 2021YFF0700700; the National Natural Science Foundation of China under Grant No. 62075235; the Youth Innovation Promotion Association of the Chinese Academy of Sciences under Grant No. 2019320; the Jiangsu Provincial Key Research and Development Program under Grant No. BE2019682; and the Innovation of scientific research Strategic Priority Research Program of the Chinese Academy of Sciences under Grant No. XDA15021304.

Institutional Review Board Statement

All procedures involving animal handling strictly adhere to the guidelines set forth by the ARVO Statement for the Use of Animals in Ophthalmic and Vision Research. Ethical approval for the study was obtained from the Animal Ethics Committee of Suzhou Institute of Biomedical Engineering and Technology.

Informed Consent Statement

Not applicable.

Data Availability Statement

The data presented in this study are available on request from the corresponding author.

Acknowledgments

The authors would like to thank Yun Yuan, Xiaomei Liu, Mingdi Bao, Yiwei Chen, Jianwen Yang, and Zhe’an Zhu for fruitful discussions and technological support.

Conflicts of Interest

The authors declare no conflicts of interest.

References

  1. Garcia-Valenzuela, E.; Shareef, S.; Walsh, J.; Sharma, S.C. Programmed Cell Death of Retinal Ganglion Cells during Experimental Glaucoma. Exp. Eye Res. 1995, 61, 33–44. [Google Scholar] [CrossRef] [PubMed]
  2. Medeiros, F.A.; Zangwill, L.M.; Bowd, C.; Vessani, R.M.; Susanna, R.; Weinreb, R.N. Evaluation of Retinal Nerve Fiber Layer, Optic Nerve Head, and Macular Thickness Measurements for Glaucoma Detection Using Optical Coherence Tomography. Am. J. Ophthalmol. 2005, 139, 44–55. [Google Scholar] [CrossRef] [PubMed]
  3. Berisha, F.; Feke, G.T.; Trempe, C.L.; McMeel, J.W.; Schepens, C.L. Retinal Abnormalities in Early Alzheimer’s Disease. Investig. Ophthalmol. Vis. Sci. 2007, 48, 2285. [Google Scholar] [CrossRef] [PubMed]
  4. Safi, H.; Safi, S.; Hafezi-Moghadam, A.; Ahmadieh, H. Early Detection of Diabetic Retinopathy. Surv. Ophthalmol. 2018, 63, 601–608. [Google Scholar] [CrossRef] [PubMed]
  5. Roorda, A. Applications of Adaptive Optics Scanning Laser Ophthalmoscopy. Optom. Vis. Sci. 2010, 87, 260–268. [Google Scholar] [CrossRef] [PubMed]
  6. Williams, D.R. Imaging Single Cells in the Living Retina. Vis. Res. 2011, 51, 1379–1396. [Google Scholar] [CrossRef] [PubMed]
  7. Roorda, A.; Duncan, J.L. Adaptive Optics Ophthalmoscopy. Annu. Rev. Vis. Sci. 2015, 1, 19–50. [Google Scholar] [CrossRef] [PubMed]
  8. Burns, S.A.; Elsner, A.E.; Sapoznik, K.A.; Warner, R.L.; Gast, T.J. Adaptive Optics Imaging of the Human Retina. Prog. Retin. Eye Res. 2019, 68, 1–30. [Google Scholar] [CrossRef] [PubMed]
  9. Akyol, E.; Hagag, A.M.; Sivaprasad, S.; Lotery, A.J. Adaptive Optics: Principles and Applications in Ophthalmology. Eye 2021, 35, 244–264. [Google Scholar] [CrossRef]
  10. Vorontsov, M.; Shmalgauzen, V. The Principles of Adaptive Optics; Moscow Izdatel Nauka: Moscow, Russia, 1985. [Google Scholar]
  11. He, Y.; Bao, M.; Chen, Y.; Ye, H.; Fan, J.; Shi, G. Accuracy Characterization of Shack–Hartmann Sensor with Residual Error Removal in Spherical Wavefront Calibration. Light Adv. Manuf. 2023, 4, 393–403. [Google Scholar] [CrossRef]
  12. Lu, J.; Li, H.; He, Y.; Shi, G.; Zhang, Y. Superresolution in Adaptive Optics Confocal Scanning Laser Ophthalmoscope. Acta Phys. Sin. 2011, 60, 34207. [Google Scholar] [CrossRef]
  13. Atas, M.C.D.; Landicho, L.M.T.; Lobo, A.D.; Orubia, C.J.L.; Silverio, A.C.O.; Aquino, A.U.; Amado, T.M.; Puno, J.C.V.; Quijano, J.F.C.; Arago, N.M. Development of Wavefront Sensor Using Shack-Hartmann Principle. In Proceedings of the 2019 IEEE 11th International Conference on Humanoid, Nanotechnology, Information Technology, Communication and Control, Environment, and Management (HNICEM), Laoag, Philippines, 29 November–1 December 2019; IEEE: Toulouse, France; pp. 1–5. [Google Scholar] [CrossRef]
  14. Liu, L.; Wu, Z.; Qi, M.; Li, Y.; Zhang, M.; Liao, D.; Gao, P. Application of Adaptive Optics in Ophthalmology. Photonics 2022, 9, 288. [Google Scholar] [CrossRef]
  15. Bird, M.; Kisilak, M.; Campbell, M. Optical Quality of the Rat Eye. Investig. Ophthalmol. Vis. Sci. 2007, 48, 2759. [Google Scholar]
  16. Zhou, X.; Bedggood, P.; Metha, A. Limitations to Adaptive Optics Image Quality in Rodent Eyes. Biomed. Opt. Express 2012, 3, 1811. [Google Scholar] [CrossRef] [PubMed]
  17. Geng, Y.; Greenberg, K.P.; Wolfe, R.; Gray, D.C.; Hunter, J.J.; Dubra, A.; Flannery, J.G.; Williams, D.R.; Porter, J. In Vivo Imaging of Microscopic Structures in the Rat Retina. Investig. Ophthalmol. Vis. Sci. 2009, 50, 5872. [Google Scholar] [CrossRef] [PubMed]
  18. Andrews, I. Wavefront Assessment and Correction of the Rat Eye for Two Photon Excitation Therapies. Master’s Thesis, University of Waterloo, Waterloo, ON, Canada, 2016. [Google Scholar]
  19. Jian, Y.; Xu, J.; Gradowski, M.A.; Bonora, S.; Zawadzki, R.J.; Sarunic, M.V. Wavefront Sensorless Adaptive Optics Optical Coherence Tomography for in Vivo Retinal Imaging in Mice. Biomed. Opt. Express 2014, 5, 547. [Google Scholar] [CrossRef] [PubMed]
  20. Wahl, D.J.; Jian, Y.; Bonora, S.; Zawadzki, R.J.; Sarunic, M.V. Wavefront Sensorless Adaptive Optics Fluorescence Biomicroscope for in Vivo Retinal Imaging in Mice. Biomed. Opt. Express 2016, 7, 1–12. [Google Scholar] [CrossRef] [PubMed]
  21. Jayabalan, G.S.; Wu, Y.-K.; Bille, J.F.; Kim, S.; Mao, X.W.; Gimbel, H.V.; Rauser, M.E.; Fan, J.T. In Vivo Two-Photon Imaging of Retina in Rabbits and Rats. Exp. Eye Res. 2018, 166, 40–48. [Google Scholar] [CrossRef] [PubMed]
  22. Glickstein, M.; Millodot, M. Retinoscopy and Eye Size. Science 1970, 168, 605–606. [Google Scholar] [CrossRef] [PubMed]
  23. Geng, Y.; Schery, L.A.; Sharma, R.; Dubra, A.; Ahmad, K.; Libby, R.T.; Williams, D.R. Optical Properties of the Mouse Eye. Biomed. Opt. Express 2011, 2, 717. [Google Scholar] [CrossRef]
  24. Chaudhuri, A.; Hallett, P.E.; Parker, J.A. Aspheric Curvatures, Refractive Indices and Chromatic Aberration for the Rat Eye. Vis. Res. 1983, 23, 1351–1363. [Google Scholar] [CrossRef] [PubMed]
  25. Campbell, M.C.W.; Hughes, A. An Analytic, Gradient Index Schematic Lens and Eye for the Rat Which Predicts Aberrations for Finite Pupils. Vis. Res. 1981, 21, 1129–1148. [Google Scholar] [CrossRef] [PubMed]
  26. Delori, F.C.; Webb, R.H.; Sliney, D.H. Maximum Permissible Exposures for Ocular Safety (ANSI 2000), with Emphasis on Ophthalmic Devices. J. Opt. Soc. Am. A 2007, 24, 1250. [Google Scholar] [CrossRef] [PubMed]
  27. Thibos, L.N.; Applegate, R.A.; Schwiegerling, J.T.; Webb, R. Standards for Reporting the Optical Aberrations of Eyes. J. Refract. Surg. 2002, 18, S652–S660. [Google Scholar] [CrossRef] [PubMed]
  28. Liang, J.; Grimm, B.; Goelz, S.; Bille, J.F. Objective Measurement of Wave Aberrations of the Human Eye with the Use of a Hartmann–Shack Wave-Front Sensor. J. Opt. Soc. Am. A 1994, 11, 1949. [Google Scholar] [CrossRef]
Figure 1. (a) Black solid line with black square dot: RMS radius of the light spot. Black solid line with black triangular dot: Airy disk radius of the light spot; its value refers to the black axis on the left. Red solid line with black square dot: encircled energy around the light spot; its value refers to the red axis on the right. (b) The calculated RMS wavefront error as the pupil diameter changes. The pupil diameter value from 0 to 1.0 mm is enlarged in the red box.
Photonics 11 00359 g001
Figure 2. Schematic of the wavefront sensing system. LD: semiconductor laser diode; RC: reflective collimator; BS: beam splitter; SM: spherical mirror; FM: fold mirror; SC: scanning mirrors, TL: tunable lens. Different detecting pupil size is generated with different spherical mirror pairs.
Photonics 11 00359 g002
Figure 3. Figures (ad) depict representative images of the sensing light spot on the Shack–Hartmann wavefront sensor with different pupil diameters: 3.6 mm, 2.4 mm, 1.8 mm, and 1.2 mm. Figures (eh) display the cross-sectional gray value of a single light spot. These images are captured with refractive error compensation. The average full width at half maximum (FWHM) of the light spot within the red box is calculated for analysis.
Photonics 11 00359 g003
Figure 4. Values of 3rd to 35th Zernike coefficient with different pupil diameters.
Photonics 11 00359 g004
Figure 5. (a) Calculated Strehl ratio and (b) MTF from detected wavefront.
Photonics 11 00359 g005
Table 1. Parameters of the schematic rat eye.
Surfacen (@735 nm)Radius of Curvature (mm)Thickness (mm)Conic Constant
Ant cornea −2.965 0.796
1.3776 0.26
Post cornea −2.705 0.407
1.3303 0.62
Ant lens −2.34 0.181
Core lens1.486 (n0 in Equation (1)) 3.71
Post lens 2.34 0.268
1.3302 1.39
ILM 3.624
0.17
OLM1.33023.624
GRIN: gradient index; ILM: inner limiting membrane; OLM: outer limiting membrane.
Disclaimer/Publisher’s Note: The statements, opinions and data contained in all publications are solely those of the individual author(s) and contributor(s) and not of MDPI and/or the editor(s). MDPI and/or the editor(s) disclaim responsibility for any injury to people or property resulting from any ideas, methods, instructions or products referred to in the content.

