Article

Agreement on Anterior Chamber Depth Measurement between Three Commercially Available Devices

by
Veronica Noya-Padin
1,2,*,
Hugo Pena-Verdeal
1,2,*,
Jacobo Garcia-Queiruga
1,2,
Irene Sampedro-Mariño
1,
Maria Jesus Giraldez
1,2 and
Eva Yebra-Pimentel
1,2
1
Applied Physics Department (Optometry Area), Facultade de Óptica e Optometría, Universidade de Santiago de Compostela, 15705 Santiago de Compostela, Spain
2
Optometry Group, Instituto de Investigación Sanitaria Santiago de Compostela (IDIS), 15706 Santiago de Compostela, Spain
*
Authors to whom correspondence should be addressed.
Photonics 2024, 11(4), 377; https://doi.org/10.3390/photonics11040377
Submission received: 6 March 2024 / Revised: 24 March 2024 / Accepted: 15 April 2024 / Published: 17 April 2024
(This article belongs to the Special Issue Latest Developments in Ocular Biometry)

Abstract

:
The present study aimed to assess the agreement of three commercially available devices on the measurement of anterior chamber depth (ACD) with and without compensation by central corneal thickness measurement (CCT). Fifty eyes were included in an observational cross-sectional study. Participants underwent a single visit during which devices were used to obtain the inclusion/exclusion (ARK510A, Canon TX-10) and studied (VX-120, Lenstar LS900 and EchoScan US-800) parameters. Based on invasiveness, tests were always performed in the same order by one researcher (to avoid inter-observer variability) and only in the right eye (to avoid overstating the precision of estimates) in each participant. The keratometry, autorefraction, intraocular pressure and anterior chamber angle values were used as inclusion criteria, while the CCT and ACD values were used in the agreement analysis between devices. There was a general and a paired difference in ACD measurements between devices (Greenhouse–Geisser: p ≤ 0.001; Sidak: all p ≤ 0.001). No significant difference was found in ACD measurements compensated by CCT values between the devices (Greenhouse–Geisser: p = 0.200). Pairwise analysis showed a significant difference in VX-120 vs. Lenstar (Sidak: p = 0.021). The differences in ACD measurements compensated by CCT values between the devices were clinically acceptable. Consequently, using these instruments interchangeably in daily routines based on this correction is justified.

1. Introduction

Anterior chamber depth (ACD) refers to the distance between the corneal epithelium and the anterior capsule surface of the crystalline lens, whereas anterior aqueous depth (AQD) refers to the distance between the corneal endothelium and the anterior capsule surface of the crystalline lens [1,2]. The precise quantification of these parameters provides a tool for the early diagnosis and monitoring of exogenous and endogenous ocular disorders, accurate intraocular lens power calculations or ocular surgery [3,4,5,6,7]. ACD measured by ultrasonic biometry has even been proposed as one parameter to differentiate primary angle closure disease patients from control patients [3]. Moreover, a shallow ACD has been established to be critically associated with intraoperative complications of cataract surgery and poor clinical outcomes [4]. Thus, a routine assessment of the ACD should be a part of an eye examination.
Ocular biometric values can be acquired through various methods, either by classical techniques such as Ultrasound A or using emerging technologies such as optical low-coherence reflectometry and partial coherence interferometry. The use of devices based on the Ultrasound A principle has been classically proposed as the gold standard for the routine assessment of ocular biometric parameters [8,9]. Nevertheless, its use in ophthalmic practice is limited by several drawbacks, including direct contact, experience dependence and even the possibility of ocular indentation [10]; in fact, previous reports have suggested that immersion technique principles should be used instead of direct contact techniques [11]. To overcome the aforementioned disadvantages, new technologies have been introduced on the market, such as optical low-coherence reflectometry, partial coherence interferometry and the use of Scheimpflug cameras in the assessment of anterior eye structures [12,13,14,15]. These technologies have been widely employed in clinical settings due to the accuracy achieved, the non-contact protocols and the lower dependence on experience, even replacing Ultrasound A with optical biometry as the gold standard in the actual market [13].
The differences in the precision of devices and their comparison are still a hot topics of research in the daily clinic [16,17,18,19,20]. Recognizing the challenges associated with device interchangeability is crucial, as it informs clinicians about potential discrepancies in the measurements obtained from different devices. Furthermore, on many occasions, even though the devices indicate that ACD is measured, they do not specify whether they might be referring to the AQD and require compensation through the measurement of the distance between the corneal endothelium and epithelium for an exact measurement. To date, A-scan ultrasound devices such as the EchoScan US-800 have been the standard technique for measuring ocular biometric parameters for decades, whereas, in recent years, optical devices such as the Lenstar LS900 or those based on Scheimpflug cameras, such as the VX-120 multi-diagnostic platform, have begun to gain relevance, especially for use in children [21,22,23,24]. Lenstar LS900 studies have shown both reproducibility and repeatability in previous studies [25,26,27,28], but no previous studies have assessed whether their measurements were influenced by the issue regarding ACD and AQD differences. In daily clinical practice, it is fundamental to understand the corrections and limitations affecting the accuracy of the employed underlying physical measurement principles. The present study aimed to assess the agreement on ACD measurements of three commercially available devices, both with and without compensation by measuring the central corneal thickness (CCT): the VX-120 multi-diagnostic platform, the Biometer Lenstar LS900 and the Biometer EchoScan US-800.

2. Materials and Methods

2.1. Study Design

In an observational cross-sectional prospective design, an initial group of 50 volunteer participants who fulfilled this study’s inclusion criteria were recruited from subjects attending the Optometry Clinic of the centre. Initially, all participants presented at the centre for routine assessment conducted by qualified clinicians. Subsequently, following the completion of the assessment, they were approached and offered the opportunity to participate in the study voluntarily. Those individuals who indicated willingness to participate were subsequently scheduled for a single visit (study visit), during which the researchers both verified their eligibility based on the predefined inclusion and exclusion criteria delineated in the study protocol and performed the measurement of the studied parameter values. Participants were excluded if they had a history of conjunctival, scleral or corneal disease, a dry eye disease diagnosis, glaucoma, a history of ocular surgery and/or diabetes mellitus, thyroid disorders, hypersensitivity or an allergy to anaesthesia, and/or systemic disorders that could affect the measurements [27,29,30]. From the initial recruited group, participants were included in the analysis if their refractive spherical error was between +4.00 and −10.00 D with a cylindrical error equal to or lower than −3.00 D [16,27], keratometry readings in both the flatter and steeper meridian equal to or less than 47.2 D [31], an intraocular pressure (IOP) equal to or lower than 21 mmHg [32,33,34] and an anterior chamber angle (ACA), both nasal and temporal, equal to or higher than 30° [5,35]. No participants were undergoing topical or systemic treatment or utilizing artificial tears at the time of the study.
Once volunteers were recruited based on the inclusion criteria, participants were scheduled for a single visit (study visit) where the following devices were used to obtain the inclusion and studied parameter values: an ARK510A, a Canon TX-10 tonometer, a VX-120 multi-diagnostic platform, an LS900 Lenstar Biometer and an EchoScan US-800. Tests were always performed in the same order: from the least to the most invasive [10]. In all cases, measurements were performed by a researcher with previous clinical experience in the operation of all devices utilized in this study, and only in the right eye of each participant, in order to minimize inter-observer variations and/or alterations in the precision of the statistical estimates [10,16,36].
Informed consent was obtained from all participants included in the study. The study protocol adhered to the tenets of the Declaration of Helsinki and was approved by the institutional Ethics Committee of the university (approval number: USC 04/2022).

2.2. ARK510A Autorefractor–Keratometer

An ARK510A (Nidek Technologies, Padova, Italy) was used to measure the refractive error and the keratometry values [37]. Both keratometry and autorefraction were performed three times and the values were averaged. To mitigate potential misalignment from the target area during the measurements, the ARK510A employs a proactive approach where numbers are displayed in yellow if the measurements are not considered accurate by the device, signalling the need for repeated measurements until three measurements are deemed adequate by the system. The refractive and keratometry values obtained were used to determine if subjects were compliant with the inclusion criteria.

2.3. Canon TX-10 Tonometer

A Canon TX-10 noncontact tonometer (Canon Inc., Tokyo, Japan) was used to obtain the IOP values [38]. Non-contact tonometry was conducted by assessing the corneal deformation during air pulse application. On each participant, the device measurements were performed three times, and the values were automatically averaged by the device. The Canon TX-10 employs a proactive approach where numbers are displayed in red or yellow if there is a disparity in the results, signalling the need for repeated measurements until three consecutive measurements are deemed adequate by the system. The IOP values obtained were employed to assess participants’ adherence to the inclusion criteria.

2.4. VX-120 Multi-Diagnostic Platform

The VX-120 multi-diagnostic platform (Visionix Luneau Technologies, Pont-de-l’Arche, France), based on the Scheimpflug principle, was used to obtain both nasal and temporal ACA, ACD and CCT values [27,28]. Measurements were performed automatically by the device once the measurement protocol was configured and set. To address potential misalignment during the measurements, the VX-120 device employs an XYZ mechanism for precise correction. This mechanism automatically adjusts the positioning of the device to ensure accurate alignment with the target area. The ACA results were employed to assess participants’ adherence to the inclusion criteria. The CCT and ACD values obtained were used in the agreement analysis between devices.

2.5. Lenstar LS900 Ocular Biometer

A Lenstar LS900 (Haag-Streit, Köniz, Switzerland), based on optical low-coherence reflectometry, was used to obtain the CCT and ACD values [16,39,40,41]. In all measurements, the instrument was set automatically; once the operator started the measurement, the device automatically averaged three consecutive measurements. To mitigate potential misalignment from the target area during measurements, the Lenstar LS900 employs a proactive approach where a yellow caution triangle is displayed if there is a disparity in the results, signalling the need for repeated measurements until three consecutive measurements are deemed adequate by the system. The CCT and ACD values obtained were used in the agreement analysis between devices.

2.6. EchoScan US-800 Ocular Biometer

Based on the Ultrasound A principle, a US-800 biometry NIDEK EchoScan Ultrasound Model (Nidek Co., Tokyo, Japan) was used to obtain the ACD [8,9,40,41]; this device does not provide the CCT value as an independent parameter from the ACD. The device was used in contact mode, taking care to prevent cornea indentation. Participants were instructed to focus on the beam of the probe to ensure fixation. In all measurements, the instrument was set to automatic mode; the device averages the three best consecutive measurements to avoid the data being affected by eye movement and/or misalignments of the probe from the target area. The ACD values obtained were used in the agreement analysis between devices.

2.7. Statistical Analysis

SPSS statistical software v. 25.0 for Windows (IBM Corp, released 2017, Armonk, NY, USA) was used for data analyses. A p ≤ 0.05 was set as the level of significance for all the analyses. Previous to the analyses, the normality of the distribution of the values obtained was checked using the Shapiro–Wilk test [42]; all parameters showed a normal distribution (Shapiro–Wilk, all parameters p ≥ 0.326). Differences among the ACDs and the sum of ACD and CCT data were assessed by ANOVA for repeated measurement principles, while the Sidak test was used to detect significant pairwise differences [42,43,44]. ANOVA for repeated measurements was calculated based on Mauchly’s W test, a statistical test used to assess the sphericity assumption. In cases where sphericity was violated (p ≤ 0.05), the Greenhouse–Geisser or Huynh–Feldt correction was applied based on the departure from sphericity, represented by epsilon (ε), to adjust the degrees of freedom and control for potential Type I error inflation [43,44,45].
Agreement between devices was calculated based on Bland–Altman procedures. This method outlines the correlation or similarity between two devices, showcasing comparisons of averages versus differences [42,46]. The 95% limits of agreement (95% LoA) were calculated (mean difference ± 1.96 × standard deviation (SD)), as well as the exact 95% confidence intervals (95% CI) for upper and lower LoA, considered as a pair (mean difference ± ct0.025 × SD; mean difference ± ct0.975 × SD) [42,47]. The correlation between means and differences was calculated by the Pearson correlation test. The correlation between variables was categorized as weak (0.21–0.40), moderate (0.41–0.60), substantial (0.61–0.80) or strong (0.81–1.00).

3. Results

From the initially recruited participants, two participants were excluded for not accomplishing the inclusion criteria (one participant showed an IOP of 22.70 mmHg, while the other participant showed a keratometry value of 47.81 D). The final group was formed of 48 patients (13 women and 35 men) with a mean ± SD age of 22.2 ± 2.24 years. The descriptive statistics of the inclusion criteria (mean ± SD) were as follows: refractive spherical error = −1.13 ± 2.55 D, refractive cylindrical error = −0.62 ± 0.58 D, flatter meridian = 42.9 ± 0.32 D, steeper meridian = 43.7 ± 0.42 D, IOP = 14.9 ± 2.68 mmHg, ACA nasal = 44.2° ± 4.33° and ACA temporal = 41.5° ± 4.44°.

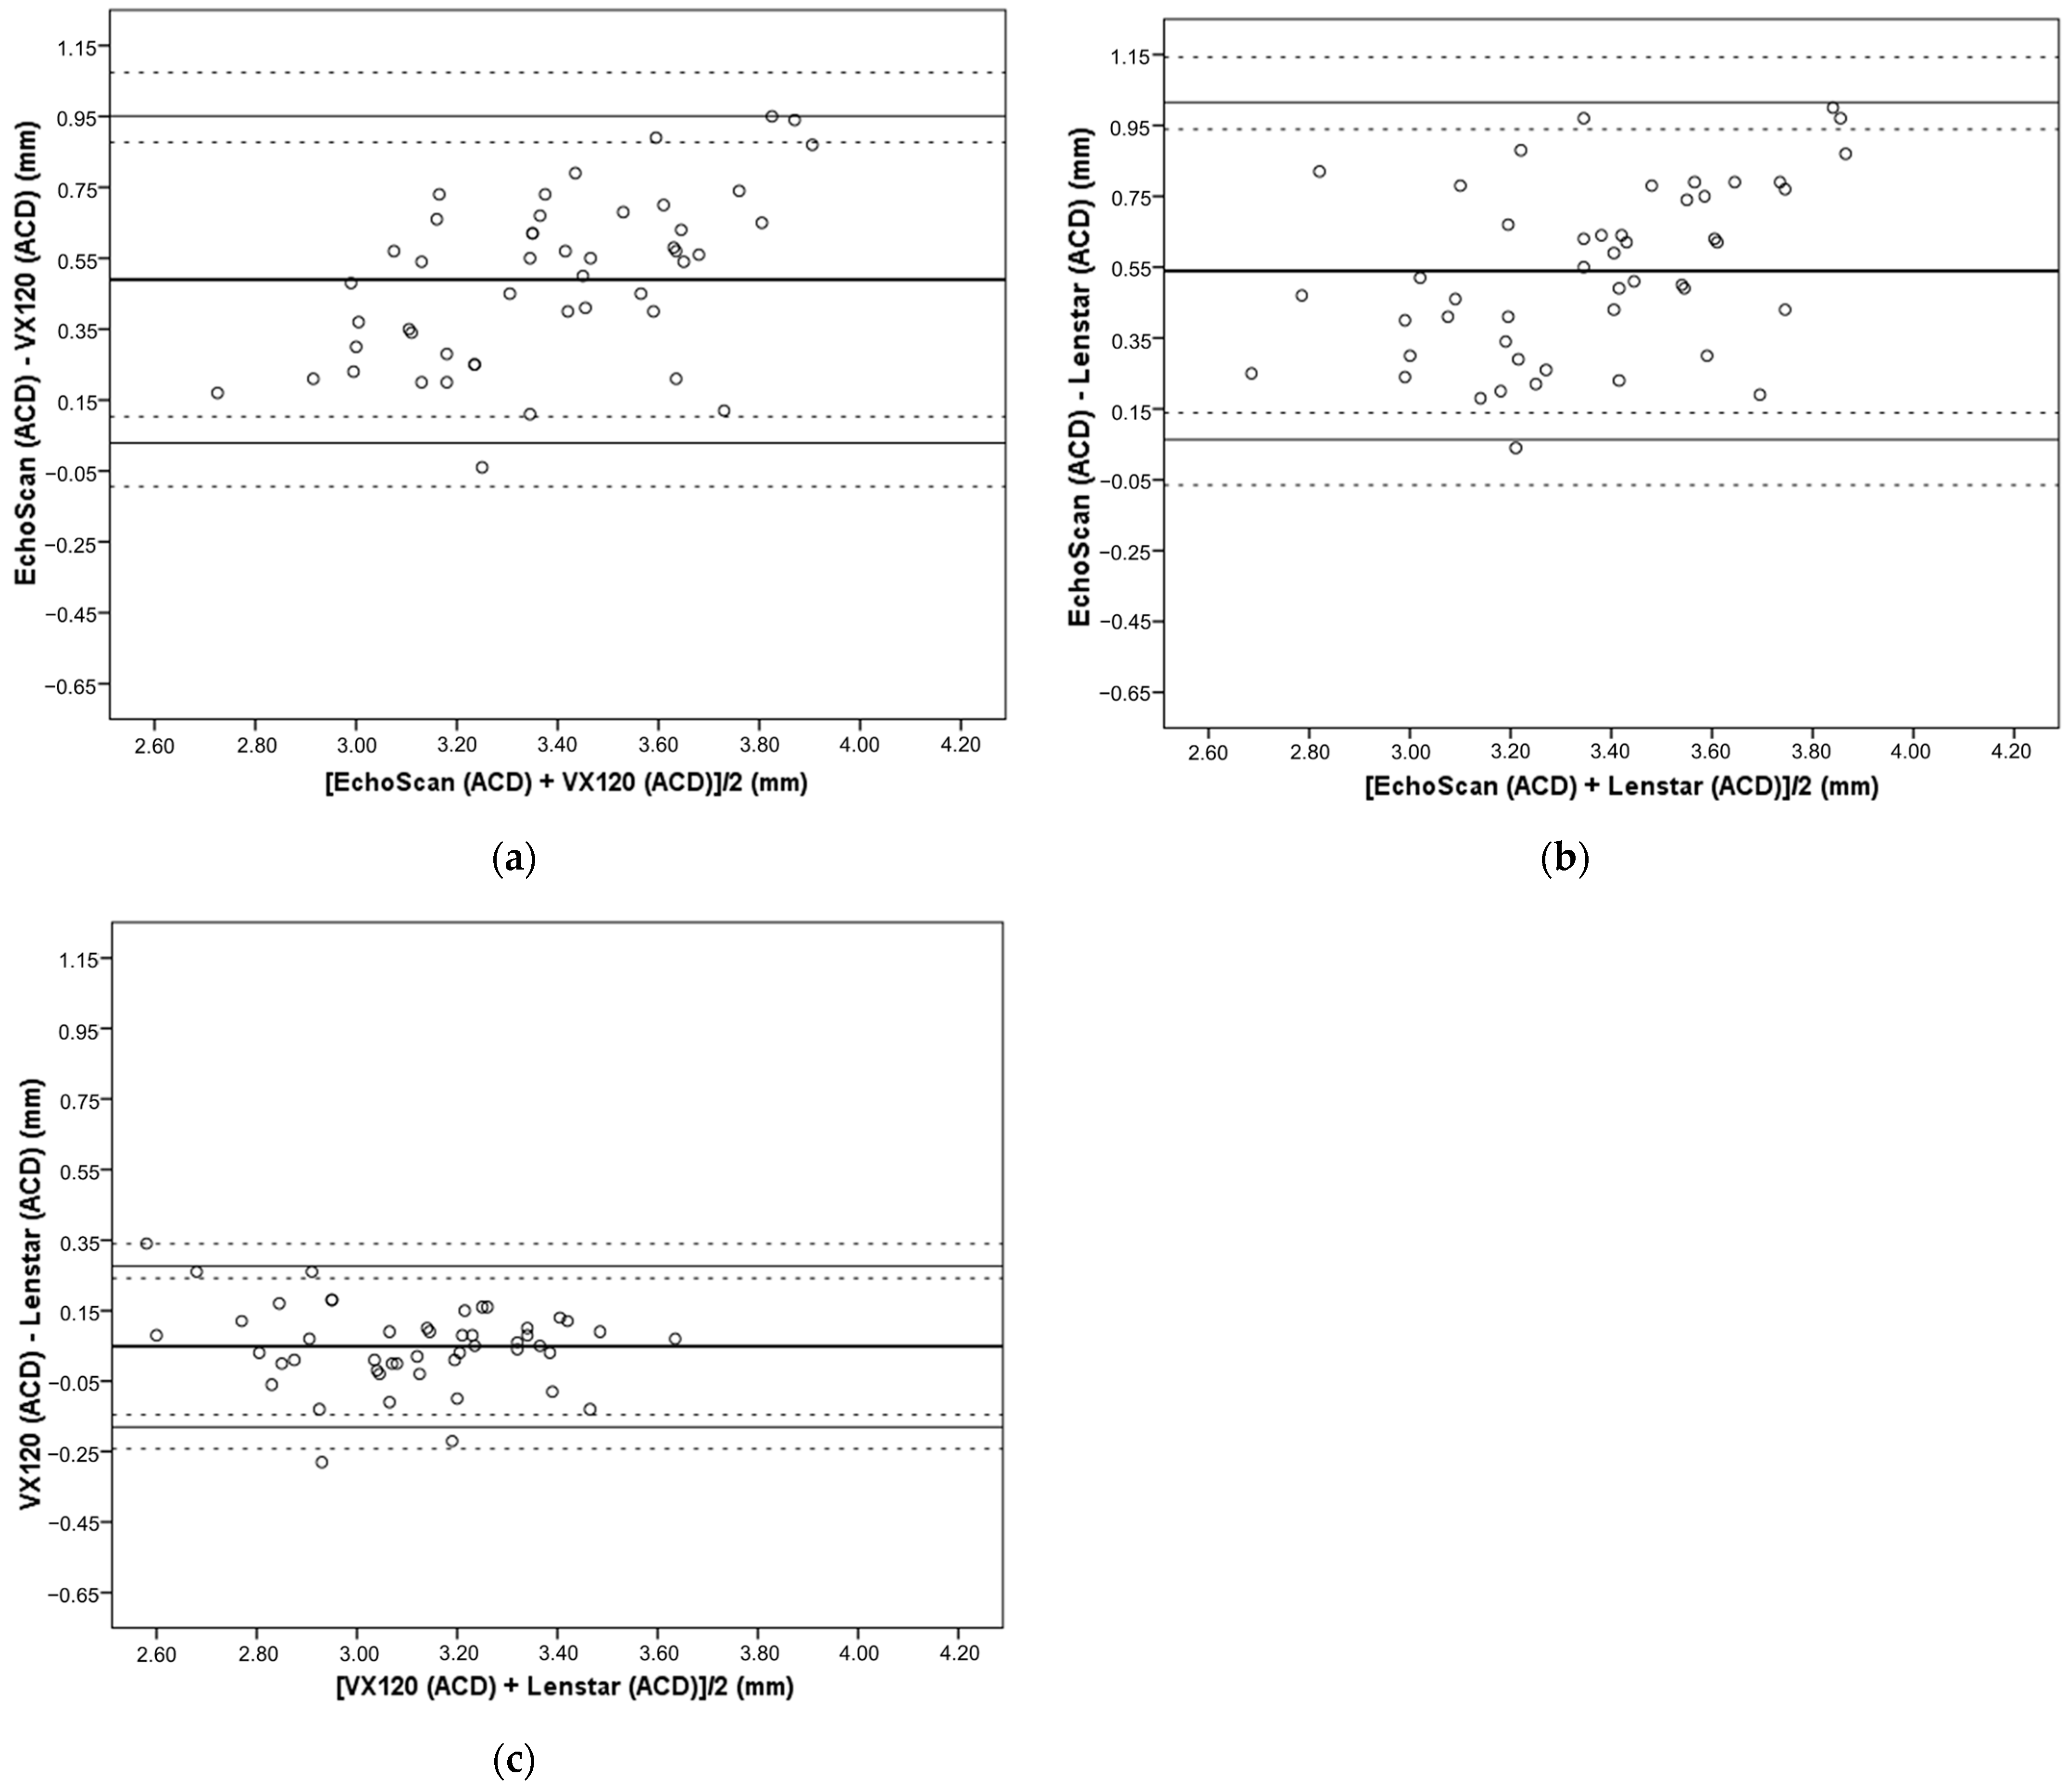
3.1. Differences in the ACD Values between Devices

There was a general significant statistical difference in the measurements of the ACD between the three studied devices (Mauchly’s W: p = 0.001, ε = 0.683; Greenhouse–Geisser correction: p < 0.001, Table 1). There was a significant statistical difference between all the comparisons performed in the pairwise analysis between devices (Sidak test: all p ≤ 0.001, Table 2).
Figure 1 illustrates a Bland–Altman plot of means versus differences between the studied devices. Higher 95% LoAs and 95% CIs were obtained for the comparisons with the EchoScan (Figure 1a,b). In addition, the graphs show that the EchoScan overestimated the measurements regarding the other two devices studied for the higher ACD values and underestimated the lower values; this trend was statistically confirmed by analysing the correlation between the means and differences between devices (EchoScan vs. VX-120, mean vs. difference: r = 0.547 p < 0.001; EchoScan vs. Lenstar, mean vs. difference: r = 0.443, p = 0.001), while no correlation between means and differences was found between the other two devices (VX-120 vs. Lenstar, mean vs. difference; p = 0.112).

3.2. Differences in ACD Compensated by CCT Values between Devices

There was a general non-significant statistical difference in the measurements of the ACD compensated by the CCT value between the three studied devices (Mauchly’s W: p = 0.001, ε = 0.692; Greenhouse–Geisser correction: p = 0.200, Table 3). In the pairwise analysis, we found a significant difference in the VX-120 vs. Lenstar (Sidak test: all p = 0.021, Table 4), while no differences were found between the EchoScan vs. the other two studied devices (Sidak test: both p ≥ 0.559, Table 4).
Figure 2 illustrates a Bland–Altman plot of means versus differences between the studied devices. A higher 95% LoA and 95% CI were obtained for the comparison with the EchoScan (Figure 2a,b). Moreover, the graphs show again that the EchoScan overestimated measurements regarding the other two devices studied for the higher ACD values and underestimated the lower values; this trend was also statistically confirmed by analysing the correlation between the means and differences between devices (EchoScan vs. VX-120, mean vs. difference: r = 0.566 p < 0.001; EchoScan vs. Lenstar, mean vs. difference: r = 0.489, p < 0.001), while no correlation between means and differences was found between the other two devices (VX-120 vs. Lenstar, mean vs. difference; p = 0.170).

4. Discussion

The differences in the precision or agreement between devices are a relevant research topic; accurate biometric results are crucial in the modern diagnosis of ectasias, myopia control or even cataract and refractive surgery for the effective management of patients. ACD quantification serves as a valuable tool for the early diagnosis of ocular disorders, as well as for precise intraocular lens power calculations and routine ocular surgeries [3,4,5,6,7], and has even recently been proposed as one of the features to be studied in myopic populations [48]. In the present study, the agreement on ACD measurements of three commercially available devices based on different measurement principles was assessed, with and without compensation by CCT measurement. The objective of this analysis was to ascertain whether these devices were measuring the ACD or whether they were indeed measuring the AQD [1,2].
Ultrasonic devices have been classically considered the gold standard or reference method in ocular biometric measurement. In the present study, the EchoScan shows poor agreement in ACD measurement with the VX-120 and the Lenstar LS900 on healthy eyes when CCT is not used as a correction value. Similar results were reported by previous studies, where ACD measurements provided by EchoScan resulted in shorter distances than measurements performed with optical methods (IOLMaster) before cataract surgery, with the results highly influenced by the operator’s experience [10]. Nevertheless, when the CCT is added to the results provided by the device in the present study, it is found to exhibit near-perfect agreement with the Lenstar LS900 and good agreement with the VX-120. This strategy could be used as a correction method for measurement with ultrasonic devices; however, the need for this correction because of the lack of CCT as an independent value using these devices is a relevant disadvantage in clinical routine assessment. It could be hypothesized that initially, this device maybe measured the AQD and not the ACD. In addition, both with and without the correction, the EchoScan US-800 showed an overestimation of the value in wide-ACD participants and underestimation of the value in narrow-ACD participants in comparison to the other devices studied.
The use of Scheimpflug technology during the analysis of the anterior eye allows the generation of images from the anterior segment in three dimensions using a non-contact method [12]. It is a relatively new method that has been rapidly spreading because of its utility in the diagnosis of anterior eye abnormalities [14]. The VX-120 is a multi-diagnostic platform device based on a static Scheimpflug camera that can acquire anterior-eye biometric parameters [27,28]. Previous studies have shown that the VX-120 system is able to provide repeatable measurements of CCT and ACD parameters in healthy eyes [27,28]. In the present agreement study, the VX-120 showed a statistically significant difference in ACD measurements when both the EchoScan and the Lenstar LS900 were used on healthy eyes when CCT was not used as a correction value, while good agreement was found with the EchoScan when the CCT was used as a compensatory value. Similar to the Lenstar LS900, it may be hypothesized that initially, this device measured the AQD and not the ACD. To the authors’ knowledge, there are no previous studies where the agreement of the VX-120 with other commercially available devices has been checked during ocular anterior parameter assessment.
Several optical ocular biometic devices based on optical low-coherence reflectometry technology have been developed in recent years, such as the Lenstar LS900 [16]. It has been reported by previous studies that the Lenstar LS900 has high reproducibility and repeatability [25,26]. In the present agreement study, the Lenstar showed statistically significant differences in ACD measurements between the EchoScan and the VX-120 on healthy eyes when CCT was not used as a correction value, while good agreement was found with the EchoScan when CCT was used as a compensatory value. Previous analyses have shown good agreement on ACD and CCT measurements between the Lenstar and the Anterion (Heidelberg, Germany), IOLMaster700 (Carl Zeiss, Oberkochen, Germany), OA-2000 (Tomey, Nagoya, Japan), AL-Scan (Nidek Co., Ltd., Tokyo, Japan) and Pentacam AXL (Oculus, Wetzlar, Germany) in healthy, cataractous post-operative eyes and even subjects who have undergone evaluation for cataract surgery [16,19,26,39,49]. On the other hand, studies have also reported differences in ACD and CCT measurements between Lenstar and OA-2000, Pentacam AXL, IOLMaster, IOLMaster700, AL-Scan, Visante AS-OC (Carl Zeiss Meditec, Dublin, CA, USA) and Revo (Optopol Technology, Zawiercie, Poland) in healthy eyes or subjects who have undergone evaluation for cataract surgery [16,17,18,19,20,25,26,39,40,49].
The strength of this study lies in its recruitment process, where participants were selected based on rigorous inclusion criteria, enhancing the internal validity of the study and ensuring homogeneity within the sample for analysis. Furthermore, the measurements were conducted by skilled researchers with prior clinical experience in utilizing the study devices. This expertise mitigates the risk of measurement errors, thereby augmenting the reliability of the collected data. Moreover, this study provides a detailed and comprehensive description of its design, measurement procedures, inclusion/exclusion criteria and outcomes, facilitating transparency and the reproducibility of the findings. Nevertheless, there are several limitations in the present study. First, only healthy subjects were recruited; therefore, the results could be limited to implementation in some pathological groups (e.g., active cataractous patients). Second, while the inclusion criteria were in general highly restrictive and only allowed us to recruit healthy eyes, the subjects included had a relatively large range of refractive error, from +4.00 to −10.00 D. Third, the present study is also limited by demographic characteristics and distributions, since the measurements were performed on 13 women and 35 men (no sex-equal distribution), with all of them originally from the same geographical region and ethnicity. Fourth, interobserver reproducibility and device repeatability were not conducted in the current study. Finally, the present study was planned to have a cross-sectional design, which allows for a statistically strong examination of associations between variables, but may limit the ability to establish causal relationships or assess longitudinal changes over time.
In summary, our results demonstrate significant variability in ACD measurements between devices, with the EchoScan exhibiting the least agreement with the other two devices. However, compensating ACD with CCT significantly improves the agreement between ultrasound and optical devices, underscoring the importance of including this parameter as a compensatory value for aligning ACD measurements. Thus, the interchangeable use of these instruments in daily clinical practice is feasible and may be possible when this correction is considered. Further research is needed to validate these findings and assess their clinical applicability, as well as to compare the performance of the Lenstar LS900 and VX-120 devices with the EchoScan US-800 in terms of patient experience, clinical workflow and cost-effectiveness with this correction.

Author Contributions

Conceptualization, V.N.-P., H.P.-V., J.G.-Q., I.S.-M. and E.Y.-P.; Data Curation, V.N.-P., H.P.-V. and J.G.-Q.; Formal Analysis, V.N.-P., H.P.-V., J.G.-Q. and I.S.-M.; Funding Acquisition, M.J.G. and E.Y.-P.; Investigation, V.N.-P., H.P.-V., J.G.-Q., I.S.-M., M.J.G. and E.Y.-P.; Methodology, V.N.-P., H.P.-V., J.G.-Q. and I.S.-M.; Project Administration, H.P.-V., M.J.G. and E.Y.-P.; Resources, H.P.-V., M.J.G. and E.Y.-P.; Software, V.N.-P. and I.S.-M.; Supervision, H.P.-V., M.J.G. and E.Y.-P.; Validation, V.N.-P.; Visualization, V.N.-P., J.G.-Q., I.S.-M., M.J.G. and E.Y.-P.; Writing—Original Draft, V.N.-P., H.P.-V. and J.G.-Q.; Writing—Review and Editing, J.G.-Q., M.J.G. and E.Y.-P. All authors have read and agreed to the published version of the manuscript.

Funding

The present study was conducted independently without receiving any specific grants or financial support from public, commercial or not-for-profit funding agencies. The authors did not have external financial assistance or sponsorships for this investigation.

Institutional Review Board Statement

This research adhered to the principles outlined in the Declaration of Helsinki and received approval from the Bioethics Committee of the Universidade de Santiago de Compostela before commencement (approval number: USC 04/2022).

Informed Consent Statement

Written informed consent was acquired from every participant engaged in this study.

Data Availability Statement

The data are unavailable due to privacy restrictions.

Conflicts of Interest

The authors declare no conflicts of interest.

References

  1. Yoo, T.K.; Ryu, I.H.; Kim, J.K.; Lee, I.S.; Kim, H.K. A deep learning approach for detection of shallow anterior chamber depth based on the hidden features of fundus photographs. Comput. Methods Programs Biomed. 2022, 219, 106735. [Google Scholar] [CrossRef]
  2. Hoffer, K.J.; Savini, G. Update on Intraocular Lens Power Calculation Study Protocols: The Better Way to Design and Report Clinical Trials. Ophthalmology 2021, 128, e115–e120. [Google Scholar] [CrossRef]
  3. Savur, S.; Kaup, S.; Dinesh, A.; Shivalli, S.; Kondal, D. Can ultrasonic biometric indices with optimal cut-offs be a potential screening tool for primary angle closure disease? A case-control study. Eye 2022, 37, 1284–1289. [Google Scholar] [CrossRef]
  4. Upasna; Singh, V.K.; Rana, J.; Kumar, S.; Singh, A.; Singh, K. An evaluation of intraoperative and postoperative outcomes of phacoemulsification surgery in eyes with shallow anterior chamber. Indian J. Ophthalmol. 2021, 69, 1346–1347. [Google Scholar] [CrossRef]
  5. Dabasia, P.L.; Edgar, D.F.; Murdoch, I.E.; Lawrenson, J.G. Noncontact Screening Methods for the Detection of Narrow Anterior Chamber Angles. Investig. Ophthalmol. Vis. Sci. 2015, 56, 3929–3935. [Google Scholar] [CrossRef]
  6. Beyoglu, A.; Karakucuk, Y.; Comez, A. Evaluation of the effect of fasting on intraocular pressure, anterior segment parameters and density of crystalline lens and cornea. Int. Ophthalmol. 2020, 40, 2987–2994. [Google Scholar] [CrossRef]
  7. Pakuliene, G.; Zimarinas, K.; Nedzelskiene, I.; Siesky, B.; Kuzmiene, L.; Harris, A.; Januleviciene, I. Anterior segment optical coherence tomography imaging and ocular biometry in cataract patients with open angle glaucoma comorbidity. BMC Ophthalmol. 2021, 21, 127. [Google Scholar] [CrossRef]
  8. Aktas, S.; Aktas, H.; Tetikoglu, M.; Sagdık, H.M.; Özcura, F.J.M. Refractive results using a new optical biometry device: Comparison with ultrasound biometry data. Medicine 2015, 94, e2169. [Google Scholar] [CrossRef]
  9. Yong, K.-L.; Gong, T.; Nongpiur, M.E.; How, A.C.; Lee, H.K.; Cheng, L.; Perera, S.A.; Aung, T.J.O. Myopia in Asian subjects with primary angle closure: Implications for glaucoma trends in East Asia. Ophthalmology 2014, 121, 1566–1571. [Google Scholar] [CrossRef]
  10. Findl, O.; Kriechbaum, K.; Sacu, S.; Kiss, B.; Polak, K.; Nepp, J.; Schild, G.; Rainer, G.; Maca, S.; Petternel, V.; et al. Influence of operator experience on the performance of ultrasound biometry compared to optical biometry before cataract surgery. J. Cataract Refract. Surg. 2003, 29, 1950–1955. [Google Scholar] [CrossRef]
  11. Cione, F.; De Bernardo, M.; Rosa, N. Comment on: Evaluation of intraoperative aphakic eye axial length measurements using swept-source OCT. J. Cataract Refract. Surg. 2022, 48, 1226–1227. [Google Scholar] [CrossRef]
  12. Kanclerz, P.; Khoramnia, R.; Wang, X. Current Developments in Corneal Topography and Tomography. Diagnostics 2021, 11, 1466. [Google Scholar] [CrossRef]
  13. Chen, Y.A.; Hirnschall, N.; Findl, O. Evaluation of 2 new optical biometry devices and comparison with the current gold standard biometer. J. Cataract Refract. Surg. 2011, 37, 513–517. [Google Scholar] [CrossRef]
  14. Vinciguerra, R.; Ambrosio, R., Jr.; Elsheikh, A.; Hafezi, F.; Yong Kang, D.S.; Kermani, O.; Koh, S.; Lu, N.; Padmanabhan, P.; Roberts, C.J.; et al. Detection of postlaser vision correction ectasia with a new combined biomechanical index. J. Cataract Refract. Surg. 2021, 47, 1314–1318. [Google Scholar] [CrossRef]
  15. De Bernardo, M.; Cione, F.; Capasso, L.; Coppola, A.; Rosa, N. A formula to improve the reliability of optical axial length measurement in IOL power calculation. Sci. Rep. 2022, 12, 18845. [Google Scholar] [CrossRef]
  16. Cheng, S.M.; Zhang, J.S.; Shao, X.; Wu, Z.T.; Li, T.T.; Wang, P.; Lin, J.H.; Yu, A.Y. Repeatability of a new swept-source optical coherence tomographer and agreement with other three optical biometers. Graefe’s Arch. Clin. Exp. Ophthalmol. = Albrecht Von Graefes Arch. Fur Klin. Und Exp. Ophthalmol. 2022, 260, 2271–2281. [Google Scholar] [CrossRef]
  17. Kurian, M.; Negalur, N.; Das, S.; Puttaiah, N.K.; Haria, D.; J, T.S.; Thakkar, M.M. Biometry with a new swept-source optical coherence tomography biometer: Repeatability and agreement with an optical low-coherence reflectometry device. J. Cataract Refract. Surg. 2016, 42, 577–581. [Google Scholar] [CrossRef]
  18. Kanclerz, P.; Hoffer, K.J.; Rozema, J.J.; Przewlocka, K.; Savini, G. Repeatability and reproducibility of optical biometry implemented in a new optical coherence tomographer and comparison with a optical low-coherence reflectometer. J. Cataract Refract. Surg. 2019, 45, 1619–1624. [Google Scholar] [CrossRef]
  19. Passi, S.F.; Thompson, A.C.; Gupta, P.K. Comparison of agreement and efficiency of a swept source-optical coherence tomography device and an optical low-coherence reflectometry device for biometry measurements during cataract evaluation. Clin. Ophthalmol. 2018, 12, 2245–2251. [Google Scholar] [CrossRef]
  20. Arriola-Villalobos, P.; Almendral-Gomez, J.; Garzon, N.; Ruiz-Medrano, J.; Fernandez-Perez, C.; Martinez-de-la-Casa, J.M.; Diaz-Valle, D. Agreement and clinical comparison between a new swept-source optical coherence tomography-based optical biometer and an optical low-coherence reflectometry biometer. Eye 2017, 31, 437–442. [Google Scholar] [CrossRef]
  21. van der Heijde, G.L.; Meinema, A.J.; Vlaming, M.S. Digital A-scan ultrasonography used to measure ocular distances. Am. J. Ophthalmol. 1977, 83, 276–277. [Google Scholar] [CrossRef]
  22. Mattern, A.I.; Neller, K.; Devenijn, M.; Schwahn, H.; Langenbucher, A.; Seitz, B.; Kaymak, H. A Comparison of Optical Biometers Used in Children for Myopia Control. Klin. Monatsblatter Fur Augenheilkd. 2023, 240, 1306–1313. [Google Scholar] [CrossRef]
  23. Yagmur Kanra, A.; Uslu, H. Evaluation of ocular biometric parameters in keratoconic eyes relative to healthy myopic eyes. Eur. J. Ophthalmol. 2021, 32, 798–805. [Google Scholar] [CrossRef]
  24. Noya-Padin, V.; Nores-Palmas, N.; Garcia-Queiruga, J.; Giraldez, M.J.; Pena Verdeal, H.; Yebra-Pimentel, E. Associations between Ocular Biometry, Refractive Error, and Body Characteristics. Photonics 2024, 11, 165. [Google Scholar] [CrossRef]
  25. Cruysberg, L.P.; Doors, M.; Verbakel, F.; Berendschot, T.T.; De Brabander, J.; Nuijts, R.M. Evaluation of the Lenstar LS 900 non-contact biometer. Br. J. Ophthalmol. 2010, 94, 106–110. [Google Scholar] [CrossRef]
  26. Guler, E.; Kulak, A.E.; Totan, Y.; Yuvarlak, A.; Hepsen, I.F. Comparison of a new optical biometry with an optical low-coherence reflectometry for ocular biometry. Contact Lens Anterior Eye J. Br. Contact Lens Assoc. 2016, 39, 336–341. [Google Scholar] [CrossRef]
  27. Pinero, D.P.; Cabezos, I.; Lopez-Navarro, A.; de Fez, D.; Caballero, M.T.; Camps, V.J. Intrasession repeatability of ocular anatomical measurements obtained with a multidiagnostic device in healthy eyes. BMC Ophthalmol. 2017, 17, 193. [Google Scholar] [CrossRef]
  28. Zhang, Q.W.; Zhai, C.B.; Ma, D.L. Comparison of corneal curvature parameters obtained from two different instruments-Pentacam and VX120. Int. J. Ophthalmol. 2019, 12, 1311–1316. [Google Scholar] [CrossRef]
  29. Ferrer-Blasco, T.; Esteve-Taboada, J.J.; Domínguez-Vicent, A.; Aloy, M.A.; Adsuara, J.E.; Mimica, P.; Montés-Micó, R. Effect of contact lenses on ocular biometric measurements based on swept-source optical coherence tomography. Arq. Bras. Oftalmol. 2019, 82, 129–135. [Google Scholar] [CrossRef]
  30. Garcia-Queiruga, J.; Pena-Verdeal, H.; Sabucedo-Villamarin, B.; Giraldez, M.J.; Garcia-Resua, C.; Yebra-Pimentel, E. A cross-sectional study of non-modifiable and modifiable risk factors of dry eye disease states. Contact Lens Anterior Eye J. Br. Contact Lens Assoc. 2023, 46, 101800. [Google Scholar] [CrossRef]
  31. Achiron, A.; Yavnieli, R.; Olshaker, H.; Levinger, E.; Tuuminen, R.; Livny, E.; Elbaz, U.; Bahar, I.; Nahum, Y. Validation of the multi-metric D-index change in the assessment of keratoconus progression. Int. Ophthalmol. 2022, 42, 2665–2671. [Google Scholar] [CrossRef] [PubMed]
  32. Munteanu, G.Z.; Munteanu, Z.V.I.; Roiu, G.; Daina, C.M.; Daina, L.G.; Coroi, M.C.; Domnariu, C.; Neculoiu, D.C.; Cotovanu, A.S.; Badau, D. Detection of Intraocular Hypertension during Opportunity Screening (Check-Up Medical Inspections). J. Pers. Med. 2022, 12, 777. [Google Scholar] [CrossRef] [PubMed]
  33. Prum, B.E., Jr.; Lim, M.C.; Mansberger, S.L.; Stein, J.D.; Moroi, S.E.; Gedde, S.J.; Herndon, L.W., Jr.; Rosenberg, L.F.; Williams, R.D. Primary Open-Angle Glaucoma Suspect Preferred Practice Pattern((R)) Guidelines. Ophthalmology 2016, 123, P112–P151. [Google Scholar] [CrossRef] [PubMed]
  34. Prum, B.E., Jr.; Rosenberg, L.F.; Gedde, S.J.; Mansberger, S.L.; Stein, J.D.; Moroi, S.E.; Herndon, L.W., Jr.; Lim, M.C.; Williams, R.D. Primary Open-Angle Glaucoma Preferred Practice Pattern((R)) Guidelines. Ophthalmology 2016, 123, P41–P111. [Google Scholar] [CrossRef]
  35. Sihota, R.; Kamble, N.; Sharma, A.K.; Bhari, A.; Gupta, A.; Midha, N.; Selvan, H.; Dada, T.; Gupta, V.; Pandey, R.M. V‘an Herick Plus’: A modified grading scheme for the assessment of peripheral anterior chamber depth and angle. Br. J. Ophthalmol. 2019, 103, 960–965. [Google Scholar] [CrossRef]
  36. Armstrong, R.A. Statistical guidelines for the analysis of data obtained from one or both eyes. Ophthalmic Physiol. Opt. 2013, 33, 7–14. [Google Scholar] [CrossRef]
  37. Xiong, S.; Lv, M.; Zou, H.; Zhu, J.; Lu, L.; Zhang, B.; Deng, J.; Yao, C.; He, X.; Xu, X. Comparison of Refractive Measures of Three Autorefractors in Children and Adolescents. Optom. Vis. Sci. Off. Publ. Am. Acad. Optom. 2017, 94, 894–902. [Google Scholar] [CrossRef]
  38. Garcia-Resua, C.; Pena-Verdeal, H.; Minones, M.; Giraldez, M.J.; Yebra-Pimentel, E. Reliability of the non-contact tono-pachymeter Tonopachy NT-530P in healthy eyes. Clin. Exp. Optom. J. Aust. Optom. Assoc. 2013, 96, 286–294. [Google Scholar] [CrossRef] [PubMed]
  39. Kunert, K.S.; Peter, M.; Blum, M.; Haigis, W.; Sekundo, W.; Schutze, J.; Buehren, T. Repeatability and agreement in optical biometry of a new swept-source optical coherence tomography-based biometer versus partial coherence interferometry and optical low-coherence reflectometry. J. Cataract Refract. Surg. 2016, 42, 76–83. [Google Scholar] [CrossRef]
  40. Noya-Padin, V.; Garcia-Queiruga, J.; Iacubitchii, M.; Giraldez, M.J.; Yebra-Pimentel, E.; Pena-Verdeal, H. Lenstar LS900 vs EchoScan US-800: Comparison between optical and ultrasound biometry with and without contact lenses and its relationship with other biometric parameters. Expert Rev. Med. Devices 2023, 20, 681–690. [Google Scholar] [CrossRef]
  41. Noya-Padin, V.; Nores-Palmas, N.; Giraldez, M.J.; Yebra-Pimentel, E.; Pena-Verdeal, H. Comparison between Ocular Biometric Parameters and Intraocular Pressure with and without Contact Lenses. Eye Contact Lens 2023, 49, 464–470. [Google Scholar] [CrossRef]
  42. Armstrong, R.A.; Davies, L.N.; Dunne, M.C.; Gilmartin, B. Statistical guidelines for clinical studies of human vision. Ophthalmic Physiol. Opt. 2011, 31, 123–136. [Google Scholar] [CrossRef]
  43. Armstrong, R.A. Recommendations for analysis of repeated-measures designs: Testing and correcting for sphericity and use of manova and mixed model analysis. Ophthalmic Physiol. Opt. 2017, 37, 585–593. [Google Scholar] [CrossRef]
  44. Armstrong, R.A. When to use the Bonferroni correction. Ophthalmic Physiol. Opt. 2014, 34, 502–508. [Google Scholar] [CrossRef]
  45. Armstrong, R.A.; Eperjesi, F.; Gilmartin, B. The application of analysis of variance (ANOVA) to different experimental designs in optometry. Ophthalmic Physiol. Opt. 2002, 22, 248–256. [Google Scholar] [CrossRef]
  46. Bland, J.M.; Altman, D.G. Statistical methods for assessing agreement between two methods of clinical measurement. Lancet 1986, 1, 307–310. [Google Scholar] [CrossRef]
  47. Carkeet, A. Exact parametric confidence intervals for Bland-Altman limits of agreement. Optom. Vis. Sci. Off. Publ. Am. Acad. Optom. 2015, 92, e71–e80. [Google Scholar] [CrossRef]
  48. Bian, L.; Li, W.; Qin, R.; Sun, Z.; Zhao, L.; Zhou, Y.; Liu, D.; Liu, Y.; Sun, T.; Qi, H. Ocular Biometry Features and Their Relationship with Anterior and Posterior Segment Lengths among a Myopia Population in Northern China. J. Clin. Med. 2024, 13, 1001. [Google Scholar] [CrossRef]
  49. Pereira, J.M.M.; Neves, A.; Alfaiate, P.; Santos, M.; Aragao, H.; Sousa, J.C. Lenstar(R) LS 900 vs Pentacam(R)-AXL: Comparative study of ocular biometric measurements and intraocular lens power calculation. Eur. J. Ophthalmol. 2018, 28, 645–651. [Google Scholar] [CrossRef]
Figure 1. Means versus differences (Bland–Altman plot) between the ACD values obtained by the three devices in n = 48 participants. The thick solid horizontal line indicates the mean difference, while the thin solid horizontal lines represent the 95% LoA (Mean difference ± 1.96xSD). The dashed horizontal lines indicate the 95% confidence interval of the LoA. SD: standard deviation. 95% LoA: 95% limit of agreement. 95% CI: 95% confidence interval. (a) EchoScan vs. VX-120, (b) EchoScan vs. Lenstar LS900, (c) VX-120 vs. Lenstar LS900.
Photonics 11 00377 g001
Figure 2. Mean versus differences (Bland–Altman plot) between the ACD results compensated by CCT values obtained by the three devices in n = 48 participants. The thick solid horizontal line indicates the mean difference, while the thin solid horizontal lines indicate the 95% LoA (mean difference ± 1.96xSD). The dashed horizontal lines indicate the 95% confidence interval of the LoA. SD: standard deviation. 95% LoA: 95% limit of agreement. 95% CI: 95% confidence interval. (a) EchoScan vs. VX-120, (b) EchoScan vs. Lenstar LS900, (c) VX-120 vs. Lenstar LS900.
Photonics 11 00377 g002
Table 1. Descriptive statistics of the participants included in this study. Descriptive statistics and general analyses of differences (Greenhouse–Geisser correction) between the ACD values obtained by each device. All values in mm.
MeanSDMinimumMaximump
EchoScan (ACD)3.6270.3572.8104.340<0.001
VX-120 (ACD)3.1370.2362.6403.670
Lenstar (ACD)3.0880.2562.4103.600
ACD: anterior chamber depth. SD: standard deviation.
Table 2. Analyses of differences by pair (Sidak test) between the ACD values obtained by each device. All values in mm.
Mean
Difference
SDp95% LoA (95% CI)
LowerUpper
EchoScan
(ACD)
VX-120 (ACD)0.4900.235<0.0010.029
(−0.094 to 0.103)
0.951
(0.877 to 1.074)
Lenstar (ACD)0.5390.243<0.0010.063
(−0.065 to 0.139)
1.015
(0.939 to 1.143)
VX-120
(ACD)
EchoScan (ACD)−0.4900.235<0.001−0.951
(−1.074 to −0.877)
−0.029
(−0.103 to 0.094)
Lenstar (ACD)0.0480.1170.019−0.181
(−0.243 to −0.145)
0.277
(0.241 to 0.339)
Lenstar
(ACD)
EchoScan (ACD)−0.5390.243<0.001−1.015
(−1.143 to −0.939)
−0.063
(−0.139 to 0.065)
VX-120 (ACD)−0.0480.1170.019−0.277
(−0.339 to −0.241)
0.181
(0.145 to 0.243)
Anterior chamber depth. SD: standard deviation. LoA: limit of agreement. CI: confidence interval.
Table 3. Descriptive statistics and general analyses of differences (Greenhouse–Geisser correction) between the ACD obtained with the EchoScan and both VX-120 and Lenstar compensated with the CCT value. All values in mm.
MeanSDMinimumMaximump
EchoScan (ACD)3.6270.3572.8104.3400.200
VX-120 (ACD + CCT)3.6720.2333.1424.187
Lenstar (ACD + CCT)3.6240.2493.0104.111
ACD: anterior chamber depth. CCT: corneal central thickness. SD: standard deviation.
Table 4. Analyses of differences by pair (Sidak test) between the ACD compensated by CCT values obtained by each device. All values in mm.
Mean
Difference
SDp95% LoA (95% CI)
LowerUpper
EchoScan
(ACD)
VX-120
(ACD + CCT)
−0.0450.2310.559−0.498
(−0.619 to −0.425)
0.408
(0.335 to 0.529)
Lenstar
(ACD + CCT)
0.0030.2340.999−0.456
(−0.578 to −0.382)
0.462
(0.388 to 0.584)
VX-120
(ACD + CCT)
EchoScan (ACD)0.0450.2310.559−0.408
(−0.529 to −0.335)
0.498
(0.425 to 0.619)
Lenstar
(ACD + CCT)
0.0470.1160.021−0.180
(−0.241 to −0.144)
0.274
(0.238 to 0.335)
Lenstar
(ACD + CCT)
EchoScan (ACD)−0.0030.2340.999−0.462
(−0.338 to −0.584)
0.456
(0.382 to 0.578)
VX-120
(ACD + CCT)
−0.0470.1160.021−0.274
(−0.335 to −0.238)
0.180
(0.144 to 0.241)
ACD: anterior chamber depth. CCT: corneal central thickness. SD: standard deviation. LoA: limit of agreement. CI: confidence interval.
Disclaimer/Publisher’s Note: The statements, opinions and data contained in all publications are solely those of the individual author(s) and contributor(s) and not of MDPI and/or the editor(s). MDPI and/or the editor(s) disclaim responsibility for any injury to people or property resulting from any ideas, methods, instructions or products referred to in the content.

