Article

A Comprehensive Study on Elasticity and Viscosity in Biomechanics and Optical Properties of the Living Human Cornea

by
Francisco J. Ávila
1,*,
Óscar del Barco
2,
María Concepción Marcellán
1 and
Laura Remón
1
1
Departamento de Fïsica Aplicada, Universidad de Zaragoza, 50009 Zaragoza, Spain
2
Laboratorio de Óptica, Instituto Universitario en Óptica y Nanofísica, Universidad de Murcia, Campus de Espinardo, 30100 Murcia, Spain
*
Author to whom correspondence should be addressed.
Photonics 2024, 11(6), 524; https://doi.org/10.3390/photonics11060524
Submission received: 29 April 2024 / Revised: 25 May 2024 / Accepted: 29 May 2024 / Published: 31 May 2024
(This article belongs to the Special Issue Visual Optics)

Abstract

:
Corneal biomechanics is a hot topic in ophthalmology. The biomechanical properties (BMPs) of the cornea have important implications in the management and diagnosis of corneal diseases such as ectasia and keratoconus. In addition, the characterization of BMPs is crucial to model the predictability of a corneal surgery intervention, the outcomes of refractive surgery or the follow-up of corneal diseases. The biomechanical behavior of the cornea is governed by viscoelastic properties that allow, among other structural implications, the damping of excess intraocular pressure and the reduction of damage to the optic nerve. Currently, the most versatile and complete methods to measure corneal viscoelasticity are based on air-puff corneal applanation. However, these methods lack the ability to directly measure corneal viscosity. The aim of this work is to propose a new methodology based on the analysis of corneal air-puff measurements through the standard linear solid model (SLSM) to provide analytical expressions to separately calculate the elastic and time-dependent (corneal retardation time and viscosity) properties. The results show the mean values of elasticity (E), viscosity (Ƞ) and corneal retardation time (τ) in a sample of 200 young and healthy subjects. The influence of elasticity and viscosity on viscoelasticity, high-order corneal aberrations and optical transparency is investigated. Finally, the SLSM fed back from experimental E and Ƞ values is employed to compare the creep relaxation response between a normal, an ocular hypertension patient and an Ortho-K user. Corneal biomechanics is strongly affected by intraocular pressure (IOP); however, corneal hysteresis (CH) analysis is not enough to be employed as a risk factor of glaucoma progression. Low values of CH can be accompanied by high or low corneal elasticity and viscosity depending on the IOP threshold from which the time-dependent biomechanical properties trends are reversed.

1. Introduction

The hierarchical architecture of the cornea is responsible for the structure and transparency due to its collagen-based lamellar organization [1,2]. X-ray scattering has revealed how the molecular collagen fibrils provide the mechanical properties of corneal tissue [3]. In particular, the spring-like and viscous crimp mechanisms are governed by the micro- and nanoscale collagen structure. The elasticity of the cornea is enabled by the springs that straighten the supramolecular torsion of tropocollagen, while the viscosity responds to a curling mechanism of the fibrils [4]. In this sense, the cornea exhibits a viscoelastic nature with differentiated elastic and time-dependent (viscous) properties.
Biomechanical properties (BMPs) of the cornea can be understood as the dynamic response of the cornea to applied external forces [5]. BMPs have revolutionized the anterior chamber subspeciality in ophthalmology, allowing powerful competition in the prognosis and diagnosis of surgery treatments [6] and corneal diseases [7], respectively. The main methodologies for in vivo assessment of corneal BMPs are based on air-puff tonometry [8], elastography [9] and Brillouin microscopy approaches [10]. The most widespread approaches include the ocular response analyzer (ORA) [11] and corneal Scheimpflug visualization (Corvis-ST) [12], which consist of corneal applanation tonometry and provide the estimation of viscoelastic parameters and measurements of intraocular pressure (IOP).
Brillouin scattering allows the longitudinal modulus to be quantified from the analysis of the Doppler Brillouin frequency shift [13]. This technique has successfully characterized biomechanical differences between normal, keratoconic and post-refractive surgery corneas [14] due to its ability to observe mechanical anisotropy of the cornea [10].
Elastography methods include magnetic resonance imaging, ultrasound elastography and the emerging optical coherence elastography [9], which provides micrometric scale measurements of corneal stiffness and structural properties. In this sense, our group recently reported a promising tool based on a sound pressure generator for in vivo observation of the biomechanical response of the cornea to low-frequency acoustic waves [15].
The methodologies mentioned above are in progress on how to perform a rapid non-invasive biomechanical assessment of the cornea with sufficient spatial resolution to also provide reliable structural information. Obtaining accurate measures of biomechanical parameters is essential for the reliable predictability of mathematical models that reproduce the behavior of the cornea under normal and pathological conditions.
Under conditions of transient stress, the human cornea behaves as a viscoelastic material [16]. Various methods have been used to mathematically model the viscoelastic nature of the human cornea, particularly the Kelvin–Voigt, Maxwell and standard solid models [17].
Glass et al. proposed a modified Kelvin–Voigt model to evaluate the effect of elastic and viscosity properties on hysteresis (measure of the viscoelastic damping of the cornea [18]) in a corneal phantom [19]. Su et al. proposed a hyper-viscoelastic approach combining the Mooney–Rivlin hyperelastic and modified Maxwell models for the specific simulation of trephine and suture in corneal surgery [20]. Whitford et al. developed the first constitutive model for corneal viscoelastic representation by combining complex anisotropy, shear stiffness and fibrillar collagen density [21].
Recently, the standard solid model was proposed for the simulation of thermoviscoelasticity of the human cornea [22] due to its reasonable predictability for loads applied to the cornea on a constant or transient basis.
The study of corneal biomechanics through mathematical models achieves greater robustness if feedback with experimental data (or at least derivable from experimental measurements) is possible.
The aim of this work is to introduce a new methodology based on the analysis of air-puff corneal applanation measurements and corneal Scheimpflug imaging with the three-element standard linear solid model (SLSM) to provide experimental analytical expressions to calculate separated elastic and time-dependent (i.e., viscous property and corneal retardation time) of the human cornea in vivo.

2. Materials and Methods

2.1. Participants

Two hundred young healthy volunteers participated in the study (mean age 21.07 ± 3.13 years old). None of them had a diagnosis of glaucoma or hypertensive ocular disease or had undergone refractive surgery. In addition, a patient diagnosed with ocular hypertension (intraocular pressure 24.8 mmHg) and an Ortho-K contact lens user were recruited to compare normal response from their variations in biomechanical properties in tensile creep relaxation tests. The motivation to include a comparison with these two types of patients was the growing concern regarding glaucoma disease and to explore the biomechanical complications of orthokeratology.
This study was reviewed by an ethical review board (Ethical Committee of Research of the Health Sciences Institute of Aragón, Spain. Reference C.P.-C.I.PI20/377) according to the tenets of the Declaration of Helsinki. All participants were informed about the nature and risks of the study and signed an informed consent document.

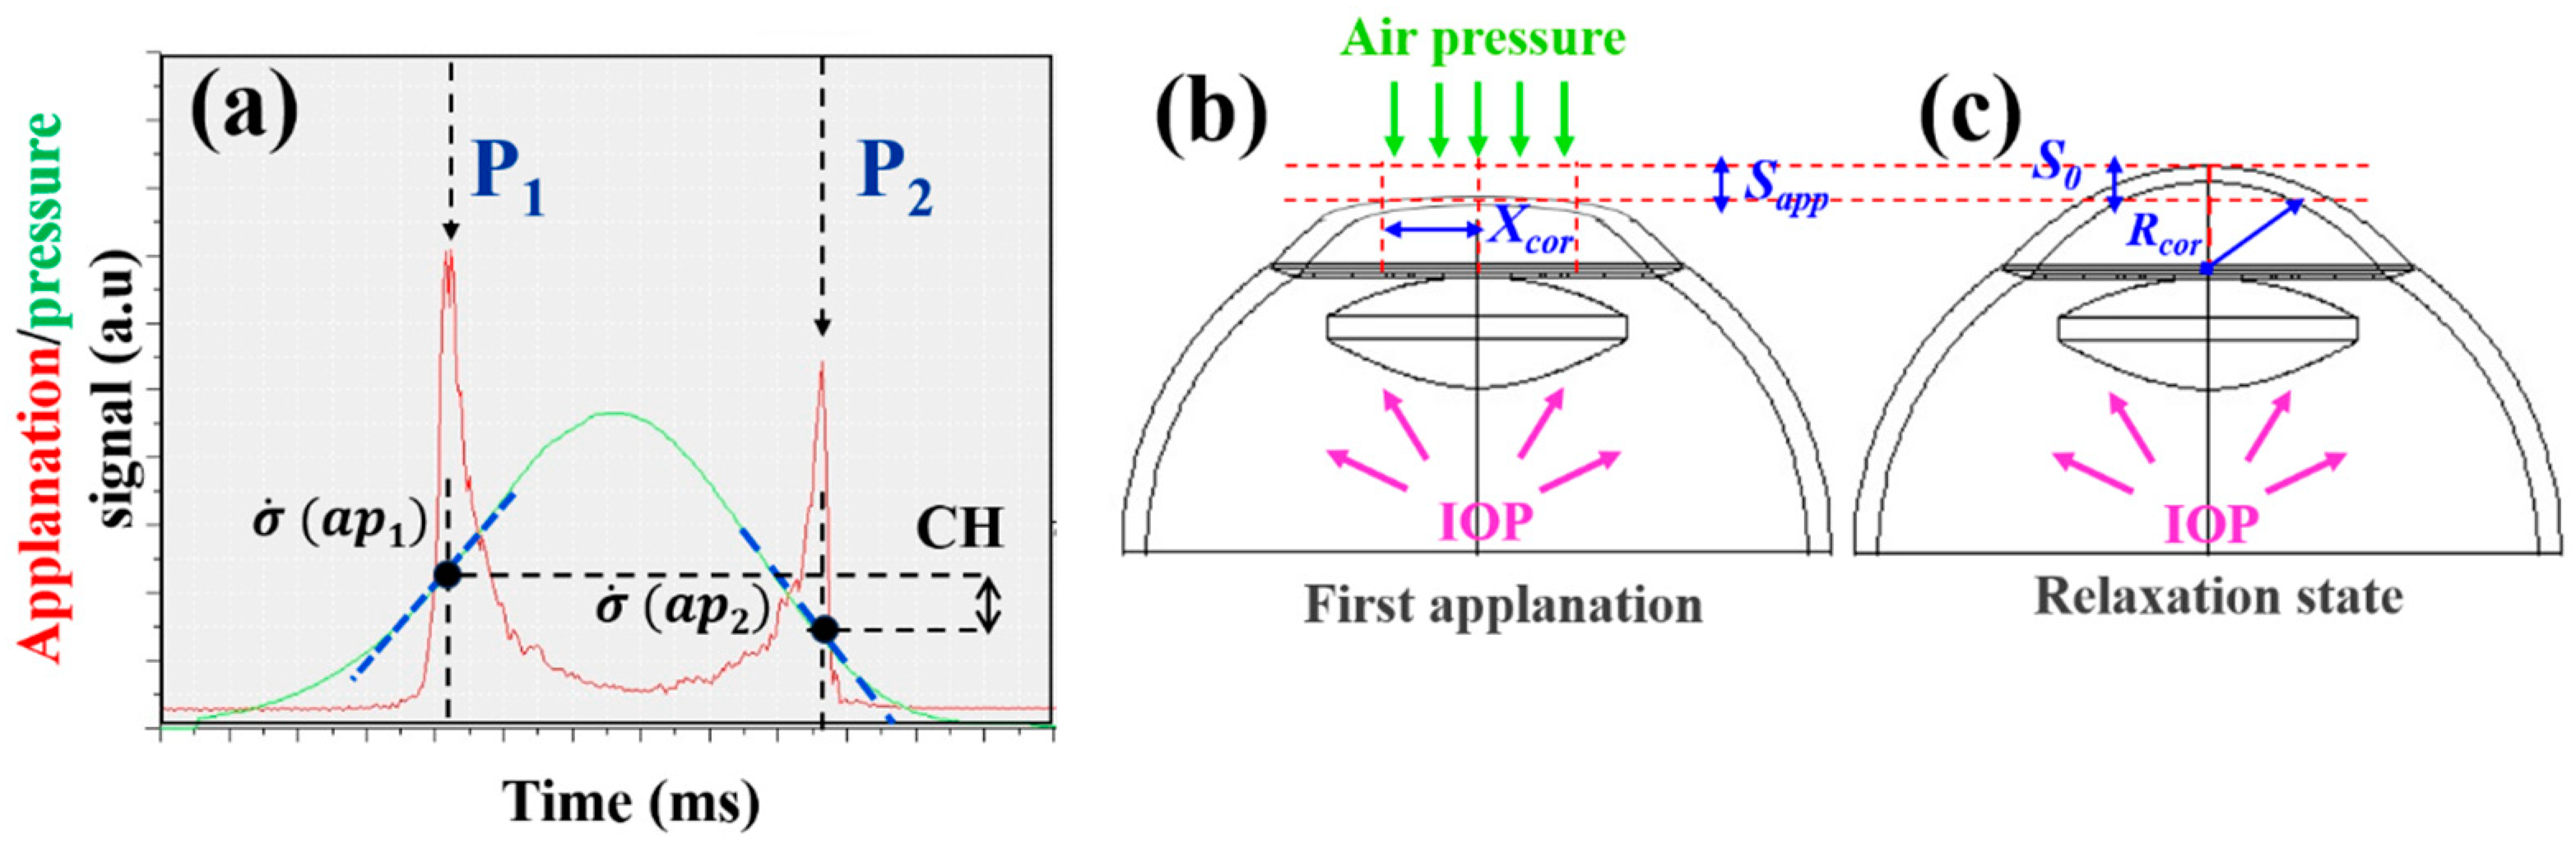
2.2. In Vivo Corneal Assessment: Geometrical, Optical and Biomechanical Corneal Parameters

The Galilei dual Scheimpflug analyzer (Galilei G2; Ziemer Ophthalmic Systems AG, Port, Switzerland) and the ocular response analyzer device (ORA, Reichert Instruments, Depew, NY, USA) were used to measure geometrical and optical (optical density and corneal aberrometry) corneal parameters and provide a biomechanical assessment of the living human cornea. Table 1 summarizes the description of the parameters as a function of the employed technology.
The measurements were carried out at the visual optics laboratory of the University of Zaragoza (Spain) by an experienced clinical optometrist. All data were incorporated into an Excel database without including more personal data than the date of birth and an identification code. Graphical representations and numerical simulations were carried out using Origin Lab software 2024b (Origin Lab Corp., Northampton, MA, USA) and Matlab2019b (the MathWorks Inc., Natick, MA, USA) programming language.

2.3. The Three-Element Standard Linear Solid Model

Figure 1 shows the three-element standard linear solid model (SLSM) [23], which is obtained by adding a spring series with a Kelvin–Vogt (KV) unit (blue box in Figure 1). The KV model consists of a spring coupled in parallel with a dash pot that represents the viscoelastic component of the model. E is the elasticity of the springs, Ƞ is the viscosity of the dash pot, σ is the applied stress (or external load) and ε is the strain, respectively. The third element consists of an extra spring (E1) that forms the purely elastic behavior of the system. In the three-element SLSM, the Kelvin–Voigt representation is used to distinguish it from the Maxwell representation. The model is oriented in the plane of the corneal lamellae, where the air pressure from the tonometer is perpendicular to our viscoelastic model with 3 elements. In this orientation, the model aligns with the forces generated in the lamellae and represents the elongation and shortening of the lamellae as the wall stress in the cornea changes during measurement.
From the Figure 1, the equations for the SLSM are [23]:
σ = σ 1 + σ 2 σ = E 1 ε 1 σ 1 = E 2 ε 2 σ 2 = Ƞ ε 2 ˙ ε = ε 1 + ε 2
where ε ˙ is the stress rate. The constitutive law for the SLSM is given by [23]:
σ + Ƞ E 1 + E 2   σ ˙ = E 1 · E 2 E 1 + E 2 ε + E 1 Ƞ E 1 + E 2   ε ˙
Assuming the cornea to be axisymmetric, a single elastic constant should govern the corneal behavior, so we can identify E1 = E2 [19]. Consequently, the constitutive law for the standard solid model can be written as:
σ + Ƞ 2 E   σ ˙ = E 2 ε + Ƞ 2   ε ˙
In addition, the cornea is considered an isotropic spherical membrane with constant thickness and the load on the cornea is assumed to be uniform. If the SLSM is loaded (considering a step function for the stress σ), the response is given by solving the differential equation (Equation (3)):
ε t = σ 0 1 E + 1 E 1 e E Ƞ t
Notice that, immediately after applying the load stress, the strain will be entirely from the lone spring (E1). Thus, in fact, ε(0) = σ0/E.
When the stress is removed, the absence of load (σ = 0) reduces the constitutive law to:
E 2 ε + Ƞ 2   ε ˙   =   0
and the relaxation response is:
ε t = σ 0 E e E Ƞ t e E Ƞ t u 1
where the time t begins at the zero load event at which the stress is applied. The point at which the stress is removed is given by tu. Then, Equations (4) and (6) can predict the response of the model (strain) under stress given the values for elasticity and viscosity. The next section attemps to develop analitical expressions for the calculation of E and Ƞ from air-puff corneal applanation measurements.

2.4. Experimental Calculation of Elastic and Time-Dependent Biomechanical Properties

The ORA device provides invaluable mechanical information beyond the CRF, CH and IOP parameters provided by commercial software. Figure 2a shows a representative measurement showing both signals corresponding to the force of the air jet applied to the cornea and the deformation monitored by electro-optical detection. The red waveform shows two peaks (P1 and P2) representing the first and second applanation events as the cornea moves inward and outward, respectively. The green Gaussian-shaped curve corresponds to the delivered pressure and is responsible for the forward and backward corneal displacement phases. At the moment of maximum corneal deformation, the Gaussian reaches maximum peak.
In this sense, Figure 2b represents the first applanation event, where the applied stress (σP1) on the anterior corneal surface is given by [19]:
σ P 1 = P r , 1 · R cor 2 · CCT
where Rcor and CCT are the original corneal radius and central corneal thickness, respectively. PR,1 is the resulting pressure in the first applanation event [24]:
P r , 1 = P 1 + P tf IOP
where P1, Ptf and IOP are the first applanation pressure, the tear film surface pressure and the intraocular pressure, respectively. Once the measurement is completed, the cornea returns to its original state and shape (Figure 2c).
The air jet applies stress on a total corneal diameter of 2·Xcor, which subtends an arc length in the relaxed state, Lcor [19]:
L cor = 2 · CCT sin 1 X cor R cor
When the cornea is completely applanated (i.e., corneal sagitta is Sapp), Lcor = Lflatt = 2 · Xcor, then the induced strain (εflatt) by the applanation pressure P1 can be calculated from Equation (4) [19]:
ε flatt = L cor L flatt L cor = X cor CCT · sin 1 X cor CCT 1
Once the values for stress σP1 and strain εflatt for the first applanation are known, corneal elasticity can be calculated:
E = σ P 1 ε flatt
On the other hand, the corneal retardation time τ is the time in which about 63% of the final corneal strain is determined [25,26]. This metric would measure the cornea’s ability to absorb IOP fluctuations. Recently, our group developed a theoretical method to derive a practical expression for this parameter [27] once the applanation pressures (P1 and P2) and their first derivatives are known (please, see again Figure 2a):
τ = 2 CH σ ˙ a p 1 + σ ˙ a p 2
The accurate method to determine the applanation pressures is performed via the two ORA characteristic curves: the applanation signal (corresponding to the IR light that is reflected off the surface of the cornea during perturbation) and the pressure amplitude (please, see again Figure 2a). The last curve can be fairly fitted by a Gaussian profile with a high confidence level (0.985 < R2 < 0.997 in all cases) [27]. Then, the applanation signal provides the two applanation pressures P1 and P2 (via the sharp peaks in both panels), whereas the derivatives of the applanation pressures σ ˙ a p 1 and σ ˙ a p 2 can be analytically evaluated from the first derivatives of the fitted Gaussian profile.
Once the time-dependent parameter τ is computed, the corneal viscosity can be easily obtained by the following expression:
Ƞ = E · τ = 2 · σ P 1 · CH ε flatt · σ ˙ a p 1 + σ ˙ a p 2  

2.5. Statistical Analysis

Experimental data are stored in an Excel spreadsheet and then migrated to Origin Lab software 2024b (Origin Lab Corp., Northampton, MA, USA) for statistical analysis and graphical representations. Statistical analysis consists of Spearman rank order correlation and regression analysis. Data shown in Figure 4 are modeled by a piecewise 2 segment linear regression for which the threshold values correspond to the point of discontinuity obtained as a result of the regression analysis. Limits of agreement and confident bands are used to quantify the agreement between the given parameters in graphical representations. Statistics is performed using the advanced statistical tool from Origin Lab software.

3. Results

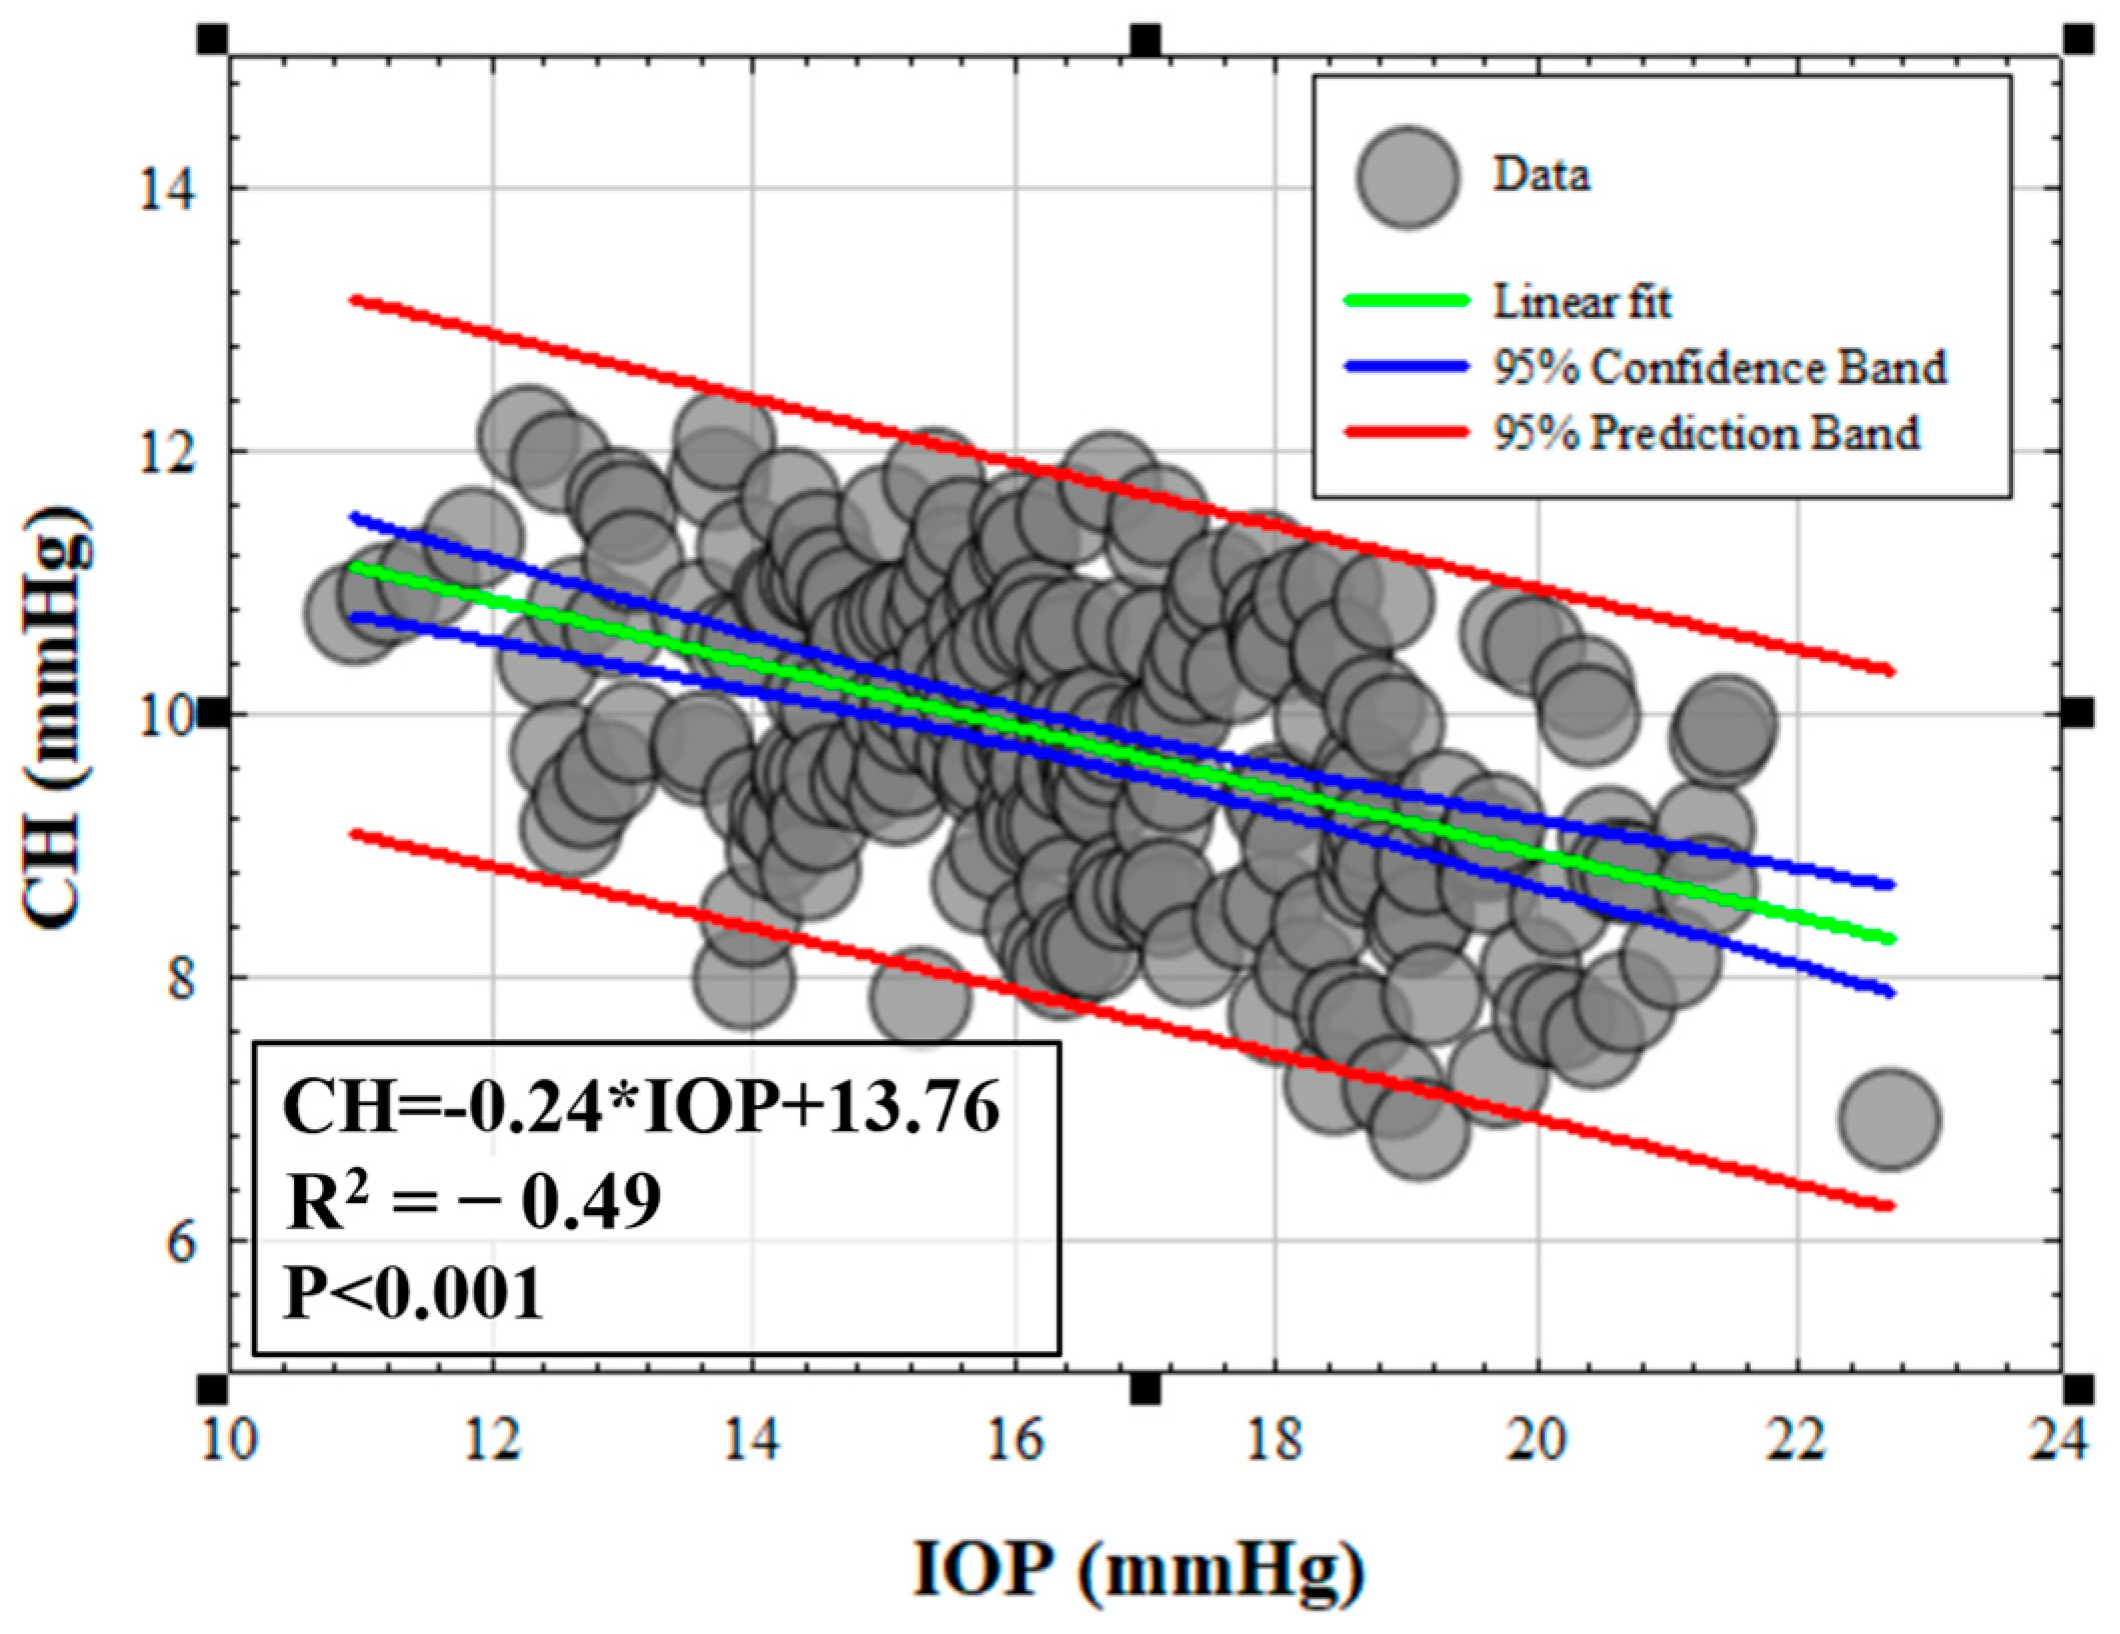
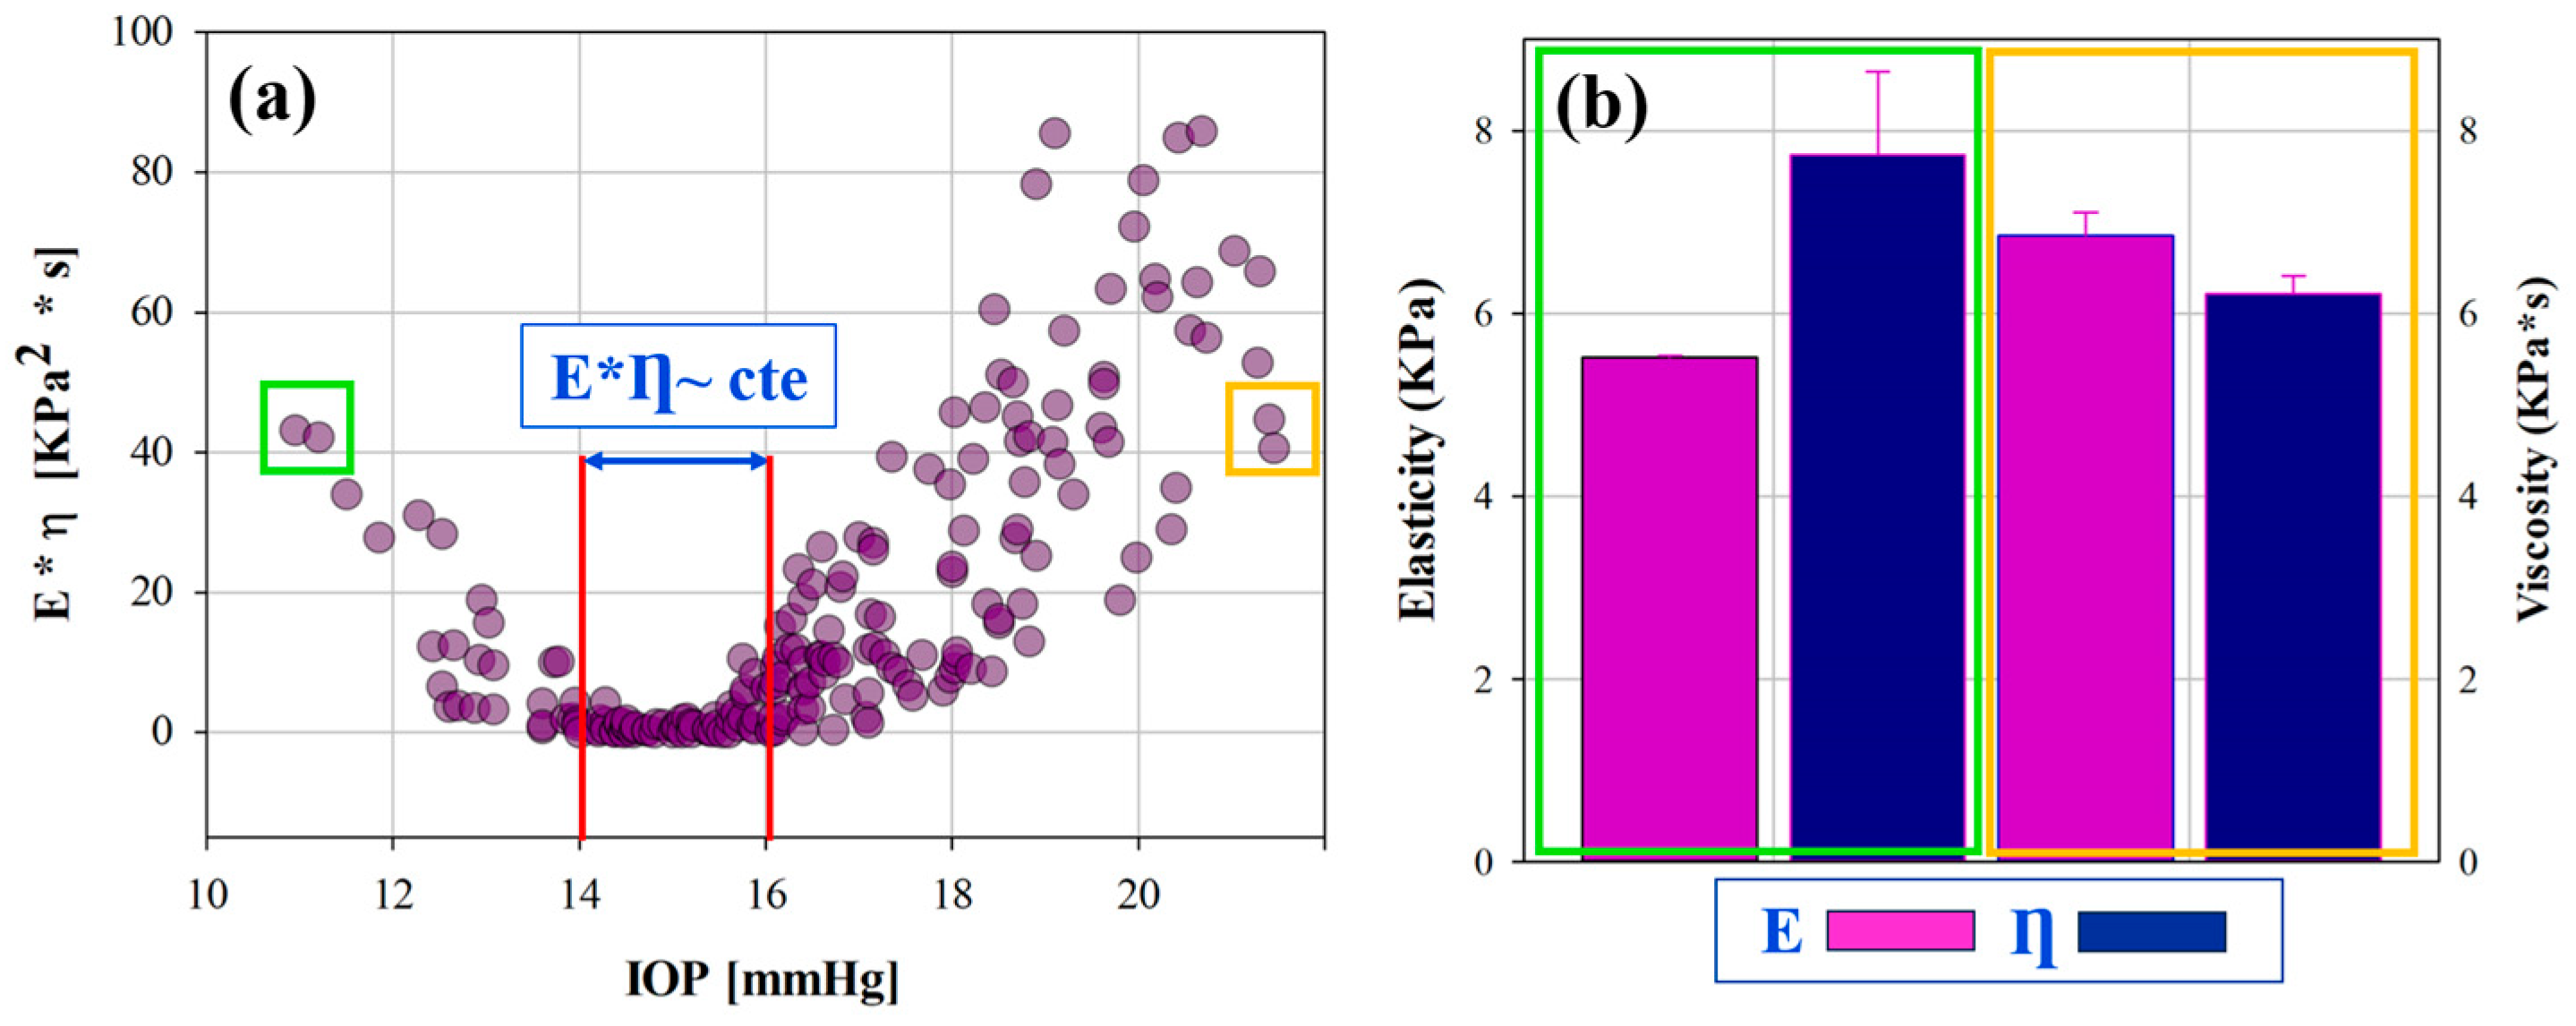
3.1. Efect of IOP on Elastic, Viscoelastic and Viscous Properties of the Cornea

The aim of this section is to investigate how fluid pressure within the eyeball impacts corneal biomechanics due to its relevance to glaucoma disease [28]. Table 1 shows the representative mean values of IOP, geometric and biomechanical parameters for all participants in this study. Elasticity, tau and viscosity are calculated using Equations (11), (12) and (13), respectively.
Figure 3 represents CH as a function of the IOP. As the intraocular pressure increases, the ability of the cornea to absorb and dissipate excess mechanical energy reflects a decrease in CH measurements, with a significant negative correlation (R2 = −0.49, p < 0.001).
Figure 4 shows the experimental values for elasticity (Figure 4a) and viscosity (Figure 4b) of the human cornea as a function of the IOPcc. The results show piecewise linear behavior with statistical correlations of R2 = 0.81 (p < 0.0001) and R2 = 0.80 (p < 0.0001), respectively.
The two-segment linear regressions for E and Ƞ are given by experimental fitting expressions 14 and 15. We find a threshold IOP value (IOPu) of 14.45 mmHg, for which the intervals are defined. For IOP values less than 14.45 mmHg, the elastic and viscous components of the cornea are negatively correlated, i.e., elasticity and viscosity decrease as the IOP increases up to IOPu. However, for IOP values higher than IOPu, the trend is reversed and both elastic and viscous properties increase as a function of IOP.
E IOP = 9.33 · IOP u IOP + 0.21 · IOP IOP min IOP u IOP min ,   IOP min IOP IOP u 0.21 · IOP MAX IOP + 11.30 · IOP IOP u IOP MAX IOP u ,   IOP u IOP IOP MAX
Ƞ IOP = 14.33 · IOP u IOP + 0.47 · IOP IOP min IOP u IOP min ,   IOP min IOP IOP u 0.47 · IOP MAX IOP + 9.98 · IOP IOP u IOP MAX IOP u ,   IOP u IOP IOP MAX

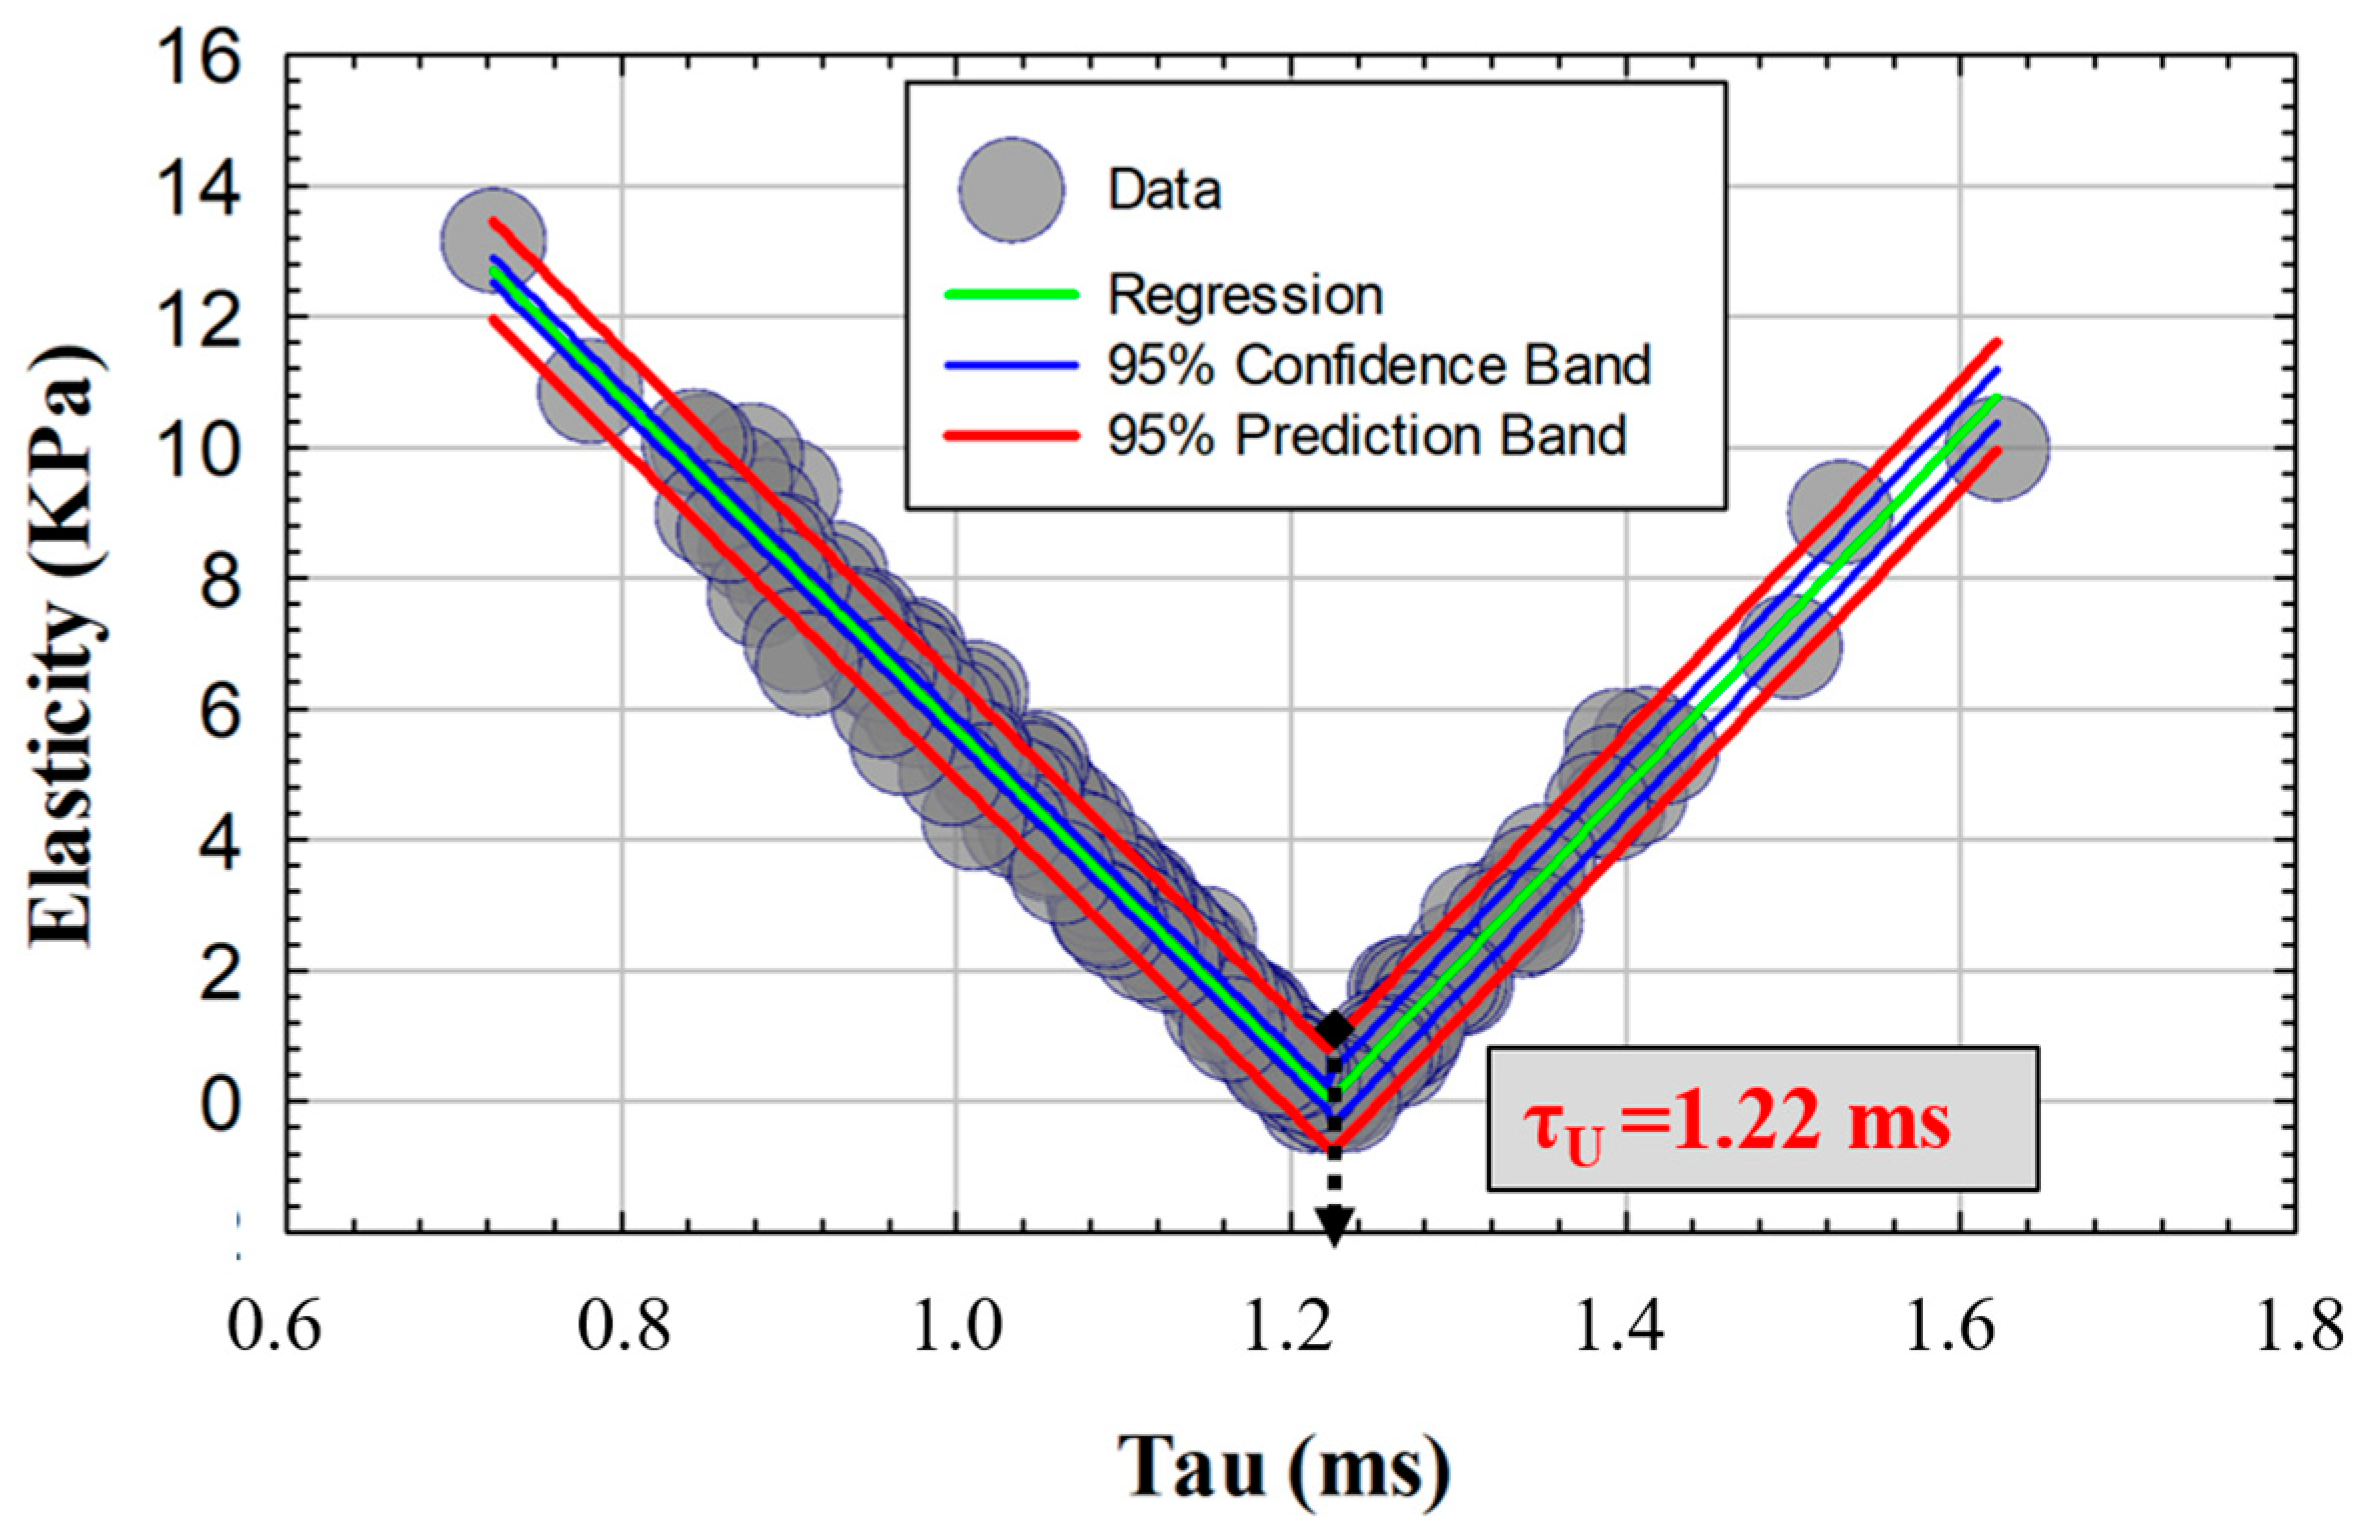
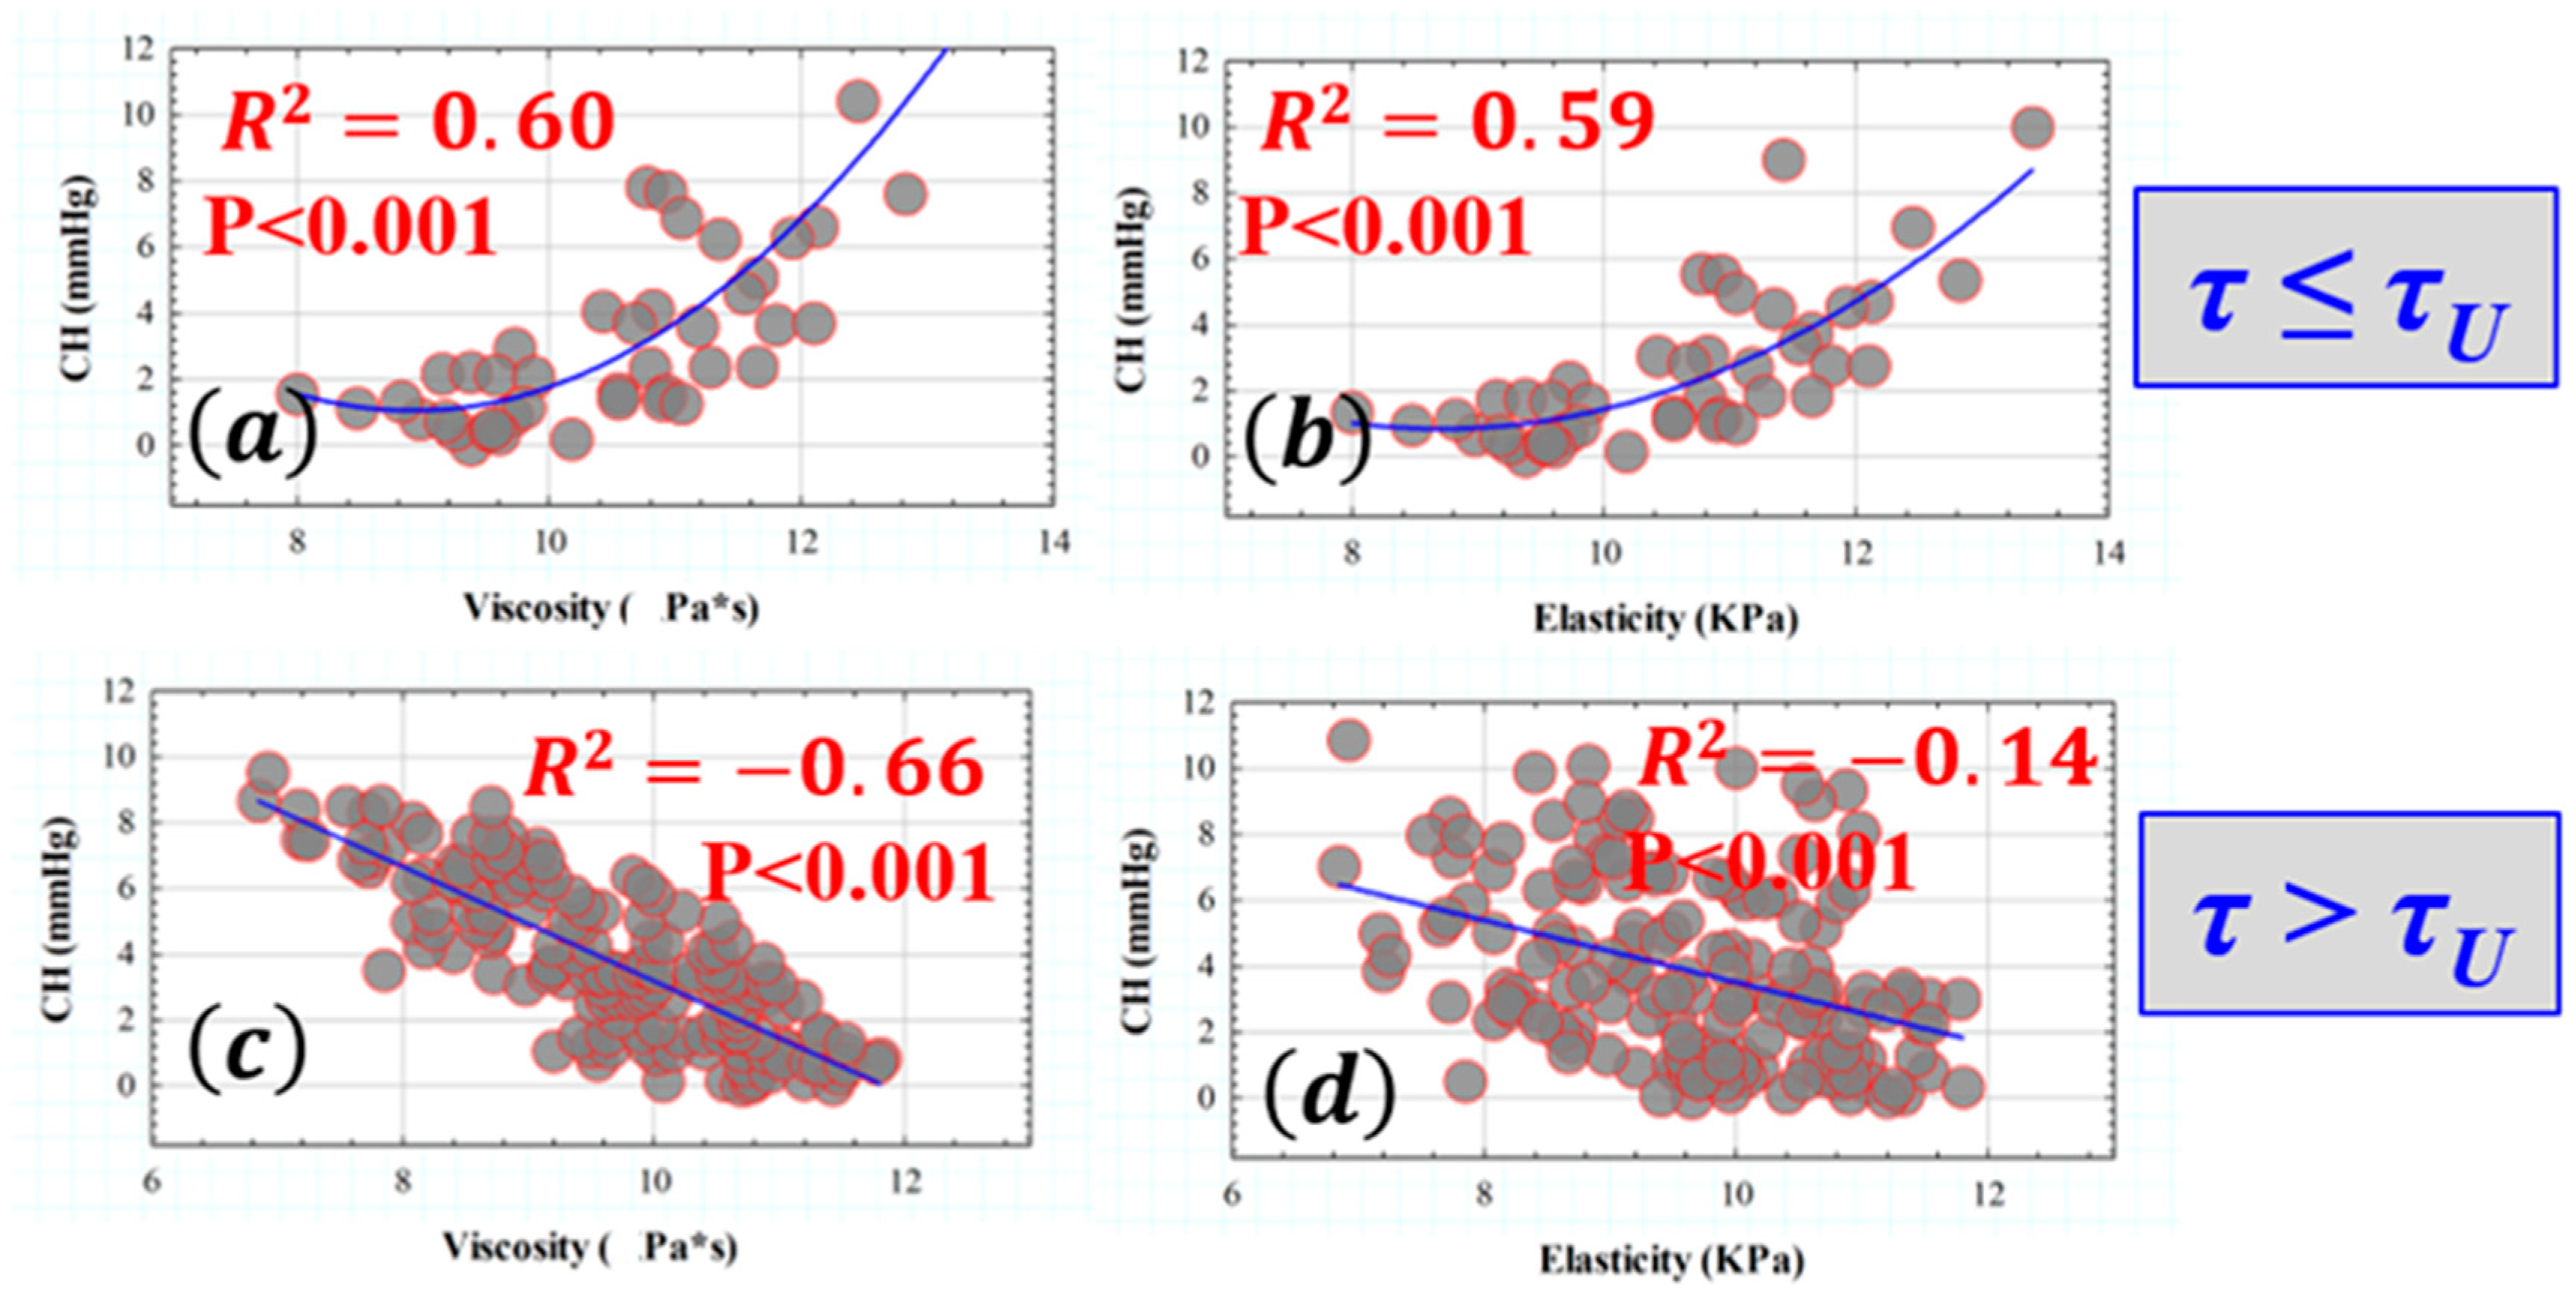
3.2. Retardation Time as a Biomechanical Behavior Threshold: Role of Elasticity and Viscosity on Corneal Viscoelasticity

Corneal retardation time (τ) has been reported as a good biomarker of corneal viscoelasticity [26], which, in collusion with the CH parameter, provides combined information regarding elastic and viscous properties. At this point, it is crucial to ask a fundamental question: what is the elastic response of the cornea when its viscoelastic behavior changes?
Figure 5 shows the elasticity calculated from all subjects as a function of the retardation time (τ). The elastic property of the cornea shows an almost symmetric behavior around a given value of the retardation time τU = 1.22 ms. For those corneas characterized by a retardation time less than 1.22 ms, elasticity decreases as viscoelasticity increases. However, an inverse behavior is observed for values of τU ≥ 1.22 ms.
From the data observed in Figure 5, there appears to be a threshold in the retardation (τU) time, beyond which the elastic behavior of the cornea is reversed. To understand the influence of this threshold on the evaluation of viscoelasticity, Figure 6 shows the influence of the elasticity and viscosity on corneal hysteresis for values of τU ≤ 1.22 ms (Figure 6a and Figure 6b, respectively) and for values of retardation time greater than τU (Figure 6c and Figure 6d). For retardation times less than 1.22 ms, both the viscosity (Figure 6a) and elasticity (Figure 6b) components contribute to an increase in corneal hysteresis with parabolic correlation (R2 = 0.60 and R2 = 0.59, respectively). However, an interesting phenomenon is observed for corneas exhibiting retardation times larger than 1.22 ms. If corneal viscosity (Figure 6c) or elasticity (Figure 6d) increases, the viscoelasticity measured by the CH parameter decreases, with a statistically significant negative linear trend (R2 = −0.66 and R2 = −0.14, respectively). It is worth highlighting that, while for τU ≤ 1.22 ms, the corneal hysteresis shows a similar dependence on viscosity and elasticity, for retardation times greater than τU, the main contribution to viscoelasticity comes from the viscous component.

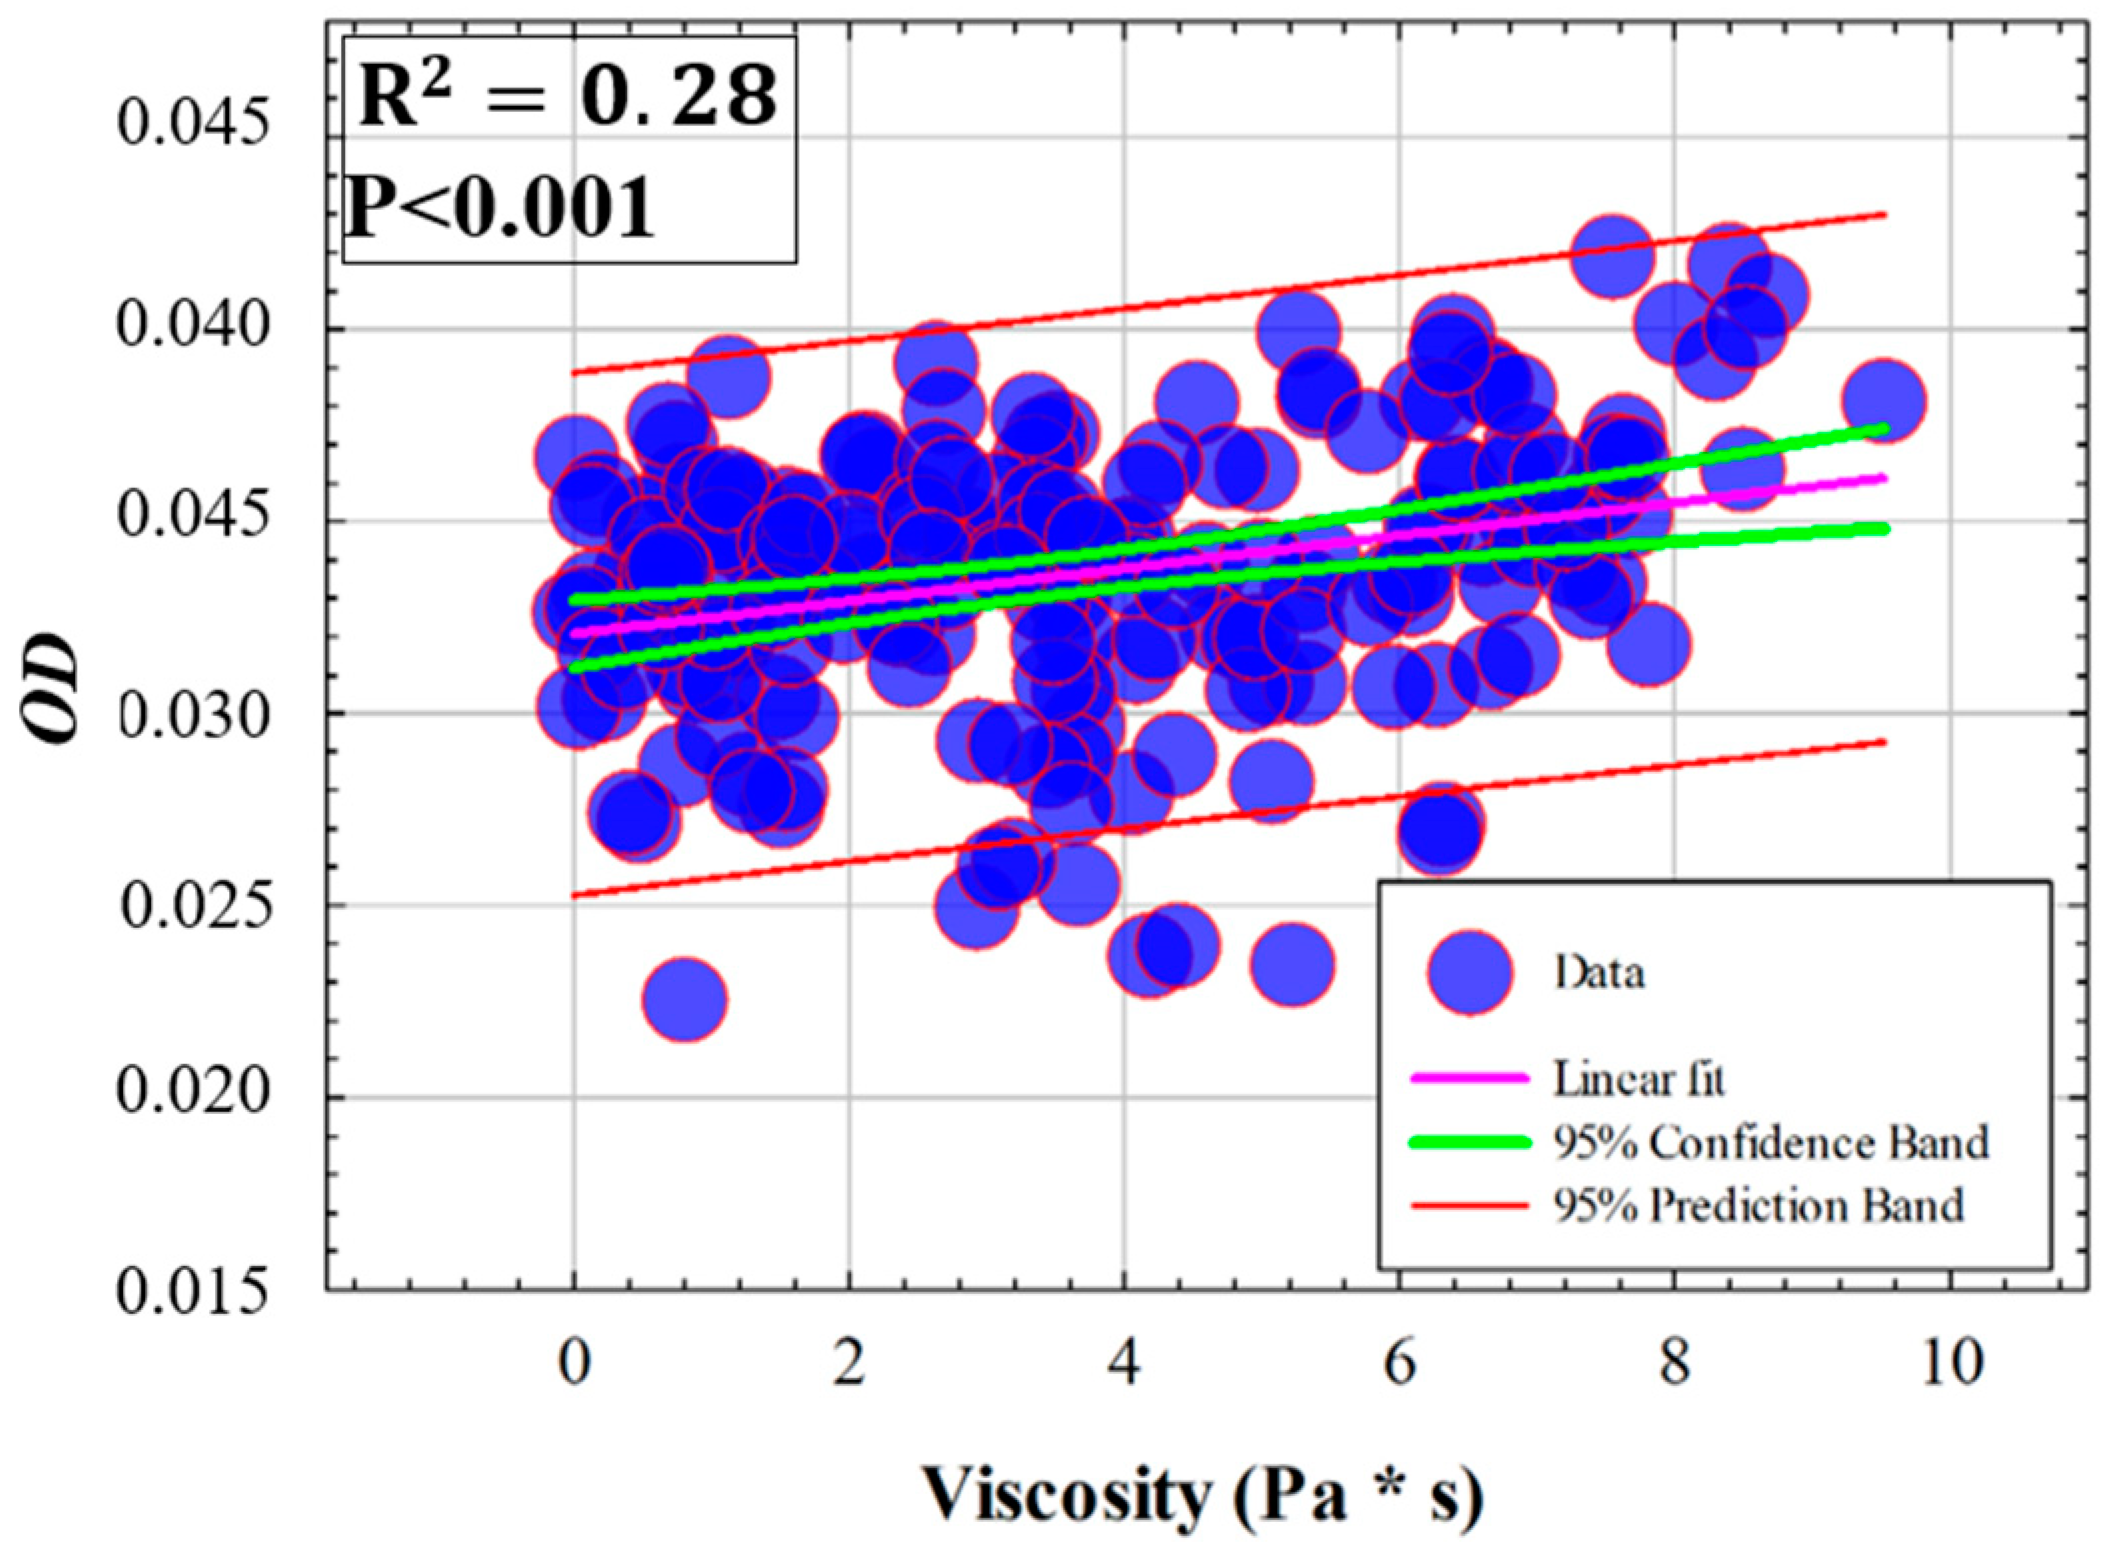
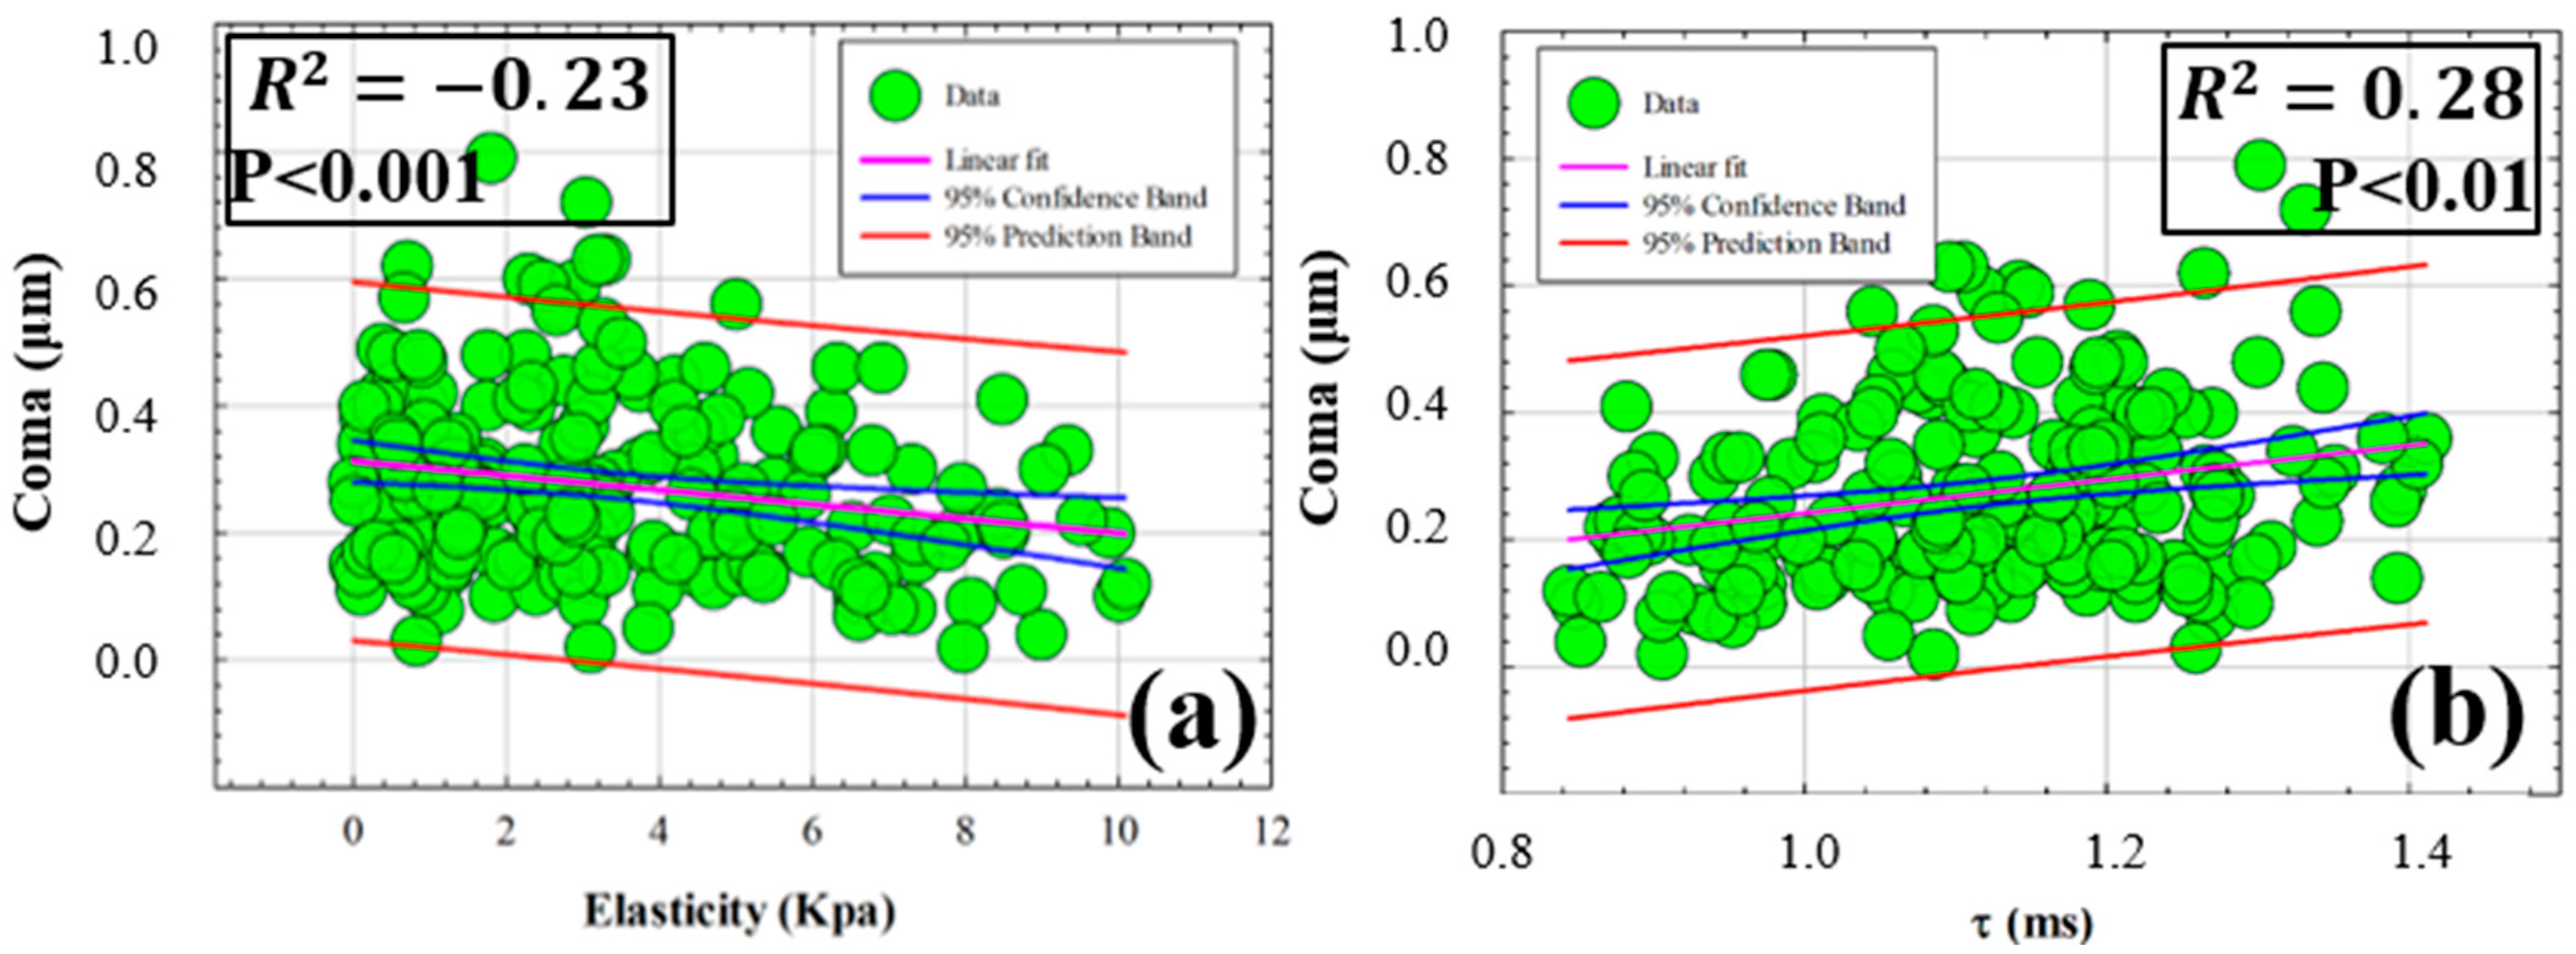
3.3. Influence of Elasticity and Time-Dependent Parameters on Corneal Optical Properties

The ultrastructure of the stromal lamellae (formed by type-I collagen fibrils) is responsible for corneal optical transparency [3]. In addition, the three-dimensional architecture at the microscopic level has an important implication for the corneal biomechanics [5]. In this sense, this section studies the influence of elasticity and time-dependent corneal properties on both corneal transparency (quantified by optical density measures) and high-order corneal aberrations.
Table 2 shows the representative mean values of optical density (OD), spherical aberration (SA), trefoil and coma terms of the study sample.
Figure 7 shows the relationships found between viscosity and corneal optical density (OD). Optical density increases moderately with viscosity (R2 = 0.28) (i.e., optical transparency decreases as viscosity increases). No relationships are found between elasticity and optical density.
With respect to corneal optical imperfections measured by high-order aberrometry, Figure 8 shows the correlations found between elasticity and retardation time with the coma term. The data shown in Figure 8a indicate how increasing corneal elasticity correlates (R2 = −0.23) with a descent in the amount of coma term. On the contrary, longer retardation times are related to an increase in corneal coma (Figure 8b).

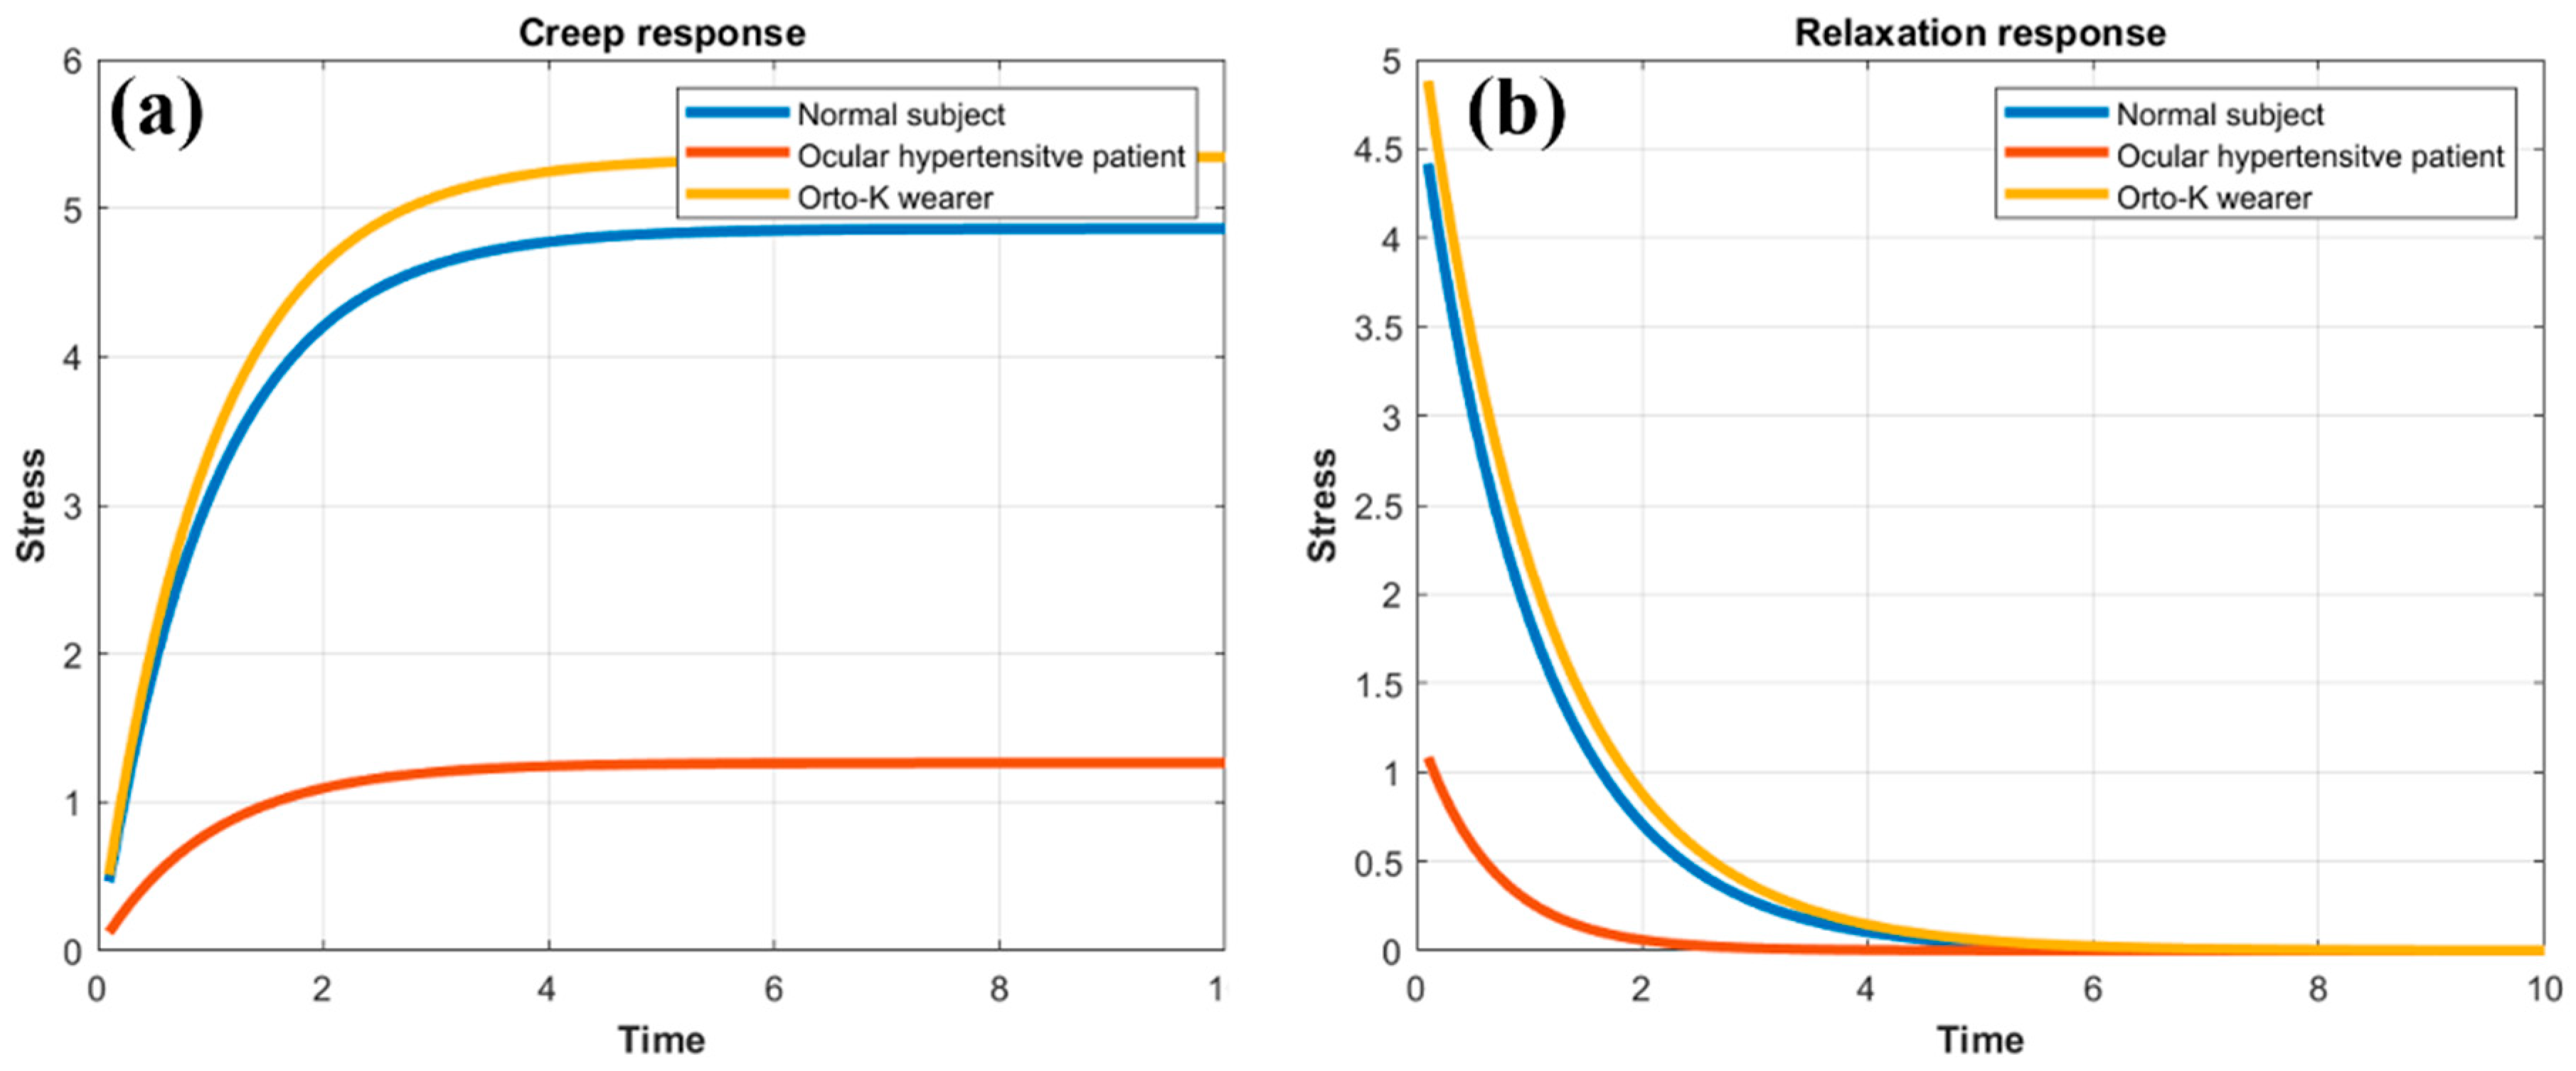
3.4. Creep Relaxation Response of the Human Cornea as a Function of Elasticity and Viscosity

Once the elastic and time-dependent biomechanical properties of the human cornea are experimentally derived from ORA measures and Scheimpflug imaging, the SLSM (see Section 2.3) can be fed back from the experimental data for the simulation of creep and stress relaxation behavior under real conditions. Table 3 shows the experimental values of elasticity and viscosity for the representative mean value of our study sample, for an ocular hypertensive patient and for a healthy user of Ortho-K contact lenses.
The data shown in Table 3 are entered as inputs into the solid model to perform a creep and stress relaxation response over a time of 10 s. The ocular hypertensive patient showed a drastic increase in both elastic (+42.2%) and viscous (+82.85%) components. However, the Ortho-K user experienced a slight reduction in E (−9.44%) and almost negligible variation in Ƞ (−2.84%).
Figure 9 compares the creep relaxation test between a pathological eye and Ortho-K contact lens wearer with the normal response of a population of 200 healthy young subjects. In agreement with the mean values shown in Table 3, the Ortho-K wearer showed an almost negligible relaxation response compared with normal corneas, while a slightly weaker reduction is seen in the creep response. The ocular hypertensive patient showed a rapid stabilization of the creep (Figure 9a) and relaxation curves (Figure 9b), with a significantly reduced response compared with the normal representative curves (Figure 9, blue lines).

4. Discussion and Conclusions

We proposed a simple experimental methodology to obtain information on separated elastic and viscous components from the viscoelastic properties of the living human cornea. The results from the ocular response analyzer combined with geometric information from corneal Scheimpflug imaging allowed us to calculate the corneal retardation time [24] (τ), the corneal elasticity (E) and finally the corneal viscosity (Ƞ) from a large sample of young subjects.
To the best of our knowledge, this is the first work presenting the experimental derivation of viscous and elastic components from measurements of living human corneas combining non-contact tonometry and Scheimpflug imaging. In addition, we presented analytical expressions to calculate both elastic moduli and time-dependent biomechanical properties of the human cornea.
The SLSM was employed here to model the human cornea and obtain the creep and stress relaxation response from experimental data by solving the constitutive stress–strain equation of the constitutive law for the loading and unloading conditions of the system.
Biomechanical and geometric experimental data from ORA measurements and Scheimplug imaging were acquired from 200 eyes of healthy young subjects (See Table 1). From these data, E (Kpa), τ (ms) and Ƞ (Pa*s) were calculated.
Mikula et al. found a mean elastic moduli value of 3.05 Kpa through the axial cornea measured using acoustic radiation force elasticity microscopy [29]. In agreement, we found an average elastic modulus of 3.44 ± 2.67 Kpa.
Rahmati et al. [30] conducted in-depth research into the biomechanics of keratoconic corneas (KCs), focusing on the viscoelastic properties of both healthy and pathological patients via a finite element optimization algorithm. Though this paper reported interesting conclusions on corneal viscosity in KC patients, the main population of our work consisted of healthy subjects (with one exceptional case of possible glaucoma). Moreover, the authors described the corneal viscoelasticity via the shear deformation parameter, whereas the goal of our research was to separate both viscoelastic contributions, that is, the elastic modulus and viscous component at a time. Nevertheless, the study of biomechanical properties in keratoconic corneas is a matter for future research by our group.
Francis et al. reported a methodology for obtaining corneal viscous properties by analyzing the temporal corneal deflection signal from air-puff applanation in a large sample of normal subjects and patients with keratoconus [31]. In particular, they analyzed the deformation data using the standard linear solid and Kelvin–Voigt models. Unfortunately, they did not detect a significant corneal viscous response of the cornea and concluded that viscous properties cannot be computed from air-puff applanation. Our proposed methodology allowed us to experimentally measure (and calculate analytically) the viscous property of the human cornea in vivo; we found an average value for normal corneas of 3.57 ± 2.39 [Pa · s].
The discrepancies between our study and that published by Francis et al. reside in the adequate definition of a time-dependent biomechanical parameter that relates the viscosity and elasticity, such as the previously reported corneal retardation time [27].
Considering that intraocular pressure (IOP) is the main clinically interesting force affecting the cornea (and its implications on the optical nerve and glaucoma disease), Figure 1 explores the influence of IOP on corneal hysteresis (CH). A negative correlation was found between IOP and CH in accordance with previous studies [32,33,34].
Therefore, the higher the IOP, the lower the CH and, therefore, the lower the ability of the cornea to dissipate and/or absorb energy from an excess of intraocular pressure.
In this sense, the influence of IOP on the separated elastic and viscous components is analyzed in Figure 4.
A piecewise asymmetric linear behavior was found between IOP, E and Ƞ for an IOP threshold value of IOPU = 14.45 mmHg. A negative linear correlation between E and Ƞ with IOP was found for values of IOP lower than IOPu. However, for intraocular pressure measurements greater than 14.45 mmHg, both the elastic and viscous components of the cornea increased with IOP.
This seemingly anomalous behavior can be better understood by analyzing the results shown in Section 3.2. The corneal retardation had a limit of 1.22 ms, from which the corneal elasticity reversed its behavior (Figure 5).
Considering the threshold value of τ = 1.22 ms, we investigated the influence of separated elasticity and viscosity on corneal hysteresis.
In 2008, Glass et al. [19] reported a methodology based on a viscoelastic model to evaluate how the individual contribution of viscous and elastic components affected corneal hysteresis (i.e., corneal viscoelasticity) in a corneal phantom. They concluded that low hysteresis can be related to either low and high elasticity, depending on the viscous component.
In agreement, our finding revealed that, for low values of retardation time, an increase in both elasticity and viscosity implied a growth in CH. But, consequently, for retardation times higher than 1.22 ms, the dependence of the elastic component on CH decreased and governed a clear correlation of viscosity with corneal hysteresis. As the viscosity increased the CH decreased, with negative significant correlation.
Therefore, for corneal retardation times greater than 1.22 ms, the cornea showed a predominant viscous behavior. That is, the cornea was capable of absorbing energy but lost the ability to dissipate energy.
Optimal visual acuity is contingent upon corneal transparency. Corneal infections, contact lens complications, chemical injuries or neovascularization are causes of corneal opacification. However, corneal surgery for refractive error correction such as photorefractive keratectomy and accelerated cross-linking for the treatment of degenerative keratoconus can lead to permanent corneal opacification in healthy patients [35]. These last two corneal surgery techniques involve a redistribution of corneal stiffness and biomechanical remodeling.
In this sense, Section 3.3 analyzed the influence of elastic and viscous components on corneal transparency quantified by optical densitometry measurements (corneal Scheimpflug imaging). The results showed a linear dependence on the optical density (OD) but no statistical relationship with elasticity (See Figure 7). Our findings revealed a decrease in optical transparency (i.e., higher optical density) as the viscosity increased.
The results shown in Figure 8 are especially relevant for refractive surgery to better understand how photorefractive laser ablation redistributes the corneal stiffness and how this affects the appearance of higher order aberrations such as coma.
On the other hand, one-dimension tensile creep and stress relaxation tests are usually performed to analyze the viscoelastic nature of the cornea [36,37]. SLSM allowed us to simulate feedback creep relaxation tests from calculated experimental data. The creep and relaxation responses of normal (mean value of 200 healthy subjects), ocular hypertensive and Ortho-K contact lens user were compared. The patient with ocular hypertension showed a drastically reduced response in both creep and relaxation responses compared with normal eyes; however, the Ortho-K user showed a weak and reduced response in the creep response only.
The results obtained in the creep relaxation tests can help to better understand the management of glaucoma and the biomechanical impact of the use of Ortho-K contact lenses for the temporal correction of ametropia.
Finally, it is necessary to emphasize why it is clinically revelant to obtain the separated elastic and viscous components with respect to the viscoelastic measure. Elasticity and viscosity properties arise from different mechanisms governed by the structural arrangement of type-I fibrillary collagen at micro- and nanoscales. Low values of viscosity or elasticity cannot be detected in hysteresis measures and results, as both properties play potentially offsetting ways [19].
Then, let us supose that, under normal physiological conditions, the cornea exhibits a compensatory biomechanical mechanism in which the product E*Ƞ remains constant, that is, viscoelasticity is balanced by the individual contributions of the viscous and elastic components. In this sense, Figure 10a shows the product E*Ƞ for a range of IOP between 10 and 22 mmHg. It can be seen that, for an IOP range located aproximately between 14 and 16 mmHg, E*Ƞ is practically constant; however, outside that range, the trends are again reversed according to the results previously shown. Green and orange boxes delimit pairs of experimental values exhibiting a similar E*Ƞ product, which would be equivalent to presenting equal measures of viscoelasticity.
This would be a clinical disagreement, since the corresponding IOP values are at the extremes of the range. However, if the viscoelasticity is separated into its main components, the elastic and viscous parameters reveal significant differences that could be hidden in viscoelastic measures. While the values of the green and orange boxes appear similar in viscoelasticity (Figure 10a), the individual components of E and Ƞ reveal that the cornea becomes more elastic and less viscous as a result of the intraocular pressure.
It is well known that the measure of viscoelasticity (corneal hysteresis) is not strongly correlated to IOP [38]; a moderate correlation (R2 = −0.49) was found in this study. Low values of viscosity or elasticity cannot be detected in hysteresis measures, as both properties play potentially offsetting ways [19]. The improved outcomes of obtaining separated measures of elasticity and viscosity are directly related to glaucoma patients; lower measured values of CH can be clinically interpreted as a risk factor of glaucoma damage [ref]; however, the elasticity or viscosity can be a stronger contribution with the progression of glaucoma.
To conclude, we present a new methodology to experimentally calculate the separate corneal elasticity and viscosity components of the viscoelasticity measurement by feeding the standard linear solid model with experimental air-puff applanation tonometry and corneal Scheimplug imaging.
Ocular biomechanics is strongly affected by intraocular pressure. Low values of hysteresis should not be considered on their own as risk factors in glaucomatous optic neuropathy; however, the behaviors of the viscous and elastic components should be considered. For subthreshold IOP values of 14.45 mmHg, corneal hysteresis increases with elasticity and viscosity. However, for values above the IOP threshold, low values of viscoelasticity are related to an increase in the viscous and elastic components, with a clear predominance of the viscous property. Results also show that changes in corneal optical density and high-order aberrations can be reflected in both elastic and time-dependent biomechanical properties.

Author Contributions

Conceptualization, F.J.Á.; methodology, F.J.Á. and Ó.d.B.; software, F.J.Á.; validation, F.J.Á. and Ó.d.B.; formal analysis, F.J.Á. and Ó.d.B.; investigation, F.J.Á., Ó.d.B., M.C.M. and L.R.; resources, F.J.Á.; data curation, F.J.Á. and Ó.d.B.; writing—original draft preparation, F.J.Á. and Ó.d.B.; writing—review and editing, F.J.Á. and Ó.d.B.; visualization, L.R. and M.C.M.; supervision, F.J.Á.; project administration, F.J.Á.; funding acquisition, F.J.Á. All authors have read and agreed to the published version of the manuscript.

Funding

This research was funded by “Departamento de Ciencia, Universidad y Sociedad del Conocimiento del Gobierno de Aragón (research group E44−23R)”.

Institutional Review Board Statement

This study was conducted in accordance with the Declaration of Helsinki, and approved by the Ethics Committee of the Health Sciences Institute of Aragon, Spain. (protocol code: C.P.-C.I. PI20/377, date of approval: 14 July 2020).

Informed Consent Statement

Informed consent was obtained from all subjects involved in the study.

Data Availability Statement

Dataset is available upon reasonable request.

Conflicts of Interest

The authors declare no conflicts of interest.

References

  1. Meek, K.M. Corneal collagen–its role in maintaining corneal shape and transparency. Biophys. Rev. 2009, 1, 83–93. [Google Scholar] [CrossRef] [PubMed]
  2. Espana, E.M.; Birk, D.E. Composition, structure and function of the corneal stroma. Exp. Eye Res. 2020, 198, 108137. [Google Scholar] [CrossRef] [PubMed]
  3. Meek, K.M.; Knupp, C. Corneal structure and transparency. Prog. Retin. Eye Res. 2015, 49, 1–16. [Google Scholar] [CrossRef] [PubMed]
  4. Bell, J.S.; Hayes, S.; Whitford, C.; Sanchez-Weatherby, J.; Shebanova, O.; Terrill, N.J.; Sørensen, T.L.M.; Elsheikh, A.; Meek, K.M. Tropocollagen springs allow collagen fibrils to stretch elastically. Acta Biomater. 2022, 142, 185–193. [Google Scholar] [CrossRef] [PubMed]
  5. Chong, J.; Dupps, W.J., Jr. Corneal biomechanics: Measurement and structural correlations. Exp. Eye Res. 2021, 205, 108508. [Google Scholar] [CrossRef] [PubMed]
  6. Wilson, A.; Marshall, J. A review of corneal biomechanics: Mechanisms for measurement and the implications for refractive surgery. Indian J. Ophthalmol. 2020, 68, 2679–2690. [Google Scholar] [PubMed]
  7. Marinescu, M.; Dascalescu, D.; Constantin, M.; Coviltir, V.; Burcel, M.; Darabus, D.; Ciuluvica, R.; Stanila, D.; Potop, V.; Alexandrescu, C. Corneal Biomechanics—An Emerging Ocular Property with a Significant Impact. Maedica 2022, 17, 925–930. [Google Scholar] [PubMed]
  8. Kaushik, S.; Pandav, S.S. Ocular Response Analyzer. J. Curr. Glaucoma Pract. 2012, 6, 17–19. [Google Scholar] [CrossRef] [PubMed]
  9. Lan, G.; Twa, M.D.; Song, C.; Feng, J.; Huang, Y.; Xu, J.; Qin, J.; An, L.; Wei, X. In vivo corneal elastography: A topical review of challenges and opportunities. Comput. Struct. Biotechnol. J. 2023, 21, 2664–2687. [Google Scholar] [CrossRef]
  10. Eltony, A.M.; Shao, P.; Yun, S.H. Measuring mechanical anisotropy of the cornea with Brillouin microscopy. Nat. Commun. 2022, 13, 1354. [Google Scholar] [CrossRef]
  11. Terai, N.; Raiskup, F.; Haustein, M.; Pillunat, L.E.; Spoerl, E. Identification of biomechanical properties of the cornea: The ocular response analyzer. Curr. Eye Res. 2012, 37, 553–562. [Google Scholar] [CrossRef] [PubMed]
  12. Salouti, R.; Bagheri, M.; Shamsi, A.; Zamani, M. Corneal Parameters in Healthy Subjects Assessed by Corvis ST. J. Ophthalmic Vis. Res. 2020, 15, 24–31. [Google Scholar] [CrossRef] [PubMed]
  13. Yun, S.H.; Chernyak, D. Brillouin microscopy: Assessing ocular tissue biomechanics. Curr. Opin. Ophthalmol. 2018, 29, 299–305. [Google Scholar] [CrossRef] [PubMed]
  14. Zhang, H.; Asroui, L.; Tarib, I.; Dupps, W.J., Jr.; Scarcelli, G.; Randleman, J.B. Motion-Tracking Brillouin Microscopy Evaluation of Normal, Keratoconic, and Post-Laser Vision Correction Corneas. Am. J. Ophthalmol. 2023, 254, 128–140. [Google Scholar] [CrossRef] [PubMed]
  15. Ávila, F.J.; Marcellán, M.C.; Remón, L. In Vivo Biomechanical Response of the Human Cornea to Acoustic Waves. Optics 2023, 4, 584–594. [Google Scholar] [CrossRef]
  16. Kobayashi, A.S.; Staberg, L.G.; Schlegel, W.A. Viscoelastic properties of human cornea. Exp. Mech. 1973, 13, 497–503. [Google Scholar] [CrossRef]
  17. Lakes, R.S. Viscoelastic Solids; CRC Press: Boca Raton, FL, USA, 1999; pp. 15–61. [Google Scholar]
  18. Zimprich, L.; Diedrich, J.; Bleeker, A.; Schweitzer, J.A. Corneal Hysteresis as a Biomarker of Glaucoma: Current Insights. Clin. Ophthalmol. 2020, 14, 2255–2264. [Google Scholar] [CrossRef] [PubMed]
  19. Glass, D.H.; Roberts, C.J.; Litsky, A.S.; Weber, P.A. A Viscoelastic Biomechanical Model of the Cornea Describing the Effect of Viscosity and Elasticity on Hysteresis. Investig. Ophthalmol. Vis. Sci. 2008, 49, 3919–3926. [Google Scholar] [CrossRef] [PubMed]
  20. Su, P.; Yang, Y.; Xiao, J.; Song, Y. Corneal hyper-viscoelastic model: Derivations, experiments, and simulations. Acta Bioeng. Biomech. 2015, 17, 73–84. [Google Scholar]
  21. Whitford, C.; Movchan, N.V.; Studer, H.; Elsheikh, A. A viscoelastic anisotropic hyperelastic constitutive model of the human cornea. Biomech. Model. Mechanobiol. 2018, 17, 19–29. [Google Scholar] [CrossRef]
  22. Ahmed, H.M.; Salem, N.M.; Al-Atabany, W. Human cornea thermo-viscoelastic behavior modelling using standard linear solid model. BMC Ophthalmol. 2023, 23, 250. [Google Scholar] [CrossRef] [PubMed]
  23. Kelly, P. Solid Mechanics Part I: An Introduction to Solid Mechanics Solid Mechanics Lecture Notes University of Auckland. 2013. Available online: https://pkel015.connect.amazon.auckland.ac.nz/SolidMechanicsBooks/Part_I/index.html (accessed on 29 April 2024).
  24. Liu, J.; Roberts, C.J. Influence of corneal biomechanical properties on intraocular pressure measurement: Quantitative analysis. J. Cataract. Refract. Surg. 2005, 31, 146–155. [Google Scholar] [CrossRef] [PubMed]
  25. Brinson, H.F.; Brinson, L.C. Polymer Engineering Science and Viscoelasticity; Springer: Berlin/Heidelberg, Germany, 2008. [Google Scholar]
  26. Jannesari, M.; Mosaddegh, P.; Kadkhodaei.; Kasprzak, H.; Jabbarvand Behrouz, M. Numerical and clinical investigation on the material model of the cornea in Corvis tonometry tests: Differentiation between hyperelasticity and viscoelasticity. Mech. Time Depend. Mater. 2018, 23, 373–384. [Google Scholar] [CrossRef]
  27. Barco, O.; Ávila, F.J.; Marcellán, C.; Remón, L. Corneal retardation time as an ocular hypertension disease indicator. Biomed. Phys. Eng. Express 2024, 10, 015014. [Google Scholar] [CrossRef] [PubMed]
  28. Deol, M.; Taylor, D.A.; Radcliffe, N.M. Corneal hysteresis and its relevance to glaucoma. Curr. Opin. Ophthalmol. 2015, 26, 96–102. [Google Scholar] [CrossRef] [PubMed]
  29. Mikula, E.R.; Jester, J.V.; Juhasz, T. Measurement of an Elasticity Map in the Human Cornea. Investig. Ophthalmol. Vis. Sci. 2016, 57, 3282–3286. [Google Scholar] [CrossRef] [PubMed]
  30. Rahmati, S.M.; Razaghi, R.; Karimi, A. Biomechanics of the keratoconic cornea: Theory, segmentation, pressure distribution, and coupled FE-optimization algorithm. J. Mech. Behav. Biomed. Mater. 2021, 113, 104155. [Google Scholar] [CrossRef] [PubMed]
  31. Francis, M.; Matalia, H.; Nuijts, R.M.M.A.; Haex, B.; Shetty., R.; Sinha Roy, A. Corneal Viscous Properties Cannot Be Determined From Air-Puff Applanation. J. Refract. Surg. 2019, 35, 730–736. [Google Scholar] [CrossRef] [PubMed]
  32. Dana, D.; Mihaela, C.; Raluca, I.; Miruna, C.; Catalina, I.; Miruna, C.; Schmitzer, S.; Catalina, C. Corneal hysteresis and primary open angle glaucoma. Rom. J. Ophthalmol. 2015, 59, 252–254. [Google Scholar]
  33. Nossair, A.A.; Kassem, M.K.; Eltanamly, R.M.; Alahmadawy, Y.A. Corneal Hysteresis, Central Corneal Thickness, and Intraocular Pressure in Rheumatoid Arthritis, and Their Relation to Disease Activity. Middle East Afr. J. Ophthalmol. 2021, 28, 174–179. [Google Scholar]
  34. Murtagh, P.; O’Brien, C. Corneal Hysteresis, Intraocular Pressure, and Progression of Glaucoma: Time for a “Hyst-Oric” Change in Clinical Practice? J. Clin. Med. 2022, 11, 2895. [Google Scholar] [CrossRef] [PubMed]
  35. Blanco-Dominguez, I.; Duch, F.; Reyes, J.; Polo, V.; Abad, J.M.; Gomez-Barrera, M.; Olate-Perez, Á. Permanent corneal opacification after refractive surgery with a combined technique: Photorefractive keratectomy (PRK) and accelerated cross-linking (PRK Xtra) in healthy patients. J. Français D’ophtalmologie 2021, 44, e141–e143. [Google Scholar] [CrossRef] [PubMed]
  36. Abyaneh, M.H.; Wildman, R.D.; Ashcroft, I.A.; Ruiz, P.D. A hybrid approach to determining cornea mechanical properties in vivo using a combination of nano-indentation and inverse finite element analysis. J. Mech. Behav. Biomed. Mater. 2013, 27, 239–248. [Google Scholar] [CrossRef] [PubMed]
  37. Lombardo, G.; Serrao, S.; Rosati, M.; Lombardo, M. Analysis of the viscoelastic properties of the human cornea using Scheimpflug imaging in inflation experiment of eye globes. PLoS ONE 2014, 9, e112169. [Google Scholar] [CrossRef]
  38. Touboul, D.; Roberts, C.; Kérautret, J.; Garra, C.; Maurice-Tison, S.; Saubusse, E.; Colin, J. Correlations between corneal hysteresis, intraocular pressure, and corneal central pachymetry. J. Cataract. Refract. Surg. 2008, 34, 616–622. [Google Scholar] [CrossRef]
Figure 1. Representation of three elements of the standard linear solid model. E, Ƞ, σ and ε correspond to elasticity, viscosity, applied stress and induced strain, respectively.
Photonics 11 00524 g001
Figure 2. (a) Representation of the ocular anterior chamber during air-puff tonometry. S0 and Rcor correspond to the sagitta of the area of air jet application and corneal curvature radius before applanation. (b) At the first applanation event, Sapp = −S0. The diameter of the area of applanation if given by 2·Xcor. (c) Representation of the applanation/pressure signals during air-puff tonometry ORA measurement. P1, P2, CH, σ ˙ a p 1 and σ ˙ a p 2 are the first and second applanation pressures, corneal hysteresis and first and second pressure rates at the moment of the two applanation events, respectively.
Photonics 11 00524 g002
Figure 3. CH as a function of the IOPcc for all participants involved in the study. The blue line corresponds to the best linear fitting of the negative correlation found between both variables.
Photonics 11 00524 g003
Figure 4. Elasticity (a) and viscosity (b) as a function of the intraocular pressure. The blue lines correspond to the piecewise linear fitted intervals. The green and blue boxes indicate the minimum (IOPmin) and maximum (IOPmax) IOP of the intervals separated by the IOP threshold (IOPu).
Photonics 11 00524 g004
Figure 5. Elasticity as a function of the retardation time. The red dotted line indicates the threshold retardation time (τU) separating the trend intervals.
Photonics 11 00524 g005
Figure 6. CH as a function of viscosity (a) and elasticity (b) for retardation time values below the thresold (τu) and CH versus Ƞ (c) and E (d) for suprathreshold τ values.
Photonics 11 00524 g006
Figure 7. Optical density values as a function of the viscous component. Green lines correspond to the statistical linear fitting (R2 = 0.28, p < 0.001).
Photonics 11 00524 g007
Figure 8. Coma high-order term as a function of elasticity (a) and corneal retardation time (b). Red lines correspond to the best linear fittings of the data.
Photonics 11 00524 g008
Figure 9. Comparative creep (a) and relaxation (b) tensile tests for normal corneas (blue curve), an ocular hypertensive patient (red curve) and an Ortho-K contact lens user (orange curve).
Photonics 11 00524 g009
Figure 10. E*Ƞ as a function of the IOP (a) and averaged values of E and Ƞ corresponding to the green and orange boxes marked (b), respectively.
Photonics 11 00524 g010
Table 1. Geometrical (Rcor, CCT), optical (OD, SA, trefoil and coma) and biomechanical parameters (IOPcc and CH) measured for morphometric, optical and biomechanical corneal assessment.
Parameter [Units]TechnologyDescription
Rcor (mm)Dual Scheimpflug analyzerMean corneal radii
2·Xcor (mm)Dual Scheimpflug analyzerCorneal applanation diameter
CCT (μm)Dual Scheimpflug analyzerCentral corneal thickness
OD (n.u)Dual Scheimpflug analyzerOptical density
SA (μm)Dual Scheimpflug analyzerSpherical aberration
Trefoil (μm)Dual Scheimpflug analyzerTrefoil term
Coma (μm)Dual Scheimpflug analyzerComa term
IOPcc (mmHg)ORACorneal-compensated intraocular pressure
CH (mmHg)ORACorneal hysteresis
Table 2. (a) Mean values (±standard deviation) for the corneal-compensated intraocular pressure (IOPcc), central corneal thickness (CCT), corneal radius (Rcor), corneal hysteresis (CH), elasticity (E), viscosity (Ƞ) and tau (τ) parameters. (b) Mean values (± standard deviation) for the OD, SA, trefoil and coma of all participating subjects.
(a)
IOPcc (mmHg)CCT
(μm)
Rcor
(mm)
CH
(mmHg)
E
(KPa)
Ƞ
(Pa· s)
Τ
(ms)
16.51 ± 2.32555.75 ± 29.497.89 ± 0.309.78 ± 1.163.44 ± 2.673.57 ± 2.391.12 ± 0.13
(b)
OD (pd/μm)SA (μm)Trefoil (μm)Coma (μm)
0.034 ± 0.004−0.15 ± 0.080.19 ± 0.130.27 ± 0.14
Table 3. Elasticity (E) and viscosity (Ƞ) for a normal cornea (mean value of 200 healthy subjects), for an ocular hypertensive patient and a healthy Ortho-K contact lens wearer.
Normal
Cornea
Ocular Hypertensive Ortho-K User
E (Kpa)3.4413.233.13
Ƞ (Pa · s)3.578.623.47
Disclaimer/Publisher’s Note: The statements, opinions and data contained in all publications are solely those of the individual author(s) and contributor(s) and not of MDPI and/or the editor(s). MDPI and/or the editor(s) disclaim responsibility for any injury to people or property resulting from any ideas, methods, instructions or products referred to in the content.

