Abstract
This research explores novel avenues for optimizing mosquito-catching efficiency using a multifaceted approach. While previous studies have primarily focused on singular parameters, such as light intensity or wind speed, this study delves into the intricate interplay between various factors. Experiment 1 challenges conventional wisdom by revealing a wider light divergence angle. When the reflective plate combined with the airflow board was set to 0 cm in length, the effectiveness of capturing mosquitoes was lower than that of the 3 cm unit, suggesting overlooked variables at play. Experiment 2 introduces a novel perspective by demonstrating the superior efficiency of the 5 cm unit, even with reduced wind speed and luminous area under optimized conditions, showcasing the significance of a holistic approach. Moreover, Experiment 3 uncovers nuanced insights, showcasing the differential performance of units in capturing small insects versus mosquitoes and moths, highlighting the need for tailored strategies. By integrating these findings, the study pioneers the development of two distinct mosquito collection units, emphasizing the critical importance of balancing diverse parameters for optimal results. The innovation lies in the thorough investigation of multifaceted optimization strategies, providing valuable insights to propel advancements in mosquito control technologies.
1. Introduction
Mosquito traps are utilized across various applications, characterized by varying performances, structures, and operational methodologies, presenting multiple specifications. Consequently, the selection of mosquito traps predominantly relies on exploiting mosquitoes’ nocturnal, phototactic, and carbon dioxide-seeking tendencies to entice them through the lamp tube, ultimately aiming for effective mosquito eradication [1,2]. The electric shock variant, often referred to as the traditional mosquito trap lamp, attracts mosquitoes to its vicinity. Upon proximity, mosquitoes come into contact with an external high-voltage electric shock net, leading to instantaneous combustion, thus achieving the intended objective of mosquito elimination [3,4]. The inhalation type, alternatively referred to as the light kinetic energy mosquito trapping lamp, operates on a distinct mechanism [5]. When the emitted light lures mosquitoes, their innate tendency to fly with the wind becomes advantageous. As mosquitoes approach areas with heightened wind velocity, they are drawn towards the airflow and subsequently entrapped by the fan. Consequently, mosquitoes are trapped within collection barrels until desiccated and deceased [6,7]. Hence, the optimal efficacy of this trap type hinges upon both its structural configuration and the particular environmental contexts in which it is utilized. Mosquito attraction predominantly hinges upon three pivotal factors: visual stimuli, olfactory cues, and ambient temperature. Presently, mosquito-repelling products predominantly exploit ultraviolet (UV) light to entice mosquitoes, capitalizing on their visual acuity and phototactic tendencies [8,9]. Nonetheless, the efficacy of these approaches remains inconsistent. The objective of this investigation is to pioneer novel mosquito-trapping apparatuses. This study endeavors to harness the potential of a newly proposed secondary freeform lens (SFL) to meticulously manipulate UV LED light, thereby augmenting mosquito attraction and control methodologies with precision and efficacy [10].
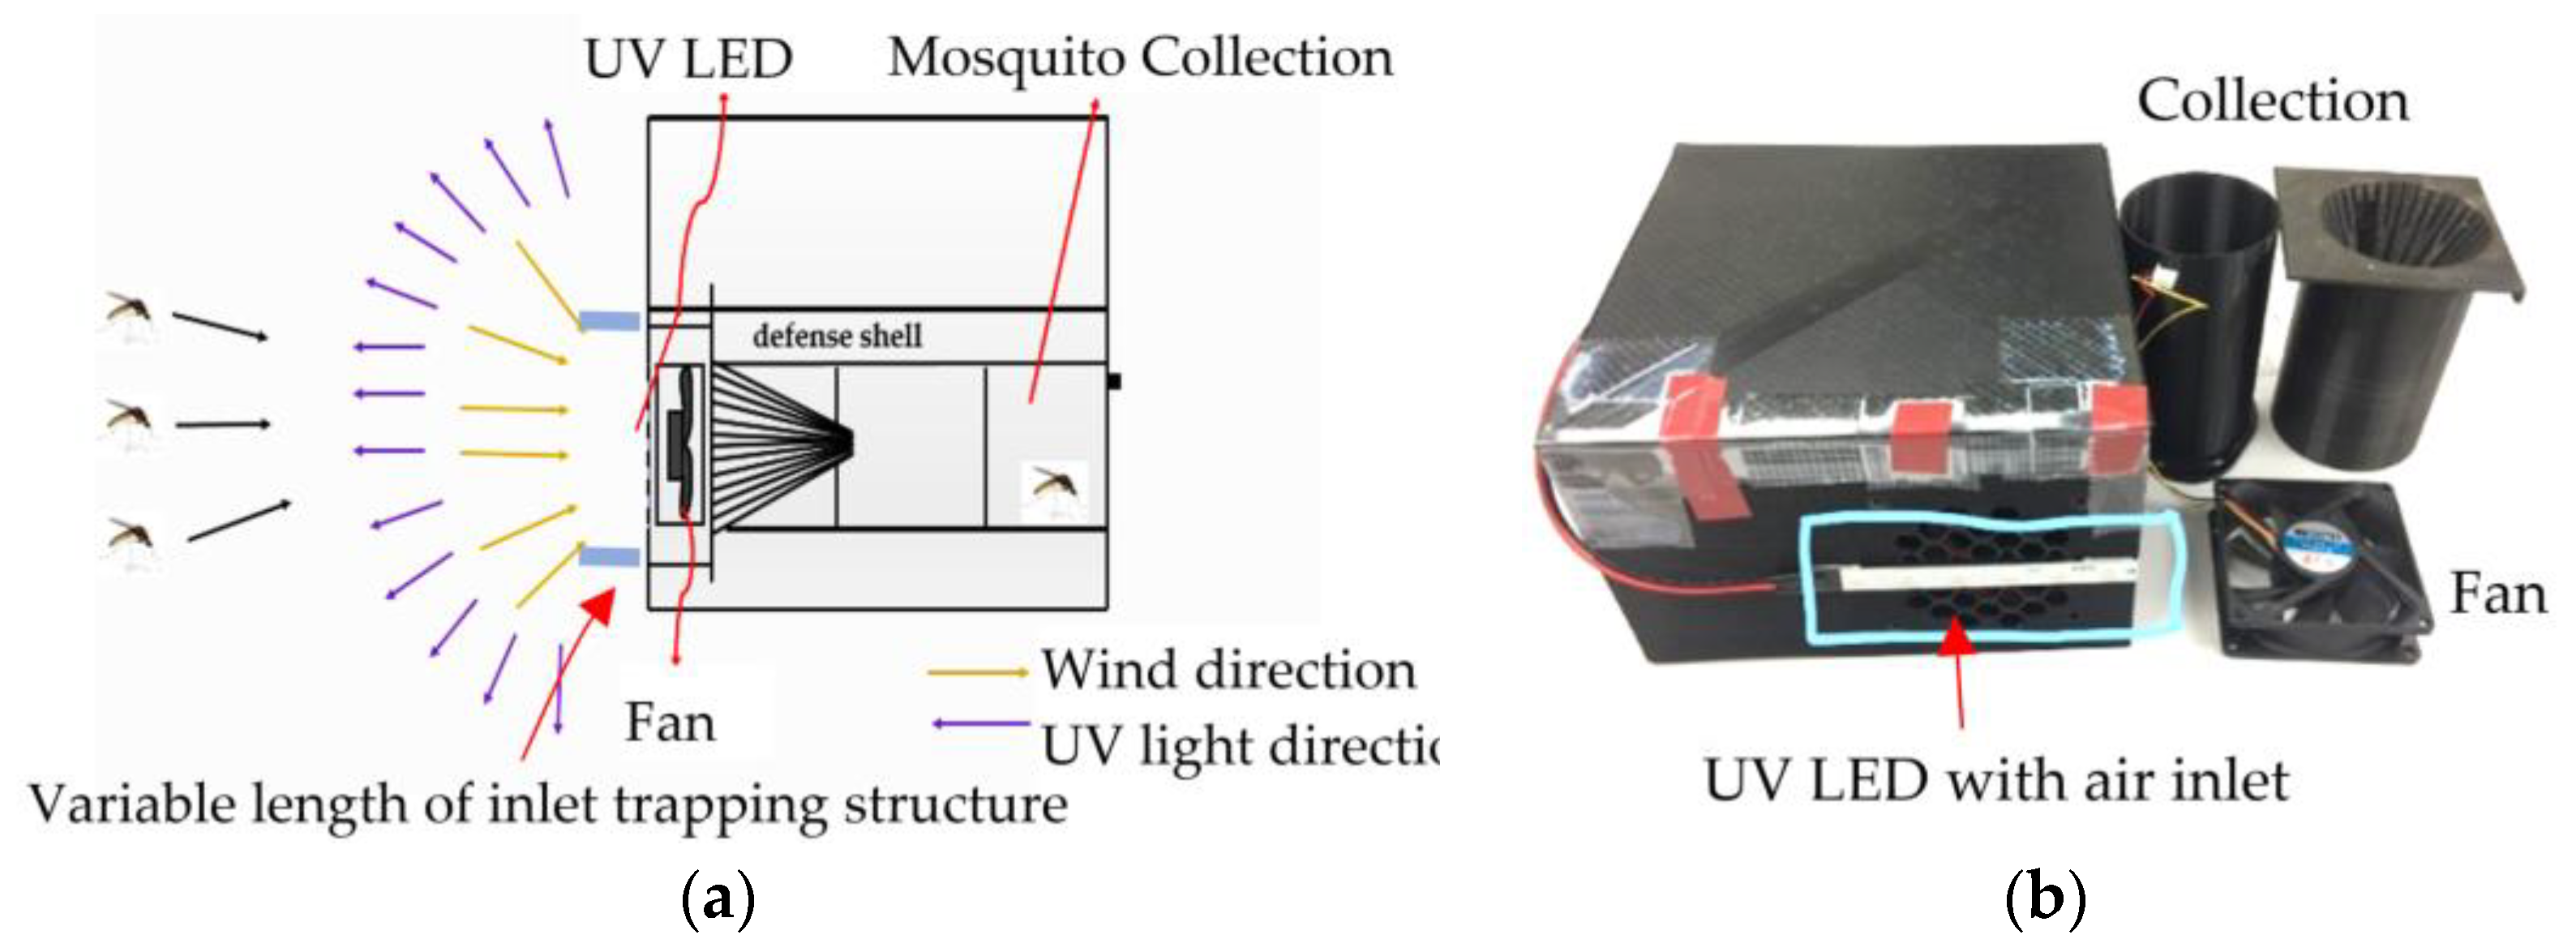
The working principle of the mosquito trapping device is depicted in Figure 1a, and the actual design model using the Bambu lab 3D printer is shown in Figure 1b. Mosquitoes perceive the emitted UV LED from a distance and are attracted to its light, guiding them to the vicinity of the mosquito lamp. Upon nearing the lamp, the mosquitoes are drawn into the mosquito collection bucket by the suction generated from the wind through the air outlet. Following this, after a duration spent within the mosquito barrel, the mosquitoes undergo desiccation, ultimately resulting in their demise [11].

Figure 1.
(a) The working principle of the experimental mosquito trap device and (b) the Empirical Design Model.
2. Mosquito Trap System Design Methods
2.1. Design of Mosquito Components and Simulation of Wind Field and Light Field in Mosquito Trap Systems
At the outset, the conditions governing the design of the components of the mosquito trap are elucidated, following which the wind field simulation and the light field simulation of the mosquito trap are partitioned into two distinct segments. The primary segment is dedicated to examining the wind field of the system, employing flow simulation techniques for fluid dynamics analysis while monitoring variations in velocity. Subsequently, the secondary segment employs the light field system for simulation, leveraging Trace Pro to generate the light pattern and scrutinizing alterations in the light pattern’s angle and intensity.
2.2. Statistics and Analysis of Real-World Field Measurements and the Effective Capture of Mosquitoes
After simulating the light pattern process, a one-dimensional light distribution curve meter is utilized to measure the light pattern, thereby confirming the consistency of its alterations. After confirming their consistency, mosquitoes are captured, systematically tallying the captured specimens and conducting analyses on their quantities under diverse conditions. This endeavor aims to ascertain the most effective mosquito-collecting components, advancing toward the ultimate goal.
Light traps are readily accessible and are pivotal in cost reduction for prevention and control measures. A plethora of lighting options are tailored for trapping and eradicating insects. Any light source capable of illumination can be harnessed for this purpose, albeit with discernible performance discrepancies. Among the frequently utilized light bulbs are incandescent, black, high-pressure sodium, fluorescent, and LED lamps. The visual reaction of insects to light has spurred a scholarly investigation into the effectiveness of various lighting alternatives [12].
Dufay observed the phototaxis of eight species of noctuids within the range of 365–675 nm, revealing wavelength peaks at 365 nm, 450 nm, and 525 nm, respectively. This observation further elucidates the inconsistent responses to wavelengths among different species of noctuids. Ding Yanqin conducted 13 monochromatic light behavior selection experiments in a separate study on the cotton gnat moth. The findings indicated higher response rates to wavelengths in the ultraviolet spectrum, particularly at 333 nm and 383 nm. A heightened response rate was also observed for the 405 nm monochromatic light within the visible light range. However, the response rate to 405 nm is lower compared to ultraviolet light. Li Dianmo et al. observed variations in the intensity of reflected light from the compound eyes of P. tabacum worms and discerned individual differences in the conversion rate of compound eyes to nocturnal vision. Consequently, it was postulated that the compound eyes of different individuals may manifest varying degrees of sensitivity and resistance to light during nightfall. Furthermore, in the analysis of monochromatic light, a notable change rate induced by 405 nm was observed, corroborating the research findings of Ding Yanqin and others. This alignment underscores the consistency among the research findings [13]. However, many insects are most attracted to wavelengths in the range of 300 to 400 nm, which falls within the UV-A spectrum. The common insect-attracting devices, such as bug zappers and insect traps, typically use UV-A light waves to lure insects. UV light within this wavelength range is particularly attractive to insects due to their heightened sensitivity to it. In the experiment, no disparity was observed in the rate of change induced by the wavelengths, implying that the tolerance of Night Eyes to wavelengths does not singularly determine wavelength selection. Li Dianmo and colleagues also reached a similar conclusion. Additionally, the experiments revealed that more profound conversion results in diminished phototaxis. There seems to be a preference for wavelengths around 400–405 nm. This study designed a wavelength of 400 nm to achieve the wavelength for attracting insects.
2.2.1. System Wind Field and Light Field Simulation
During the design phase of the LED mosquito trapping system’s mosquito trapping components, the primary aim is to elevate the mosquito-trapping efficiency of the existing system while concurrently boosting wind speed [14,15]. This enhancement is pursued to escalate wind intensity outside the air inlet without a commensurate increase in power consumption, thereby facilitating long-distance amplification for more effective mosquito capture. Furthermore, augmenting light intensity aims to enlarge the luminous area, enabling mosquitoes to perceive the light from a greater distance and thus enhancing the overall efficacy of mosquito collection [16,17].
2.2.2. Experimental Flow Chart
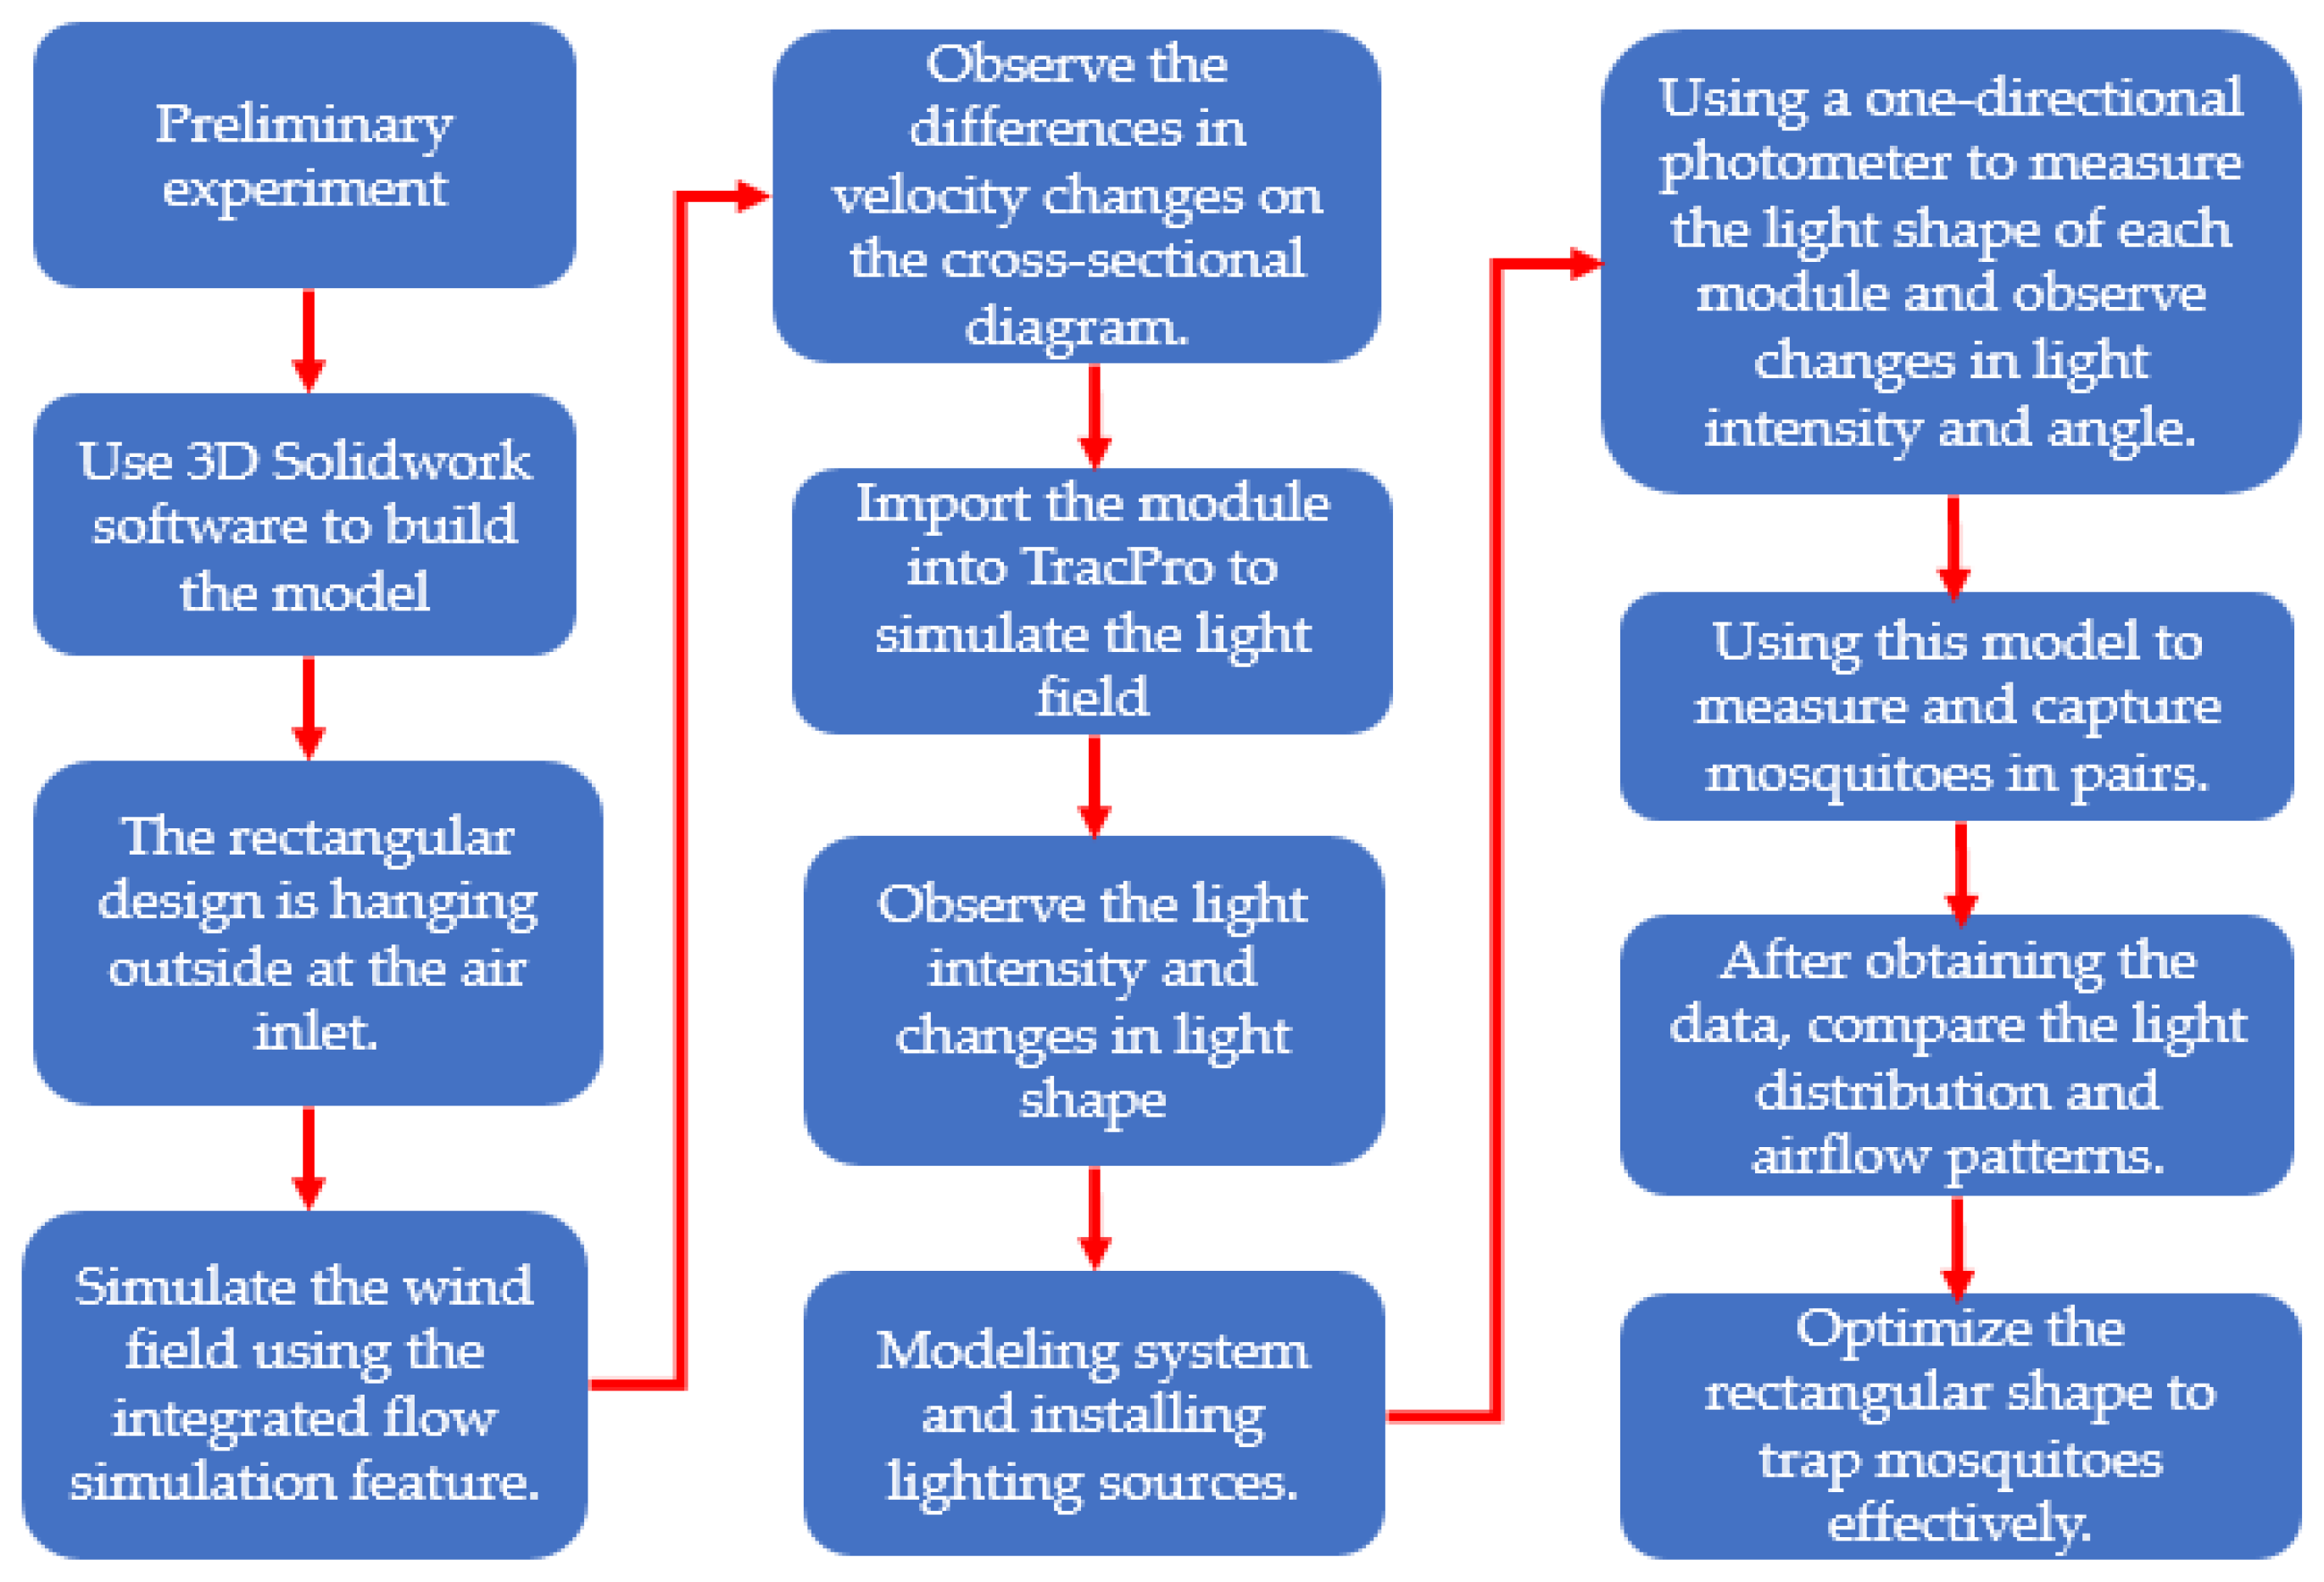
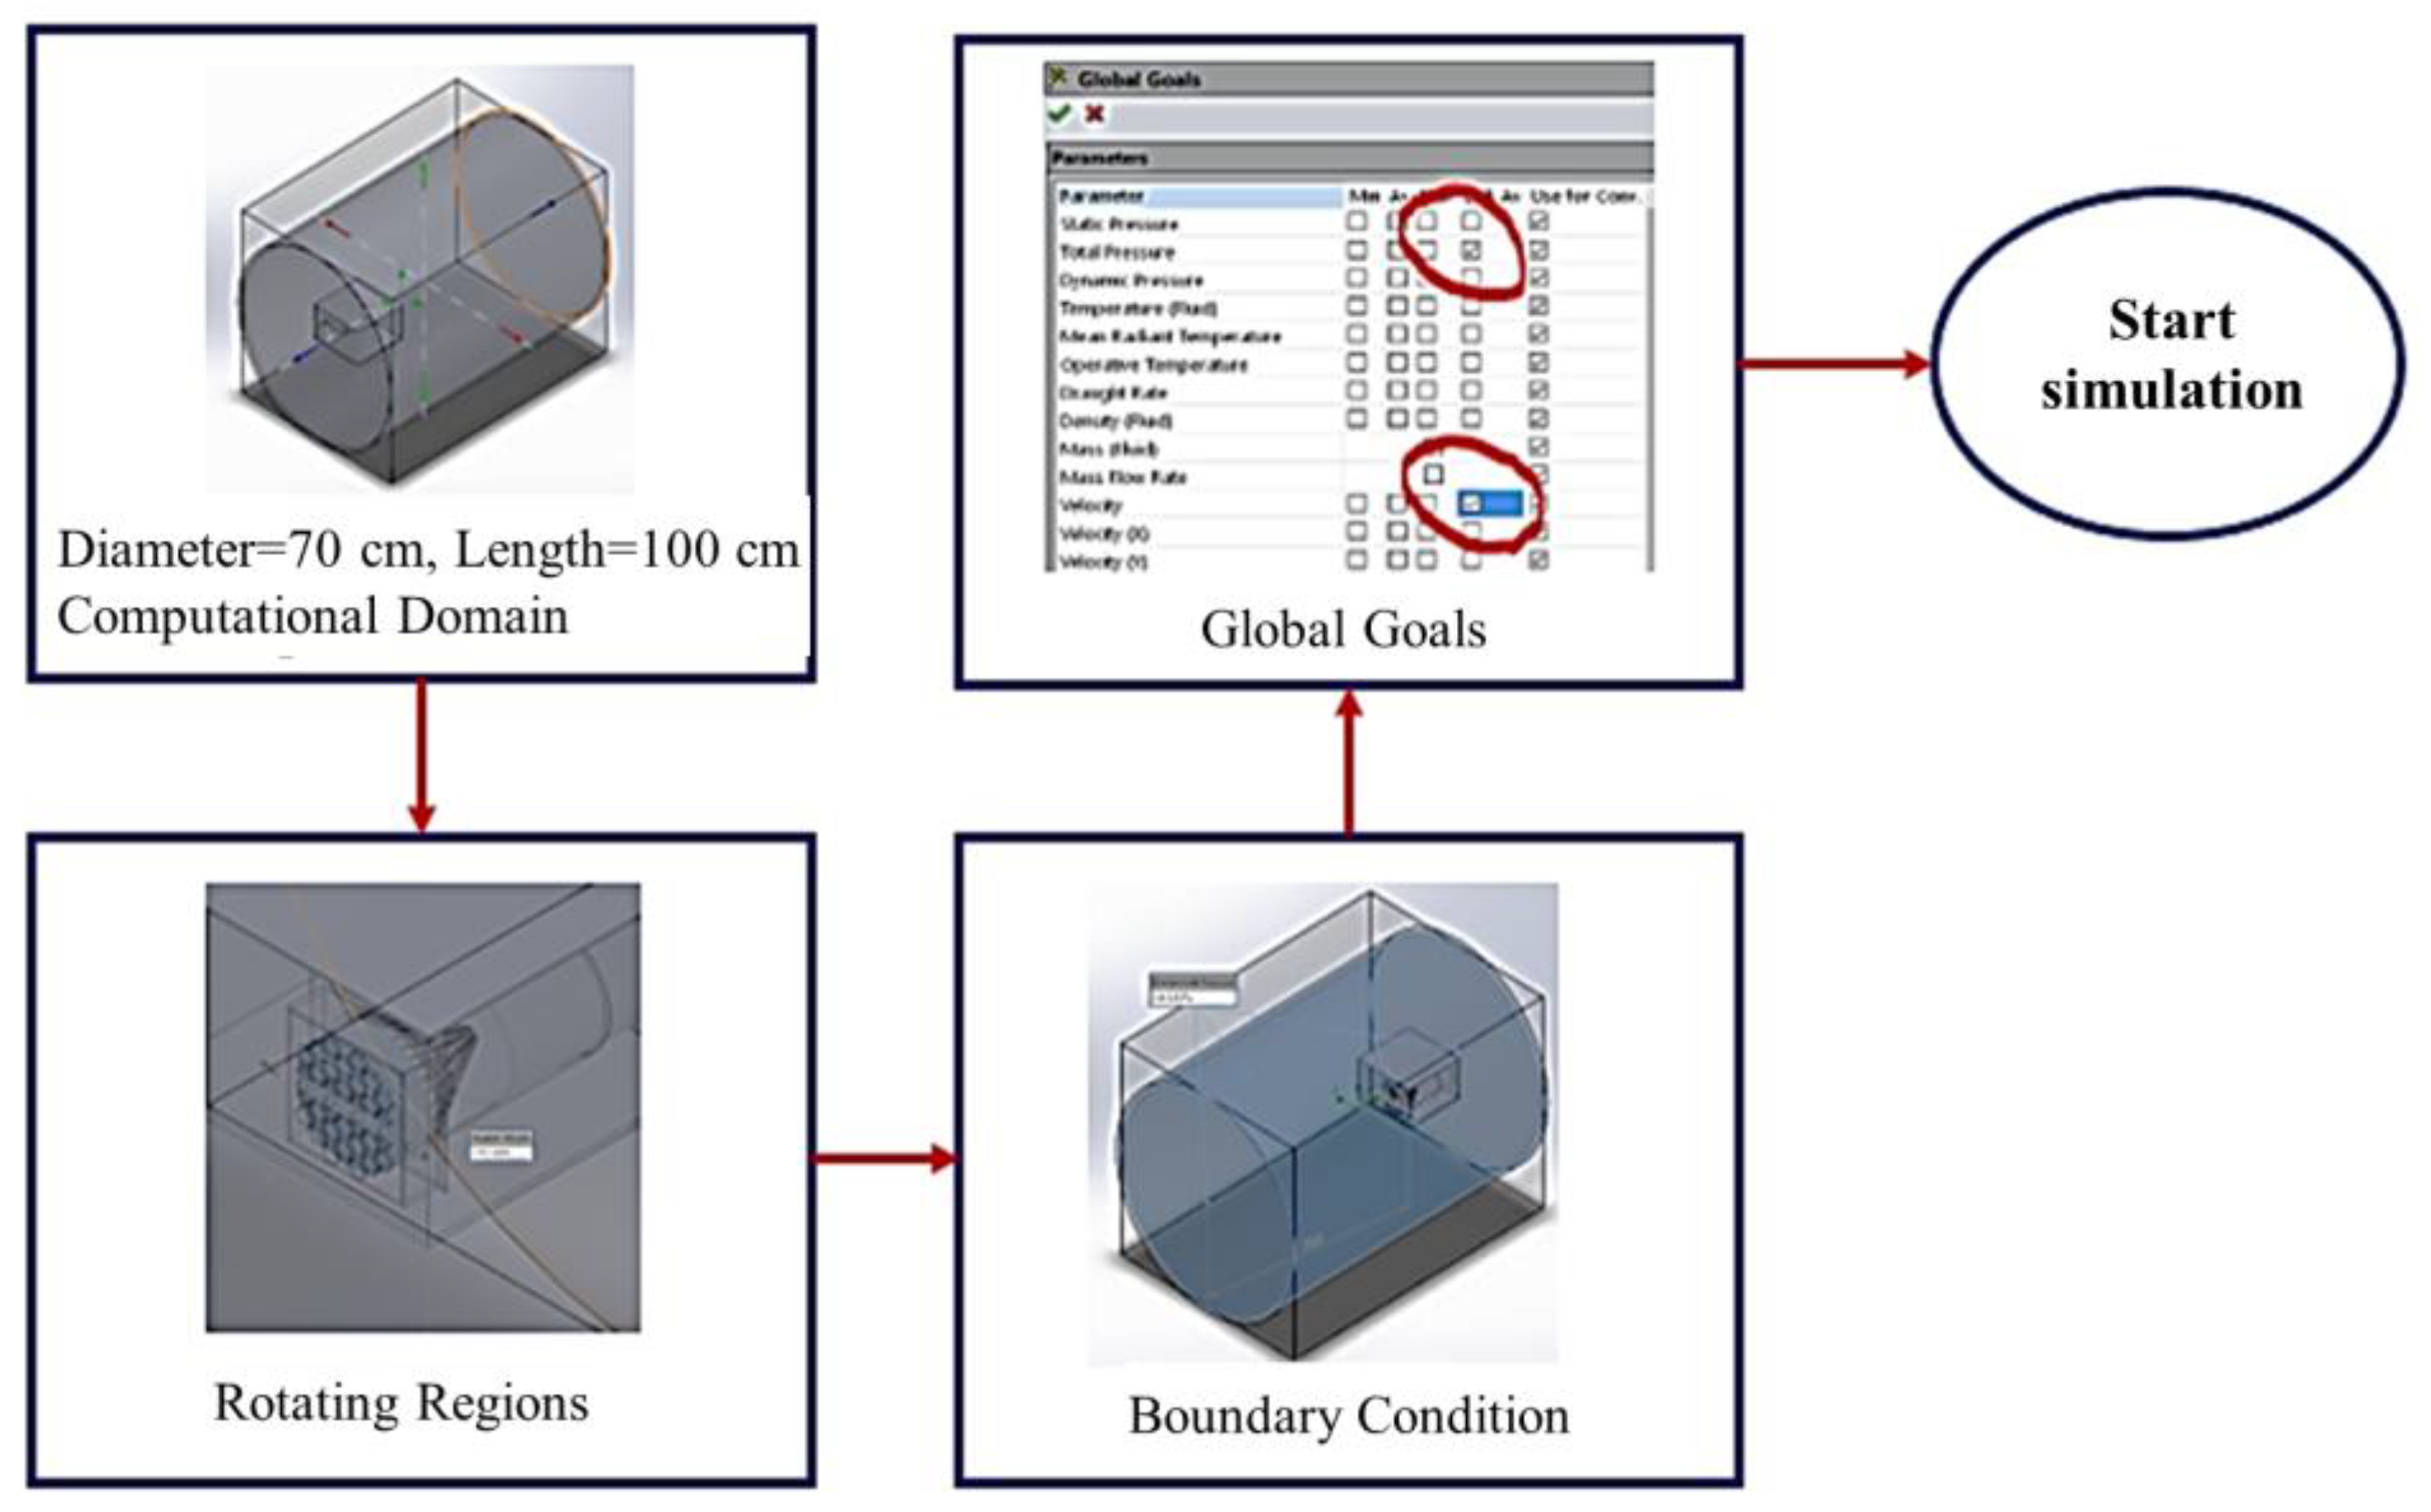
The experimental process is depicted in Figure 2. Solidworks is employed to construct the system module and devise the mosquito-collecting apparatus. For the existing mosquito trapping system, the simulation phase utilizes Solidworks’ built-in flow simulation function to model the wind field fluid, observe velocity variations, and employ Tracepro for light field simulation to observe changes in light intensity within the light pattern [18,19]. To verify the consistency of the light pattern, physical modules are fabricated and equipped with light sources. Subsequently, a one-dimensional light meter is employed to measure the light pattern, which is then compared with the simulated light pattern. Following confirmation of consistency, mosquitoes are captured in pairs. Upon obtaining mosquito data, the simulated light pattern is compared with wind speed diagrams to elucidate factors contributing to enhanced mosquito trapping capability. This approach aims to achieve optimal mosquito-trapping efficiency. To ensure the consistency of the light pattern, the following protocol must be followed: following the production of the physical module, the light source must be installed. A one-dimensional light meter is to be employed to measure the light pattern, subsequently comparing it with the simulated light pattern [20]. Upon confirmation of consistency, mosquitoes are to be measured and captured in pairs. After acquiring mosquito data, a comparison between the type of mosquitoes and the wind speed diagram is to be conducted to ascertain reasons for the observed increase in mosquito trapping ability. By implementing these steps, the study can effectively optimize mosquito trapping components.
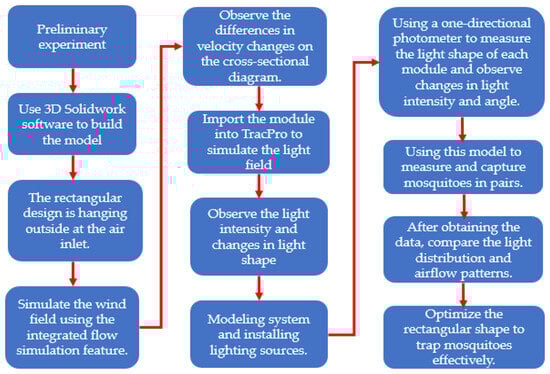
Figure 2.
Description of design process and experiments.
The outgoing surface of the asymmetric freeform lens is responsible for refracting its incident light to achieve the design targets. The light that is refracted by the outgoing surface is governed by Snell’s law. The vector equation for Snell’s law is expressed as follows:
In this context, ‘O’ signifies the refraction unit vector, ‘I’ represents the incident unit vector, ‘nI’ denotes the refractive index of the incident within the lens, ‘n0’ stands for the refractive index of reflection within the lens, and ‘N’ denotes the normal vector corresponding to the incident and refraction vectors. The normal vector ‘N’ can be determined using the following equation:
Can a mosquito trap device, designed considering Snell’s law, conservation law, and the Total Internal Reflection (TIR) method, fulfill the lighting requirements? Is fabricating an LED utilizing MOSQUITOS modules that meet the specified criteria feasible? Is there a novel design for an anti-glare LED table lamp? Furthermore, our optical simulations were conducted to optimize the Light Intensity Distribution Curve (LIDC). How do the measured module results compare with the simulated outcomes?
2.2.3. Pre-Test and Results of System Optimization for UV LED Mosquito Trapping System
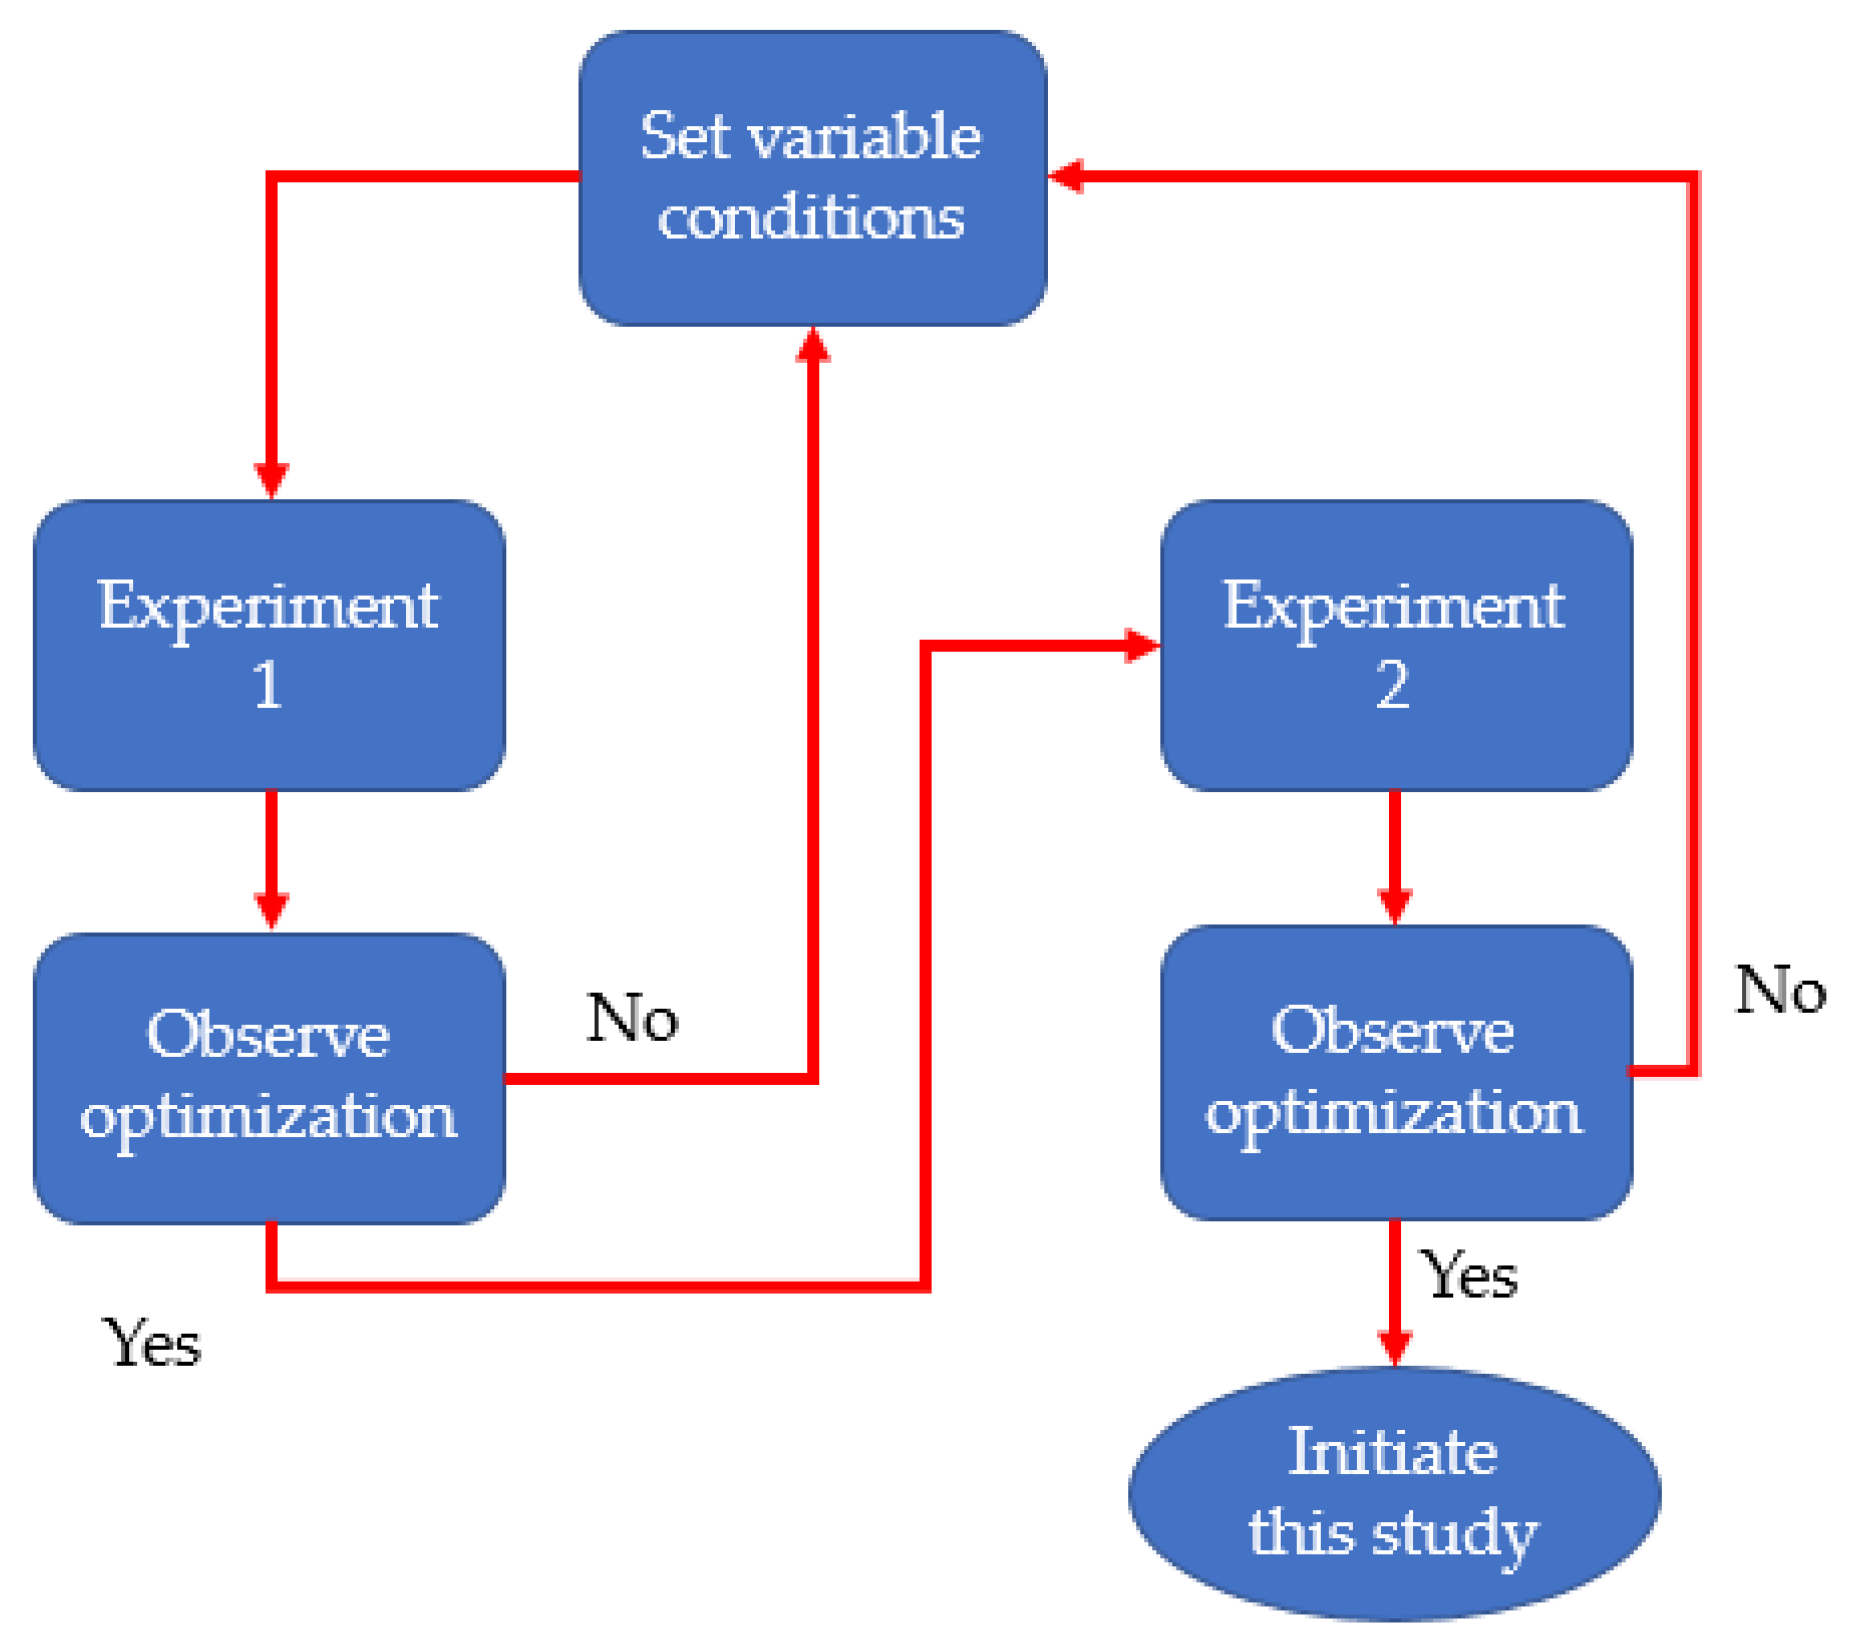
This study encompasses a preliminary experiment to verify the feasibility of optimizing mosquito-trapping efficiency through the proposed concept. The experiment primarily employs a reflective sheet. The flowchart detailing the pre-test procedure is depicted in Figure 3.

Figure 3.
Flowchart of pre-test.
The pre-test consists of two distinct parts: pre-test 1 and pre-test 2. In pre-test 1, three groups of existing inhalation mosquito lamps are employed, designated as unit 1 in the experiment. Meanwhile, unit 2 incorporates a module featuring a concave air inlet designed to augment suction. Further enhancement is achieved by integrating a reflector directly beneath the UV LED at the air inlet. This reflects light otherwise wasted on the ground, conserving energy and bolstering overall efficiency. Moreover, the luminous area is expanded. The experimental procedure for this unit is outlined as follows:
In Experiment 1, the formula used is the mosquito capture amount of unit 2/unit one mosquito capture rate, which is the better wind power divided by the original unit. So, if the value is greater than 1, it is optimized. The obtained value is 2, so it can be seen that the increase in wind force can increase mosquito capture and mosquito performance.
In experiment 2, the formula used is the mosquito capture amount of unit 2/mosquito capture amount of unit 3, which is the better wind power divided by the original unit equipped with reflective sheets. If the value is less than 2, it is optimized, and the value is 1, which can be obtained from experiment 2. The ability to collect mosquitoes increases when the light intensity and light-emitting area increase.
The test results reveal that including reflectors in the mosquito trap significantly influences mosquito collection efficacy. Furthermore, it is noted that altering the air inlet to enhance suction plays a pivotal role in augmenting the trap’s ability to capture mosquitoes.
2.2.4. Design of Mosquito Collection Components
In the preliminary test results, it has been established that increasing wind intensity, light intensity, and luminous area can enhance the mosquito-trapping efficiency of the mosquito trap lamp. However, due to budgetary constraints and the imperative of conserving power, it is imperative to refrain from modifying the existing unit. Therefore, in terms of design, we have taken inspiration from the reflector and concave features utilized in the preceding experiment, devising a square extension component. Crafted from white paper boasting a reflectivity of 100%, this reflector not only heightens light and wind intensity as well as luminous area but also avoids the need for alterations to existing units, thus presenting a cost-effective and energy-conserving solution. The dimensions of these components are primarily dictated by the size of the entrance, facilitating adjustment of the external extension length to manipulate wind and light fields, as outlined in Table 1. The dimensions of the mosquito trap are as follows: length (cm), width (cm), height (cm), and angle of the mosquito lamp.

Table 1.
The technical specifications of the mosquito-trapping device.
This study employs the existing module for size measurement using measuring tools, followed by the completion of 3-D modeling through SolidWorks. However, due to the simulated nature of the wind field, it is essential to designate a specific area for calculation. Referred to as the wind flow field in our experiment, multiple wind flow fields must be planned accordingly. Additionally, in the context of fans, simulating the wind field requires defining the rotation area of the fan. However, system constraints mandate that the rotation area must be a cylinder. Therefore, enveloping the fan with a cylinder becomes necessary to facilitate parameter setting. The fan body serves as the reference point for target resolution. Subsequently, flow simulation software (COMSOL 6.2) is utilized to simulate the mosquito trap system, generating wind flow and velocity section diagrams. This is primarily undertaken to observe velocity changes on the section diagram and velocity at varying distances.
2.2.5. Flow Simulation Parameter Configuration
Flow simulation is a software tool incorporating fluid dynamics (CFD) principles, offering robust simulation analysis capabilities. It allows for the rapid setup of liquid, gas, or thermal analyses, facilitating verifying analysis effectiveness throughout the design process. The software seamlessly integrates with SolidWorks, ensuring a smooth and efficient workflow between CAD and CFD domains. Upon designing a model in SolidWorks, it can be directly utilized for fluid simulation without the need for conversion to other software platforms. Additionally, since only fluid machinery components are used, fans must be configured with specific rotation areas and speed settings. It is imperative to enable the ‘Rotation’ option.
Furthermore, in the context of fluid dynamics, it is pertinent to note that the mosquito trap system functions as a suction-type apparatus, with air serving as the relevant fluid medium. The flow was designed with ‘Air’ designated as the selected fluid. Moreover, the initial environmental condition is assumed to conform to the atmospheric state (101,325 Pa, 293.2 K). Furthermore, the grid size significantly impacts the number of grids. Generally, a higher number of grids results in a more realistic simulation; however, this also entails longer calculation times. The quality and quantity of grids directly influence the accuracy and speed of numerical convergence. Hence, in addition to ensuring the correct configuration of the aforementioned numerical parameters, careful consideration must be given to the quality and quantity of grids.
The flow chart of parameter setting: first, the calculation area is set. The calculation area refers to the area to be analyzed by the program. If it is too small, it will not be accurate. If it is too large, the calculation time will be too long. Therefore, a cylinder with a length of 100 cm and a diameter of 70 cm is planned. After the shell, a calculation area is formed, which we call the wind flow field. The air inlet of the mosquito trap system is placed 50 cm from the wind flow field. The fan and the wind flow field are concentric circles.
Revolutions per minute, commonly abbreviated as RPM, denotes the number of rotations an object completes in one minute, equivalent to 360 degrees per minute. Radians per second, symbolized as rad/s, is a unit of angular velocity in the International System of Units (SI), measuring the rotation rate in terms of radians per second. The unit conversion formula is as follows: radians per second equals = 57.296 degrees per second (approx.) = 9.549 rpm (approx.) = 0.159 Hz (approx.) = 1/(2∙π) Hz (exact value)
The fan speed employed in this experiment is 2300 RPM. Consequently, the angular velocity of the rotation area is set to 242 rad/s (2300/9.549 ≈ 242 rad/s)
Furthermore, the inner three sides of the wind flow field are specified as boundary conditions, adhering to the standard atmospheric state. The environmental conditions for simulation are set to an atmospheric pressure of 101,325 Pa. The description of setting parameters for simulating fluid flow is illustrated in Figure 4. The primary simulation targets include configuring pressure and velocity parameters, with velocity being the principal focus for observation and pressure utilized for verification purposes. Following the target setup, the wind simulation is initiated by pressing the RUN button. Upon completion of the simulation, it is imperative to initially observe the state of the fluid and verify the normalcy of the wind field. The number of flow trajectories is adjusted as needed, with the number of lines set to one hundred. This adjustment facilitates more precise visualization of the overall flow pattern of the wind field, ensuring simplicity without compromising simulation speed. Each simulation involves one hundred flow trajectories.

Figure 4.
The steps to set up parameters for the SolidWorks model to conduct flow simulation.
3. Simulation and Experimental Results
3.1. Wind Field Simulation Analysis
3.1.1. Wind Field Simulation for Mosquito Trapping System with 0 cm Unit
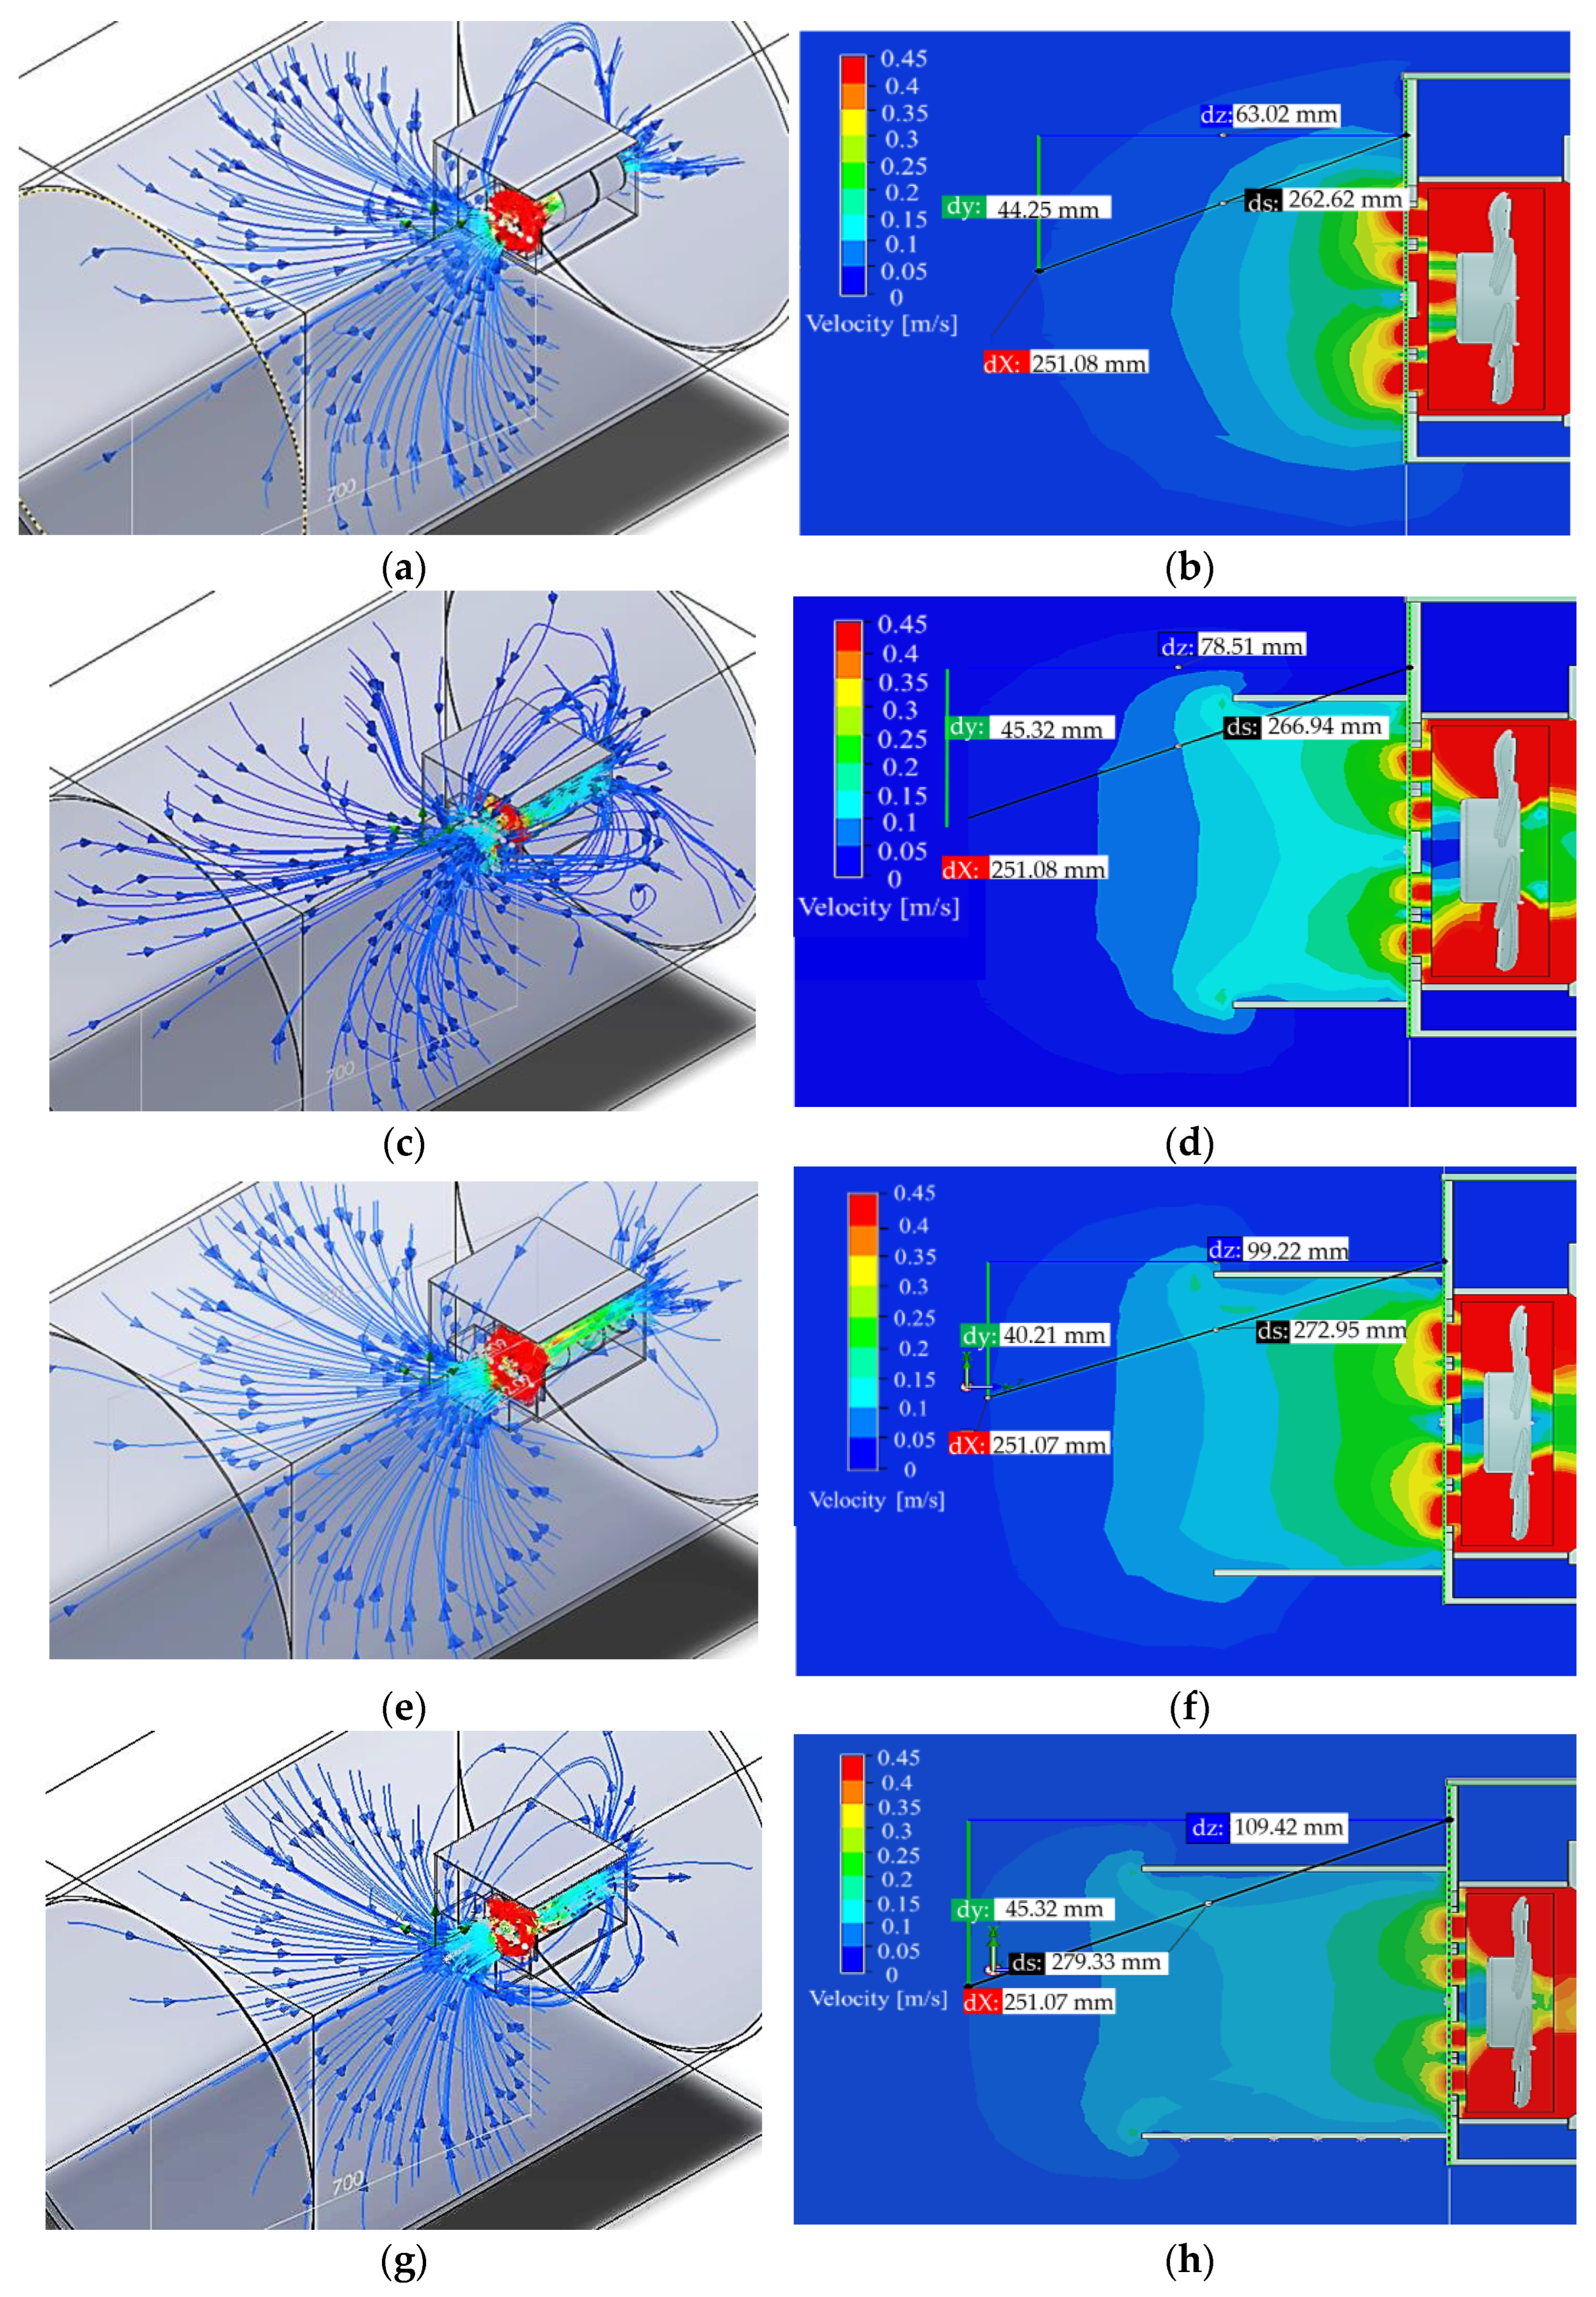
The current mosquito trapping system, referred to as the 0 cm unit in the experiment, does not include any external mosquito trapping component, as shown in Figure 5a,b. The illustration demonstrates a smooth influx of wind into the mosquito trap, forming a vortex-like pattern, signifying the success of the simulation.
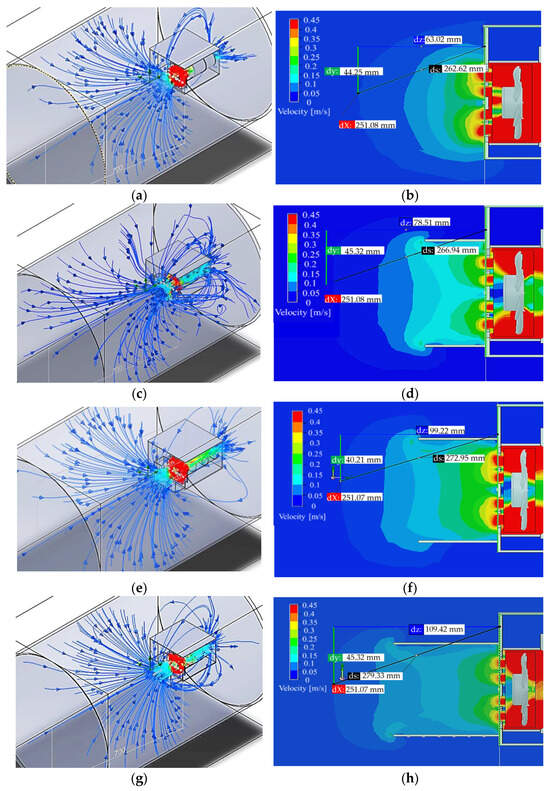
Figure 5.
(a) The flow trajectory of the 0 cm unit; (b) the maximum extension distance of the 0 cm unit’s speed section, measuring 63.11 mm; (c) the flow trajectory of the 3 cm unit; (d) the maximum extension distance of the speed section diagram for the 3 cm unit, measuring 78.5 mm; (e) the flow trajectory of the 5 cm unit; (f) the maximum extension distance of the speed section for the 5 cm unit, measuring 99.22 m; (g) the maximum extension distance of the velocity section diagram for the 7 cm unit is 10.9 cm; and (h) the velocity outside the air inlet in meters per second.
Using the cut plot to analyze the variation in wind speed reveals a distinct enhancement within a specific range. Notably, the enhancement persists up to 6 cm, after which it stabilizes. This observation implies that mosquitoes would be more easily captured if they flew within a distance of six centimeters from the mosquito trap lamp. Therefore, the current mosquito trap lamp can capture mosquitoes, albeit with reduced force. The velocity change data are presented in Table 2.
Table 2.
Wind speed change data for 0 cm unit.
3.1.2. Wind Field Simulation for Mosquito Trapping System with 3 cm Unit
Following the method outlined at the beginning of this chapter, a mosquito-collecting part was designed to extend slightly outward with an extension depth of 3 cm. Following installation at the entrance, the simulation commenced using the same procedures. The resulting simulated fluid diagram is illustrated in Figure 5c. Upon successful confirmation, Figure 5d presents the corresponding section diagram. Observations from the section diagram reveal a significant increase in wind speed, with the enhanced wind speed range extending to nearly eight centimeters. Detailed wind speed change data are provided in Table 3.
Table 3.
Data table of wind speed change for 3 cm unit.
3.1.3. Wind Field Simulation for Mosquito Trapping System with 5 cm Unit
Simulation 3 employs a 5 cm mosquito-collecting part for the simulation, following the steps outlined in Figure 5e,f. Figure 5e illustrates the flow trajectory of the 5 cm unit, and Figure 5f shows the longest extension distance of the velocity section of the 5 cm unit, which is 99.22 mm. All the data collected are shown in Table 4. It is evident from the figures that the range of increased wind speed extends further to 9.9 cm.
Table 4.
Data table of wind speed change for 5 cm unit.
3.1.4. Wind Field Simulation for Mosquito Trapping System with 7 cm Unit
Simulation 4 employed the longest 7 cm mosquito-collecting part. Following the steps outlined in Figure 5g,h and Table 5, we acquired the fluid diagram, section diagram, and wind speed change table. The diagram analysis reveals an extension of the wind speed enhancement range to 10.9 cm.
Table 5.
Data table of wind speed change for 7 cm unit.
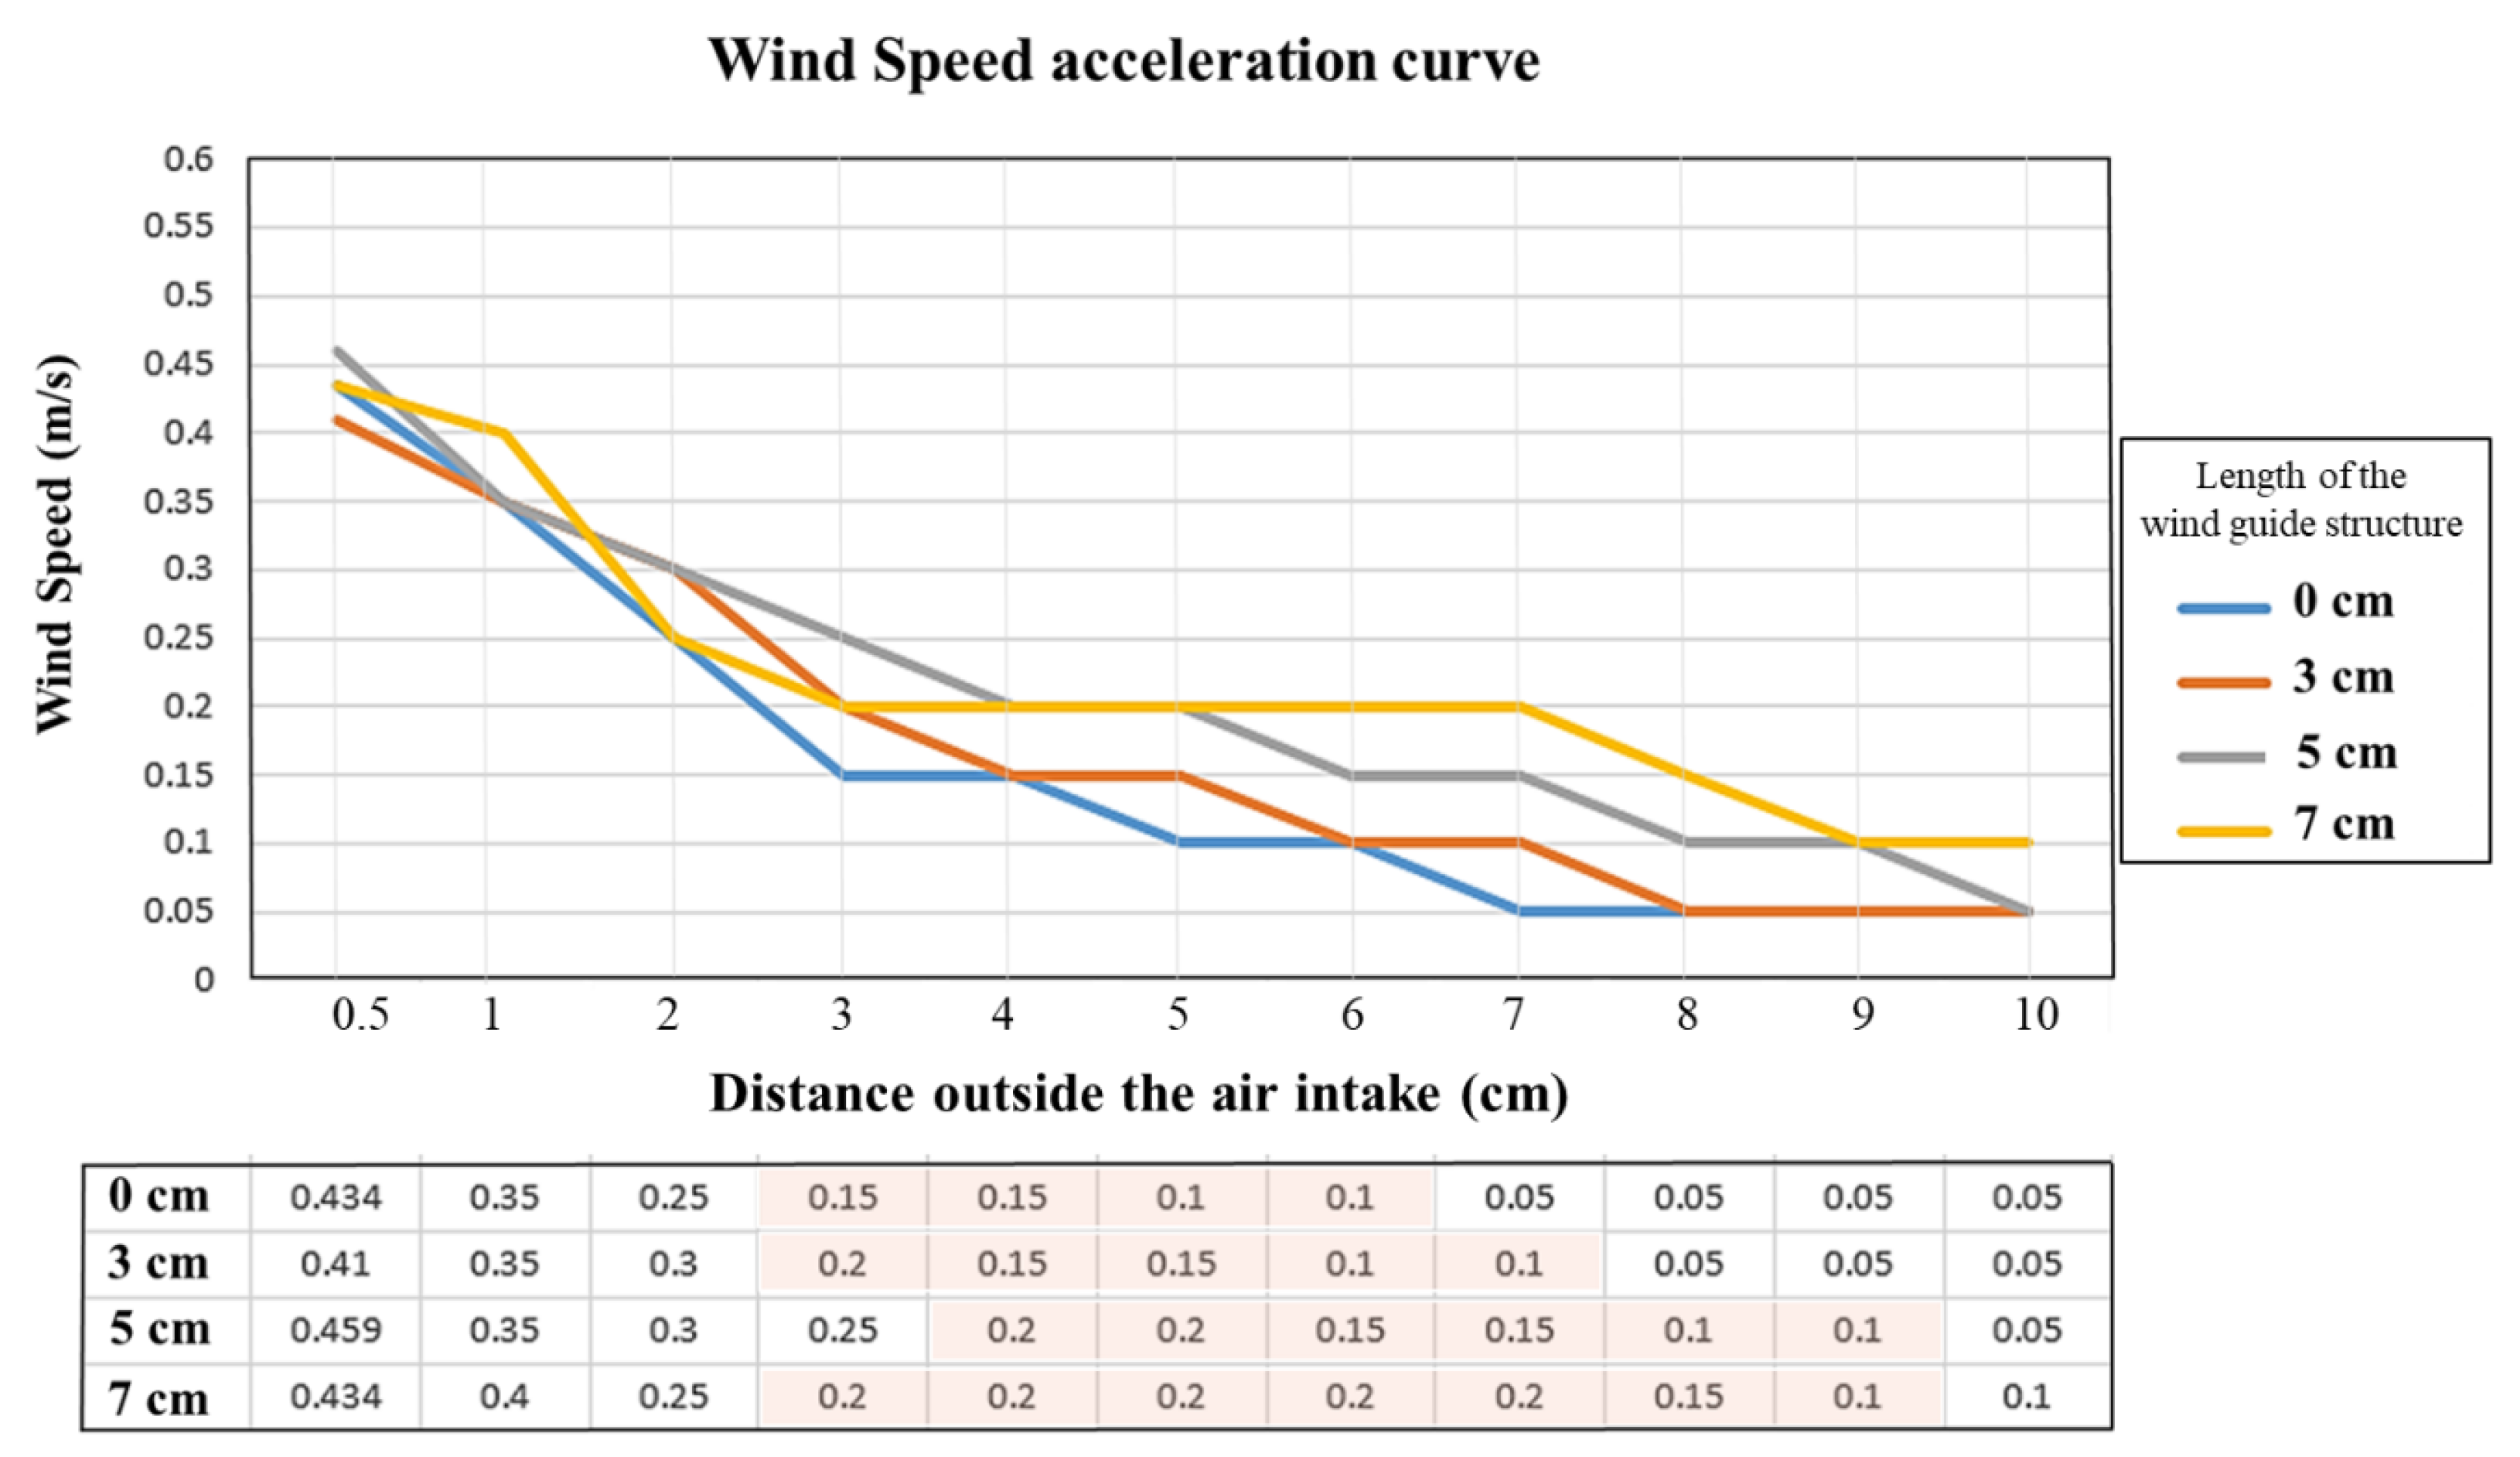
Light field simulation constitutes a pivotal component of this study, as illustrated in Figure 6. Although augmenting wind speed improves mosquito trapping effectiveness, the primary means of mosquito capture hinges on mosquito phototaxis. It is essential to allure mosquitoes to the mosquito lamp before they can be trapped. Consequently, this chapter will simulate the light distribution of mosquito-collecting parts of various sizes and examine the variations in angle and light intensity within different mosquito-collecting parts. Subsequently, a comprehensive experimental analysis of the findings will be conducted.
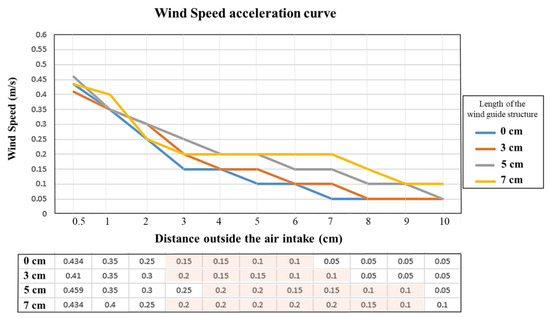
Figure 6.
The acceleration curve chart of wind speed utilizing mosquito-trapping devices with units of 0 cm, 3 cm, 5 cm, and 7 cm. Design and analysis were found that the wind speed in the pink background area is 0.1 m/s to 0.2 m/s. The section outside the inlet gradually widens. Therefore, this experiment increases the depth of the mosquito collection component to expand the wind flow area for capturing mosquitoes.
3.2. Light Field Simulation Analysis
3.2.1. Light Field Simulation Analysis for 0 cm Unit
To commence, the initial step involves emulating the functionality of the pre-existing mosquito-catching apparatus devoid of a plug-in mechanism, denoted as the “0 cm unit” within the experimental framework. Figure 7a illustrates a schematic representation of the light trajectory within the simulated light field. Notably, the depicted trajectory reveals a considerable departure angle of light emission. Figure 7b is obtained upon parameterization, illustrating the angular aperture for facial capture. The graphical depiction delineates the luminous characteristics and intensity distribution at 0° and 90° within the mosquito-catching system. Notably, the light emission angle is enlarged, yielding a peak luminous intensity of 11.7 candela. Detailed illumination profiles are tabulated in Table 6, presenting comprehensive light shape data.
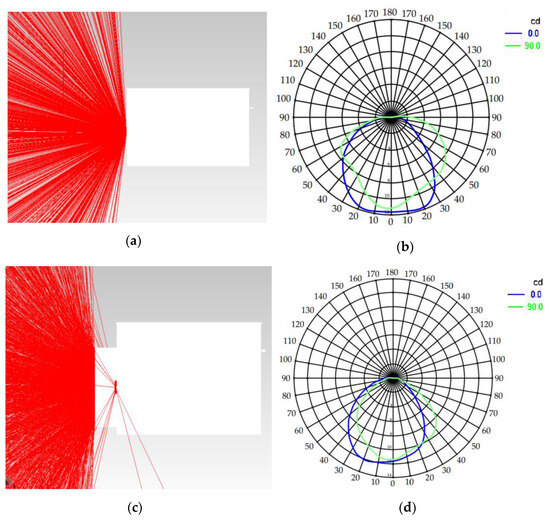
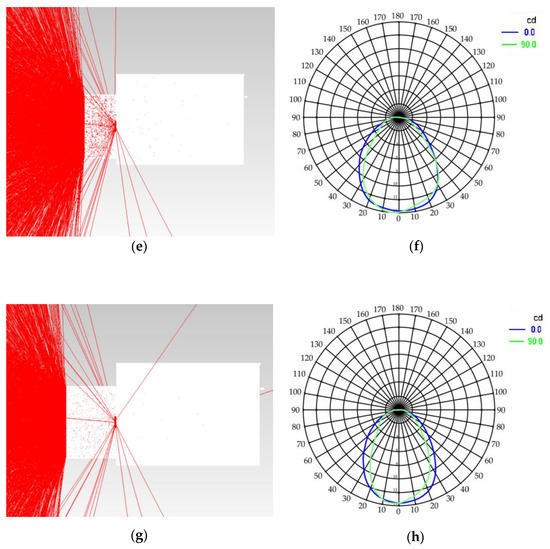
Figure 7.
(a) 0 cm unit light trajectory diagram; (b) light shape diagram of 0 cm unit; (c) 3 cm unit light trajectory diagram; (d) light shape diagram of 3 cm unit; (e) 5 cm unit light trajectory diagram; (f) light shape diagram of 5 cm unit; (g) 7 cm unit light trajectory diagram; and (h) light shape diagram of 7 cm unit.
Table 6.
Light shape data table for 0 cm unit.
3.2.2. Light Field Simulation Analysis for 3 cm Unit
The subsequent phase entails simulating the functionality of an external mosquito collection component positioned at a distance of three centimeters, herein referred to as the “3 cm unit” within the experimental domain. Figure 7c is a simulated representation of the light trajectory. Compared to the trajectory of the 0 cm unit, it is discernible that the light emitted by the 3 cm unit exhibits greater concentration towards the mosquito collection unit. Notably, light distribution along the upper and lower sections appears comparatively sparse anterior to the component. Figure 7d presents the light shape diagram, wherein an analysis of the data reveals an augmentation in maximum light intensity, a reduction in light scattering angle, and a decrease in the half-opening angle θ indicative of light divergence. Comprehensive illumination characteristics are tabulated in Table 7, offering a detailed account of light shape data.
Table 7.
Light shape data table for 3 cm unit.
3.2.3. Light Field Simulation Analysis for 5 cm Unit
The subsequent step involves simulating an external mosquito collection component positioned at a distance of five centimeters, referred to as the “5 cm unit” within the experimental context. Figure 7e illustrates a simulated depiction of the light trajectory. Comparative analysis with preceding groups reveals a heightened concentration of light, indicative of increased luminous intensity. Figure 7f indicates that the maximum light intensity can attain 14 candela. However, this augmentation is accompanied by a substantial reduction in the light scattering angle and a significant decrease in the light divergence half angle θ. These findings are comprehensively tabulated in Table 8, providing detailed insights into the characteristics of light shape data.
Table 8.
Light shape data table for 5 cm unit.
3.2.4. Light Field Simulation Analysis for 7 cm Unit
Subsequently, the experimental setup incorporates simulation of an external mosquito collection unit positioned at a distance of seven centimeters, designated as the “7 cm unit”. Figure 7g illustrates the simulated trajectory of light emissions. Notably, an observation from the image indicates a concentration of light predominantly towards the front, resulting in diminished luminosity along the upper and lower regions. Furthermore, due to the excessive length of the reflective sheet, a discrepancy exists wherein the light intensity fails to increase with its concentration correspondingly. Figure 7h illustrates that the maximum light intensity achieved is only 13.5 candela, notably lower than that of the 5 cm unit. Detailed insights into the light’s spatial distribution are encapsulated within Table 9, offering a comprehensive overview of the light shape data.
Table 9.
Light shape data table for 7 cm unit.
The difference between the blue and green light distribution contours in Figure 7f,h lies primarily in their intensity distribution and angle of divergence. In Figure 7f, the maximum light intensity on the horizontal (0°) axis is approximately 14 cd, while the half angle of light significantly increases compared to the horizontal (0°) and vertical (90°) axes in Figure 7h. In contrast, the maximum light intensity achieved is 13.5 cd in Figure 7h; the light is distributed more evenly, with a narrower half angle.
3.3. Experimental Results
3.3.1. Measured Light Shape of 0 cm Unit
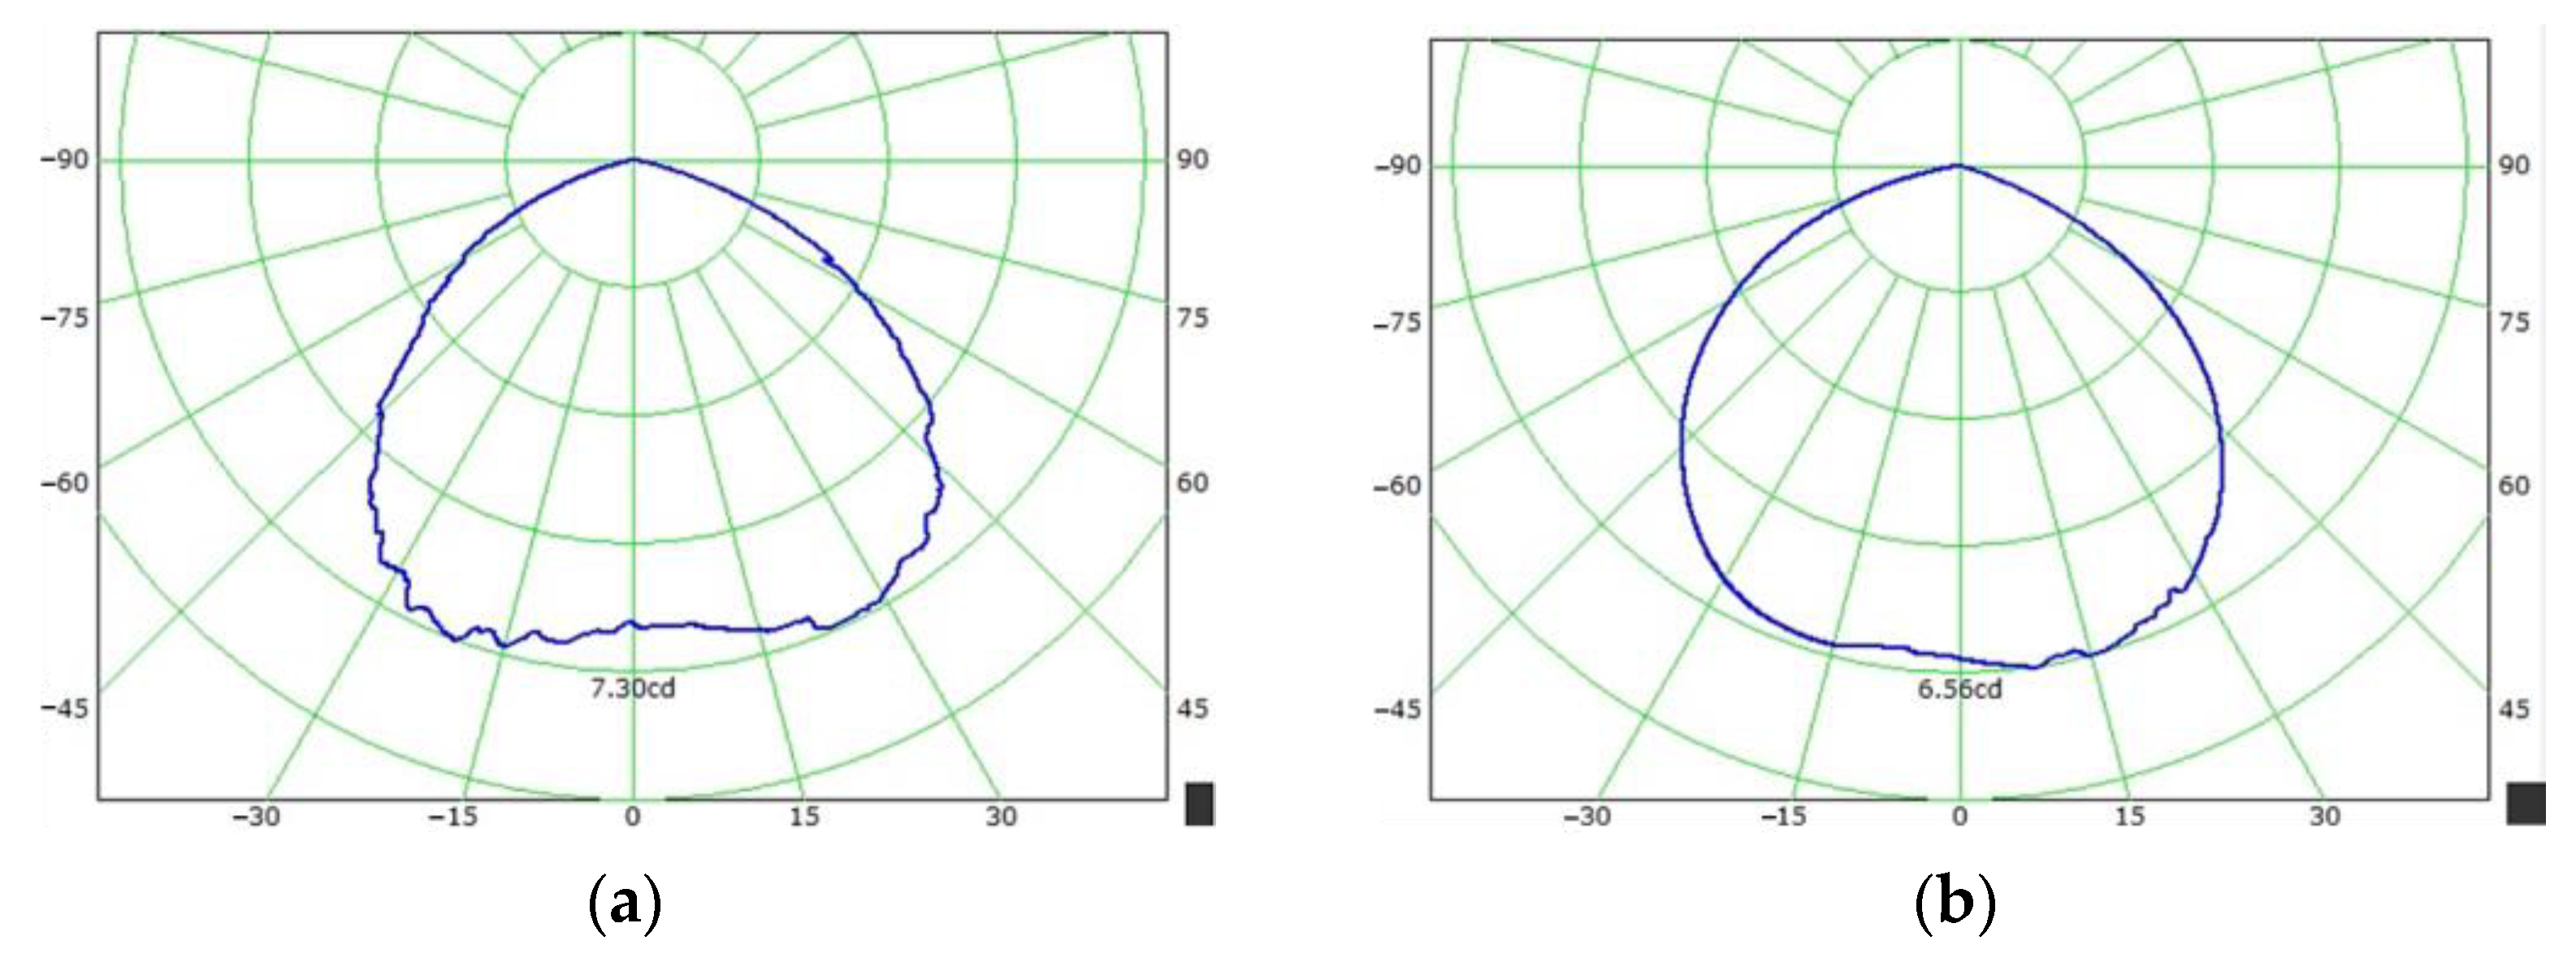
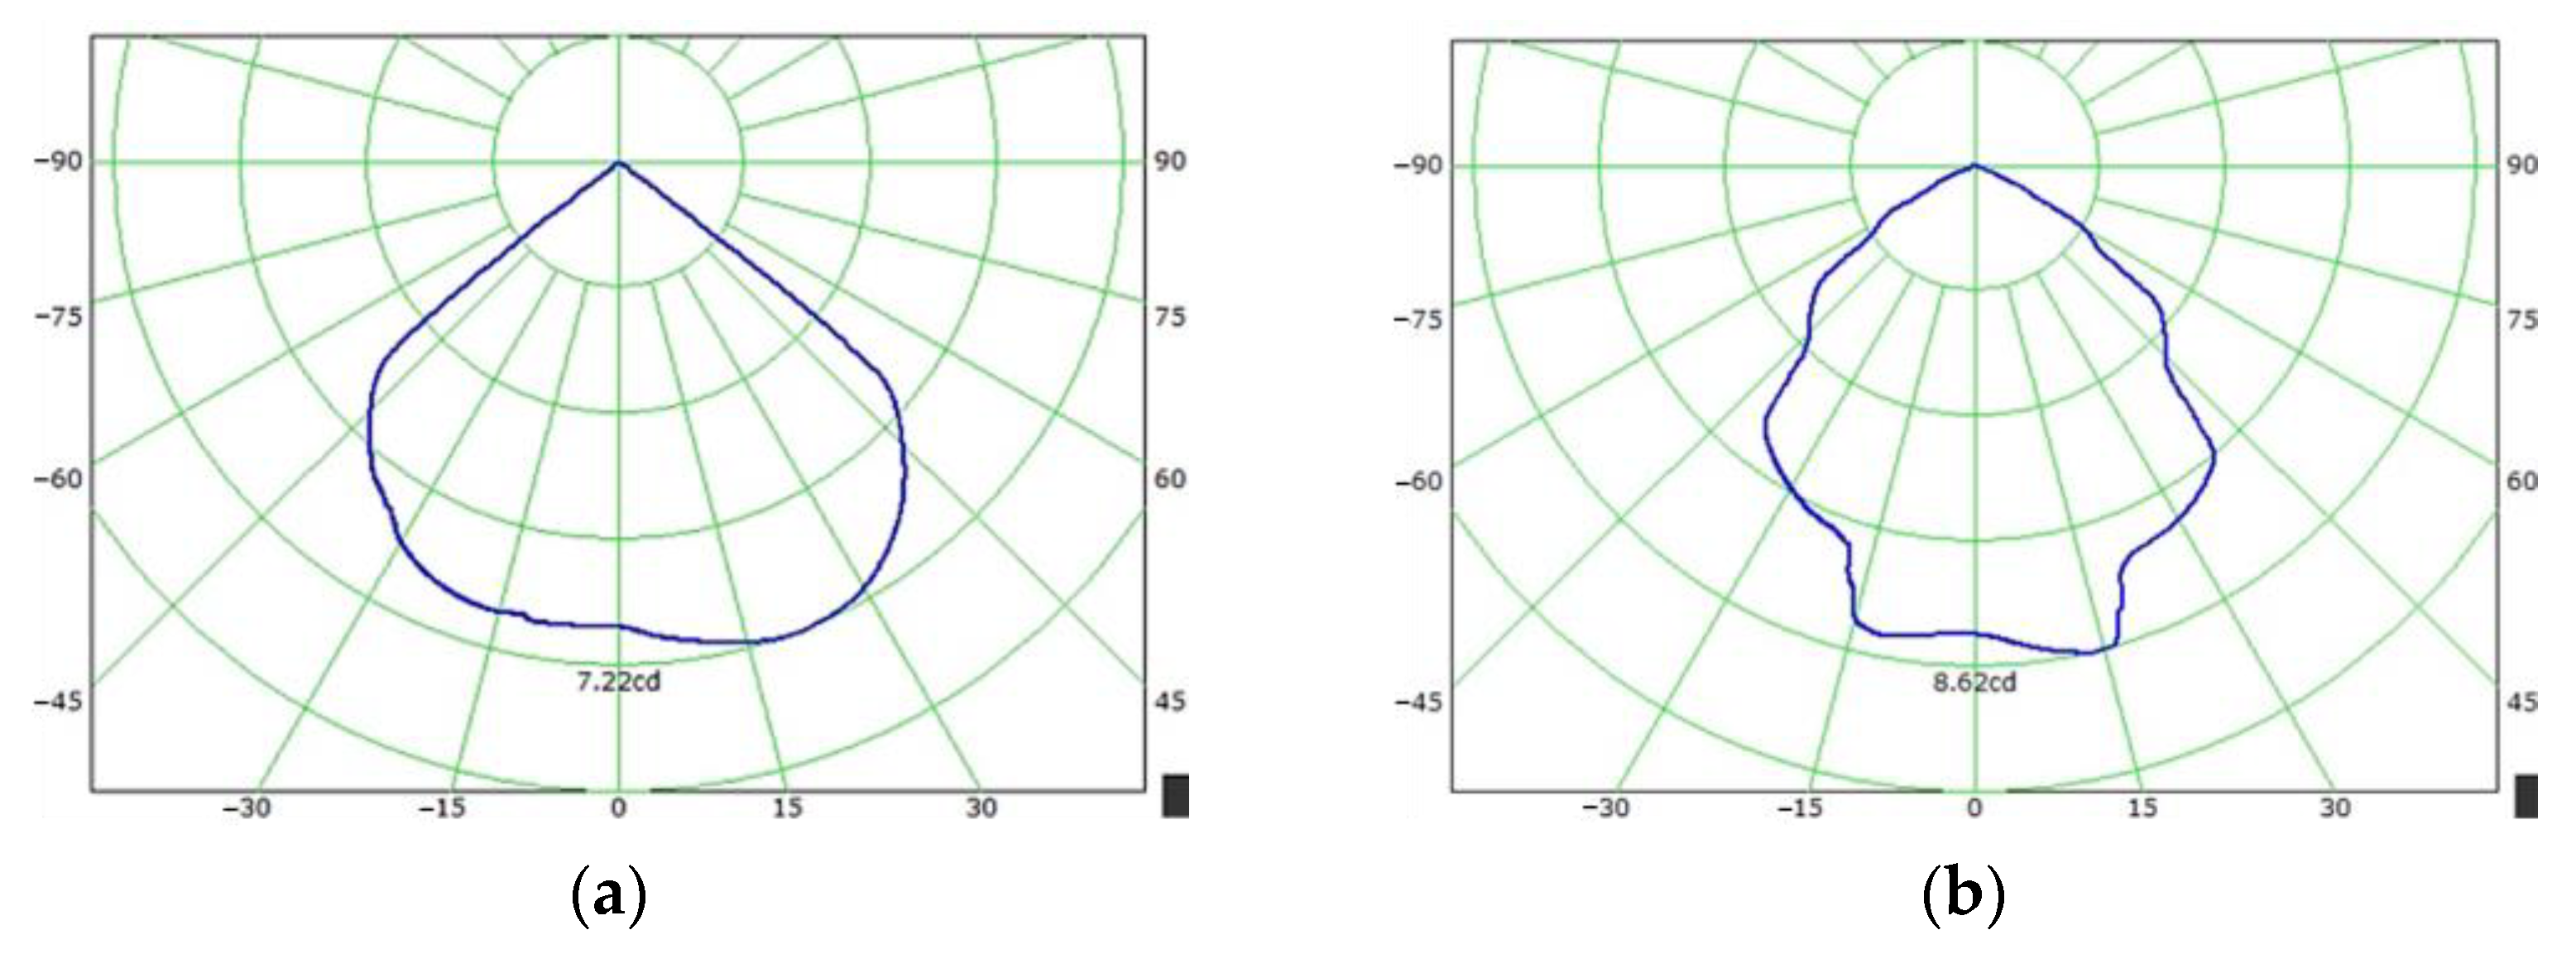
Initially, measurements were conducted on the 0 cm unit, representing the pre-existing module. Figure 8a,b depict the obtained light shape. Comprehensive records of light intensity and the half-opening angle θ for light divergence are documented in Table 10.
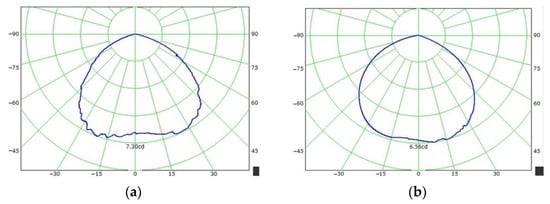
Figure 8.
(a) Measured vertical light shape of 0 cm unit and (b) measured parallel light shape of 0 cm unit.
Table 10.
Measured light shape data table for 0 cm unit.
3.3.2. Measured Light Shape of 3 cm Unit
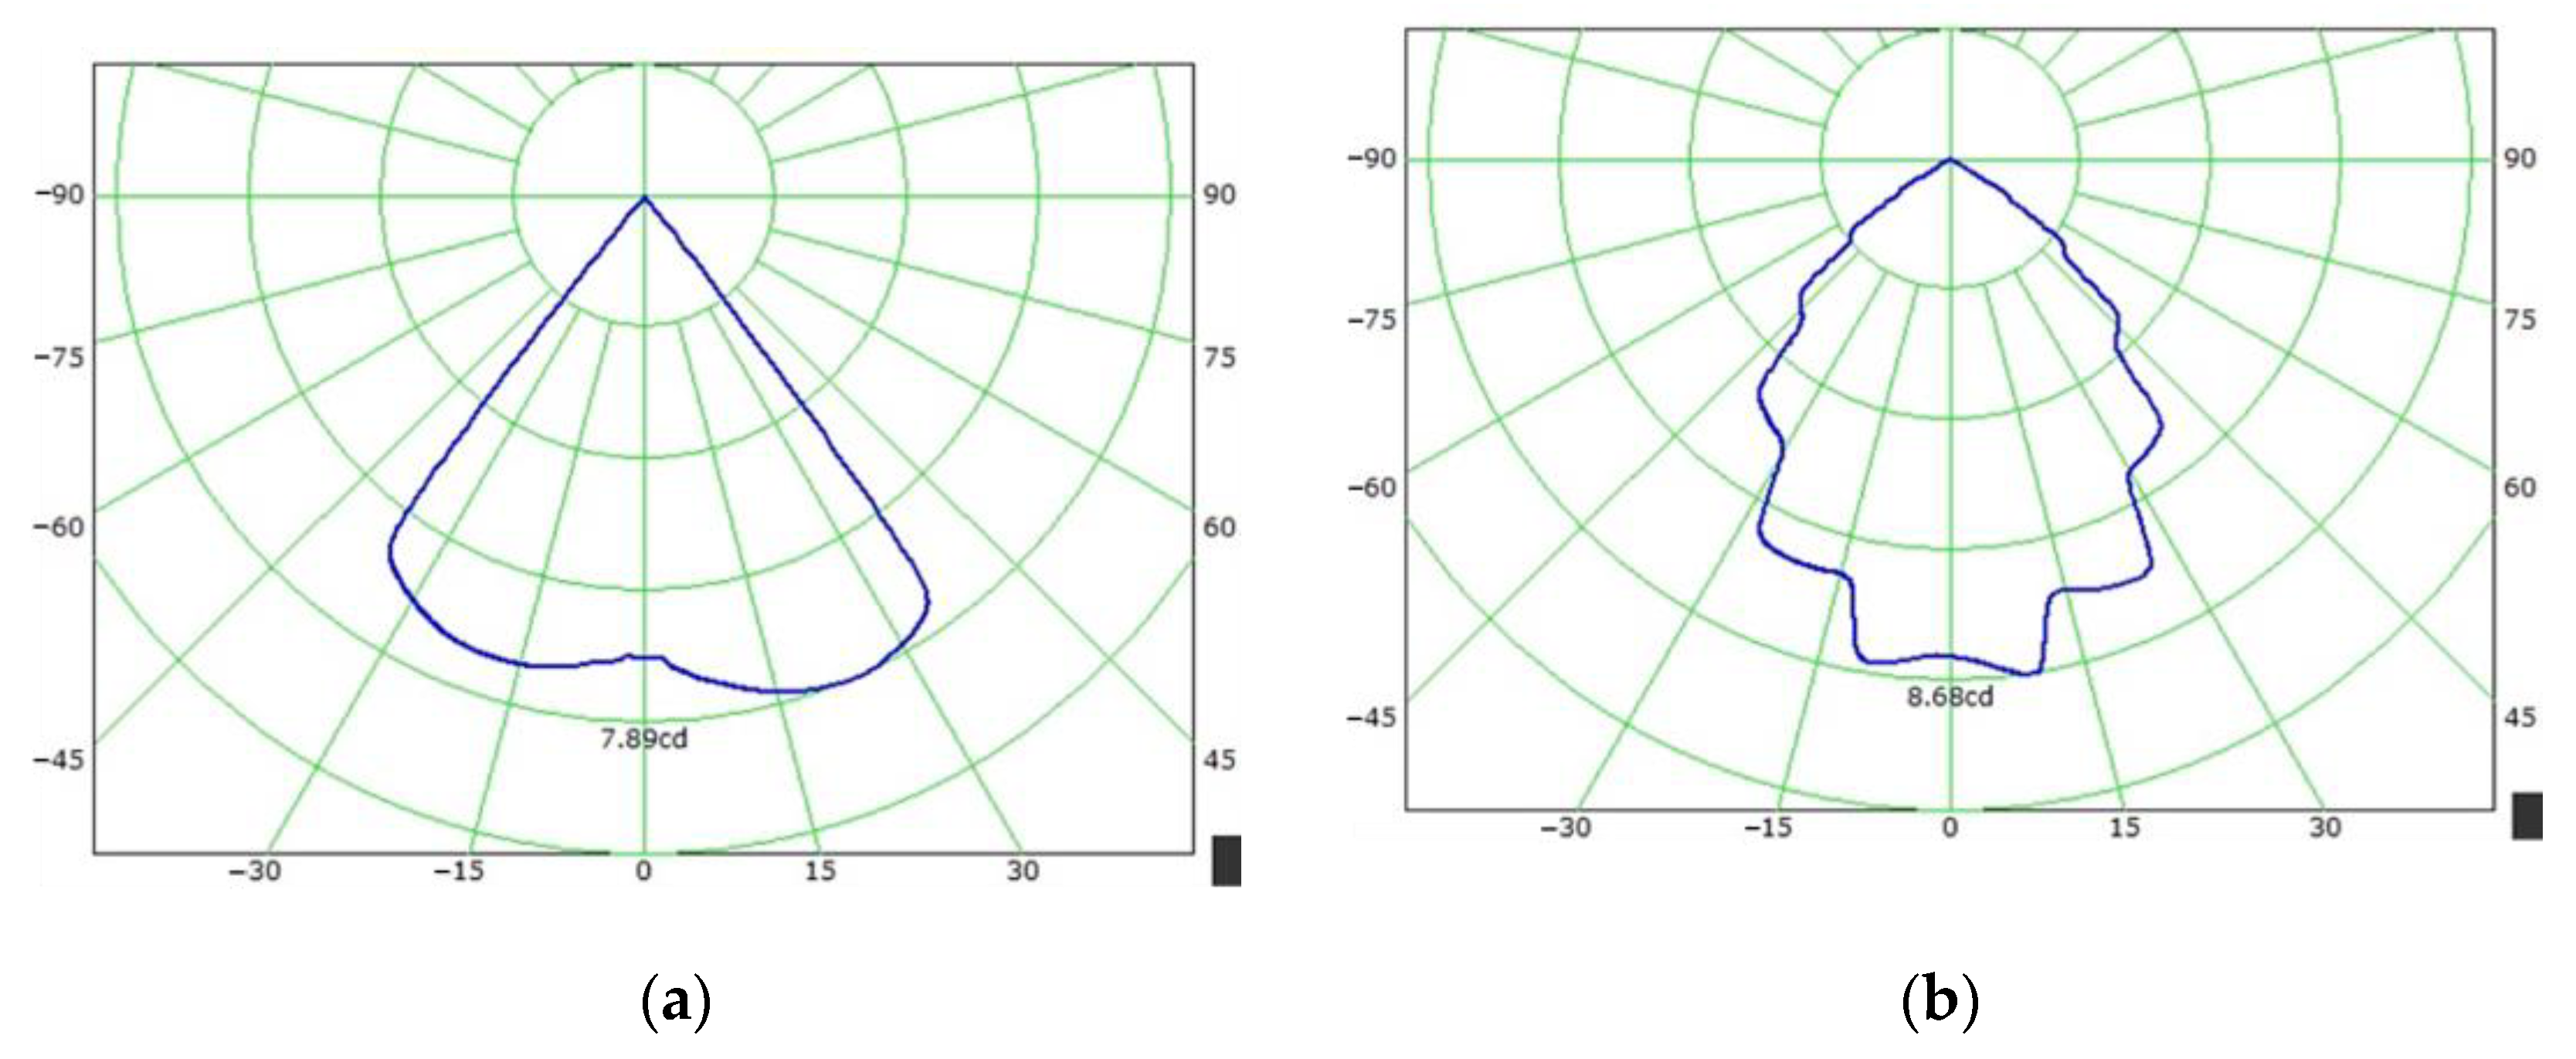
Subsequently, measurements were conducted on the light shape of the 3 cm unit, representing the external mosquito collection component positioned at a distance of three centimeters. Figure 9a,b illustrate the obtained measurement results. The detailed documentation of both light intensity and the half-opening angle θ for light divergence is presented in Table 11.
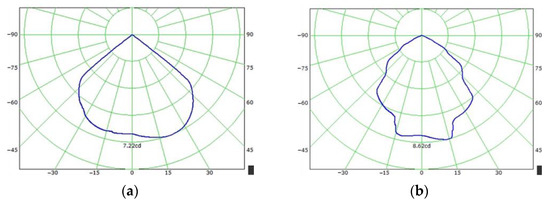
Figure 9.
(a) Measured vertical light shape of 3 cm unit and (b) measured parallel light shape of 3 cm unit.
Table 11.
Measured light shape data table for 3 cm unit.
3.3.3. Measured Light Shape of 5 cm Unit
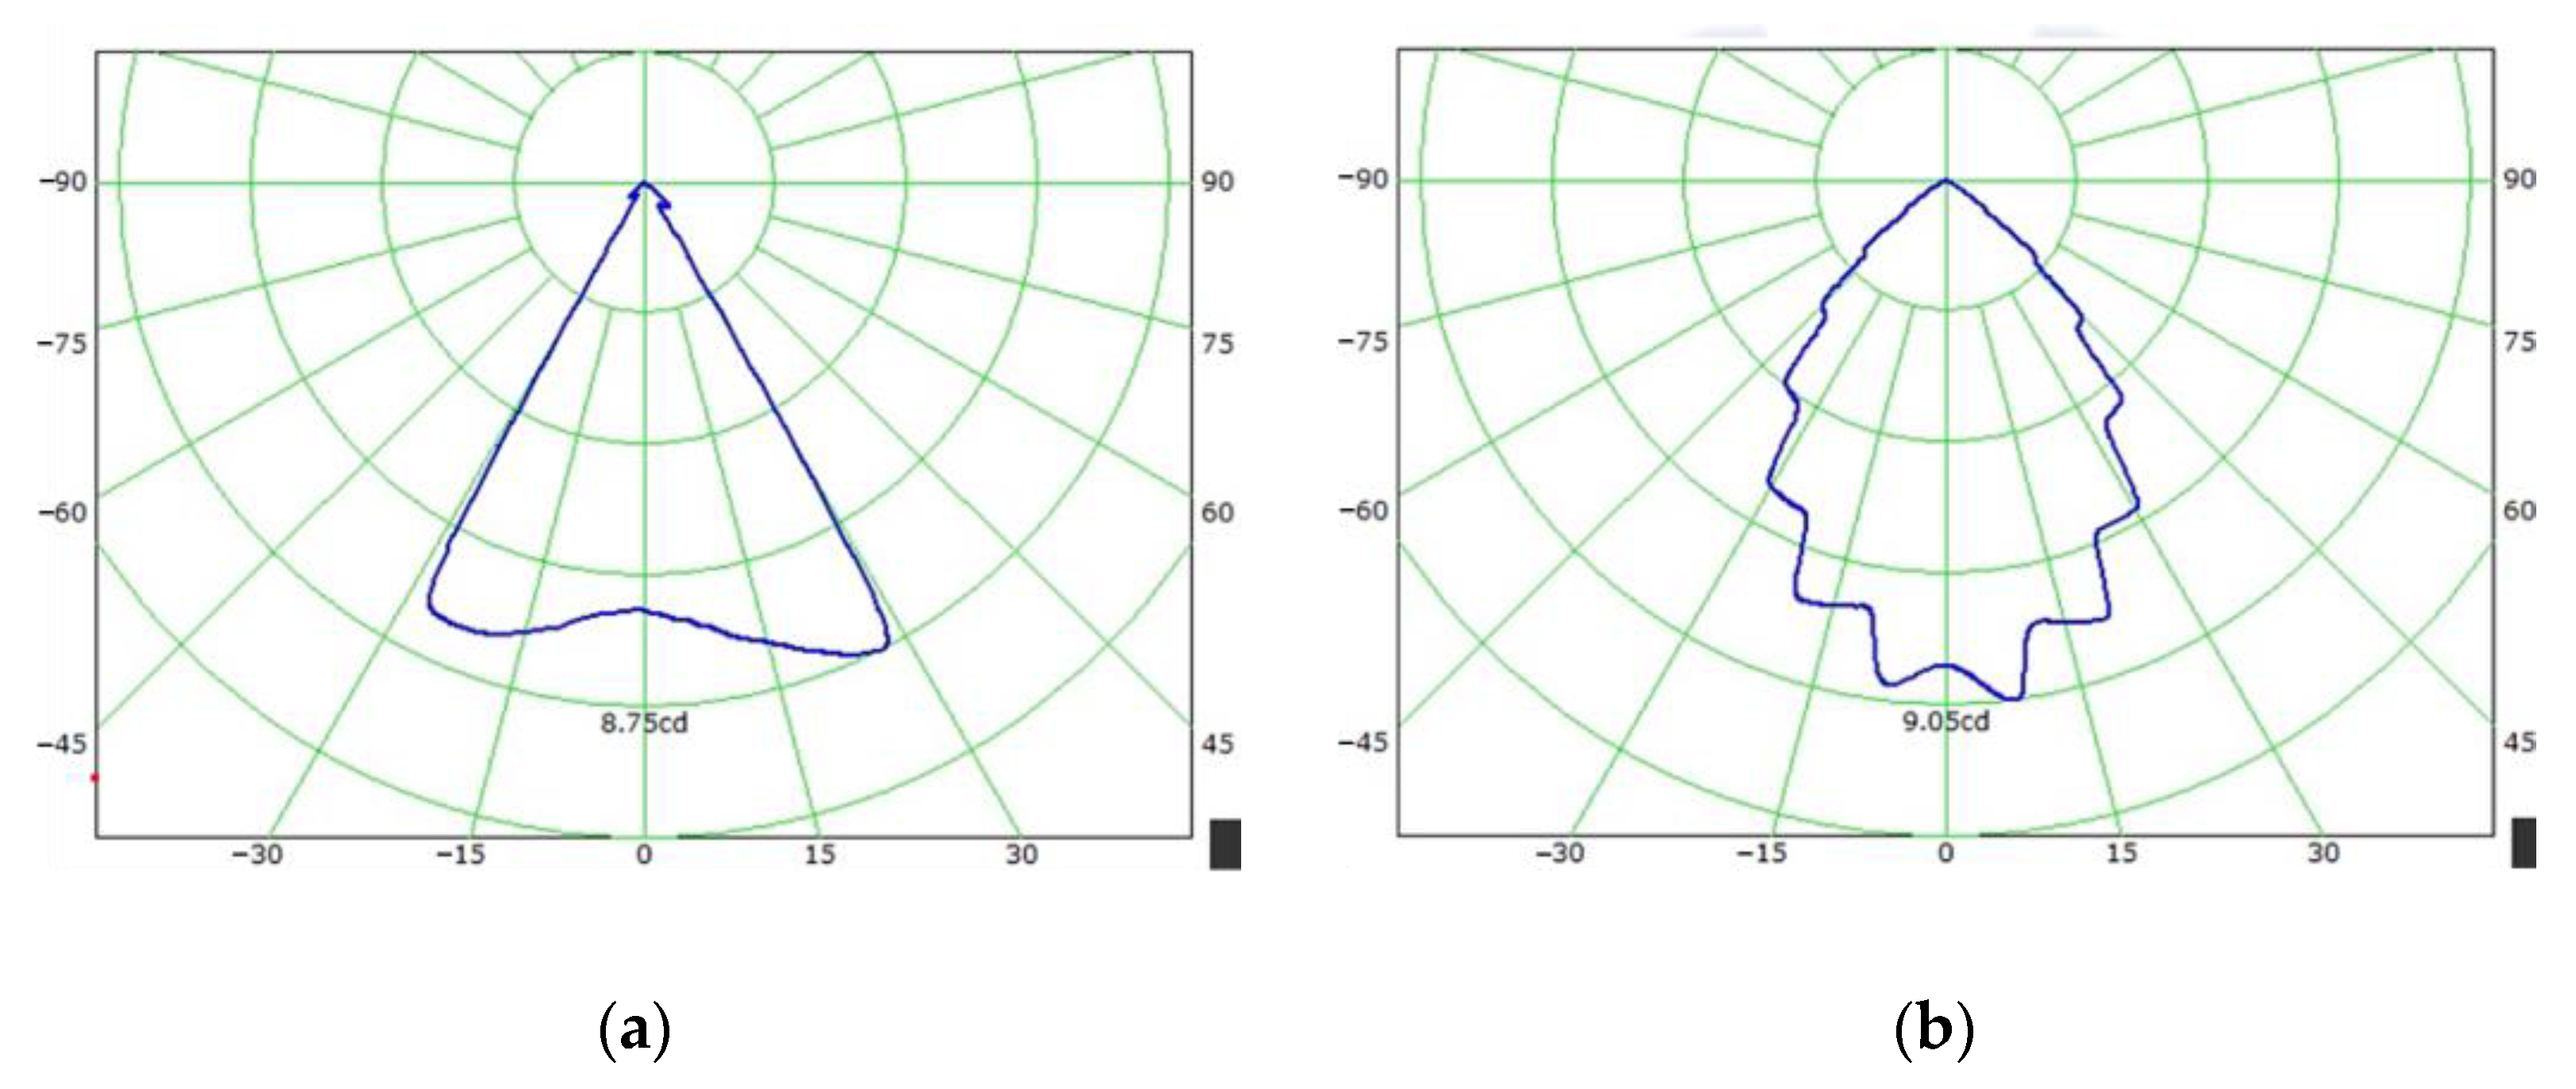
Next, measurements were conducted on the light shape of the 5 cm unit, representing the external mosquito collection component situated at a distance of five centimeters. Figure 10a,b depict the obtained measurement results. The detailed documentation of both light intensity and the half-oening angle θ for light divergence is provided in Table 12 (measured light shape data table for 5 cm unit).
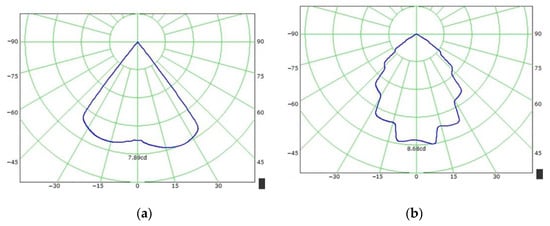
Figure 10.
(a) Measured vertical light shape of 5 cm unit and (b) measured parallel light shape of 5 cm unit.
Table 12.
Measured light shape data table for 5 cm unit.
3.3.4. Measured Light Shape of 7 cm Unit
In the subsequent phase, measurements were conducted on the light shape of the 7 cm unit, incorporating an external mosquito collection component positioned at a distance of seven centimeters. Figure 11a,b illustrate the measurement results. The comprehensive documentation of both light intensity and the half-opening angle θ for light divergence is provided in Table 12.
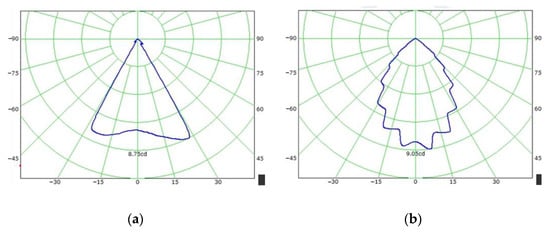
Figure 11.
(a) Measured vertical light shape of 5 cm unit and (b) measured parallel light shape of 5 cm unit.
3.3.5. Mosquito Trapping Device Result Analysis after Optimization
After completing the wind field and light field simulations and actual measurements, the subsequent step entails physically capturing mosquitoes to determine the optimal conditions for mosquito trapping. This process encompasses capturing mosquitoes, categorizing and aggregating those captured by each mosquito-collecting component, calculating the average value, and subsequently conducting comparisons across each group to ascertain the optimized mosquito-trapping system and its components. Finally, the data derived from the light and wind fields are correlated to elucidate the rationale behind optimizing the mosquito trapping system. Below, the schematic diagram depicting the mosquito capture environment is presented, accompanied by the following conditions:
Capture Time: 5:00 PM to 10:00 PM
Capture Location: Grass adjacent to the classroom
Height of Mosquito Trap Placement: 50 cm from the ground
Distance between two groups of Mosquito Trap Lamps: 6 feet
Experiment Period: Four days
Data Statistics Cycle: Once a day
Due to the restricted availability of grassland mosquitoes, only two units were employed in each experiment. The experimental selection process of the mosquito trapping device is illustrated in Figure 12. To this end, two groups, each comprising short and long units, were selected for comparison. In Experiment 1, both 0 cm and 3 cm units were deployed to capture mosquitoes. Subsequently, the collected mosquitoes were quantified and compared to ascertain the superior mosquito trapping capability. This determination then dictated the selection of experimental units for Experiment 3. In the subsequent phase, the 5 cm and 7 cm units were utilized to capture mosquitoes, and the gathered data were statistically analyzed to identify the unit with superior mosquito trapping efficacy. Following this, the mosquito trapping system underwent optimization, and a detailed analysis was conducted to elucidate the factors contributing to the enhanced mosquito trapping ability. The experimental flow chart is depicted in the accompanying figure.
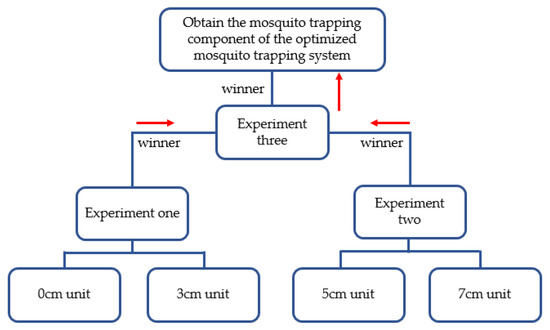
Figure 12.
Describing the experimental selection process of the mosquito trap device.
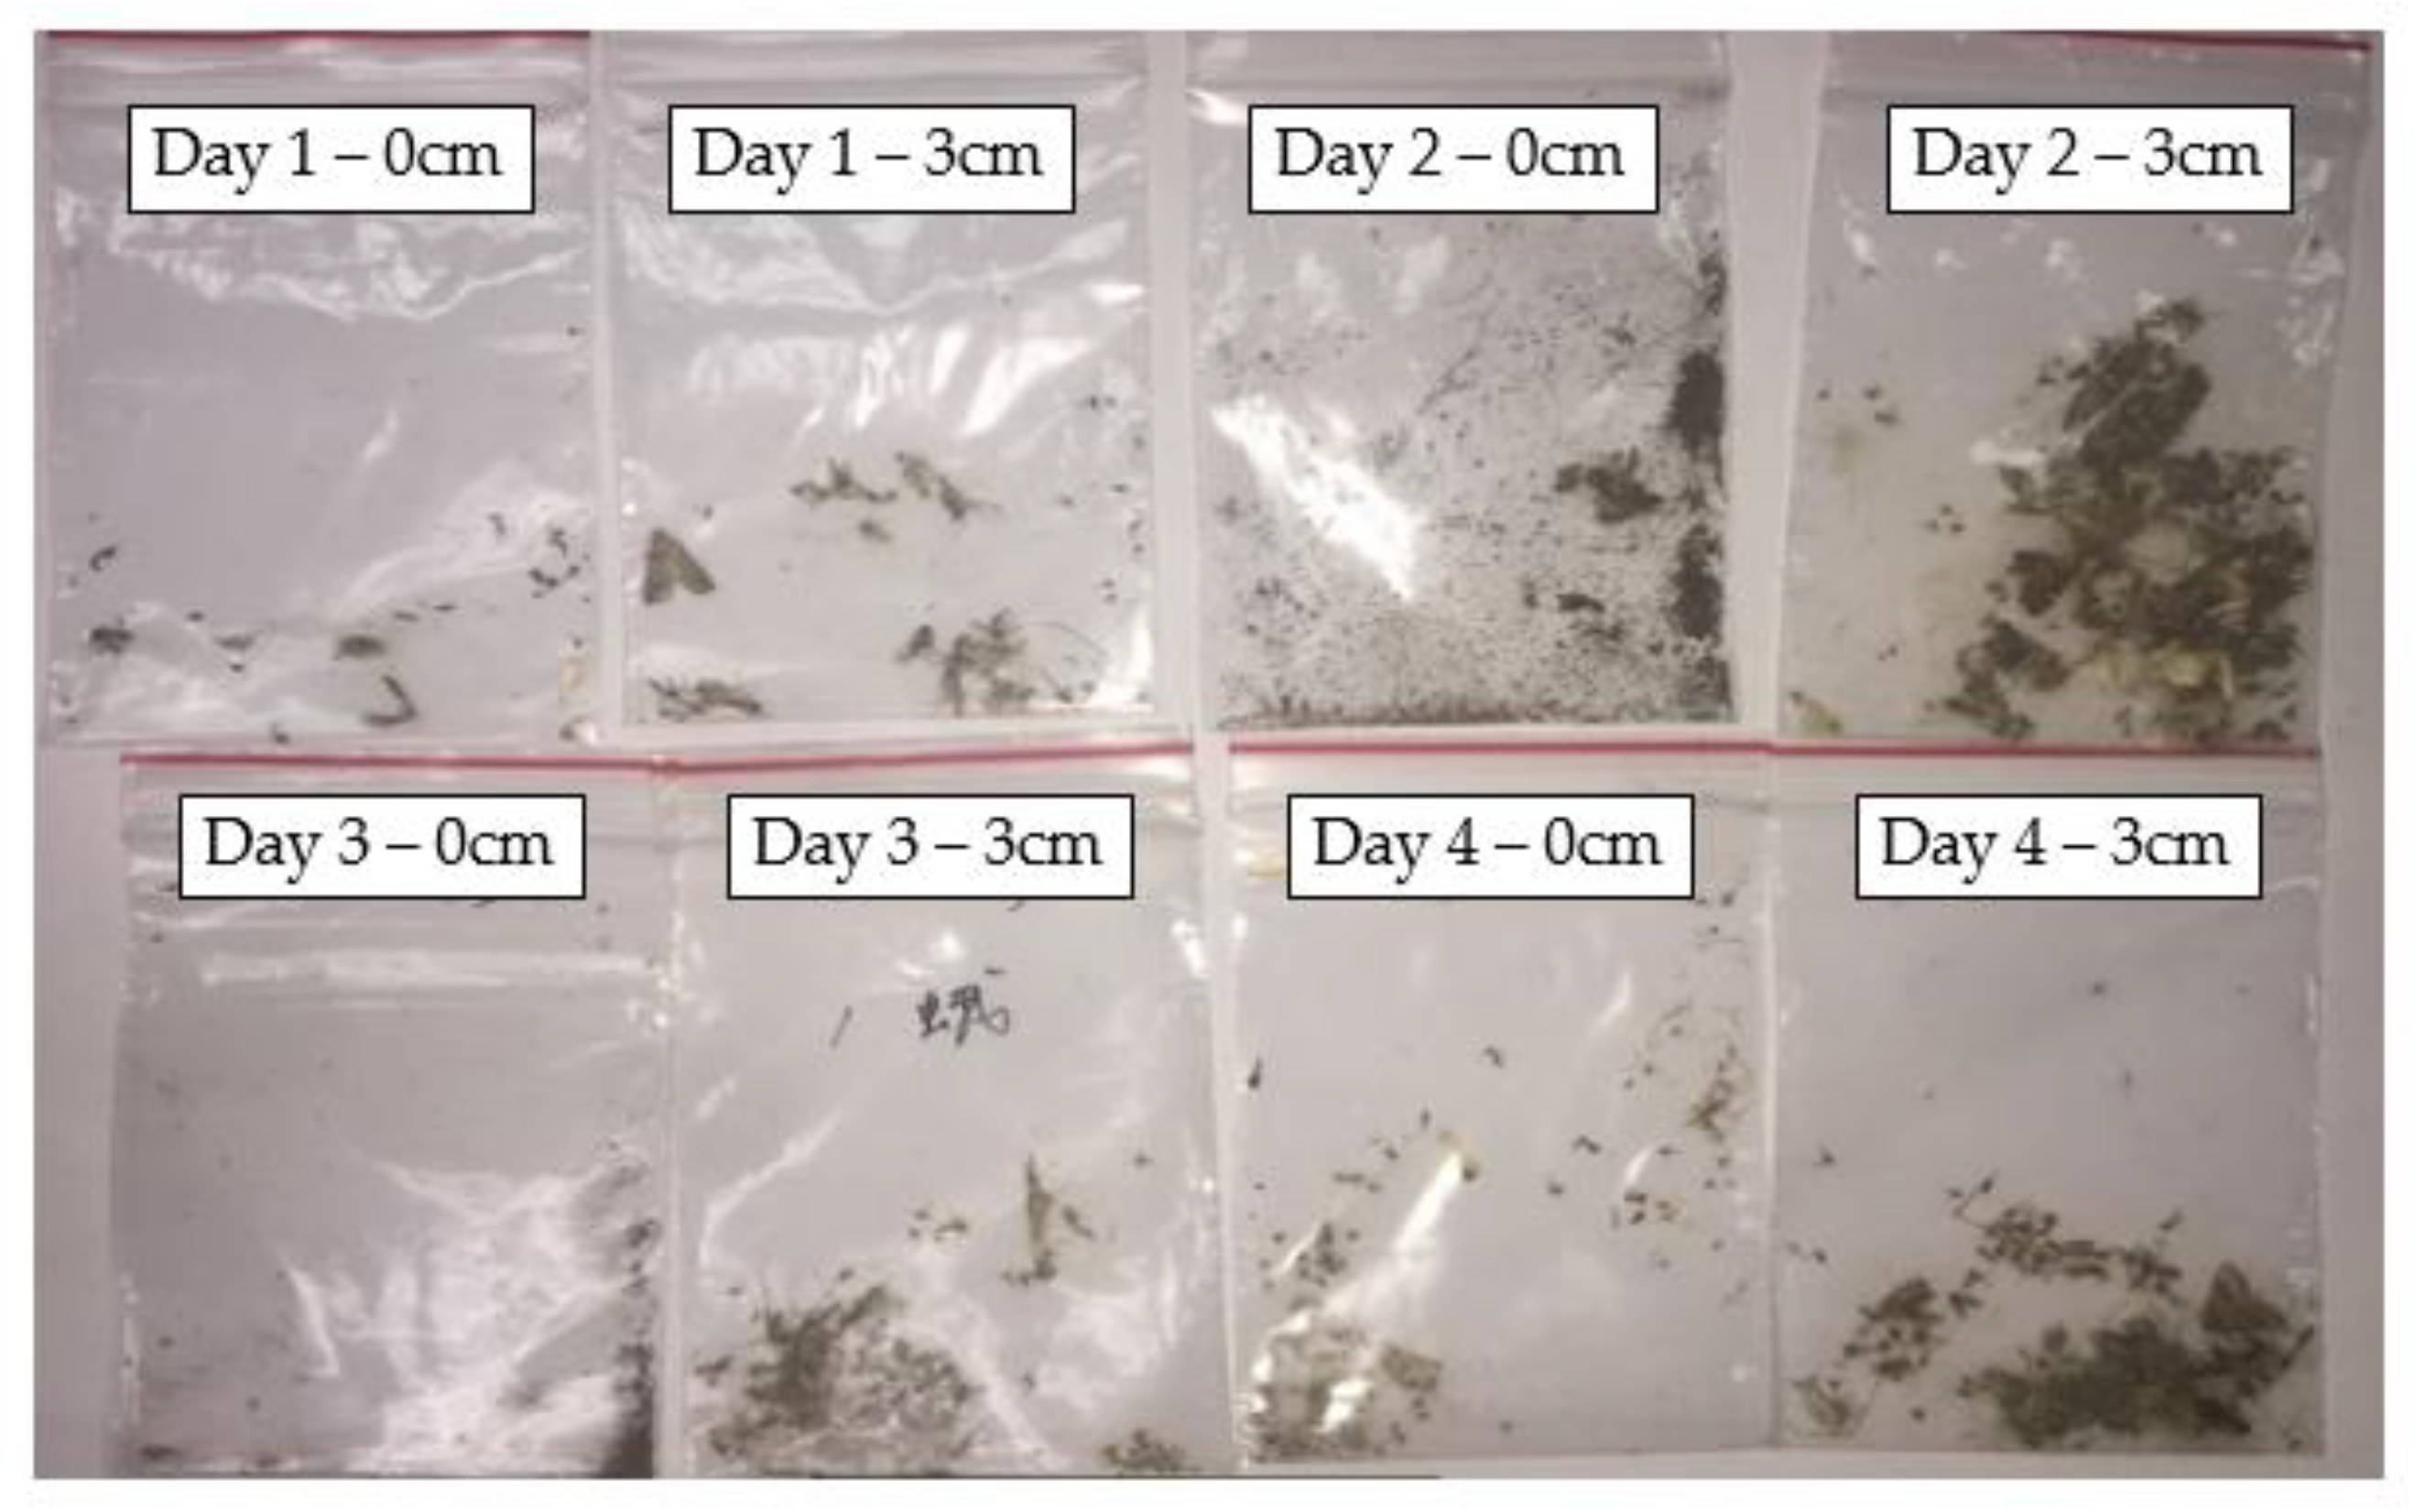
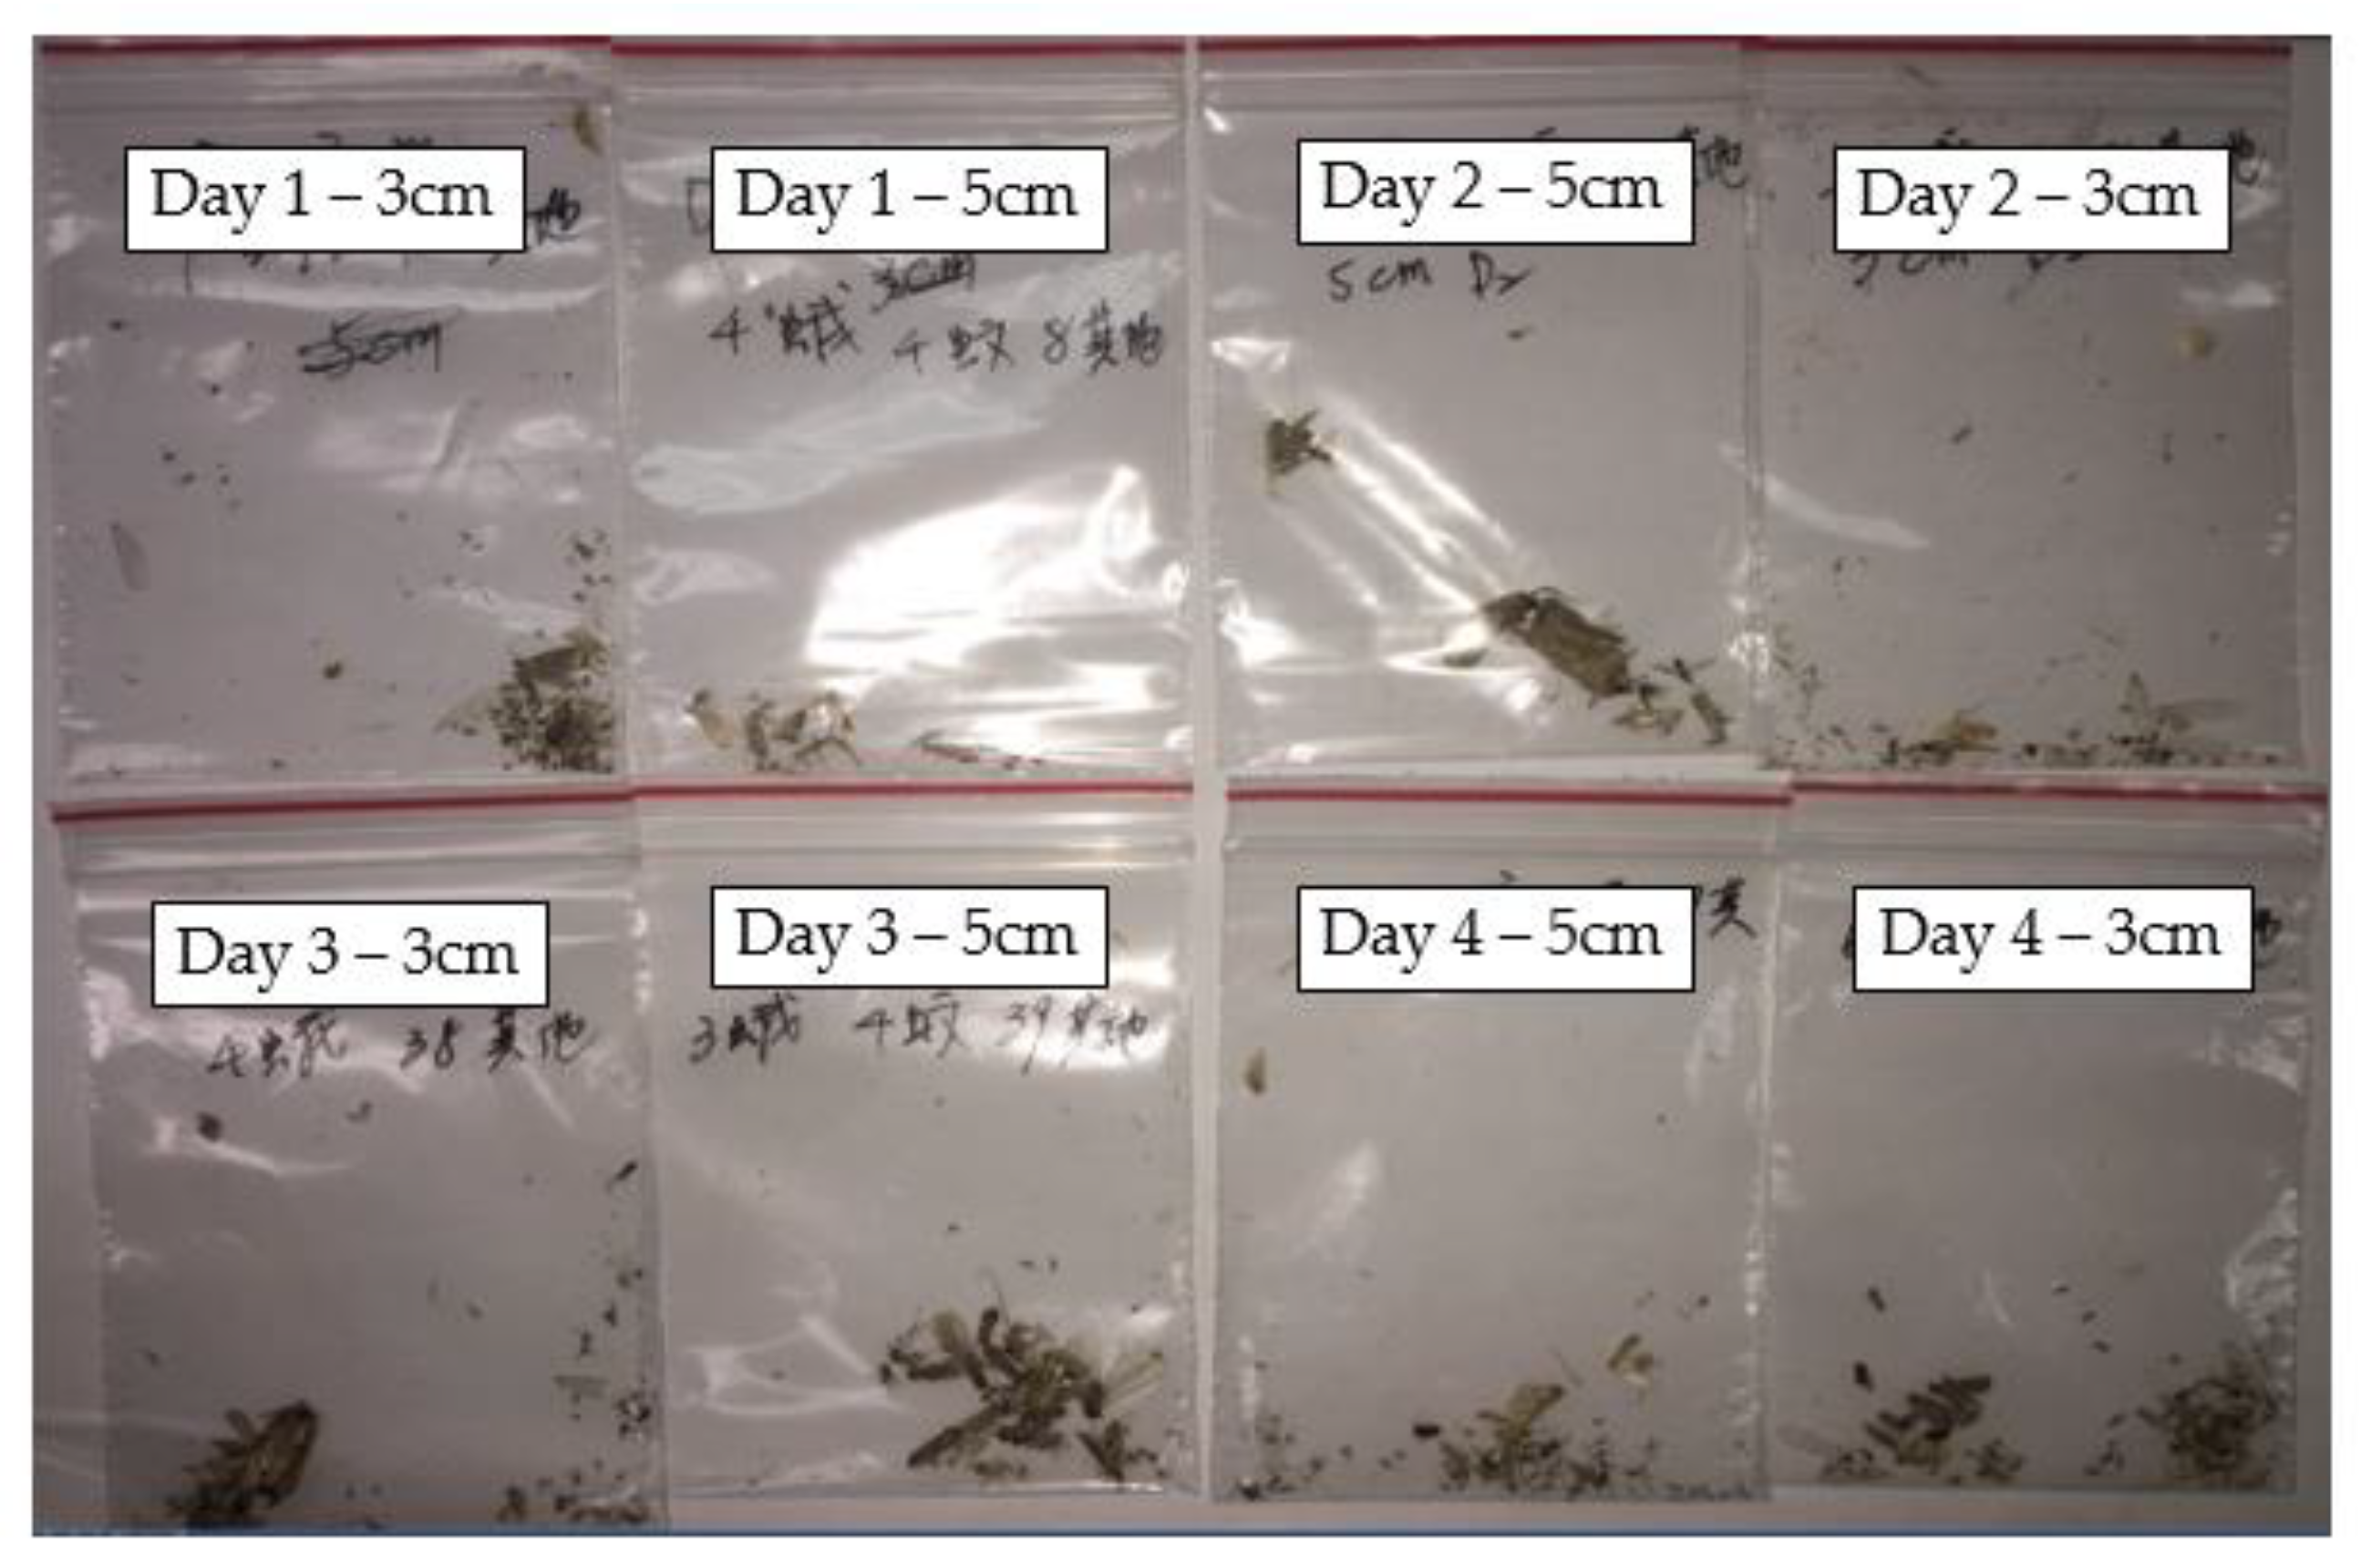
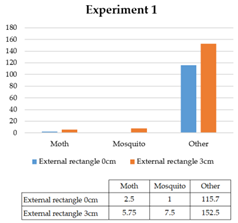
The comparison between the 0 cm and 3 cm units in catching mosquitoes under specified experimental conditions is outlined in this chapter. The results depicted in Figure 13 and Table 13 indicate a clear superiority of the 3 cm unit over the 0 cm unit in terms of mosquito-capturing efficiency. Notably, the images predominantly show gnats and clothes moths for the 0 cm unit, while Aedes aegypti mosquitoes are prevalent for both units. Analysis of the mosquito data table further confirms that the 3 cm unit captures a higher number of mosquitoes across various types compared to the 0 cm unit, indicating its superior efficiency. In Experiment 1, it was established that among the shorter sizes, the 3 cm unit exhibits better mosquito-catching capabilities. Additionally, simulation results presented demonstrate favorable metrics such as wind speed enhancement extension distance, light intensity (cd), luminous area (cm2), and average mosquito count for the 3 cm unit compared to the 0 cm unit. The only parameter where the 0 cm unit outperforms the 3 cm unit is the light divergence angle half-opening angle (θ). Nonetheless, despite this, as numerous conditions favor the 3 cm unit, it remains uncertain which specific condition contributes the most to optimizing the mosquito trap. Further experiments are warranted to validate these findings and ascertain the optimal parameters for mosquito trapping.
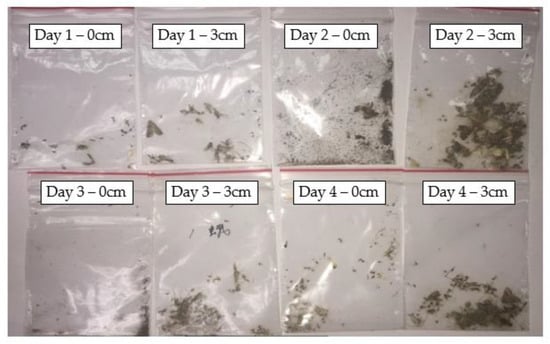
Figure 13.
The experimental result 1 compares the mosquito trap device using units of 0 cm and 3 cm over four days.
Table 13.
Measured light shape data table for 7 cm unit.
Utilizing the 0 cm and 3 cm units, mosquito trapping was compared under the experimental conditions delineated at the onset of this chapter. The experimental findings are presented in Figure 13 and detailed in Table 14 and Table 15.
Table 14.
The quantity of mosquitoes in the experimental results of Experiment 1.
Table 15.
Experiment 1—Experimental results analysis.
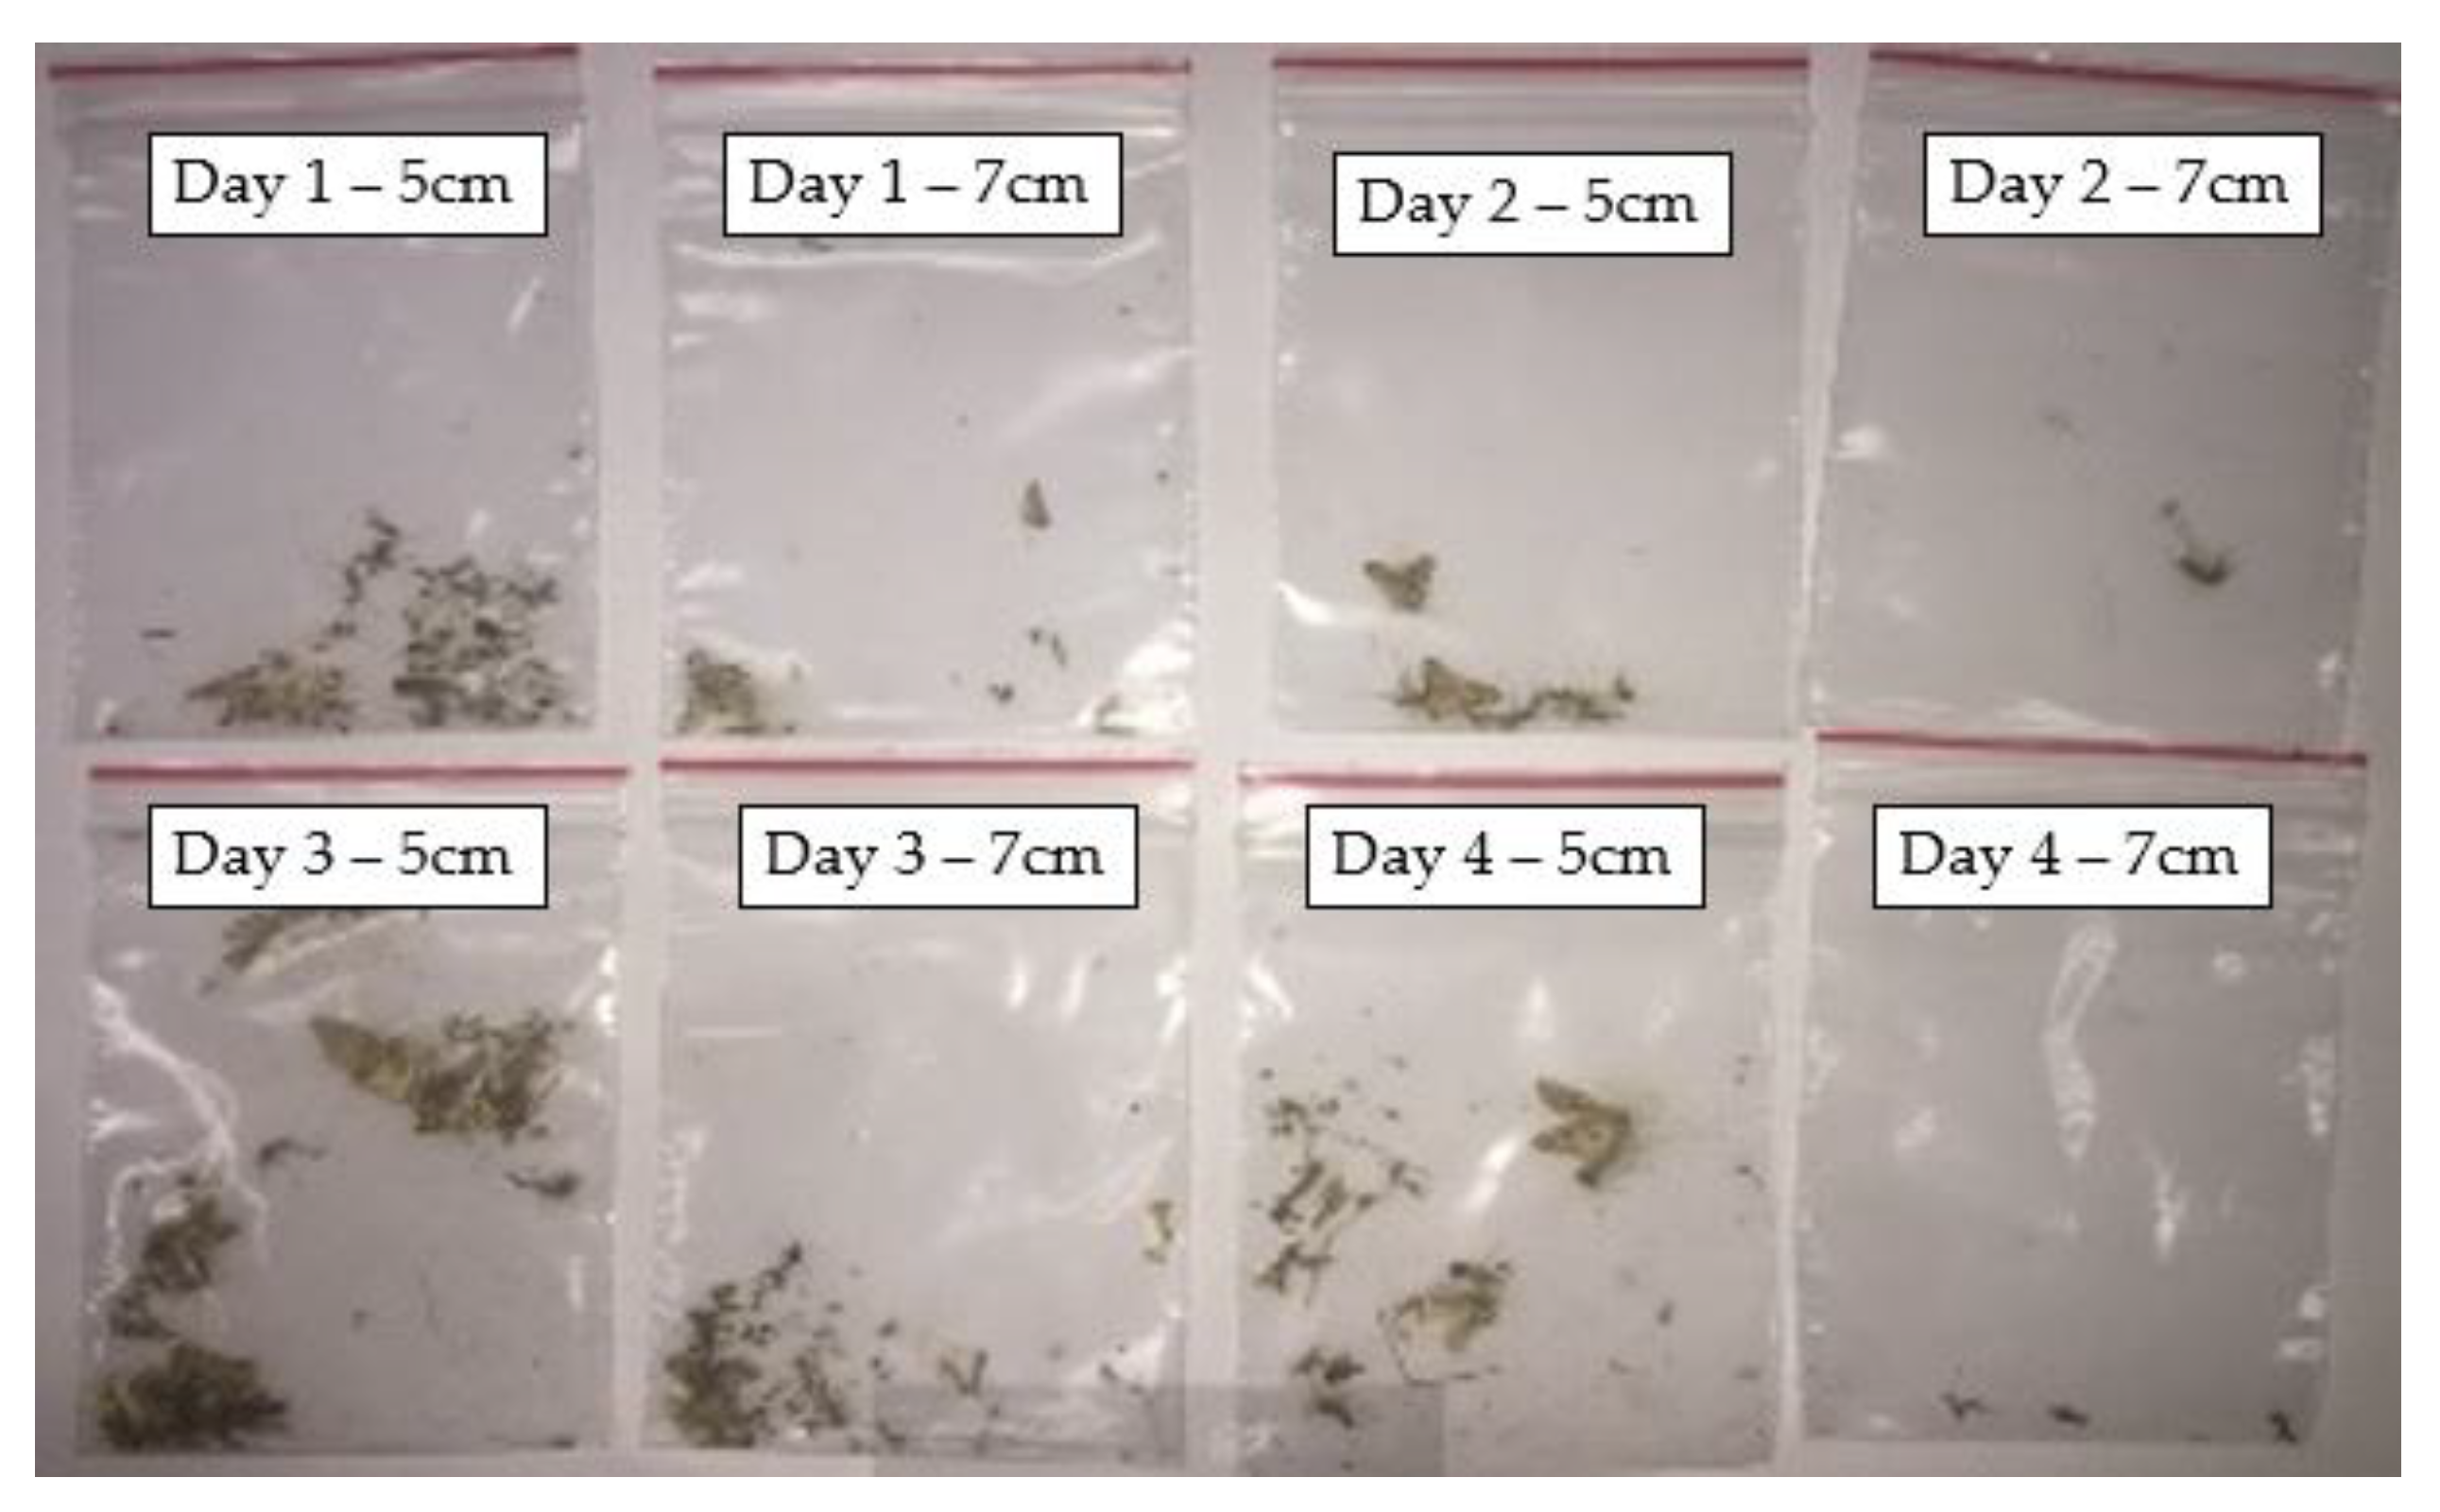
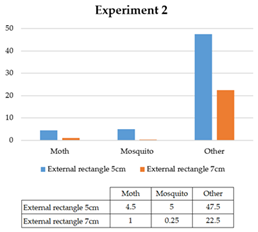
Experiment 2 involved using 5 cm and 7 cm units to capture mosquitoes under conditions identical to those in Experiment 1. The experimental results are depicted in Figure 14 and summarized in Table 16 and Table 17. Owing to the consistent location, the types of mosquitoes captured were similar to those in Experiment 1. Notably, the 5 cm unit outperformed the 7 cm unit across various mosquito species. This indicates that the mosquito-trapping efficiency of the 5 cm unit surpasses that of the 7 cm unit. Moreover, after substituting the simulation results with the mosquito trapping data, it was observed that while the luminous area of the 5 cm unit was inferior to that of the 7 cm unit, it excelled in light divergence angle (θ) and light intensity (cd). Therefore, based on Experiments 1 and 2, it can be inferred that light intensity is the primary factor contributing to the optimization of mosquito-trapping efficiency.
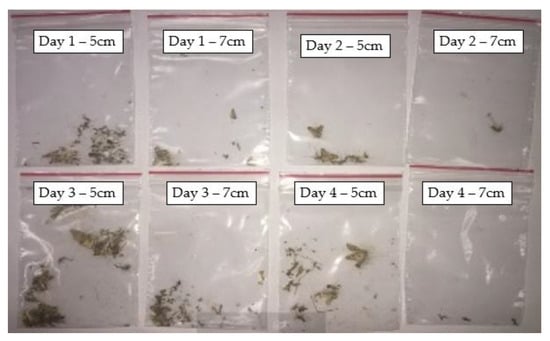
Figure 14.
Experimental result 2 compares the mosquito trap device using 5 cm and 7 cm units over four days.
Table 16.
The quantity of mosquitoes in the experimental results of Experiment 2.
Table 17.
Experiment 2—Experimental results analysis.
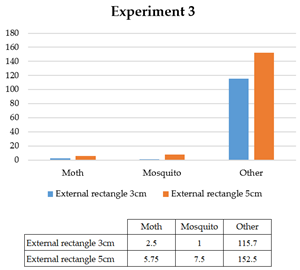
In experiments 1 and 2, we designated the 3 cm and 5 cm units as the experimental units for Experiment 3. Subsequently, these two units were utilized to capture mosquitoes. The experimental conditions remained consistent with those of the preceding experiments. The results of these experiments are presented in Figure 15 and Table 18 and Table 19. It is apparent from the data that there exists a discernible discrepancy in the number of mosquitoes captured by the 3 cm unit compared to the 5 cm unit. Henceforth, upon scrutiny of Table 18, it becomes apparent that the 5 cm unit displays superior efficacy in ensnaring moths and mosquitoes, while the 3 cm unit excels particularly in capturing diminutive insects. After this analysis, the simulation outcomes are transcribed into Table 19, elucidating that the 3 cm unit surpasses the 5 cm unit exclusively regarding the light divergence angle (θ). The practical execution of mosquito entrapment demonstrates proficiency in ensnaring diminutive insects. Moreover, the 5 cm unit exhibits notable performance in light intensity, luminous area, and wind speed. Concerning actual mosquito capture, it is evident that the 5 cm unit excels in capturing both moths and mosquitoes.
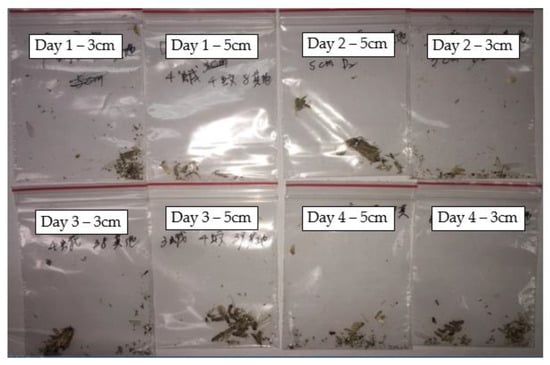
Figure 15.
The experimental result 3 compares the mosquito trap device using units of 3 cm and 5 cm over four days.
Table 18.
The number of mosquitoes caught in Experiment 3.
Table 19.
Experiment 3—Experimental results analysis.
Following Experiments 1 and 2, it was established that the principal factor influencing the optimization of mosquito-trapping efficiency is the light intensity within the mosquito trapping system. However, upon the culmination of Experiment 3, it was discerned that while light intensity remains paramount, its significance is not absolute. From an experimental standpoint, it was observed that the light intensity is robust. Yet, the light divergence angle is insufficiently broad, and the attraction radius for mosquitoes may be limited, thereby diminishing the efficacy of capturing smaller insects. Conversely, if the light divergence angle is extensive but the light intensity and other pertinent conditions are inadequate, it may diminish the likelihood of capturing mosquitoes and moths. Consequently, in our practical endeavors of mosquito capture, two components were identified as optimizing capture efficiency: the 3 cm component and the 5 cm machine part. The 3 cm component is apt for capturing diminutive insects, whereas the 5 cm part demonstrates superior efficacy in capturing moths and mosquitoes.
4. Conclusions and Discussions
In Experiment 1, notwithstanding the broader light divergence angle exhibited by the 0 cm unit, its efficacy in mosquito capture proved inferior to that of the 3 cm unit, thus underscoring the significance of additional variables. Experiment 2 revealed the superior mosquito-catching efficiency of the 5 cm unit compared to the 3 cm and 7 cm units, albeit with diminished wind speed and luminous area under optimized conditions. Furthermore, Experiment 3 demonstrated that while the 3 cm unit excelled in capturing small insects, its overall mosquito capture fell short. This implies that a larger light divergence angle significantly influences the capture of smaller insects under identical conditions. Additionally, Experiment 3 highlighted that the total mosquito count of the 5 cm unit was inferior to that of the 3 cm unit, yet it outperformed in capturing moths and mosquitoes. When comparing parameter conditions, the 5 cm unit exhibited higher light intensity, luminous area, and wind speed, with the sole drawback being a marginally smaller light divergence angle compared to the 3 cm unit. Integrating findings from these experiments, optimal mosquito-catching efficiency necessitates striking a balance between light intensity and light divergence angle, with luminous area and wind speed serving as ancillary factors.
Upon meticulous analysis and practical mosquito capture, two mosquito collection units were developed: the 3 cm and 5 cm variants. In optimizing mosquito-catching lamps, we discerned the paramount importance of our initial optimization conditions. However, perfection in each facet proved unattainable due to certain constraints. Consequently, a nuanced equilibrium between high light intensity (cd) and an optimal light divergence half angle (θ) is indispensable for the effective capture of moths and mosquitoes. Similarly, enhancing the capture of smaller insects necessitates a heightened light divergence half angle (θ) coupled with adequate light intensity, thereby accentuating the pursuit of equilibrium as the central focus of this study.
Author Contributions
J.-C.C. constructed the model, collected the data, and authored the manuscript; Y.-C.C. contributed to designing research and edited the manuscript; W.-Y.L. conducted the simulation, performed experiments, and measured the model; X.-H.N. assisted in manuscript writing and analysis of specific experimental findings. H.-Y.L. conceived the initial concept, oversaw the project, and reviewed and revised the manuscript. All authors have read and agreed to the published version of the manuscript.
Funding
This work is funded in part by National Science and Technology Council project number MOST 111-2635-E-242-001 - & MOST 111-2635-E-242-002 -.
Data Availability Statement
The data provided in this study can be requested from the corresponding author. Subsequent experiments in our laboratory will be updated and developed.
Conflicts of Interest
The authors declare no conflicts of interest.
References
- Zinser, M.; Ramberg, F.; Willott, E. Scientific Note Culex Quinquefasciatus (Diptera: Culicidae) as a Potential West Nile Virus Vector in Tucson, Arizona: Blood Meal Analysis Indicates Feeding on Both Humans and Birds. J. Insect Sci. 2004, 4, 20. [Google Scholar] [CrossRef]
- Chang, C.; Ortiz, K.; Ansari, A.; Gershwin, M.E. The Zika Outbreak of the 21st Century. J. Autoimmun. 2016, 68, 1–13. [Google Scholar] [CrossRef] [PubMed]
- Liu, Y.-N.; Liu, Y.-J.; Chen, Y.-C.; Ma, H.-Y.; Lee, H.-Y. Enhancement of Mosquito Trapping Efficiency by Using Pulse Width Modulated Light Emitting Diodes. Sci. Rep. 2017, 7, 40074. [Google Scholar] [CrossRef]
- Chen, H.L.; Tang, R.B. Why Zika virous infection has become a public health concern? J. Chin. Med. Assoc. 2016, 79, 174–178. [Google Scholar] [CrossRef]
- Bidlingmayer, W.L. How mosquitoes see traps: Role of visual responses. J. Am. Mosq. Control Assoc. Mosq. News 1994, 10, 272–279. [Google Scholar]
- Browne, S.M.; Bennett, G.F. Response of mosquitoes (Diptera: Culicidae) to visual stimuli. J. Med. Entomol. 1981, 18, 505–521. [Google Scholar] [CrossRef]
- Kay, R.E. Fluorescent materials in insect eyes and their possible relationship to ultra-violet sensitivity. J. Insect Physiol. 1969, 15, 2021–2028. [Google Scholar] [CrossRef]
- Shimoda, M.; Honda, K.I. Insect reactions to light and its applications to pest management. Appl. Entomol. Zool. 2013, 48, 413–421. [Google Scholar] [CrossRef]
- Burkett, D.A.; Butler, J.F.; Kline, D.L. Field evaluation of colored light-emitting diodes as attractants for woodland mosquitoes and other Diptera in north central Florida. J. Am. Mosq. Control Assoc. Mosq. New 1998, 14, 186–195. [Google Scholar]
- Dilling, S.C.; TenBroeck, S.H.; Hogsette, J.A.; Kline, D.L. Comparison of Trap and Equine Attraction to Mosquitoes. Insects 2023, 14, 374. [Google Scholar] [CrossRef] [PubMed]
- Rauhöft, L.; Șuleșco, T.; Martins-Afonso, S.M.; Schmidt-Chanasit, J.; Jöst, H.; Sauer, F.G.; Lühken, R. Large-Scale Performance Assessment of the BG-Counter 2 Used with Two Different Mosquito Traps. 2024. Available online: https://www.researchsquare.com/article/rs-4003006/v1 (accessed on 3 May 2024).
- Lai, M.F.; Anh, N.D.Q.; Gao, J.Z.; Ma, H.Y.; Lee, H.Y. Design of multi-segmented freeform lens for LED fishing/working lamp with high efficiency. Appl. Opt. 2015, 54, E69–E74. [Google Scholar] [CrossRef] [PubMed]
- Lee, H.W.; Lin, B.S. Improvement of illumination uniformity for LED flat panel light by using micro-secondary lens array. Opt. Express 2012, 20, A788–A798. [Google Scholar] [PubMed]
- Nguyen, X.-H.; Chen, C.-M.; Le, H.-T.; Lee, H.-Y. Enhancement of a Single-Axis Femtosecond Laser Scanning System by Using Two Galvanometers to Improve the Telecentricity and the Effective Scanning Length on Laser Process. Appl. Sci. 2022, 12, 12434. [Google Scholar] [CrossRef]
- Aris RS NA, R.; Sulong, A.A.; Aw, S.R.; Azimi, F.H.; Syafie, L.S. Harnessing Sun Power for Mosquito Control and Smart Air Quality Monitoring. Curr. Perspect. Phys. Sci. Res. 2024, 8, 112–127. [Google Scholar]
- Hiroshi, T. Photocatalyst Diagram; Shangzhou Publishing: Taipei, Taiwan, 2003. [Google Scholar]
- Centers for Disease Control; Ministry of Health and Welfare; R.O.C. (Taiwan). An Introduction to the Epidemiology of Dengue Fever, Prevention Policies, and Relevant Laws and Regulations. Available online: http://www.cdc.gov.tw/downloadfile.aspx?fid=00A3CFA-4265F1A4C (accessed on 5 January 2015).
- Muir, L.E.; Kay, B.H.; Thorne, M.J. Aedes aegypti (Diptera: Culicidae) Vision: Response to Stimuli from the Optical Environment. J. Med. Entomol. 1992, 29, 445–450. [Google Scholar] [CrossRef] [PubMed]
- Adriana, D.B.; Lars, C. The Evolution of Color Vision in Insects. Annu. Rev. Entomol. 2001, 46, 471–510. [Google Scholar]
- Introduction to the Ecology and Habits of Dengue Vector Mosquitoes; Department of Disease Control of the Department of Health: Taipei, Taiwan, 2014.


Disclaimer/Publisher’s Note: The statements, opinions and data contained in all publications are solely those of the individual author(s) and contributor(s) and not of MDPI and/or the editor(s). MDPI and/or the editor(s) disclaim responsibility for any injury to people or property resulting from any ideas, methods, instructions or products referred to in the content. |
© 2024 by the authors. Licensee MDPI, Basel, Switzerland. This article is an open access article distributed under the terms and conditions of the Creative Commons Attribution (CC BY) license (https://creativecommons.org/licenses/by/4.0/).