Communication

High-Precision Low-Cost Mid-Infrared Photoacoustic Gas Sensor Using Aspherical Beam Shaping for Rapidly Measuring Greenhouse Gases

by
Qingping Hu
1,2,†,
Yan Ai
1,†,
Chaotan Sima
1,*,
Yu Sun
1,2,
Zhiyu Feng
1,
Tailin Li
1,
Chen Tong
1,
Xiaohong Cao
1,
Wenzhe Wang
1,
Runze Fan
1,
Yufeng Pan
1 and
Ping Lu
1,*
1
Next Generation Internet Access National Engineering Research Center, School of Optical and Electronic Information, Huazhong University of Science and Technology, Wuhan 430074, China
2
School of Ordnance Engineering, Naval University of Engineering, Wuhan 430033, China
*
Authors to whom correspondence should be addressed.
These authors contributed equally to this work.
Photonics 2024, 11(7), 590; https://doi.org/10.3390/photonics11070590
Submission received: 3 June 2024 / Revised: 22 June 2024 / Accepted: 23 June 2024 / Published: 25 June 2024
(This article belongs to the Section Lasers, Light Sources and Sensors)

Abstract

:
A high-precision low-cost mid-infrared photoacoustic sensor for greenhouse composite gases based on aspherical beam shaping is proposed and demonstrated. The assembled optical source module and luminous characteristics of infrared source are innovatively investigated and analyzed with aspherical beam shaping. The proposed aspherical-beam-shaping-technique could effectively reduce optical loss and enhance system sensitivity, achieving an effective power utilization ratio of a radiation source of 91% and sidewall noise ratio of 8.9%. Experiments verify the 1.7 times improvement in responsivity and 50% enhancement in minimum detection limit (MDL) on average. In terms of comprehensive greenhouse gas composites and with short integration time of 1 s, MDLs of CO2, CH4, N2O, NF3, SF6, PFC-14, and HFC-134a are 73 ppb, 267 ppb, 72 ppb, 81 ppb, 14 ppb, 9 ppb and 115 ppb, respectively. Furthermore, a 48 h continuous monitoring of H2O, CO2 and CH4 in the atmosphere is conducted and verifies the performance of the gas sensor. The developed sensor allows for the rapid route of low-cost and high-precision detection of multiple greenhouse gases.

1. Introduction

High-precision detection of greenhouse gases is primarily required for achieving emission reduction. The traditional optical methods for detecting the greenhouse gases include non-dispersive infrared spectroscopy (NDIR) [1], cavity ring–down spectroscopy (CRDS) [2], Fourier transform spectroscopy (FTIR) [3], tunable diode laser absorption spectroscopy (TDLAS) [4,5], direct frequency comb spectroscopy (DFCS) [6], and photoacoustic spectroscopy (PAS) [7,8]. However, the detection sensitivity of sensors based on NDIR, CRDS, or TDLAS basically relies on stable optical paths and sensitive photodetectors. FTIR sensors also have limited anti-interference capabilities due to the essential Michelson interferometry. The DFCS technology requires superimposing difference frequency generation to generate mid-infrared and far-infrared optical combs, resulting in a rather complex configuration [9]. PAS with characteristics such as zero-background detection, full-band response, and compact scalability holds prominent application value [10,11].
In the PAS techniques, the light source directly affects the working modes and detection performance. These include popular narrow bandwidth lasers [12,13,14], mid-infrared LEDs [15], and infrared blackbody radiation sources [16]. Lasers are generally used to detect single-component gases in the resonant mode. For the detection of multi-component gases, the use of multiple lasers with different output wavelengths would complicate the system and increase costs. Kerr et al. [17] successfully measured the concentration of CO2 and H2O by using a CO2 laser and ruby laser. Yin et al. [18] combined the use of a quantum cascade laser (QCL), an interband cascade laser (ICL), and a distributed feedback laser (DFB) to achieve the detection of CO, CH4, and C2H2 gases. Mid-infrared LEDs have lower costs and could cover a wider range of wavelengths. Li et al. [19] used an LED with a center wavelength of 4300 nm to detect CO2, achieving an MDL of 15 ppm with an integration time of 200 s. However, the milliwatt output power of the mid-infrared LED restricts detection sensitivity.
Infrared blackbody radiation sources, which possess Watt-level high power, wideband spectral range, and low cost, provide an alternative approach for multi-component gas detection. It frequently suffers from the large divergence angle and free space luminous area; hence, there is an urgent need to polish this kind of high-power source for PAS implementations. Christensen [20,21] proposed a photoacoustic spectroscopy system composed of an infrared light source and optical filter to detect multi-component gases. Chen et al. [22] used a gold-coated ellipsoidal reflector and obtained MDLs of 10 ppb, 94 ppb, 24 ppb, 20 ppb, and 37 ppb for CO, CO2, CH4, C2H6, and C2H4. The integration time applied was 60 s to reach this MDLs. The sidewall noise of the photoacoustic cavity was not considered. Qiu et al. [23] utilized an aspherical reflector for optical beam concentration and achieved the incident light power of 1.32 W, sidewall noise ratio of 19.3%, and the MDLs of gases in transformer oil around 1 ppm. Although the proposed structures could improve the beam quality to a certain extent, there still exists considerable sidewall noise, resulting in challenges in ultra-sensitive gas detections. Therefore, the enhanced beam-shaping technique for the widely applied low-cost infrared blackbody radiation sources in PAS deserves further investigation.
In this work, we proposed and experimentally demonstrated a high-precision low-cost mid-infrared photoacoustic gas sensor for detecting comprehensive greenhouse composite gases with aspherical beam shaping. The multifunctional aspheric beam shaping for shaping, collimating and focusing the infrared blackbody radiation source was thoroughly designed and implemented. The effective power utilization ratio of the light source increased from 41% to 91%, while the sidewall noise ratio decreased from 58.6% to 8.9%. An ultra-sensitive and low-cost photoacoustic gas sensor for greenhouse gases was constructed based on the non-resonant cavity with an aspheric beam-shaping module. Seven greenhouse gases were tested, respectively, and the experimental results showed that, with beam shaping, the sensing responsivity increased by an average of 1.7 times and the MDLs decreased by 50% on average. The crosstalk suppression method for airborne water vapor and the major greenhouse gases of CH4 and CO2 was further verified. The assembled low-cost PAS gas sensor was applied to monitor greenhouse gases in the research lab for 48 h, confirming its long-term stability and sensing performance.

2. Theoretical Analysis

The Beer–Lambert theory describes the attenuation of light intensity when a beam of monochromatic light is absorbed by gas molecules. The intensity of the outgoing light absorbed by the gas molecules can be expressed as follows:
I ( v ) = I ( v 0 ) exp α ( v ) C L
where I(v) is the intensity of the outgoing light, I(v0) is the intensity of the incident light, α(v) is the absorption coefficient of the gas, C is the concentration of the gas, and L is the effective absorption path.
Photoacoustic spectroscopy is based on the principle of photoacoustic effect, which mainly includes two processes: heat generation and acoustic excitation. By absorbing the periodically modulated light, gas molecules transition from a low-energy state to a high-energy state, and then release heat energy through the non-radiative transition to produce a periodically changing thermal field, and finally, acoustic waves are excited in the photoacoustic cell. When the modulation frequency of the incident light is exactly matched with the angular frequency, the system works in resonant mode [24,25]. While the modulation frequency of the incident light is varied from the angular frequency, the system works at the non-resonant mode, and the photoacoustic signal amplitude can be expressed by the following:
S P A = A 0 ( ω ) = α P 0 C c e l l
where P0 is the optical power of the light and Ccell is the photoacoustic cell constant, which is related to the volume of the photoacoustic cell and resonance frequency, etc. Considering the beam quality and wavelength range, the infrared blackbody radiation sources are normally externally modulated; hence, the PAS sensors with this kind of light source are basically in the non-resonant mode.

3. Simulation

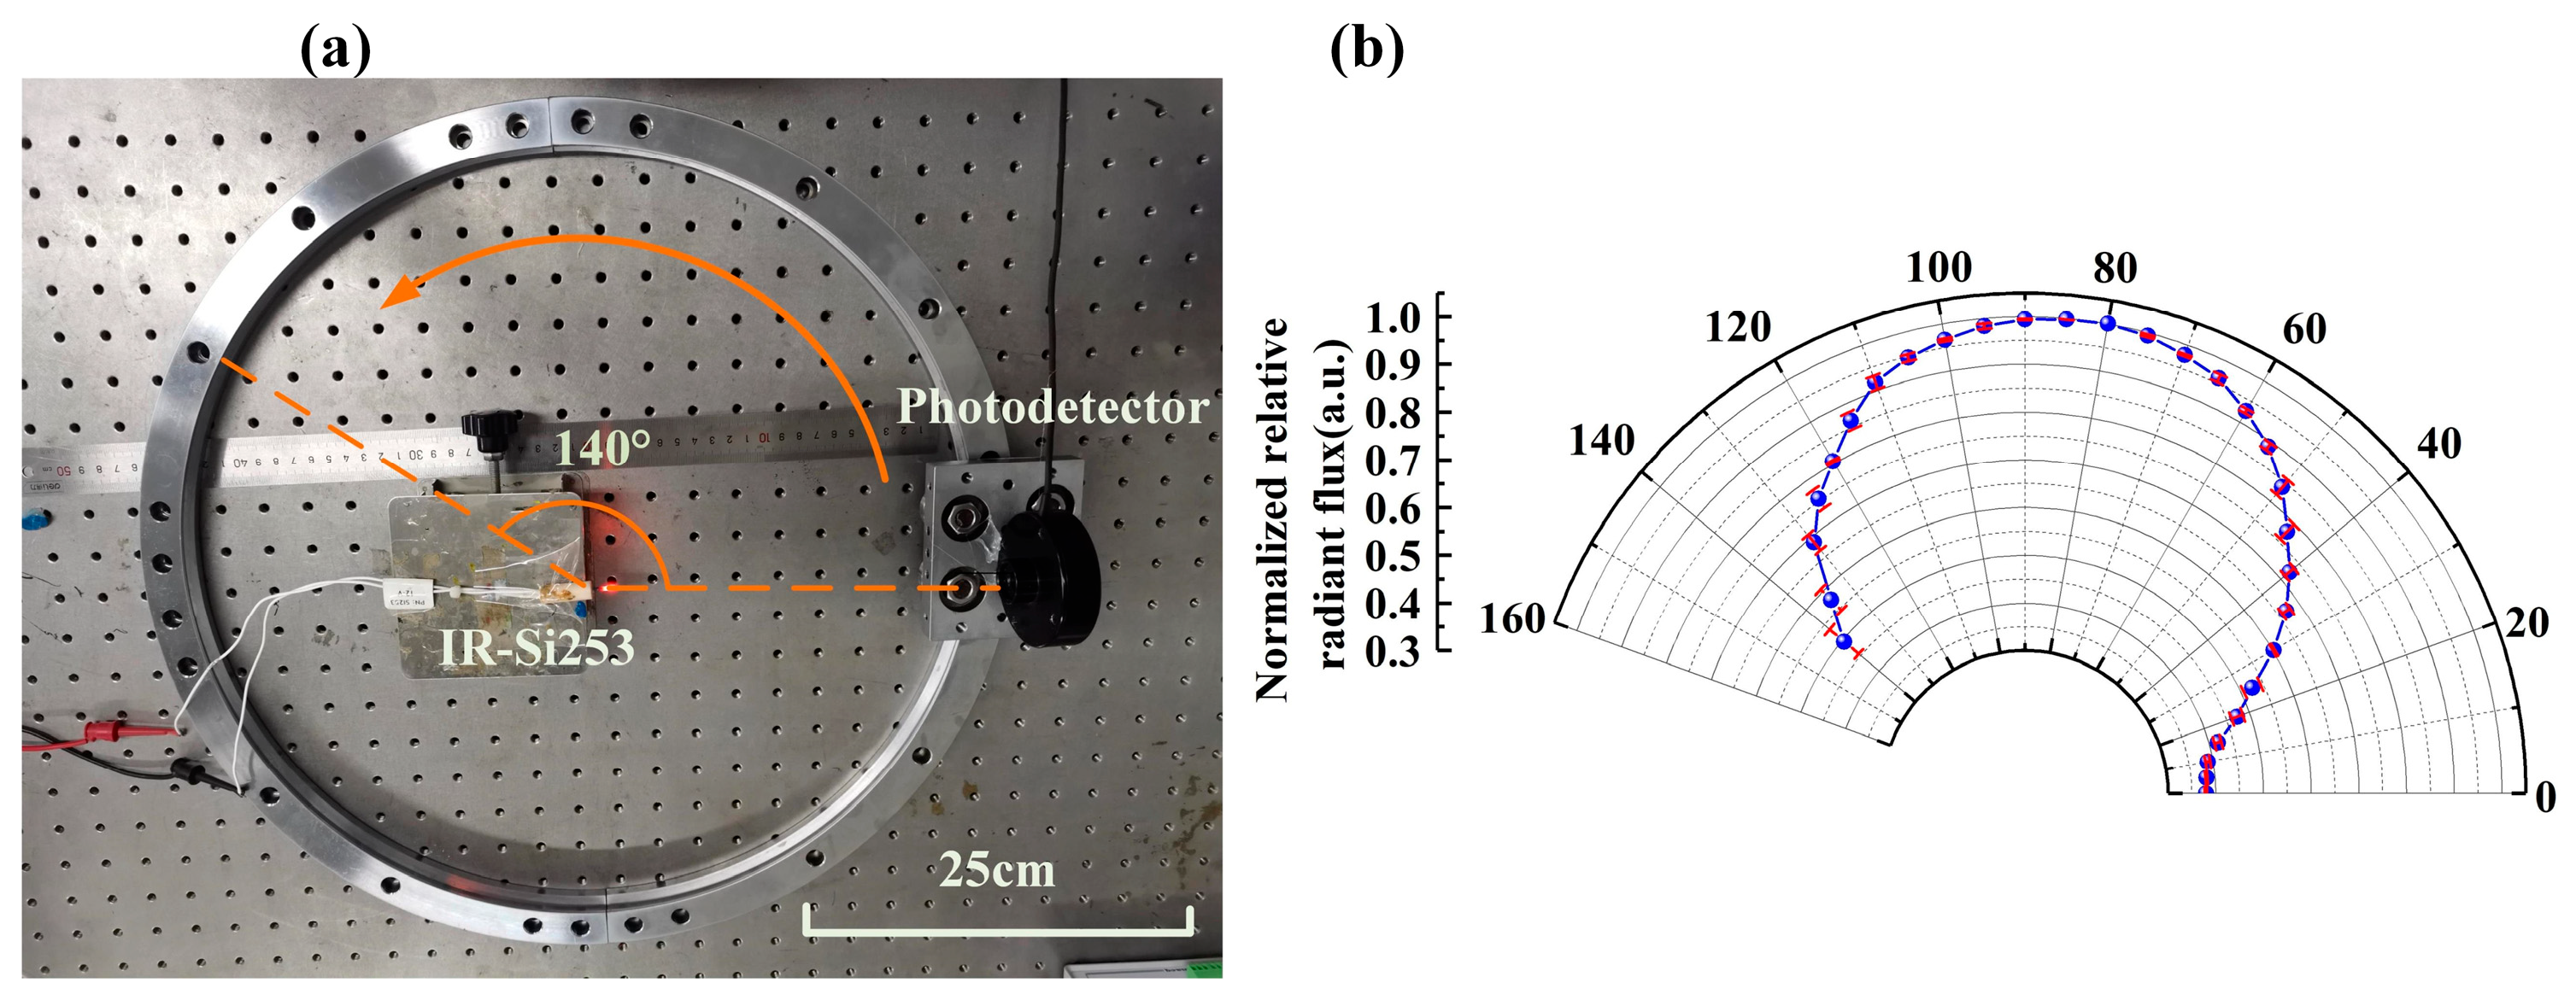
3.1. Simulation of Infrared Blackbody Radiation Source

In the proposed photoacoustic spectroscopy gas sensor, the infrared blackbody radiation source (IR-Si253, HAWEYE, Milford, CT, USA) is the key component, directly affecting the detection performance. The IR-Si253 is simulated using the radial source of the Zemax software (2019.4 version). Figure 1 shows the physical diagram and simulation of IR-Si253. It is a cylinder light source with a length of 12.7 mm and a diameter of 1.524 mm.
The light distribution characteristics of the light source are prerequisites for optical design. Figure 2 shows the IR-Si253 light distribution curve test system and its relative radiation flux–angle distribution.
The testing system consists of a circular guide with a radius of 25 cm, a photodetector (919P-003-10), a height-adjustable stand, and a light source. By rotating the detector to different angles, the optical power emitted by IR-Si253 from different angles is captured. In the experiment, it is guaranteed to be carried out in a dark room; the indoor temperature is 25 °C, the humidity is 50%, and the height of IR-Si253 is at the same level as the center of the induction area of the photodetector. The radiation angle of IR-Si253 is 0–140° with the majority in the range of 0–90°, and the radiation is relatively weak in the range of 90–140°. Hence, the radiation angle from 0° to 90° is set as the forward radiation source in the simulation while the radiation angle from 90° to 140° is set as the backward one. The light intensity ratios of the forward radiation source and backward radiation source are set to 63.76% and 36.24%, respectively.

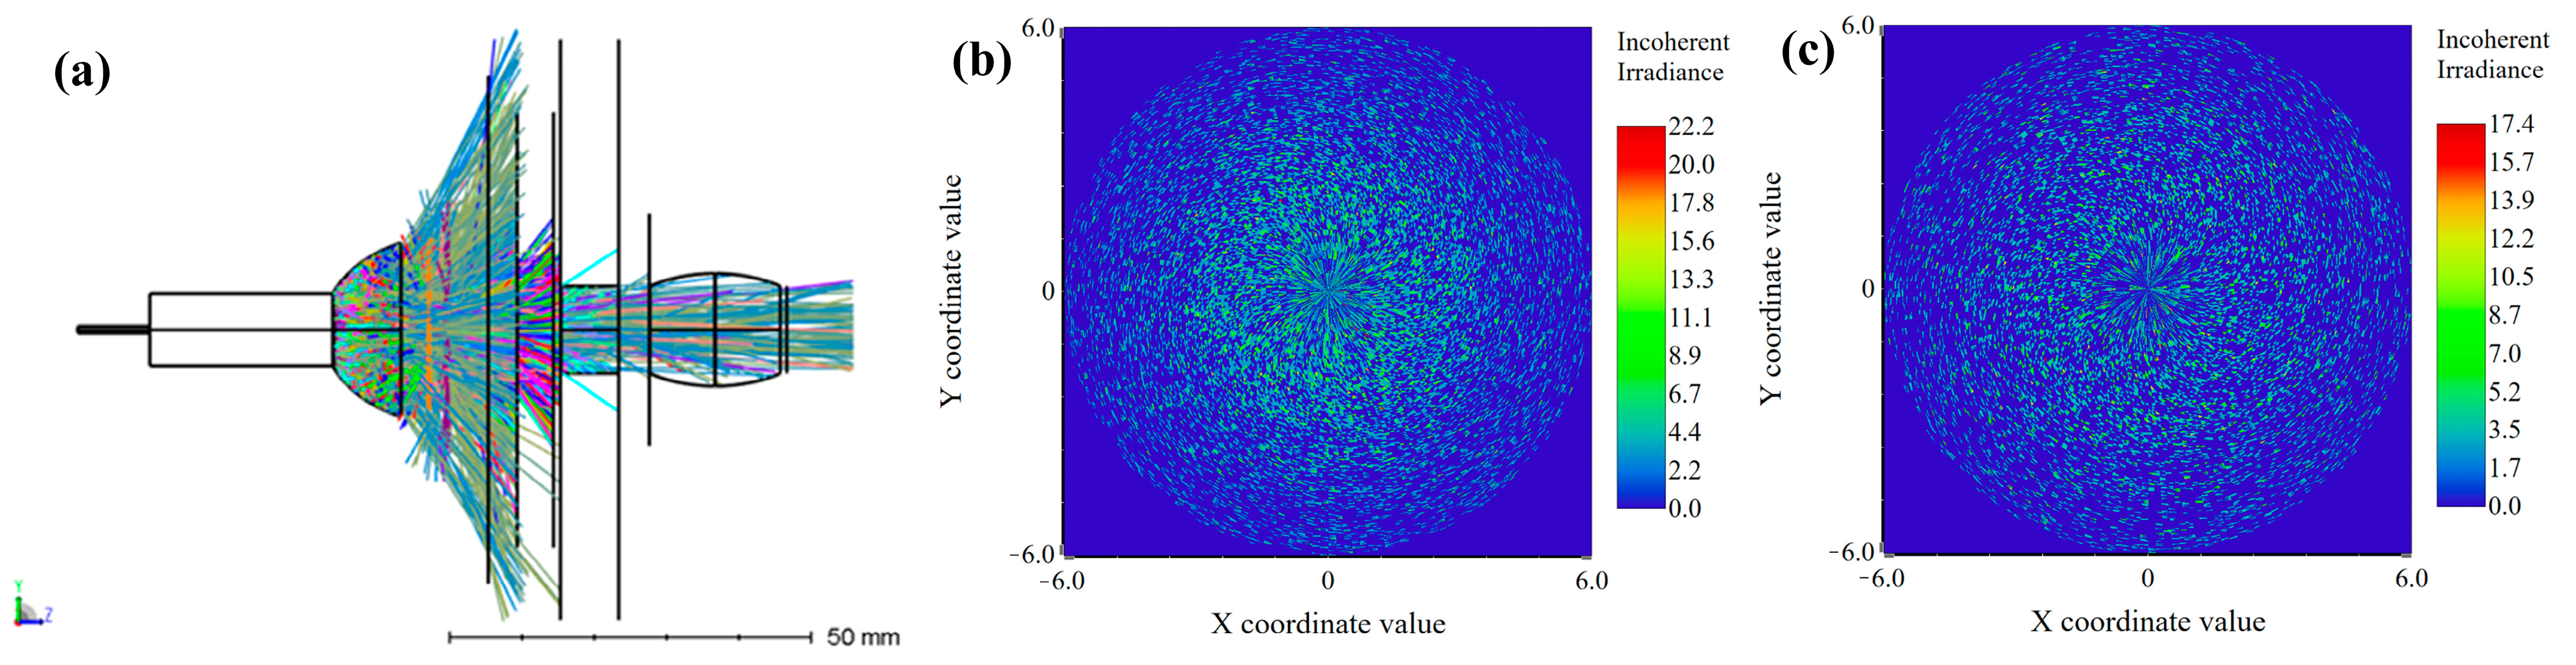
3.2. Design of Aspherical Optical Beam Shaping

The PAS system comprises an infrared blackbody radiation source, a chopper, a filter, a shutter, and an ellipsoidal photoacoustic (PA) cavity. The beam incident on the side wall of the cavity could heat up the cavity, leading to the solid photoacoustic effect and generating background noise, which is defined as sidewall noise. The sidewall noise ratio (Rnoise) is defined by
R n o i s e = ( P i n P o u t ) P i n × 100 %
where Pin is the optical power at the inlet of PA cavity and Pout is the optical power at the outlet of PA cavity. The effective power utilization ratio of the light source (η) can be defined by
η = P o u t P i n × 100 %
Figure 3 shows the ray-tracing diagram based on spherical lenses, input light spot diagram and output light spot diagram. The optical power at the outlet is 1.510 W and the optical power at the inlet is 0.947 W; thus, the effective light source utilization rate can be calculated to be 62%.
Employing aspherical lenses can reduce aberrations to improve focusing qualities, and one or two aspherical lenses can obtain similar or better optical quality [26]. This reduces the system volume, increases the cost rate, and reduces the overall cost of the system. The aspherical beam shaping in this work is designed and realized by the combination of an ellipsoidal reflector, an even hybrid aspherical lens and a plano-convex lens. The even hybrid aspherical lens is primarily to converge light rays to pass through the chopper and the filter. The plano-convex lens further converges with the light rays to propagate through the photoacoustic cavity completely and avoid striking the cavity inner walls utmost. In the Zemax software, the designed ellipsoidal reflector is represented by a standard surface. The standard surface has the following parameters: R1 (minimum aperture radius) is 5 mm and R2 (maximum aperture radius) is 12 mm. The even hybrid aspherical lens and plano-convex lens are co-designed and optimized. For example, the diameter of the designed even hybrid aspherical lens is 25.4 mm, the radius of curvature is 72.056, the conic coefficient is 7.18, and the second-order aspheric coefficient is −2.317 × 10⁻³. The chopper (MC1F2) is represented by two standard surfaces with a diameter of 70 mm each. The optical filter is represented by two standard surfaces with a spacing of 5 mm. Each standard surface has R1 of 10 mm and R2 of 30 mm. The baffle is represented by two standard surfaces with a spacing of 8 mm. Each surface has an R1 of 40 mm and an R2 of 6 mm. Two standard surfaces constitute an ellipsoidal PA cavity. Two detectors are placed at the inlet and outlet of the PA cavity to measure the optical power. Figure 4 shows the aspherical beam-shaping model established in the simulation.
The evaluation function in Zemax software is used to optimize the design of the aspherical surface. The aspherical surface parameters are set as variables; the sidewall noise ratio and the effective power utilization ratio of the light source are included in the calculation, and a system evaluation function editor is established. The optimal aspherical parameters are obtained by the damping least square method. Figure 5 shows the optical ray-tracing diagram, with and without the aspherical beam shaping. It is obvious in the red box that the beam incident to the photoacoustic cavity sidewall decreased; hence, an improved optical power ratio and SNR could be expected with the designed aspherical beam-shaping technique.
Figure 6 shows the light spots at the inlet and outlet of the PA cavity with and without the aspherical beam shaping. It is also indicated that the light spot at the outlet of the PA cavity is more concentrated using the designed aspherical beam-shaping technique.
Table 1 shows the comparison of optical parameters with and without the aspherical beam-shaping technique. The effective power utilization ratio of the light source increased from 41% to 91%, while the sidewall noise ratio decreased from 58.6% to 8.9%. Hence, the proposed technique could effectively constrain and shape the light emitted by IR-Si253, with benefits of reducing beam loss, minimizing the sidewall noise ratio, and enhancing the effective power utilization ratio of the optical power.

4. Experiment Details

4.1. Absorption Bands Selection of Gases

Figure 7 shows the absorption spectra of seven greenhouse gases as well as water vapor, in the wavelength range of 3000 to 12,000 nm at 296 K, 1 atm, according to the HITRAN database [27].
Considering the distributions of absorption spectra and the available infrared filters, a series of optical bandpass filters were purchased and used in the PAS system. Table 2 shows the selected center wavelengths and bandwidths of the optical filters for measuring CO2, CH4, N2O, SF6, NF3, PFC-14, HFC-134a, and H2O, respectively.

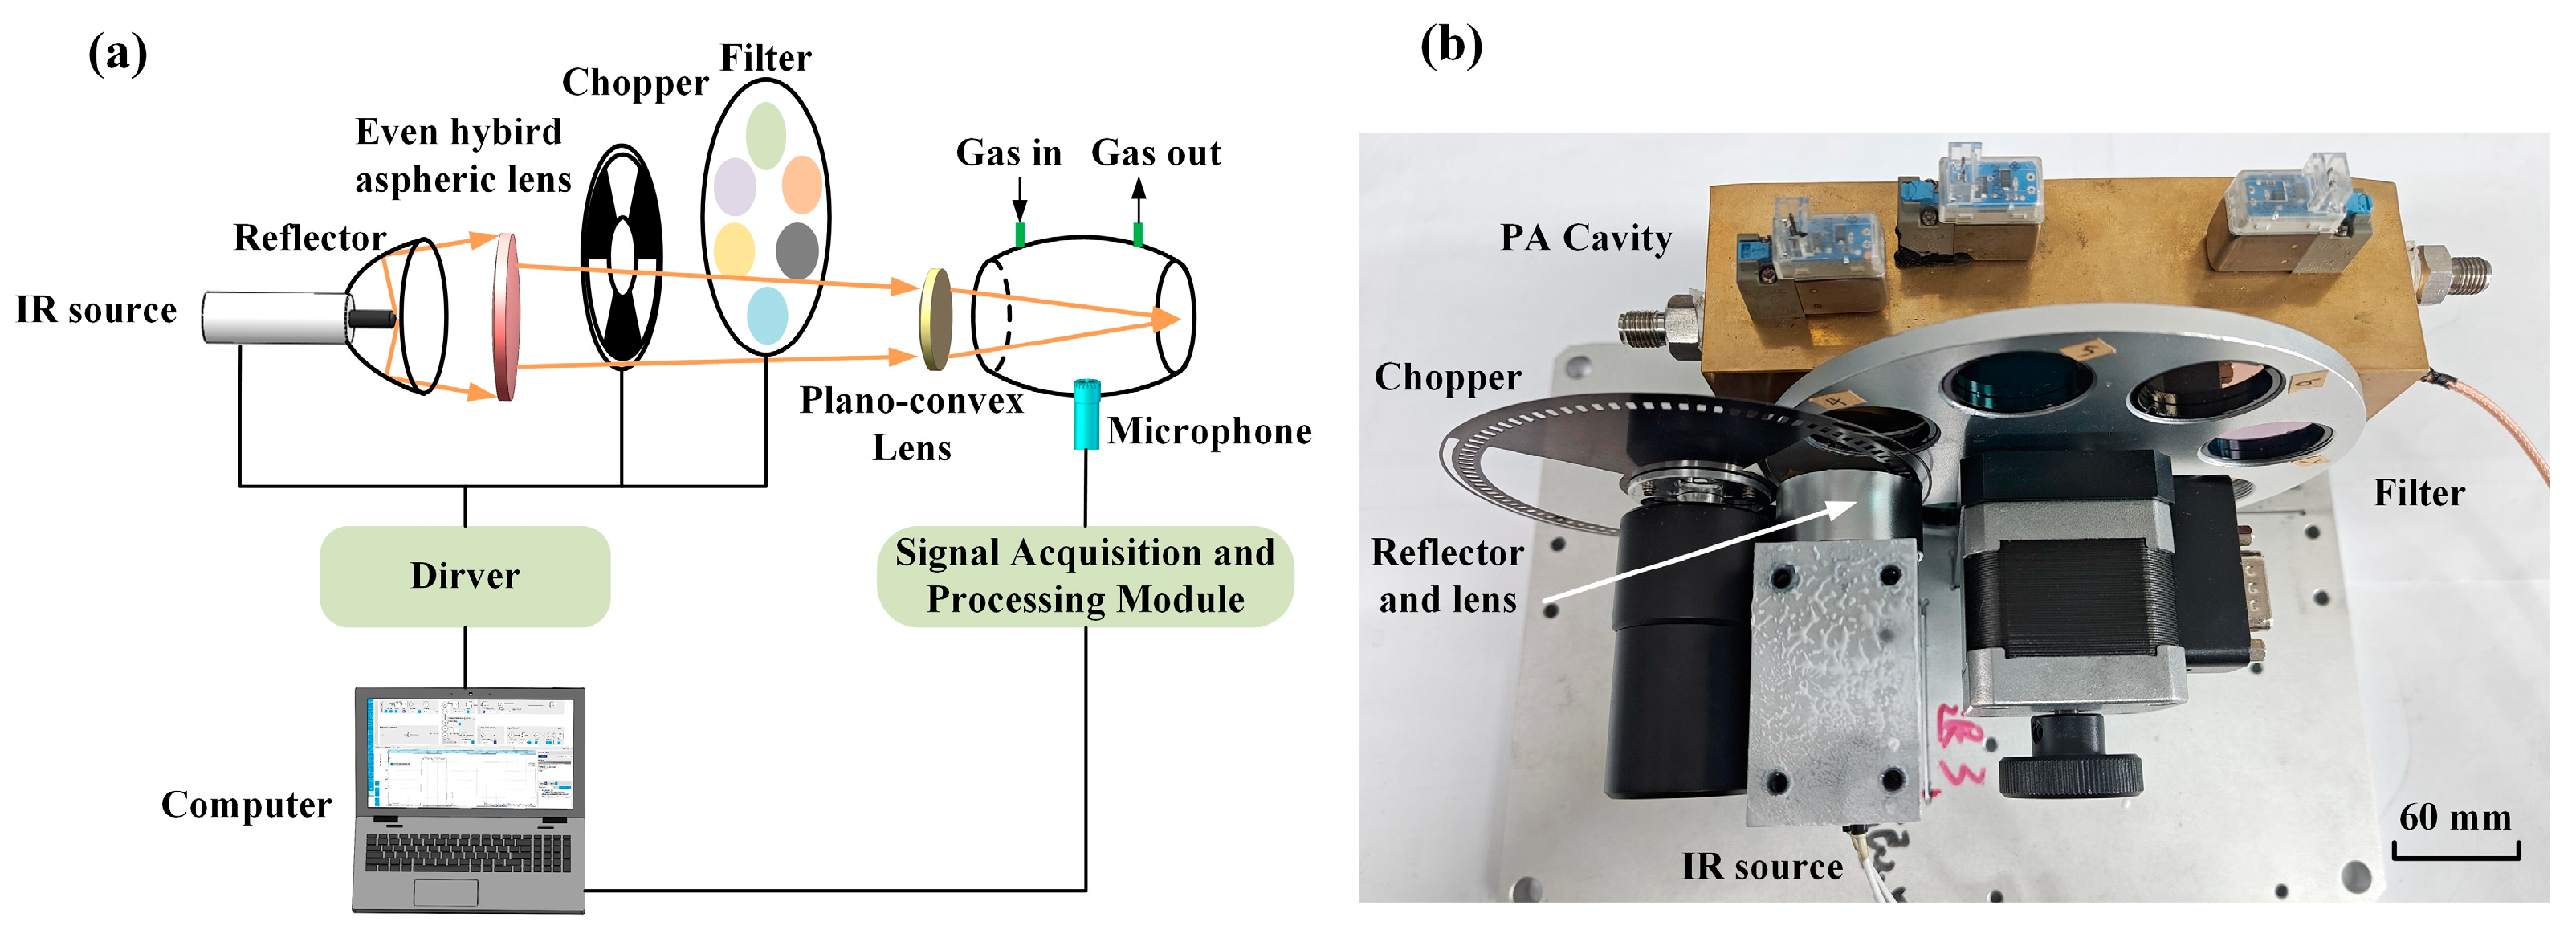
4.2. Experimental Setup

The photoacoustic gas sensor was established to measure the greenhouse composite gases, as schematically shown in Figure 8. The sensor includes a beam-shaping and modulation module for the light source, a photoacoustic cavity module and a signal acquisition and processing module. The beam-shaping and modulation module includes the IR-Si253 light source, the aspherical beam-shaping lenses, and the chopper and filter. The infrared light source is dissipated by the heat sink and the fan to ensure a stable working temperature. Using the simulation parameters, even hybrid aspherical lens and plano-convex lens made of zinc selenide were customized, and 2–11 μm anti-reflection film was further coated. The light source was mounted on a light holder with a heat sink. Figure 9 shows the monitoring results of the real-time driving current and the output optical power of the mid-infrared light source, indicating that it was stable and reliable during the experiment. The developed hardware circuit controls the chopper with a rotation frequency of 5 Hz and the specified optical filter. The photoacoustic cavity module includes an ellipsoidal PA cavity and a measurement microphone. The 1/2″ measurement microphone (CRY334, CRYSOUND, Hangzhou, China) is installed in the center of the ellipsoidal PA cavity to detect the generated acoustic pressure. All data are collected and processed by the laptop to invert the gas concentration.

5. Results and Discussion

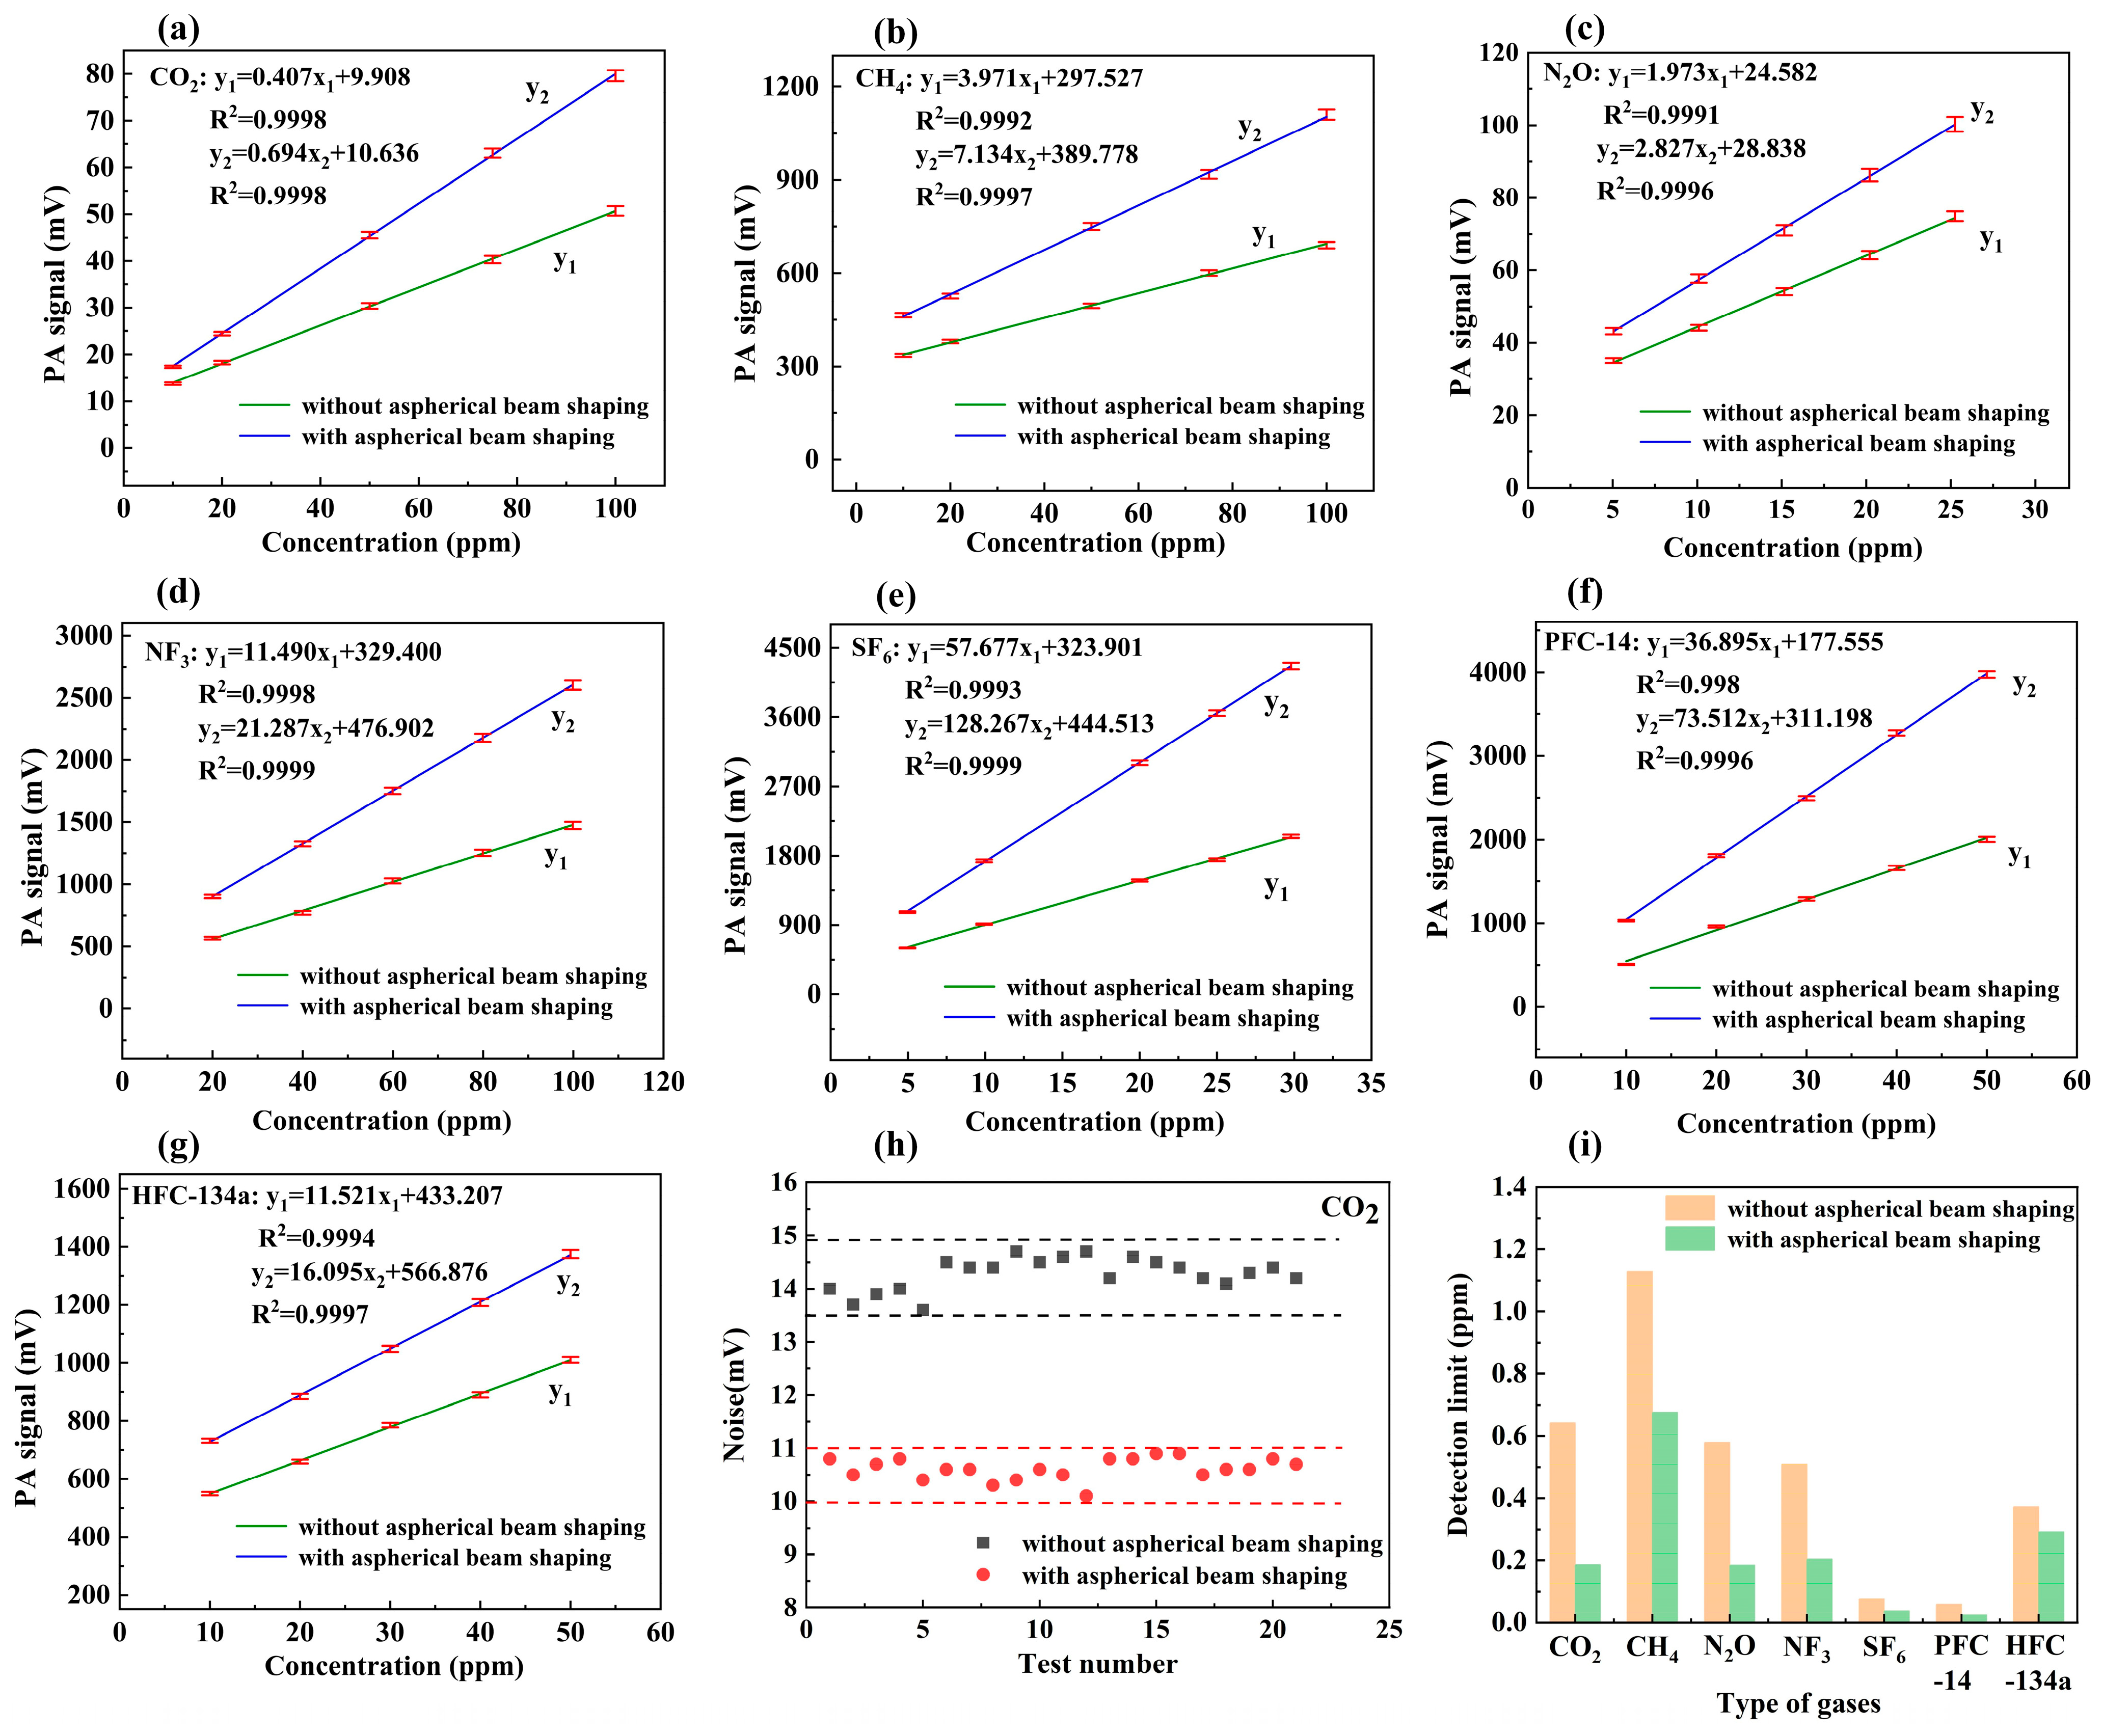
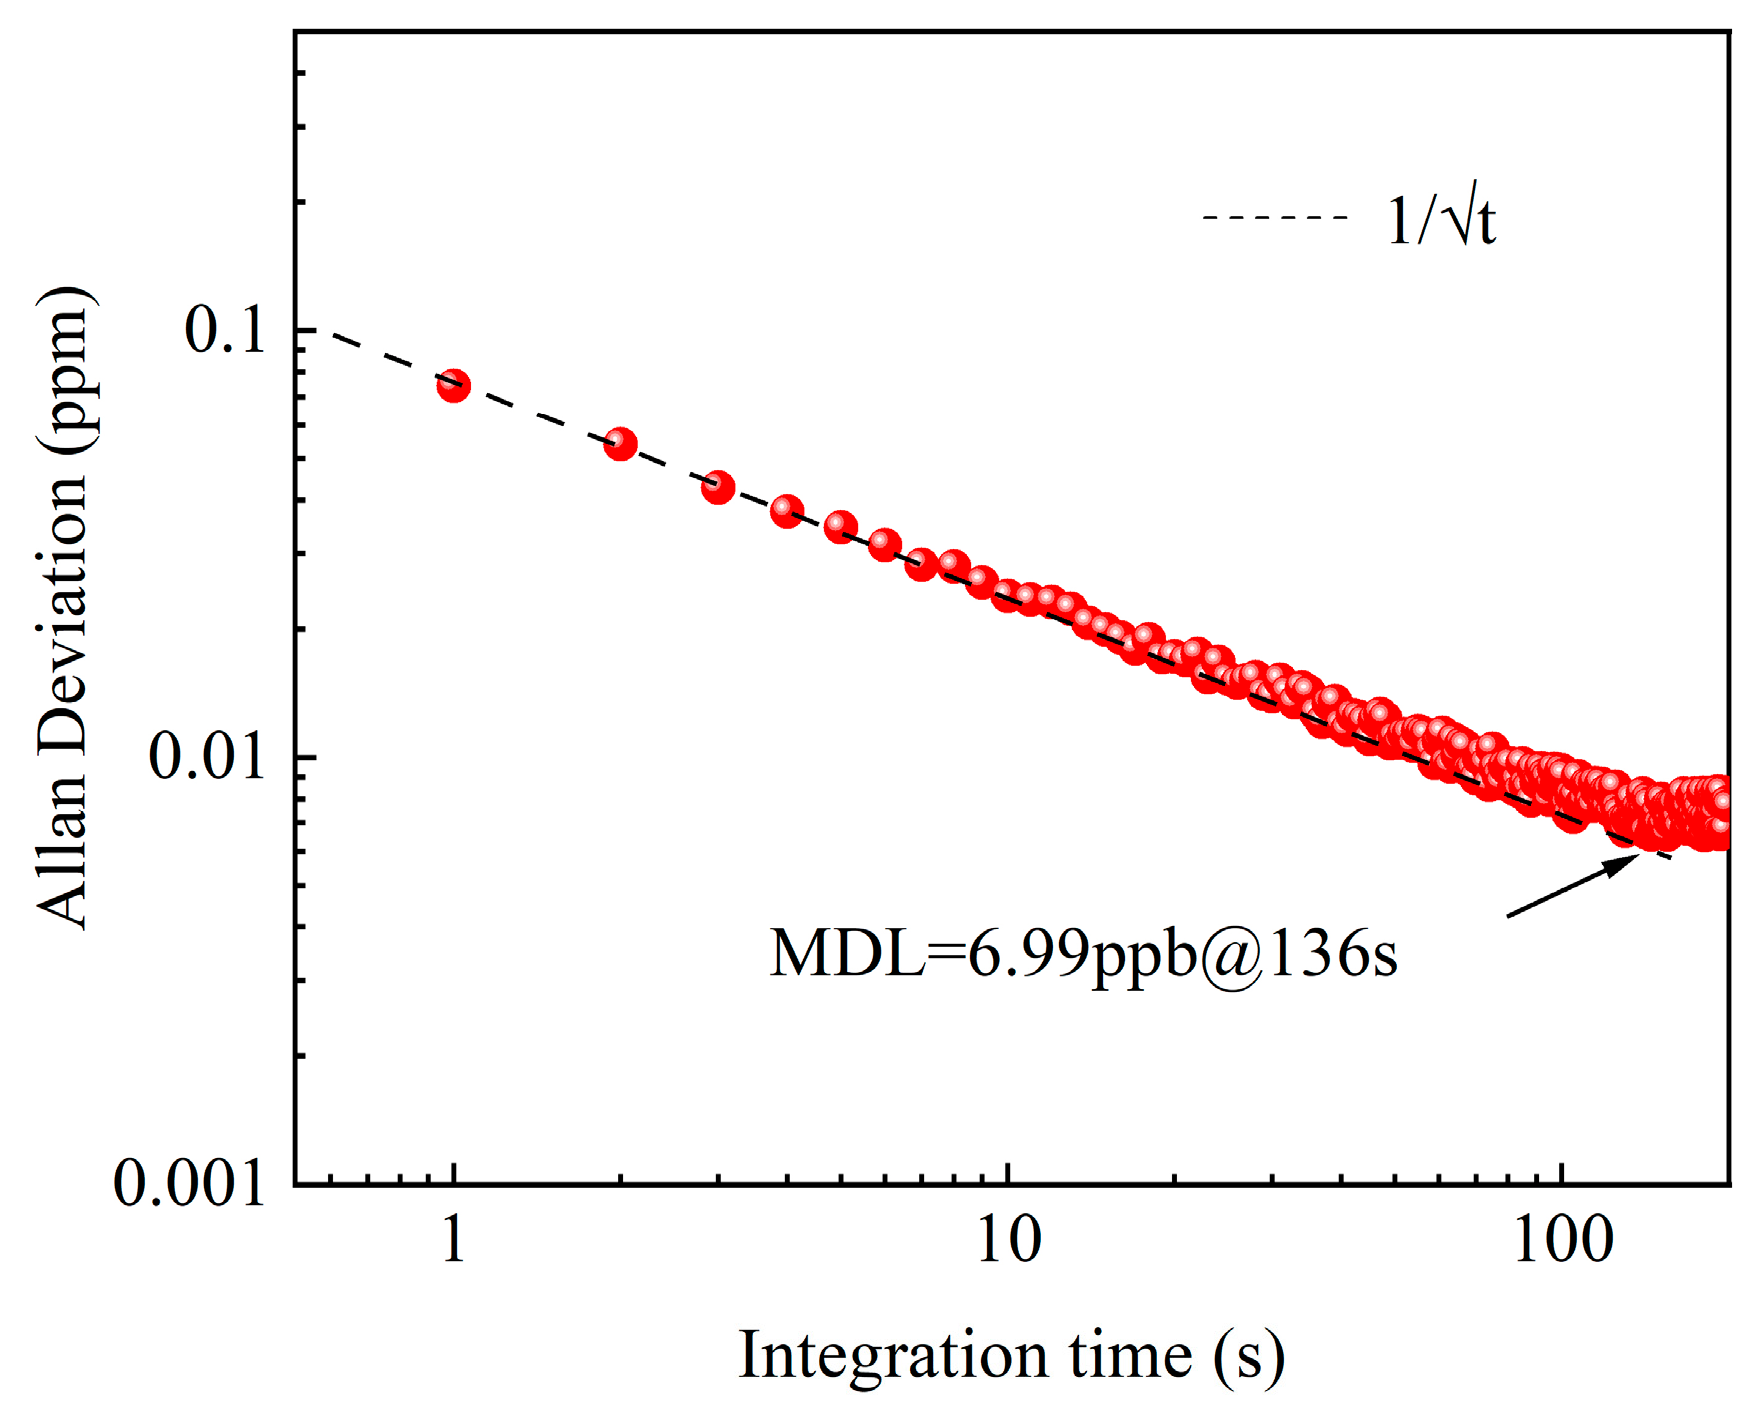
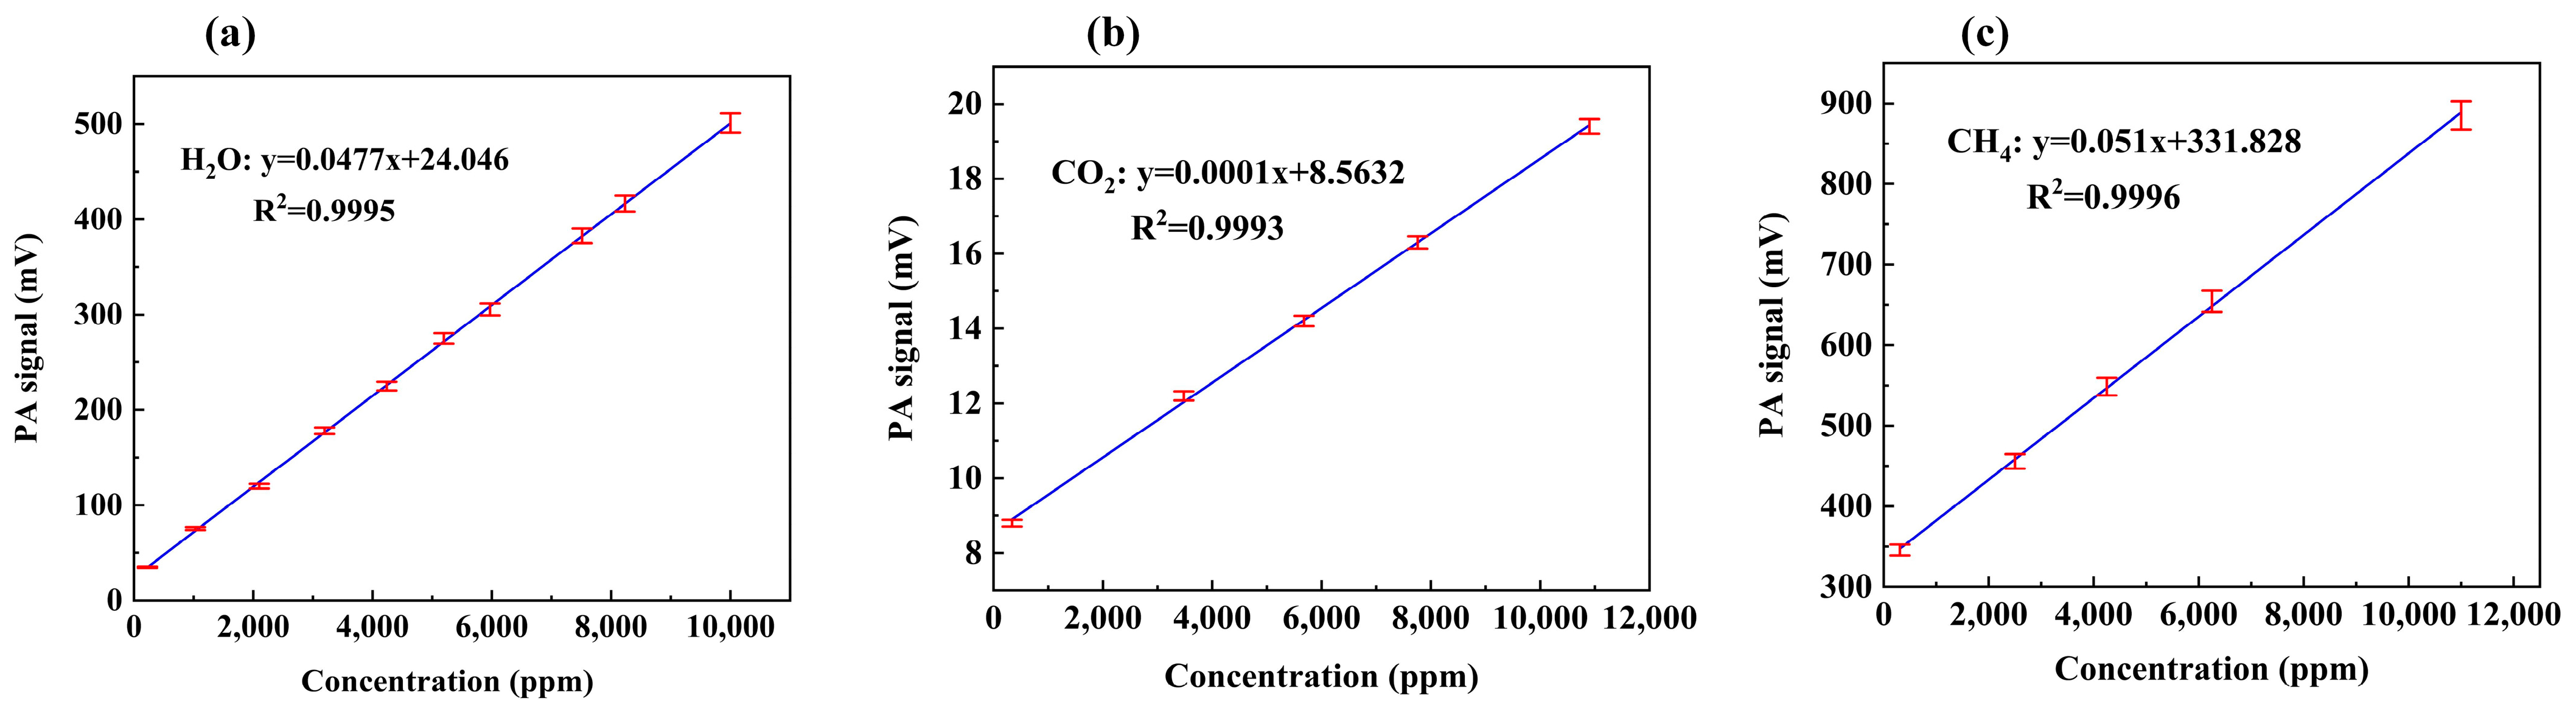
5.1. Gas-Sensing Measurement

Different concentrations of greenhouse gases are injected into the PA cavity through the gas dilution system (MCQ GB 100) for testing. Figure 10 shows the linear relationship between the PAS signal and concentration for greenhouse gases, the background noise of 21 consecutive tests, and the MDLs comparison. The fitting R2 values are completely beyond 0.999, indicating favorable linearity. The responsivity of CO2, CH4, N2O, NF3, SF6, PFC-14, HFC-134a without aspherical optical shaping achieved 0.407 mV/ppm, 3.971 mV/ppm, 1.973 mV/ppm, 11.49 mV/ppm, 57.677 mV/ppm, 36.895 mV/ppm, and 11.521 mV/ppm, respectively. The responsivity of CO2, CH4, N2O, NF3, SF6, PFC-14, HFC-134a with aspherical optical shaping achieved 0.694 mV/ppm, 7.134 mV/ppm, 2.827 mV/ppm, 21.287 mV/ppm, 128.267 mV/ppm, 73.512 mV/ppm, and 16.095 mV/ppm, respectively. Compared to the gas sensor without aspherical beam shaping, the responsivity of seven gases is increased by about 1.7 times on average. The standard deviations of the background noises with aspherical beam shaping of CO2, CH4, N2O, NF3, SF6, PFC-14, HFC-134a are 0.051 mV, 1.908 mV, 0.205 mV, 1.714 mV, 1.839 mV, 0.686 mV and 1.859 mV, respectively. The MDL can be calculated from the following equation [28,29]:
L = S b K
Sb is the standard deviation of the background noises, and K is the slope of the fitting curve. The MDLs of CO2, CH4, N2O, NF3, SF6, PFC-14 and HFC-134a with aspherical beam shaping are 73 ppb, 267 ppb, 72 ppb, 81 ppb, 14 ppb, 9 ppb and 115 ppb, respectively, with a short integration time of 1 s. Compared to the sensor without the aspheric beam shaping, the seven gases’ detection limits are enhanced by 50% on average. It is verified that the aspherical beam-shaping technique provides better focusing and shaping capability, reduced background noise, as well as significantly improved sensitivity. Allan deviation analysis was performed by measuring the signals when the PA cavity was filled with pure N2 under CO2 filter, as shown in Figure 11. Table 3 summarizes and compares the relevant works and this paper’s work on the performance indicators of greenhouse gas sensors. Most of the other similar sensors use lasers as the light source, which has a high cost and a long integration time, extending the response time of the system. Compared with other similar sensors, the gas sensor in this paper can detect the largest variety of greenhouse gases and has a better detection limit with an integration time of only 1 s.

5.2. Water Vapor Crosstalk Testing and Analysis

Considering the high concentration of water vapor in the atmosphere, the absorption spectra of the three gases, H2O, CO2 and CH4, exhibit some overlap, leading to crosstalk during gas detection. As indicated by the absorption spectra, there is a strong absorption of water vapor under the windows of the CO2 and CH4 filters, which will have an impact on the accurate measurement of CO2 and CH4 concentration. Therefore, we calibrate water vapor and test its response under both windows of the CO2 and CH4 filters, as shown in Figure 12. The responsivity of H2O is 0.0477 mV/ppm and the fitting R2 is beyond 0.999, indicating excellent linearity. The responsivity of water vapor under the windows of CO2 and CH4 filters is 0.001 mV/ppm and 0.051 mV/ppm, respectively, indicating that the crosstalk of water vapor on CH4 is stronger than that of CO2.

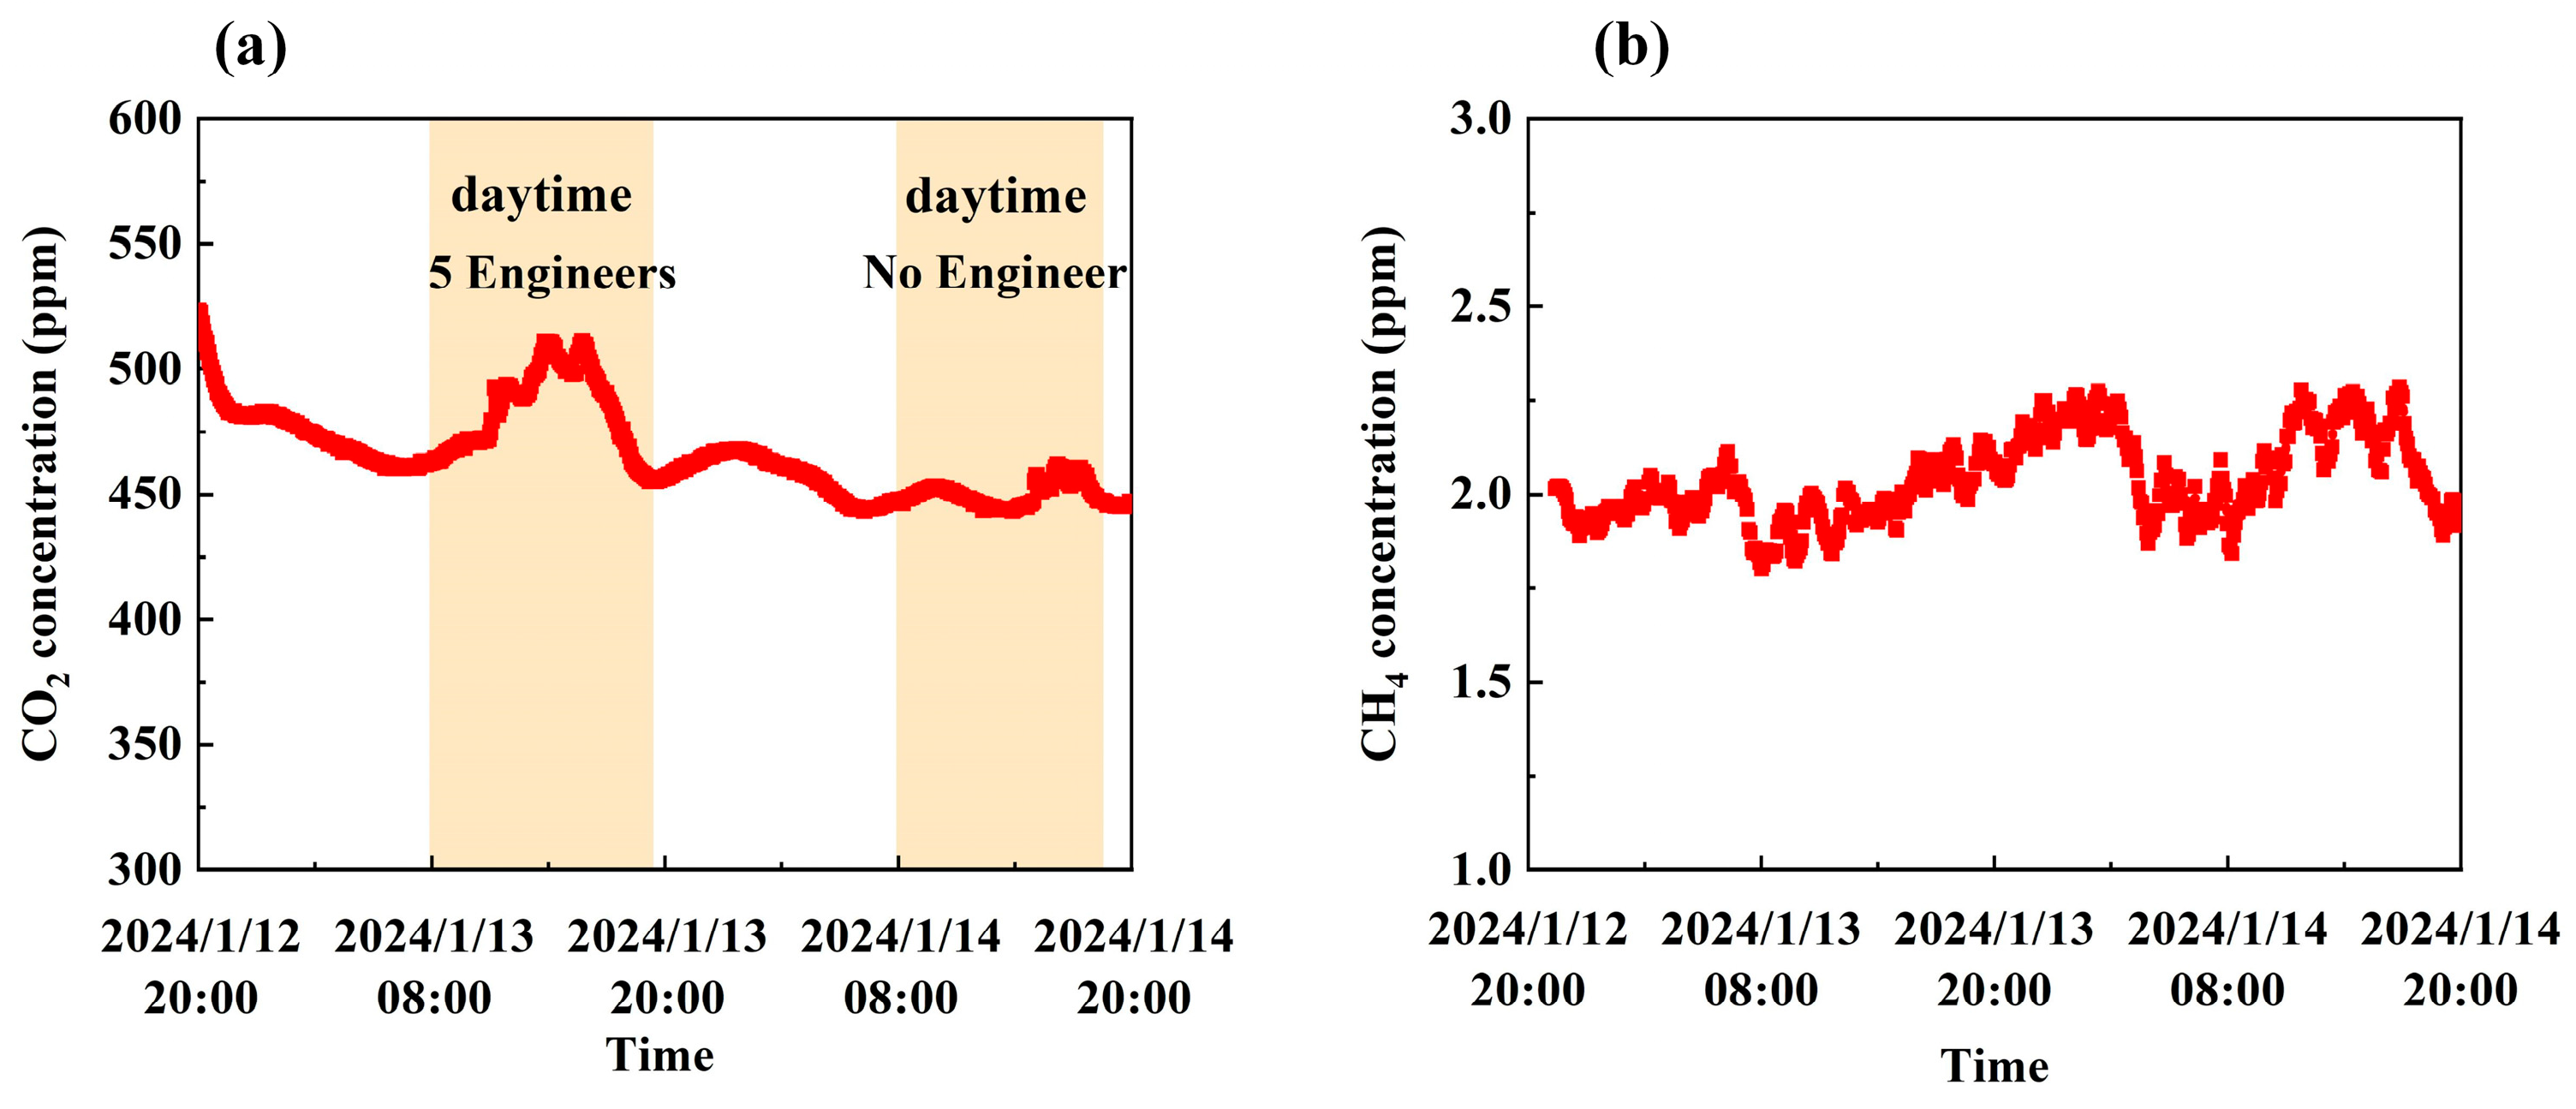
5.3. Continuous Monitoring of CO2 and CH4

The greenhouse gases photoacoustic sensor is placed in the laboratory in Huazhong University of Science and Technology, Wuhan, China (30°N, 114°E). A 48 h continuous monitoring of H2O, CO2 and CH4 in the lab atmosphere is carried out from 12–14 January 2024. The hygrometer (DewMaster, EDGETECH, Hudson, MA, USA) and the PAS sensor are used simultaneously to monitor the H2O concentrations. Figure 13 shows the 48 h continuous measurement data of H2O with a 4 min acquisition period. The H2O measured by a hygrometer and the developed sensor is basically identical, showing a consistent trend, which verifies the effectiveness and reliability of our sensor. The average H2O concentration in the lab atmosphere is about 9387 ppm.
When removing the effects of water vapor, the primary composites of greenhouse gases, i.e., CO2 and CH4, were measured and analyzed by the PAS sensor. Figure 14 shows the 48 h continuous measurement results of CO2 and CH4 by our sensor with a 4 min acquisition period. During the monitoring period, the average concentration of CO2 in the lab atmosphere environment is around 466 ppm, and the CO2 concentration in the daytime is slightly higher than that at night, mainly due to engineers in the working hours. The average concentration of CH4 was measured to be 2.03 ppm, with about 11.8% fluctuations of CH4 concentration.

6. Conclusions

A high-precision low-cost photoacoustic gas sensor based on aspherical beam shaping was proposed and developed. The luminous characteristics of an infrared blackbody radiation source were analyzed and simulated. The aspherical beam-shaping technique includes the comprehensive design and match of the reflector and focusing lenses. Aspherical beam shaping could significantly reduce optical power loss and improve the excitation efficiency of the photoacoustic signal. By using aspherical beam shaping, the MDLs of CO2, CH4, N2O, NF3, SF6, PFC-14 and HFC-134a with a short integration time of 1 s were 73 ppb, 267 ppb, 72 ppb, 81 ppb, 14 ppb, 9 ppb and 115 ppb, respectively. Compared to the original setup without the aspheric beam shaping, the sensor responsivity was increased by about 1.7 times, and the MDLs were enhanced by 50% on average. The PAS sensor was tested for 48 h of the continuous monitoring of H2O, CO2 and CH4 in the lab atmosphere. The water vapor monitoring results were in favorable agreement with the hygrometer, which verified the performance and reliability of the developed sensor. The photoacoustic sensor was highly sensitive, selective, and low-cost, enabling the accurate and stable monitoring of greenhouse gases.

Author Contributions

Conceptualization, Q.H., Y.A. and C.S.; methodology, C.S.; validation, Q.H., Y.A., Z.F. and T.L.; formal analysis, Y.A., Z.F., W.W. and R.F.; investigation, Q.H., Y.A., C.T. and X.C.; writing—original draft preparation, Y.A., Y.S., Z.F. and Y.P.; writing—review and editing, Y.A. and C.S.; supervision, C.S. and P.L.; project administration, C.S.; funding acquisition, C.S. and P.L. All authors have read and agreed to the published version of the manuscript.

Funding

This research was funded by the National Natural Science Foundation of China (No. 62375094); Science Fund for Creative Research Groups of the Nature Science Foundation of Hubei (No. 2021CFA033, 2024KJB315); Interdisciplinary Research Program (HUST:2023JCYJ046).

Institutional Review Board Statement

Not applicable.

Informed Consent Statement

Not applicable.

Data Availability Statement

Data are contained within the article.

Conflicts of Interest

The authors declare no conflicts of interest.

References

  1. Fu, L.; You, S.; Li, G.; Fan, Z. Enhancing methane sensing with NDIR technology: Current trends and future prospects. Rev. Anal. Chem. 2023, 42, 20230062. [Google Scholar] [CrossRef]
  2. Thorpe, M.J.; Moll, K.D.; Jones, R.J.; Safdi, B.; Ye, J. Broadband cavity ringdown spectroscopy for sensitive and rapid molecular detection. Science 2006, 311, 1595–1599. [Google Scholar] [CrossRef] [PubMed]
  3. Barouch, G.; Clairotte, M. Fourier transform infrared (FTIR) spectroscopy for measurements of vehicle exhaust emissions: A review. Appl. Sci. 2021, 11, 7416. [Google Scholar] [CrossRef]
  4. Lin, S.; Chang, J.; Sun, J.; Xu, P. Improvement of the detection sensitivity for tunable diode laser absorption spectroscopy: A review. Front. Phys. 2022, 10, 853966. [Google Scholar] [CrossRef]
  5. Li, J.; Yu, B.; Zhao, W.; Chen, W. A review of signal enhancement and noise reduction techniques for tunable diode laser absorption spectroscopy. Appl. Spectrosc. Rev. 2014, 49, 666–691. [Google Scholar] [CrossRef]
  6. Picqué, N.; Hänsch, T.W. Frequency comb spectroscopy. Nat. Photonics 2019, 13, 146–157. [Google Scholar] [CrossRef]
  7. Fathy, A.; Sabry, Y.M.; Hunter, I.W.; Khalil, D.; Bourouina, T. Direct absorption and photoacoustic spectroscopy for gas sensing and analysis: A critical review. Laser Photonics Rev. 2022, 16, 2100556. [Google Scholar] [CrossRef]
  8. Yang, T.; Chen, W.; Wang, P. A review of all-optical photoacoustic spectroscopy as a gas sensing method. Appl. Spectrosc. Rev. 2020, 56, 143–170. [Google Scholar] [CrossRef]
  9. Zhu, Z.; Liu, Y.; Yang, J.; Hu, G. A review of single-cavity dual-comb laser and its application in spectroscopy. Spectrosc. Spectr. Anal. 2021, 41, 3321–3330. [Google Scholar]
  10. Elia, A.; Lugarà, P.M.; Di Franco, C.; Spagnolo, V. Photoacoustic techniques for trace gas sensing based on semiconductor laser sources. Sensors 2009, 9, 9616–9628. [Google Scholar] [CrossRef]
  11. Ma, Y. Review of recent advances in QEPAS-based trace gas sensing. Appl. Sci. 2018, 8, 1822. [Google Scholar] [CrossRef]
  12. Kreuzer, L.B. Ultralow gas concentration infrared absorption spectroscopy. J. Appl. Phys. 1971, 42, 2934–2943. [Google Scholar] [CrossRef]
  13. Harren, F.J.M.; Reuss, J.; Woltering, E.J.; Bicanic, D.D. Photoacoustic measurements of agriculturally interesting gases and detection of C2H4 below the PPB level. Appl. Spectrosc. 1990, 44, 1360–1368. [Google Scholar] [CrossRef]
  14. McNaghten, E.D.; Grant, K.A.; Parkes, A.M.; Martin, P.A. Simultaneous detection of trace gases using multiplexed tunable diode lasers and a photoacoustic cell containing a cantilever microphone. Appl. Phys. B 2012, 107, 861–871. [Google Scholar] [CrossRef]
  15. Rey, J.M.; Sigrist, M.W. Non-dispersive sensing scheme based on mid-infrared LED and differential mode excitation photoacoustic spectroscopy. Photoacoustics 2023, 29, 100455. [Google Scholar] [CrossRef] [PubMed]
  16. Zha, S.; Ma, H.; Zha, C.; Chen, J.; Huang, X.; Liu, K.; Zhan, S. Application of broadband photoacoustic spectroscopy in methane concentration detection. Laser Optoelectron. Prog. 2019, 56, 043001. [Google Scholar]
  17. Kerr, E.L.; Atwood, J.G. The laser illuminated absorptivity spectrophone: A method for measurement of weak absorptivity in gases at laser wavelengths. Appl. Opt. 1968, 5, 915–921. [Google Scholar] [CrossRef] [PubMed]
  18. Zhang, L.; Liu, L.; Zhang, X.; Yin, X.; Huan, H.; Liu, H. T-type cell mediated photoacoustic spectroscopy for simultaneous detection of multi-component gases based on triple resonance modality. Photoacoustics 2023, 31, 100492. [Google Scholar] [CrossRef] [PubMed]
  19. Li, Z.; Si, G.; Ning, Z.; Liu, J.; Fang, Y.; Cheng, Z.; Si, B.; Yang, C. Photoacoustic detection of CO2 based on mid-infrared LED. Acta Opt. Sin. 2022, 42, 1330001. [Google Scholar]
  20. Christensen, J. The Brüel & Kjær photoacoustic transducer system and its physical properties. Tech. Rev. 1990, 1–1990. Available online: https://www.bksv.com/media/doc/TechnicalReview1990-1.pdf (accessed on 22 June 2024).
  21. Christensen, J. Optical filters and their use with the type 1302 & type 1306 photoacoustic gas monitors. Tech. Rev. 1990, 2–1990. Available online: https://www.bksv.com/media/doc/TechnicalReview1990-2.pdf (accessed on 22 June 2024).
  22. Chen, K.; Liu, S.; Zhang, B.; Gong, Z.; Chen, Y.; Zhang, M.; Deng, H.; Guo, M.; Ma, F.; Zhu, F.; et al. Highly sensitive photoacoustic multi-gas analyzer combined with mid-infrared broadband source and near-infrared laser. Opt. Lasers Eng. 2020, 124, 105844. [Google Scholar] [CrossRef]
  23. Qiu, Y.; Fan, Y.; Yan, B.; Wang, Y.; Wu, Y.; Han, Z.; Qi, Y.; Lu, P. Design and experiment of light field shaping system for three-dimensional extended light source used in photoacoustic spectrometer. Acta Phys. Sin. 2021, 70, 204201. [Google Scholar] [CrossRef]
  24. Xiao, H.; Zhao, J.; Sima, C.; Lu, P.; Long, Y.; Ai, Y.; Zhang, W.; Pan, Y.; Zhang, J.; Liu, D. Ultra-sensitive ppb-level methane detection based on NIR all-optical photoacoustic spectroscopy by using differential fiber-optic microphones with gold-chromium composite nanomembrane. Photoacoustics 2022, 26, 100353. [Google Scholar] [CrossRef]
  25. Li, T.; Sima, C.; Ai, Y.; Tong, C.; Zhao, J.; Zhao, Z.; Lu, P. Photoacoustic spectroscopy-based ppb-level multi-gas sensor using symmetric multi-resonant cavity photoacoustic cell. Photoacoustics 2023, 32, 100526. [Google Scholar] [CrossRef] [PubMed]
  26. Yat, H.L.; Rainer, L. Aspheric lenses for terahertz imaging. Opt. Express 2008, 16, 15991–15998. [Google Scholar]
  27. Gordon, I.E.; Rothman, L.S.; Hargreaves, R.J.; Hashemi, R.; Karlovets, E.V.; Skinner, F.M.; Conway, E.K.; Hill, C.; Kochanov, R.V.; Tan, Y.; et al. The HITRAN2020 molecular spectroscopic database. J. Quant. Spectrosc. Radiat. Transf. 2022, 277, 107949. [Google Scholar]
  28. Long, G.L.; Winefordner, J.D. Limit of detection: A closer look at the IUPAC definition. Anal. Chem. 1983, 55, 712A–724A. [Google Scholar]
  29. Wu, H.; Dong, L.; Zheng, H.; Yu, Y.; Ma, W.; Zhang, L.; Yin, W.; Xiao, L.; Jia, S.; Tittel, F.K. Beat frequency quartz-enhanced photoacoustic spectroscopy for fast and calibration-free continuous trace-gas monitoring. Nat. Commun. 2017, 8, 15331. [Google Scholar] [CrossRef] [PubMed]
  30. Wu, G.; Xing, J.; Gong, Z.; Ma, J.; Fan, Y.; Wu, X.; Wei, P.; Yu, Q.; Liang, M. Single fiber-type double cavity enhanced photoacoustic spectroscopy sensor for trace methane sensing. J. Light. Technol. 2024, 42, 3393–3398. [Google Scholar] [CrossRef]
  31. Liu, H.; Hu, M.; Chen, X.; Deng, H.; Xu, Z.; Wang, Q.; Li, X.; Kan, R.; Zhang, X. Sensitive detection of CH4 and CO2 using frequency-division-multiplexing based quartz-enhanced photoacoustic spectroscopy. Acta Opt. Sin. 2021, 41, 1430003. [Google Scholar]
  32. De Palo, R.; Elefante, A.; Biagi, G.; Paciolla, F.; Weih, R.; Villada, V.; Zifarelli, A.; Giglio, M.; Sampaolo, A.; Spagnolo, V.; et al. Quartz-enhanced photoacoustic sensors for detection of eight air pollutants. Adv. Photonics Res. 2023, 4, 2200353. [Google Scholar] [CrossRef]
  33. Zhang, N.; Srivastava, A.; Li, X.; Li, Y.; Zhou, Z.; Bittner, A.; Zhou, X.; Dehe, A. Design and evaluation of a miniaturized non-resonant photoacoustic CO2 gas sensor with integrated electronics. In Proceedings of the 2023 IEEE SENSORS, Vienna, Austria, 29 October–1 November 2023; pp. 1–4. [Google Scholar]
Figure 1. Diagram of IR-Si253. (a) Simulation model; (b) Physical image.
Photonics 11 00590 g001
Figure 2. Diagram of IR-Si253 light distribution test. (a) Testing system; (b) Relative radiation flux-angle distribution.
Photonics 11 00590 g002
Figure 3. Ray-tracing diagram and light spot diagram based on spherical lenses. (a) Ray-tracing diagram; (b) Input light spot; (c) Output light spot.
Photonics 11 00590 g003
Figure 4. Model of the aspherical beam shaping.
Photonics 11 00590 g004
Figure 5. Ray-tracing diagram. (a) Without aspherical beam shaping; (b) With aspherical beam shaping.
Photonics 11 00590 g005
Figure 6. Output light spot diagram. (a) Without beam shaping; (b) With beam shaping.
Photonics 11 00590 g006
Figure 7. Molecular absorption spectra of seven greenhouse gases and water vapor at 296 Kelvin, 1 atm, according to the HITRAN database.
Photonics 11 00590 g007
Figure 8. The greenhouse gases photoacoustic sensor based on the aspherical beam-shaping technique. (a) Schematic diagram; (b) Physical diagram.
Photonics 11 00590 g008
Figure 9. Monitoring results of the mid-infrared light source. (a) The real-time current; (b) Output optical power.
Photonics 11 00590 g009
Figure 10. PAS signal amplitude as a function of concentration for (a) CO2; (b) CH4; (c) N2O; (d) NF3; (e) SF6; (f) PFC-14; and (g) HFC-134a. (h) The background noises with 21 consecutive test data for CO2; (i) MDLs comparison.
Photonics 11 00590 g010
Figure 11. Allan deviation as a function of the data-averaging period. Inset: Measured concentrations when the PA cavity filled with pure N2 under CO2 filter.
Photonics 11 00590 g011
Figure 12. The concentration response curves of H2O under the filters for (a) H2O; (b) CO2; (c) CH4.
Photonics 11 00590 g012
Figure 13. The 48 h continuous measurement results of H2O from the PAS sensor (black) and the hygrometer (red).
Photonics 11 00590 g013
Figure 14. The 48 h continuous measurement results. (a) CO2; (b) CH4.
Photonics 11 00590 g014
Table 1. Performance index parameters.
SystemOptical Power at
Inlet of PA Cavity
(W)
Optical Power at Outlet of PA Cavity
(W)
Rnoise
(%)
η
(%)
Without aspherical beam shaping1.9040.78958.641.44
With aspherical beam shaping1.1321.0318.991.08
Table 2. Parameters of the selected optical passband filters.
GasCentral Wavelength (nm)Bandwidth (nm)
CO24260195
CH4325095
N2O4600190
SF610,6001060
NF310,800190
PFC-147800450
HFC-134a8400250
H2O6080200
Table 3. Performance indicators of greenhouse gas sensors.
TechnologyWavelength RegionIntegration Time (s)MDL (ppb)Light SourceReference
SFDCE-PASMid-infrared100CH4 (1130)DFB la-ser[30]
QEPASMid-infrared450CH4 (580), CO2 (1320)DFB laser[31]
QEPASMid-infrared0.1CO2 (800), N2O (230)ICL and QCL laser[32]
Non-resonant PASMid-infrared330CO2 (2200)Infrared radiation source[33]
Non-resonant PASMid-infrared1CO2 (73), CH4 (267), N2O (72), NF3 (81), SF6 (14), PFC-14 (9), HFC-134a (115)Infrared radiation sourceThis paper
Disclaimer/Publisher’s Note: The statements, opinions and data contained in all publications are solely those of the individual author(s) and contributor(s) and not of MDPI and/or the editor(s). MDPI and/or the editor(s) disclaim responsibility for any injury to people or property resulting from any ideas, methods, instructions or products referred to in the content.

