Article

Spatio-Temporal Dynamics of Pulses in Multimode Fibers

Faculty of Engineering, Institute of Nanotechnology and Advanced Materials, Bar-Ilan University, Ramat Gan 5290002, Israel
*
Author to whom correspondence should be addressed.
Photonics 2024, 11(7), 591; https://doi.org/10.3390/photonics11070591
Submission received: 12 May 2024 / Revised: 20 June 2024 / Accepted: 24 June 2024 / Published: 25 June 2024

Abstract

:
Time lenses can measure ultrafast signals but are based on single-mode fibers (SMFs). To develop multimode time lenses that are based on a four-wave mixing process, we must have full control of the nonlinear interaction between the modes. Specifically, we need to generate an idler from each mode without any cross-talk between the modes. Here, as a first step toward a multimode time lens, we study how stable a short pulse is traveling in a multimode fiber, and how pulses at different modes interact with each other. We utilize a single-mode-based time lens to measure the dynamics of these pulses in the time and spectral domains. We found that there is cross-talk between the modes and that the pulses are not stable and excite other modes, rather than staying in the same modal order. These findings indicate that developing a multimode time-lens may be more challenging than expected.

1. Introduction

Nonlinear interactions of short pulses in fibers lead to numerous effects that are implemented in microscopy, telecommunication, and quantum optics. When short pulses propagate in multimode fibers, a new world of nonlinear phenomena is added to the field of nonlinear single-mode interactions thanks to the additional spatial dimension [1]. As the pulse travels in the multimode fiber, the different modes in the pulse are coupled by nonlinear interactions, and the energy is transferred between the modes [2,3,4]. These nonlinear multimode interactions, as well as the spatial separability of the output pulse, are important for different applications, such as improving the brightness of nonlinear imaging [5,6], detecting the temporal shapes of ultrashort pulses by deep learning [7,8], and increasing the output power from ultrashort fiber lasers [9,10,11].
Multimode nonlinear interactions also lead to unique multimode phenomena, such as modal self-cleaning [12,13,14], multimode solitons [15,16], spatiotemporal mode-locking [17,18], supercontinuum generation [9], and modulation instabilities [19,20]. Different theoretical models and advanced numerical tools were developed for analyzing these phenomena, including the effective potential model [21], the multi-component approach [22], the 3D+1 nonlinear Schrodinger equation [23], the Gross–Pitaevskii equations [24], and the Laguerre–Gaussian mode sorter [25]. To understand all these phenomena and test competing models [26], the dynamics of the modes must be measured with high temporal resolution.
Time lenses are temporal optics devices that exploit the time–space duality and measure signals with high temporal resolution [27]. Time lenses that are based on the four-wave mixing process (FWM), where a chirped pump induces the quadratic phase in time, have a shorter focal length than other time lenses. These time lenses lead to temporal imaging [28,29,30,31,32], ultrafast spectroscopy [33], temporal holography [34], and are implemented in studying rogue waves [35,36] and soliton dynamics [37]. However, all these temporal devices are based on ultrafast dynamics in single-mode fibers. To develop a multimode time lens that can image ultrafast signals both in space and time, we must study the FWM process and the nonlinear interaction between a pump pulse and multimode signals with high temporal resolution.
In this work, we study the dynamics of pulses in multimode fibers and the interaction between the modes for the future realization of multimode time lenses. We develop multimode temporal devices based on single-mode time lenses that measure the dynamics of spatial modes in multimode fibers with high temporal resolution. With this multimode temporal device, we excite specific spatial modes and measure their spatio-temporal dynamics resulting from FWM, self-phase modulation, and modulation instabilities. We detect the energy transfer between the modes and the coupling between them. We found energy transfer between modes occurs even when the coupling symmetry does not allow it. These findings indicate that developing multimode time lenses is more challenging due to the cross-talk between the modes. This research on spatio-temporal dynamics of ultrashort pulses in multimode fibers can open avenues for understanding modal phenomena.

2. Methods

In this work, we study the ultrafast dynamics of pulses in few-mode fibers (FMFs), while focusing on the FWM processes, since this is the process required for time lenses. The four-wave mixing process is governed by
E i ( t ) χ ( 3 ) E s * ( t ) E p 2 ( t ) ,
where E p , E s and E i are the pump, signal, and idler electric waves, oscillating at frequencies ω p , ω s , and ω i , respectively. In our experiment, we consider the degenerate pump case. During this process, two pump photons generate two photons at the signal and idler frequencies simultaneously, while conserving energy and momentum. The momentum conservation is satisfied by the intermodal phase matching process 2 k p = k s + k i , whereas the energy conservation is satisfied by 2 ω p = ω s + ω i .
The spatial profile of a linearly polarized mode of radial order l and angular order m propagating inside a graded-index multimode fiber (GIMF) is L P m , l [38]. Our few-mode fiber supports the propagation of L P 01 , L P 11 a , L P 11 b and their combinations. The propagation constant of each mode, β g , is [39]
β g = 2 π n 0 λ 2 Δ R g
where g = 2 l + m + 1 is the group number, n 0 is the maximum refractive index at the center of the core, Δ is the relative index difference between the core and cladding, and R is the core’s radius. Since the propagation constant has a linear dependency in g, modes with the same group number have the same propagation constant. Due to phase matching, only modes with propagation constants that satisfy β μ s β ζ i β ν p β κ p = 0 can perform efficient FWM. By placing β g into the phase matching condition, we rewrite it as
2 Δ R ( g s + g i g p ( 1 ) g p ( 2 ) ) = 2 π ( n s / λ s + n i / λ i 2 n p / λ p )
where 2 Δ R ( g s + g i g p ( 1 ) g p ( 2 ) ) is the material mismatch denoted as δ k M , and 2 π ( n s / λ s + n i / λ i 2 n p / λ p ) is the waveguide mismatch denoted as δ k W .
We calculate the phase matching condition for different idler wavelengths at different modal combinations. We set the pump wavelength to λ p = 1550 nm and the signal wavelength to λ s = 1568 nm. When we calculate the waveguide mismatch, we denote L P 11 a and L P 11 b as L P 11 , since their group number is identical. From this simulation, we find that the idler wavelengths that satisfy the phase matching condition in our fiber are 1527 nm, 1532 nm, 1535 nm and 1538 nm for modal combinations { p 1 , p 2 , s , i } of { L P 01 , L P 01 , L P 11 , L P 11 } , { L P 01 , L P 11 , L P 01 , L P 11 } and { L P 11 , L P 11 , L P 11 , L P 11 } , { L P 11 , L P 11 , L P 01 , L P 01 } , and { L P 11 , L P 11 , L P 11 , L P 01 } , respectively. The only idler wavelength which also satisfies energy conservation is λ i = 1532 nm, which corresponds to { L P 01 , L P 11 , L P 01 , L P 11 } and { L P 11 , L P 11 , L P 11 , L P 11 } . The other combinations are less likely to generate idler beams, since only combinations that satisfy both phase matching condition and energy conservation are likely.
For the combinations that are phase matched and conserve energy, we evaluate the coupling coefficient between the modes, γ . We consider the spatial overlap integral as
γ μ ν κ ζ = S L P μ * ( ρ , ϕ , ω s ) L P ν ( ρ , ϕ , ω p ) L P κ ( ρ , ϕ , ω p ) L P ζ * ( ρ , ϕ , ω i ) d s S | L P μ ( ρ , ϕ , ω s ) | 4 d s S | L P ν ( ρ , ϕ , ω p ) | 4 d s S | L P κ ( ρ , ϕ , ω p ) | 4 d s S | L P ζ ( ρ , ϕ , ω i ) | 4 d s 1 / 4
where L P ξ ( ρ , ϕ , ω p , s , i ) is the propagating mode inside the GIMF at the modal order ξ .
We calculate the spatial overlap between the pump, signal, and idler waves in the modal orders of L P 01 , L P 11 a , L P 11 b in all relevant permutations. When all four waves have the same modal order, the coupling coefficient is unity ( γ = 1 ) , while odd combinations of L P 11 a or L P 11 b at the integrand vanish due to symmetry ( γ = 0 ) . Therefore, the only combinations with a non-trivial coupling are γ 01 , 01 , 11 a , 11 a = 0.5166 , γ 01 , 01 , 11 b , 11 b = 0.5166 , and γ 11 a , 11 a , 11 b , 11 b = 0.3338 .
In addition to the nonlinear interaction between the modes, the spatial modes are also linearly coupled due to inhomogeneities in the fiber caused by stresses and temperature gradients. However, this coupling linearly depends on the input power and we neglect it by taking into account changes that are quadratic as a function of the input power.
Schematics of our experimental setup are shown in Figure 1. We use a 90 fs laser, with an average intensity of 120 mW, and a repetition rate of 100 MHz. From this pulse, we filter two bandwidths of 3 nm centered at different wavelengths of 1555 nm and 1565 nm to obtain two pulses with 1 ps width as the pump and signal waves, respectively. We excite with the signal pulse different modes in a few-mode fiber (FM GI-4, YOFC) with an LP multiplexer (MUX) (LPMUX3-1550, Modular Photonics, Sydney, Australia). The LP MUX has three single-mode inputs and one multimode output. Each single-mode input is coupled to a different spatial mode at the multimode output. We connect the MUX to the few-mode fiber, which supports the propagation of L P 01 , L P 11 a , L P 11 b and their combinations. During the propagation in the few-mode fiber, all the spatial modes interact with the other modes and transfer energy between them as a function of wavelength, time, and power.
We measure the output of the fiber with our multimode temporal device. We connect the output of the few-mode fiber to a second LP MUX. The second LP MUX separates the different spatial modes into single-mode channels. We connect each single-mode channel to a time lens, which measures the dynamics of the spatial modes with a high temporal resolution. time lenses can perform temporal imaging of ultrafast signals [40]. Our time lenses are based on a four-wave mixing (FWM) process between a signal wave and a chirped pump wave, which occurs in a highly nonlinear fiber (HNLF). We combine the pump and signal waves with a Coarse Wavelength Division Multiplexer (CWDM) before sending them into the HNLF. Since the pump frequency is linearly shifting in time, according to ω ( t ) = α t , setting E p ( t ) = A p ( t ) exp i ω ( t ) t + i β p z in Equation (1) results in
E i ( z , t ) χ ( 3 ) E s * ( t ) A p 2 ( t ) e i 2 α t 2 e i Δ β z ,
where Δ β = 2 β p β s . Therefore, the idler wave is proportional to the signal wave multiplied by a quadratic phase shift in time, namely, a time lens. Such time lenses are highly robust and impose large quadratic phase shifts on the input signals [41,42,43]. The temporal magnification is given by [44]
M = β 2 ( D C F ) L D C F β 2 ( S M F ) L S M F ,
where β 2 is the group velocity dispersion parameter of the fibers and L is the length of the dispersion-compensating fiber (DCF) or SMF. The temporal imaging condition is [40] 1 / β 2 S M F L S M F + 1 / β 2 D C F L D C F = 1 / ϕ f where ϕ f is the temporal focus of the time lens. In our setup, the magnification is M = 8.46 . The bandwidth of our oscilloscope is 16 GHz; therefore, the temporal resolution in our setup is 7.38 ps and the spectral resolution is 0.19 nm.
By measuring the idler wave, we obtain the temporal magnification of the input signal, and by measuring the signal wave, we obtain its Fourier transform. We measure either in the time domain with an oscilloscope or in the spectral domain with an optical spectrum analyzer. Measuring in the time domain enables single-shot measurements but requires high output intensities, while measuring in the spectral domain has a higher sensitivity for lower output intensities, but averages over several milliseconds. Due to a low idler intensity, we measure in the spectral domain with its higher sensitivity. In this measurement, the signal represents the temporal magnification, and the idler represents the Fourier transform of the input.

3. Results

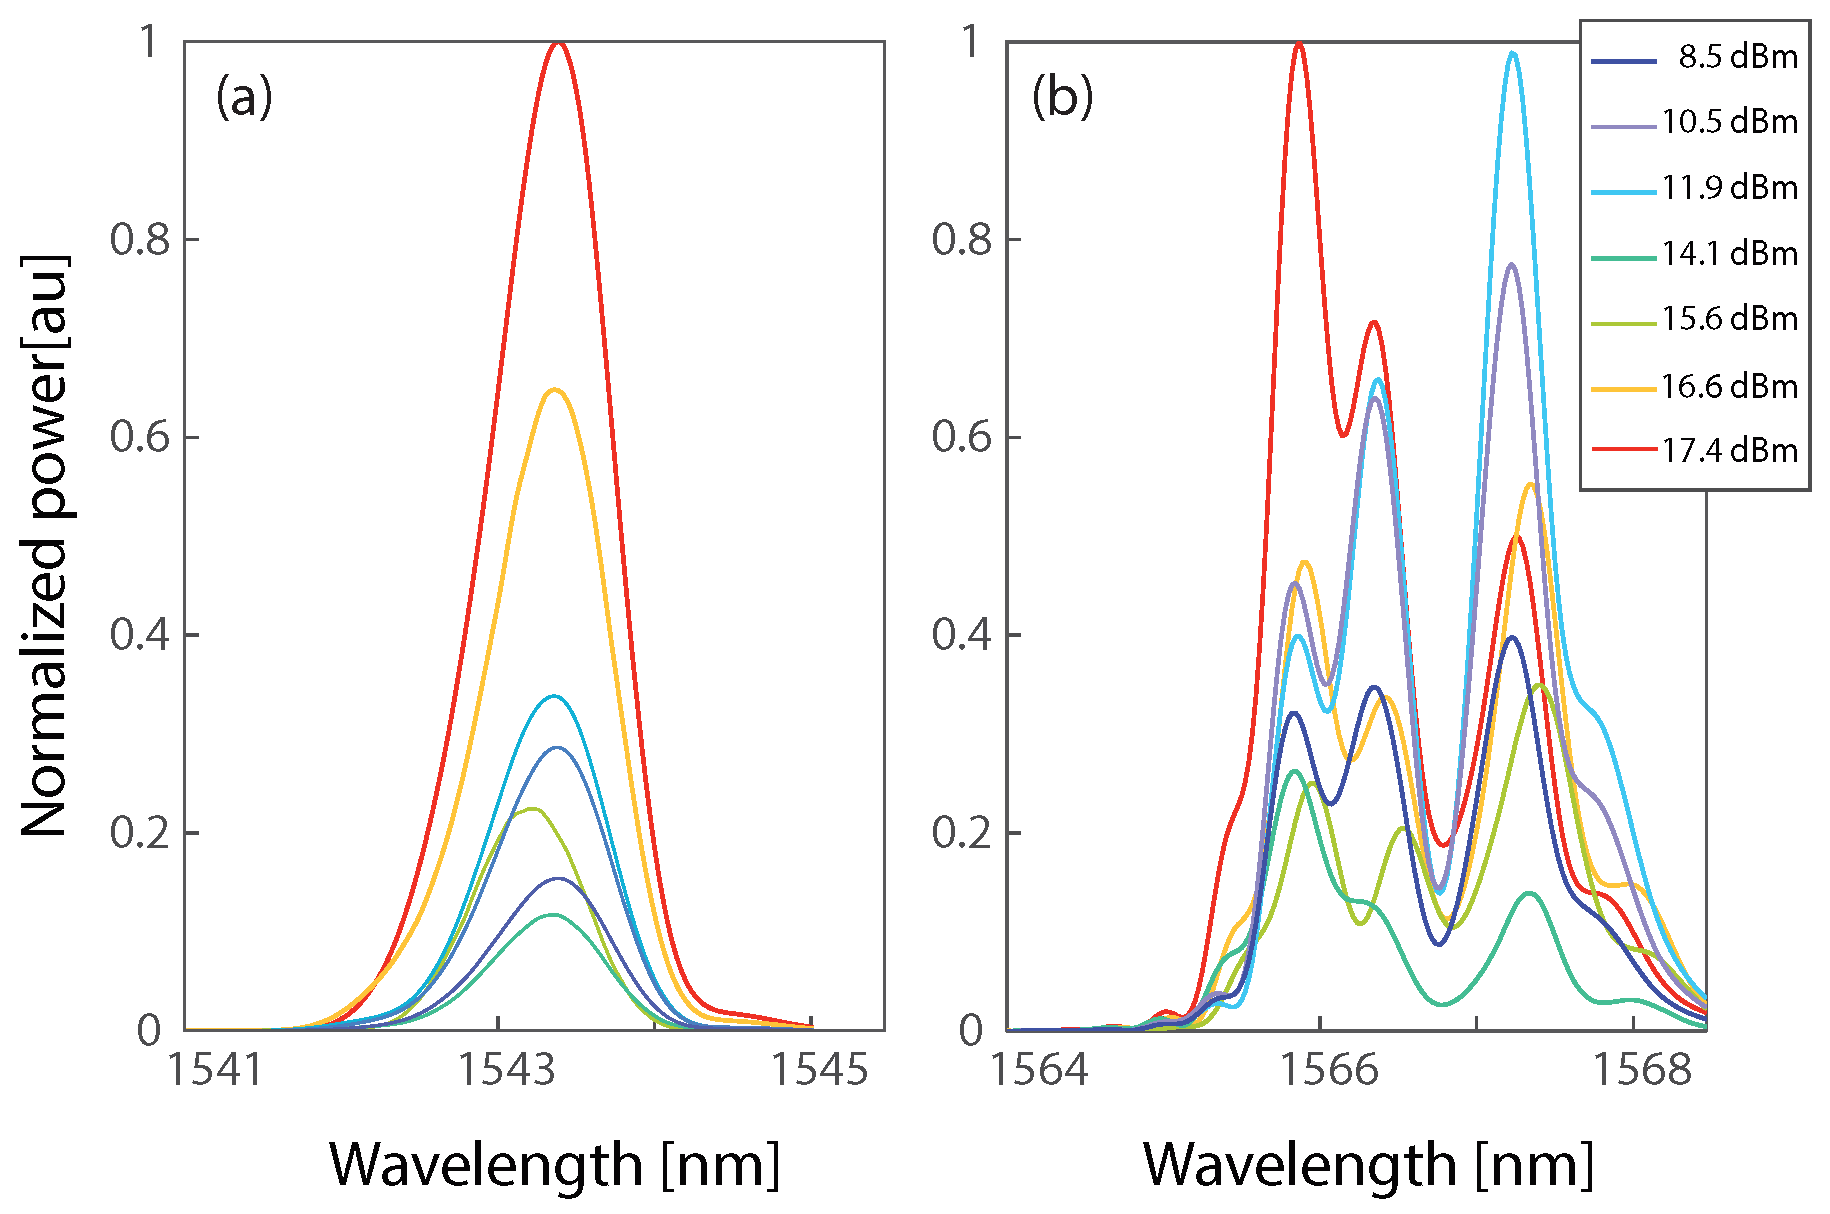
We measure the spectra of the signal and idler waves. The measured idlers have a Gaussian spectral structure regardless of the input power, while the measured signals have a complex spectral structure that changes as a function of the input power, as shown in Figure 2.
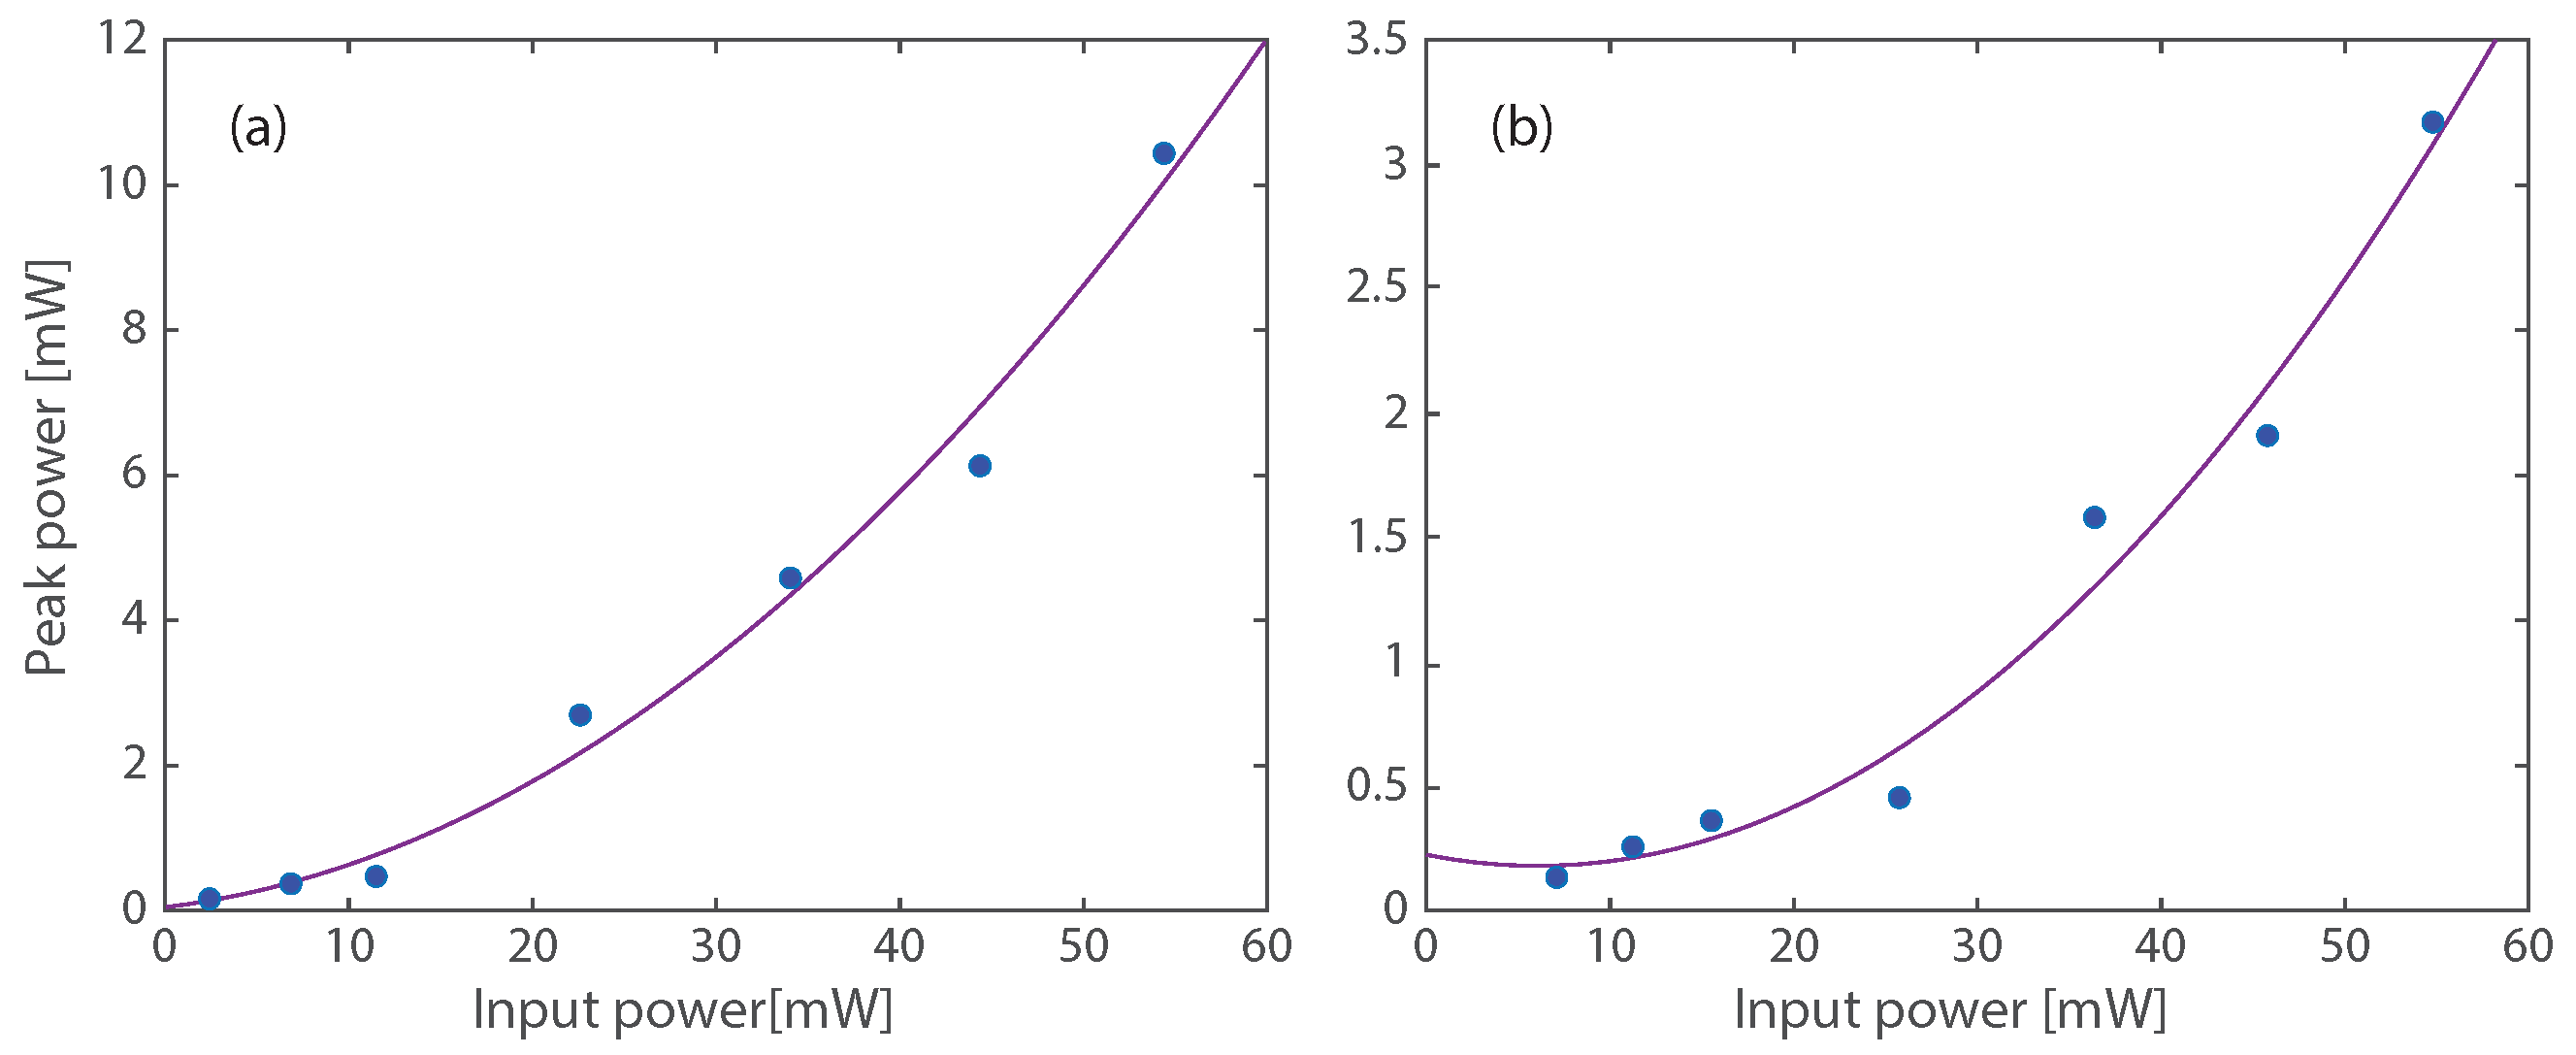
First, we study the dynamics of a single spatial mode propagating in the few-mode fiber. We excite a single spatial mode in the few-mode fiber, and measure the signal wave at each output mode as a function of the input power. Each output mode has a different spectral structure, with power peaks at different wavelengths. The peak power as a function of the input power when we excite L P 01 and measure L P 01 is shown in Figure 3a, and when we excite L P 11 a and measure L P 11 a is shown in Figure 3b. Both modes’ peak power as a function of the input power follows a quadratic curve, indicating a nonlinear interaction.
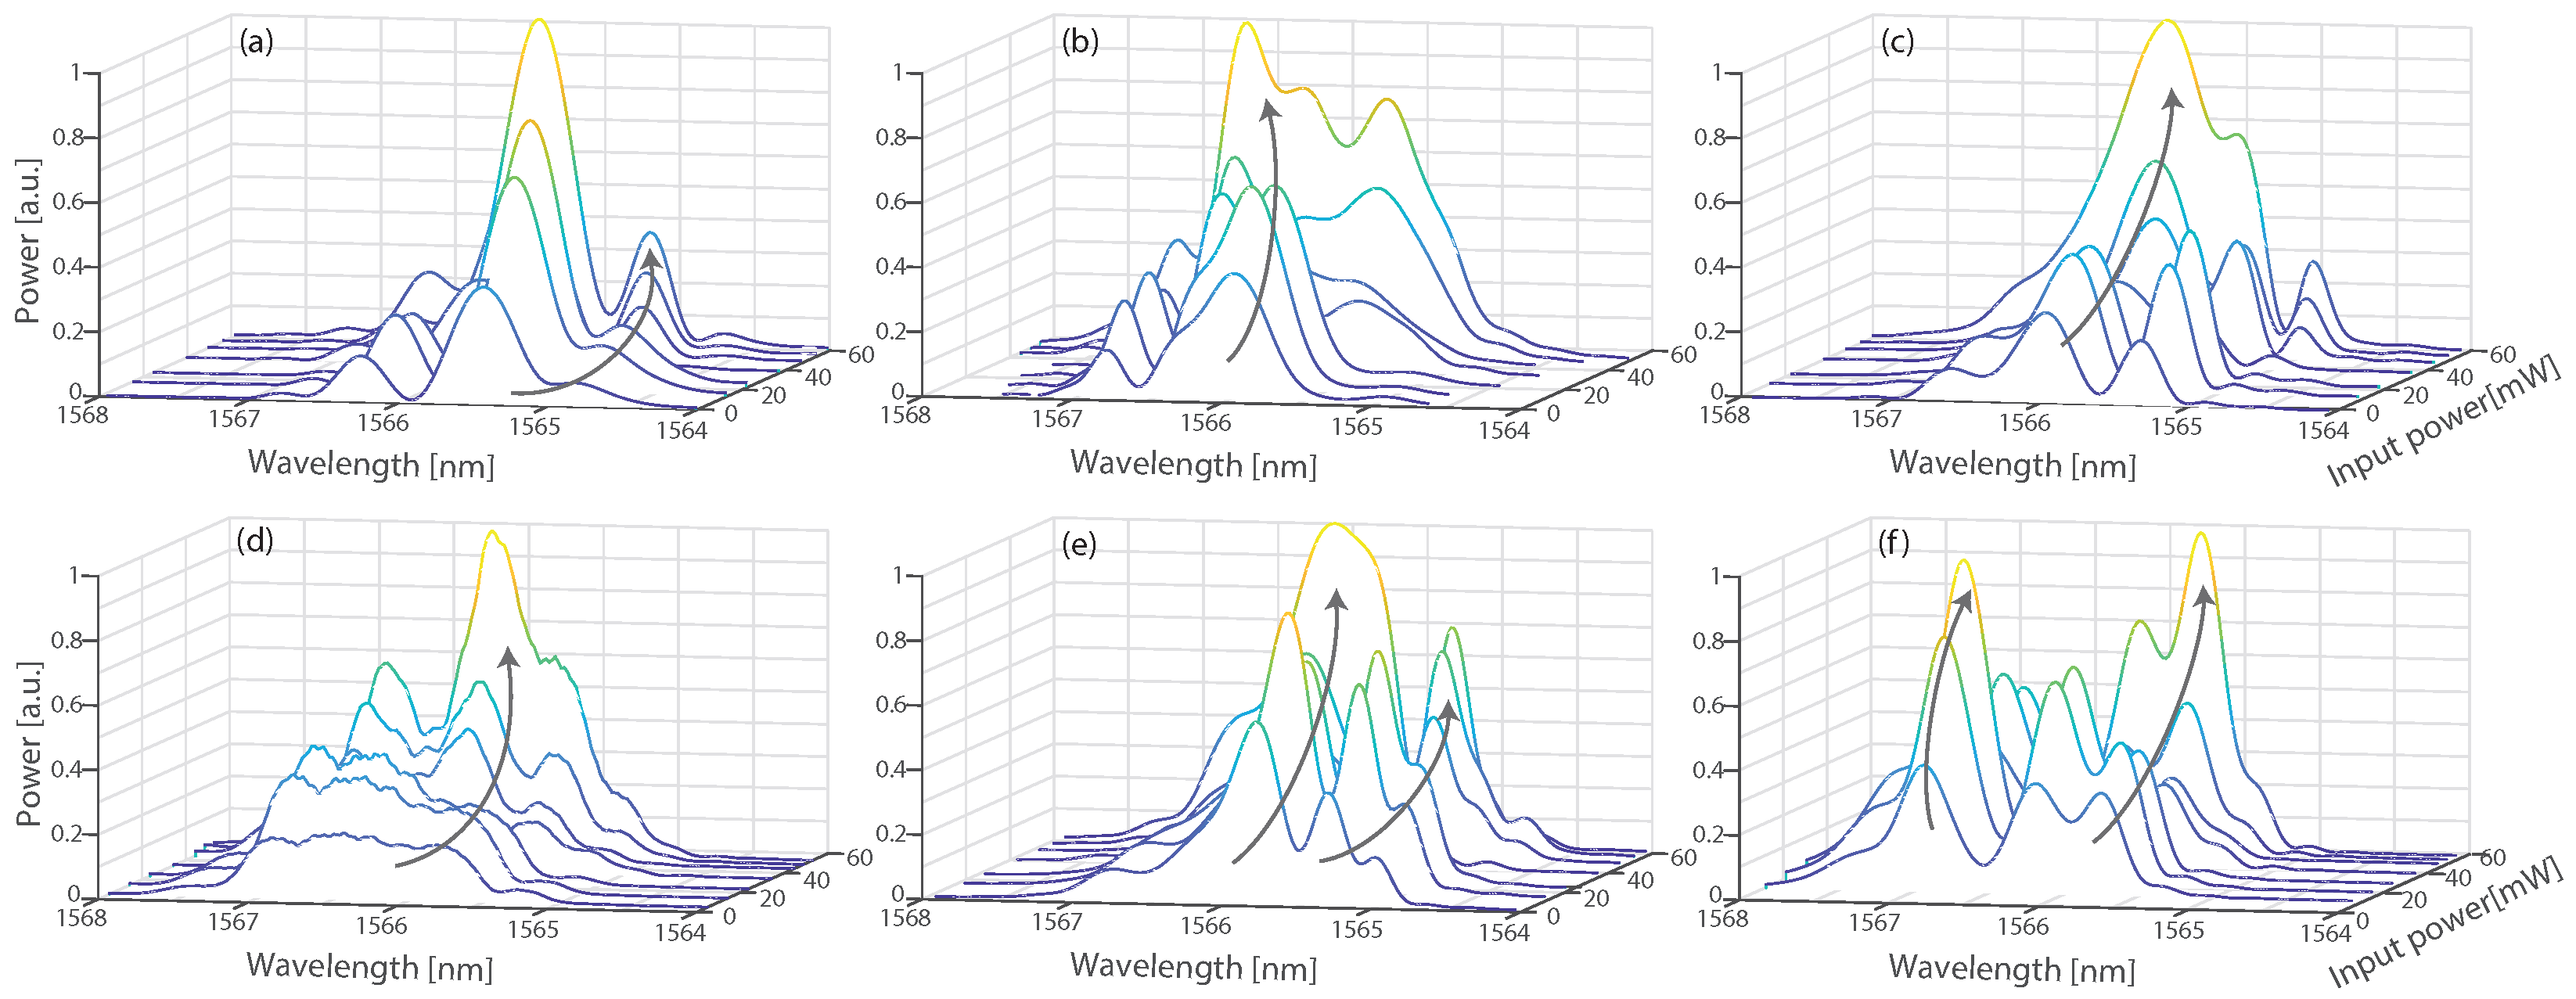
Next, we study the spectra of the output signal wave as a function of the input power for each output mode. The representative results of the spectral structure, when we excite and measure the same spatial modes, are presented in Figure 4a–c. As is evident, the spectrum changes and broadens as we increase the input power, namely, we observe self-phase modulation and modulation instabilities. The representative results of the spectral structure, when we excite and measure different spatial modes, are presented in Figure 4d–f. During the nonlinear interaction, the energy flows toward specific wavelengths, namely, it flows towards 1566 nm, both 1566.5 nm and 1565 nm, and both 1567 nm and 1566.5 nm in Figure 4d–f, respectively, as emphasized by the arrows. Specifically, we observe that it is possible to receive energy in certain output modes although the overlap integral of the energy transfer vanishes due to symmetry. We observe this cross-talk and energy transfer in all the forbidden combinations. These measurements are supported by our numerical simulations, which are presented in Section 4.
Finally, we excite two modes simultaneously and study the dynamics as they propagate in the fiber. For each combination of input modes, we measure the output mode, and compare it to the combination of exciting each mode separately. Since the measured idlers are Gaussian, we study the difference in the peak power between exciting a combination of modes and exciting the modes separately. The representative results of the output peak power of the idler for input mode combinations L P 01 + L P 11 a , L P 01 + L P 11 b , and L P 11 a + L P 11 b are presented in Figure 5a, b, and c, respectively. The circles, stars, and squares represent output modes L P 01 , L P 11 a and L P 11 b , respectively. These results indicate that the energy flows from the two input modes, which are excited, towards the third unexcited mode. In Figure 5a,b we observe the coupling between the different modes due to cross-phase modulation. In Figure 5c we observe that the energy flows from L P 11 a and L P 11 b towards L P 01 with a higher efficiency than in Figure 5a,b, as we increase the input power. This is consistent with spatial beam self-cleaning, where the light in the multimode fiber tends to flows toward the low-order mode as we increase the input power.
For studying the dynamics in the time domain, we measure the signal wavelength, which represents the temporal magnification. We study the spectral difference between exciting a combination of modes and exciting the modes separately. In these measurements, we detect the nonlinear interaction between the different modes. The representative results of the output signal are shown in Figure 6. We observe the spectral difference in the output for 17.4 dBm (red curves) and 8.5 dBm (blue curves) input power for all output modes. The solid, dashed, and dotted curves represent output modes L P 01 , L P 11 a , and L P 11 b , respectively. Input combinations of L P 01 + L P 11 a , L P 01 + L P 11 b , and L P 11 a + L P 11 b are shown in Figure 6a, b, and c, respectively. The energy flows from wavelengths with a negative difference towards wavelengths with a positive difference. This flow increases as a function of the input power. From these measurements, we identify the wavelengths where the symmetry in the overlap integral breaks. In these wavelengths, the modes can transfer energy between them even when the overlap integral vanishes and the coupling is zero.
While our system offers the advantage of high temporal resolution, it has several limitations. The number of spatial modes we can measure and monitor depends on our ability to separate them, namely, the distinguishability of our LP MUX, which degrades as we increase the number of modes. Another limitation is the sensitivity of the fiber to changes, such as temperature variations, physical bending, and mechanical stresses. This sensitivity can cause modal dispersion and redundant coupling between the modes, thereby limiting our ability to identify the nonlinear modal dynamics. We mitigate these limitations by handling the fiber carefully and focusing only on dynamics that have a quadratic power dependence.

4. Numerical Simulation

We numerically simulate the spectra of a pulse propagating in a few-mode fiber as a function of the input power and modes. In the simulation, we consider both the linear coupling due to inhomogeneities in the fiber and the nonlinear coupling due to nonlinear processes. We model the linear coupling as a unitary transformation, with 1 values on the main diagonal, and random smaller values at the off-diagonal. The fiber supports the propagation of the first three modes; therefore, the dimension of the transformation is 3 × 3 . To ensure unitary transformation, we span this space with a linear combination of the Gell-Mann matrices, with randomly generated weights. We model the nonlinear coupling as a non-unitary transformation, with coupling values that result from FWM, SPM, XPM, and modulation instability. Figure 7a–c show the representative simulated spectra when we excite and measure the same spatial modes. Figure 7d–f show the representative simulated spectra when we excite and measure the different spatial modes. Here, we calculate the spectra for the same excitations as shown in Figure 4. We observe the same behavior as in Figure 4; thus, we conclude that the numerical simulations have a qualitative agreement with the experimental measurements.

5. Conclusions

In this work, we present the experimental measurements of the spatio-temporal dynamics of ultrashort pulses in a few-mode fiber. The measurements indicate that the interactions between the different modes in the few-mode fiber are nonlinear. When we excite a single spatial mode and measure it at the output of the fiber, we observe self-phase modulation and modulation instabilities. When we measure different output modes, we observe the symmetry breaking of the spatial overlap integral at specific wavelengths, leading to energy transfer and cross-talk between the modes at these wavelengths. When we excite a combination of spatial modes, the two modes enhance the nonlinear interaction of each mode separately, leading to increased output power at the third mode due to spatial beam self-cleaning, FWM, and cross-phase modulations. Therefore, in this research, we show that it is possible to transfer energy between the modes even when the overlap integral vanishes and the coupling is zero. This cross-talk can lead to aberrations and distortion in the output of a multimode temporal imaging system, thereby making a multimode time lens a greater challenge than expected.

Author Contributions

Y.T. performed the experiment and numerical simulations, S.M. helped in the lab and advices, Y.T. wrote the manuscript, H.D. helped in the experiement and in the simulation, M.F. consived the idea and supervised on the project. All authors have read and agreed to the published version of the manuscript.

Funding

The research was funded by the Israel Science Foundation, grant number 2096/20.

Institutional Review Board Statement

Not applicable.

Informed Consent Statement

Not applicable.

Data Availability Statement

Data is availble uppon demend.

Conflicts of Interest

The authors declare no conflicts of interest.

References

  1. Krupa, K.; Tonello, A.; Barthélémy, A.; Mansuryan, T.; Couderc, V.; Millot, G.; Grelu, P.; Modotto, D.; Babin, S.A.; Wabnitz, S. Multimode nonlinear fiber optics, a spatiotemporal avenue. APL Photonics 2019, 4, 110901. [Google Scholar] [CrossRef]
  2. Goudreau, E.S.; Kupchak, C.; Sussman, B.J.; Boyd, R.W.; Lundeen, J.S. Theory of four-wave mixing of cylindrical vector beams in optical fibers. JOSA B 2020, 37, 1670–1682. [Google Scholar] [CrossRef]
  3. Ahsan, A.S.; Agrawal, G.P. Effect of an input beam’s shape and curvature on the nonlinear effects in graded-index fibers. JOSA B 2020, 37, 858–867. [Google Scholar] [CrossRef]
  4. Wright, L.G.; Ziegler, Z.M.; Lushnikov, P.M.; Zhu, Z.; Eftekhar, M.A.; Christodoulides, D.N.; Wise, F.W. Multimode nonlinear fiber optics: Massively parallel numerical solver, tutorial, and outlook. IEEE J. Sel. Top. Quantum Electron. 2017, 24, 1–16. [Google Scholar] [CrossRef]
  5. Kakkava, E.; Romito, M.; Conkey, D.B.; Loterie, D.; Stankovic, K.M.; Moser, C.; Psaltis, D. Selective femtosecond laser ablation via two-photon fluorescence imaging through a multimode fiber. Biomed. Opt. Express 2019, 10, 423–433. [Google Scholar] [CrossRef]
  6. Kakkava, E.; Rahmani, B.; Borhani, N.; Teğin, U.; Loterie, D.; Konstantinou, G.; Moser, C.; Psaltis, D. Imaging through multimode fibers using deep learning: The effects of intensity versus holographic recording of the speckle pattern. Opt. Fiber Technol. 2019, 52, 101985. [Google Scholar] [CrossRef]
  7. Xiong, W.; Redding, B.; Gertler, S.; Bromberg, Y.; Tagare, H.D.; Cao, H. Deep learning of ultrafast pulses with a multimode fiber. APL Photonics 2020, 5, 096106. [Google Scholar] [CrossRef]
  8. Kakkava, E.; Borhani, N.; Rahmani, B.; Teğin, U.; Moser, C.; Psaltis, D. Deep learning-based image classification through a multimode fiber in the presence of wavelength drift. Appl. Sci. 2020, 10, 3816. [Google Scholar] [CrossRef]
  9. Wright, L.G.; Christodoulides, D.N.; Wise, F.W. Controllable spatiotemporal nonlinear effects in multimode fibres. Nat. Photonics 2015, 9, 306–310. [Google Scholar] [CrossRef]
  10. Wright, L.G.; Sidorenko, P.; Pourbeyram, H.; Ziegler, Z.M.; Isichenko, A.; Malomed, B.A.; Menyuk, C.R.; Christodoulides, D.N.; Wise, F.W. Mechanisms of spatiotemporal mode-locking. Nat. Phys. 2020, 16, 565–570. [Google Scholar] [CrossRef]
  11. Ding, Y.; Xiao, X.; Wang, P.; Yang, C. Multiple-soliton in spatiotemporal mode-locked multimode fiber lasers. Opt. Express 2019, 27, 11435–11446. [Google Scholar] [CrossRef] [PubMed]
  12. Deliancourt, E.; Fabert, M.; Tonello, A.; Krupa, K.; Desfarges-Berthelemot, A.; Kermene, V.; Millot, G.; Barthélémy, A.; Wabnitz, S.; Couderc, V. Kerr beam self-cleaning on the LP 11 mode in graded-index multimode fibers. OSA Contin. 2019, 2, 1089–1096. [Google Scholar] [CrossRef]
  13. Krupa, K.; Tonello, A.; Shalaby, B.M.; Fabert, M.; Barthélémy, A.; Millot, G.; Wabnitz, S.; Couderc, V. Spatial beam self-cleaning in multimode fibres. Nat. Photonics 2017, 11, 237–241. [Google Scholar] [CrossRef]
  14. Wright, L.G.; Liu, Z.; Nolan, D.A.; Li, M.J.; Christodoulides, D.N.; Wise, F.W. Self-organized instability in graded-index multimode fibres. Nat. Photonics 2016, 10, 771–776. [Google Scholar] [CrossRef]
  15. Deng, Z.; Chen, Y.; Liu, J.; Zhao, C.; Fan, D. Graded-index breathing solitons from Airy pulses in multimode fibers. Opt. Express 2019, 27, 483–493. [Google Scholar] [CrossRef] [PubMed]
  16. Wright, L.G.; Renninger, W.H.; Christodoulides, D.N.; Wise, F.W. Spatiotemporal dynamics of multimode optical solitons. Opt. Express 2015, 23, 3492–3506. [Google Scholar] [CrossRef] [PubMed]
  17. Wright, L.G.; Christodoulides, D.N.; Wise, F.W. Spatiotemporal mode-locking in multimode fiber lasers. Science 2017, 358, 94–97. [Google Scholar] [CrossRef]
  18. Cao, B.; Gao, C.; Liu, K.; Xiao, X.; Yang, C.; Bao, C. Spatiotemporal mode-locking and dissipative solitons in multimode fiber lasers. Light Sci. Appl. 2023, 12, 260. [Google Scholar] [CrossRef]
  19. Li, L.; Leng, J.; Zhou, P.; Chen, J. Modulation instability induced by intermodal cross-phase modulation in step-index multimode fiber. Appl. Opt. 2019, 58, 4283–4287. [Google Scholar] [CrossRef]
  20. Dupiol, R.; Bendahmane, A.; Krupa, K.; Fatome, J.; Tonello, A.; Fabert, M.; Couderc, V.; Wabnitz, S.; Millot, G. Intermodal modulational instability in graded-index multimode optical fibers. Opt. Lett. 2017, 42, 3419–3422. [Google Scholar] [CrossRef]
  21. Hasegawa, A. Self-confinement of multimode optical pulse in a glass fiber. Opt. Lett. 1980, 5, 416–417. [Google Scholar] [CrossRef]
  22. Crosignani, B.; Cutolo, A.; Di Porto, P. Coupled-mode theory of nonlinear propagation in multimode and single-mode fibers: Envelope solitons and self-confinement. JOSA 1982, 72, 1136–1141. [Google Scholar] [CrossRef]
  23. Mecozzi, A.; Antonelli, C.; Shtaif, M. Soliton trapping in multimode fibers with random mode coupling. arXiv 2012, arXiv:1207.6506. [Google Scholar]
  24. Renninger, W.H.; Wise, F.W. Optical solitons in graded-index multimode fibres. Nat. Commun. 2013, 4, 1719. [Google Scholar] [CrossRef] [PubMed]
  25. Fontaine, N.K.; Ryf, R.; Chen, H.; Neilson, D.T.; Kim, K.; Carpenter, J. Laguerre-Gaussian mode sorter. Nat. Commun. 2019, 10, 1865. [Google Scholar] [CrossRef] [PubMed]
  26. Tarnowski, K.; Majchrowska, S.; Béjot, P.; Kibler, B. Numerical modelings of ultrashort pulse propagation and conical emission in multimode optical fibers. JOSA B 2021, 38, 732–742. [Google Scholar] [CrossRef]
  27. Kolner, B.H. Space-time duality and the theory of temporal imaging. IEEE J. Quantum Electron. 1994, 30, 1951–1963. [Google Scholar] [CrossRef]
  28. Foster, M.A.; Salem, R.; Geraghty, D.F.; Turner-Foster, A.C.; Lipson, M.; Gaeta, A.L. Silicon-chip-based ultrafast optical oscilloscope. Nature 2008, 456, 81–84. [Google Scholar] [CrossRef] [PubMed]
  29. Li, B.; Huang, S.W.; Li, Y.; Wong, C.W.; Wong, K.K. Panoramic-reconstruction temporal imaging for seamless measurements of slowly-evolved femtosecond pulse dynamics. Nat. Commun. 2017, 8, 61. [Google Scholar] [CrossRef]
  30. Li, B.; Azaña, J. Incoherent-light temporal stretching of high-speed intensity waveforms. Opt. Lett. 2014, 39, 4243–4246. [Google Scholar] [CrossRef]
  31. Bennett, C.; Scott, R.; Kolner, B. Temporal magnification and reversal of 100 Gb/s optical data with an up-conversion time microscope. Appl. Phys. Lett. 1994, 65, 2513–2515. [Google Scholar] [CrossRef]
  32. Meir, S.; Tamir, Y.; Duadi, H.; Cohen, E.; Fridman, M. Ultrafast Temporal SU (1, 1) Interferometer. Phys. Rev. Lett. 2023, 130, 253601. [Google Scholar] [CrossRef] [PubMed]
  33. Zhang, C.; Li, B.; Wong, K.K.Y. Ultrafast spectroscopy based on temporal focusing and its applications. IEEE J. Sel. Top. Quantum Electron. 2015, 22, 295–306. [Google Scholar] [CrossRef]
  34. Fernández-Ruiz, M.R.; Azaña, J. Temporal phase conjugation based on time-domain holography. Opt. Lett. 2015, 40, 127–130. [Google Scholar] [CrossRef] [PubMed]
  35. Klein, A.; Masri, G.; Duadi, H.; Sulimany, K.; Lib, O.; Steinberg, H.; Kolpakov, S.A.; Fridman, M. Ultrafast rogue wave patterns in fiber lasers. Optica 2018, 5, 774–778. [Google Scholar] [CrossRef]
  36. Klein, A.; Shahal, S.; Meir, S.; Duadi, H.; Sulimany, K.; Lib, O.; Steinberg, H.; Kolpakov, S.A.; Fridman, M. Ultrafast twin-peak rogue waves in a vector field. OSA Contin. 2019, 2, 3102–3106. [Google Scholar] [CrossRef]
  37. Feng, J.; Xu, W.; Li, S.; Liu, S. Analytic solutions of self-similar pulse based on Ginzburg-Landau equation with constant coefficients. Sci. China Ser. G Phys. Mech. Astron. 2008, 51, 299–306. [Google Scholar] [CrossRef]
  38. Nazemosadat, E.; Pourbeyram, H.; Mafi, A. Phase matching for spontaneous frequency conversion via four-wave mixing in graded-index multimode optical fibers. JOSA B 2016, 33, 144–150. [Google Scholar] [CrossRef]
  39. Mafi, A. Pulse propagation in a short nonlinear graded-index multimode optical fiber. J. Light. Technol. 2012, 30, 2803–2811. [Google Scholar] [CrossRef]
  40. Kolner, B.H.; Nazarathy, M. Temporal imaging with a time lens. Opt. Lett. 1989, 14, 630–632. [Google Scholar] [CrossRef]
  41. Meir, S.; Klein, A.; Duadi, H.; Cohen, E.; Fridman, M. Single-shot analysis of amplified correlated light. Opt. Express 2022, 30, 1773–1781. [Google Scholar] [CrossRef]
  42. Klein, A.; Shahal, S.; Masri, G.; Duadi, H.; Fridman, M. Four wave mixing-based time lens for orthogonal polarized input signals. IEEE Photonics J. 2017, 9, 1–7. [Google Scholar] [CrossRef]
  43. Klein, A.; Duadi, H.; Fridman, M. Full-stokes temporal imaging. Opt. Lett. 2018, 43, 1651–1653. [Google Scholar] [CrossRef]
  44. Klein, A.; Yaron, T.; Preter, E.; Duadi, H.; Fridman, M. Temporal depth imaging. Optica 2017, 4, 502–506. [Google Scholar] [CrossRef]
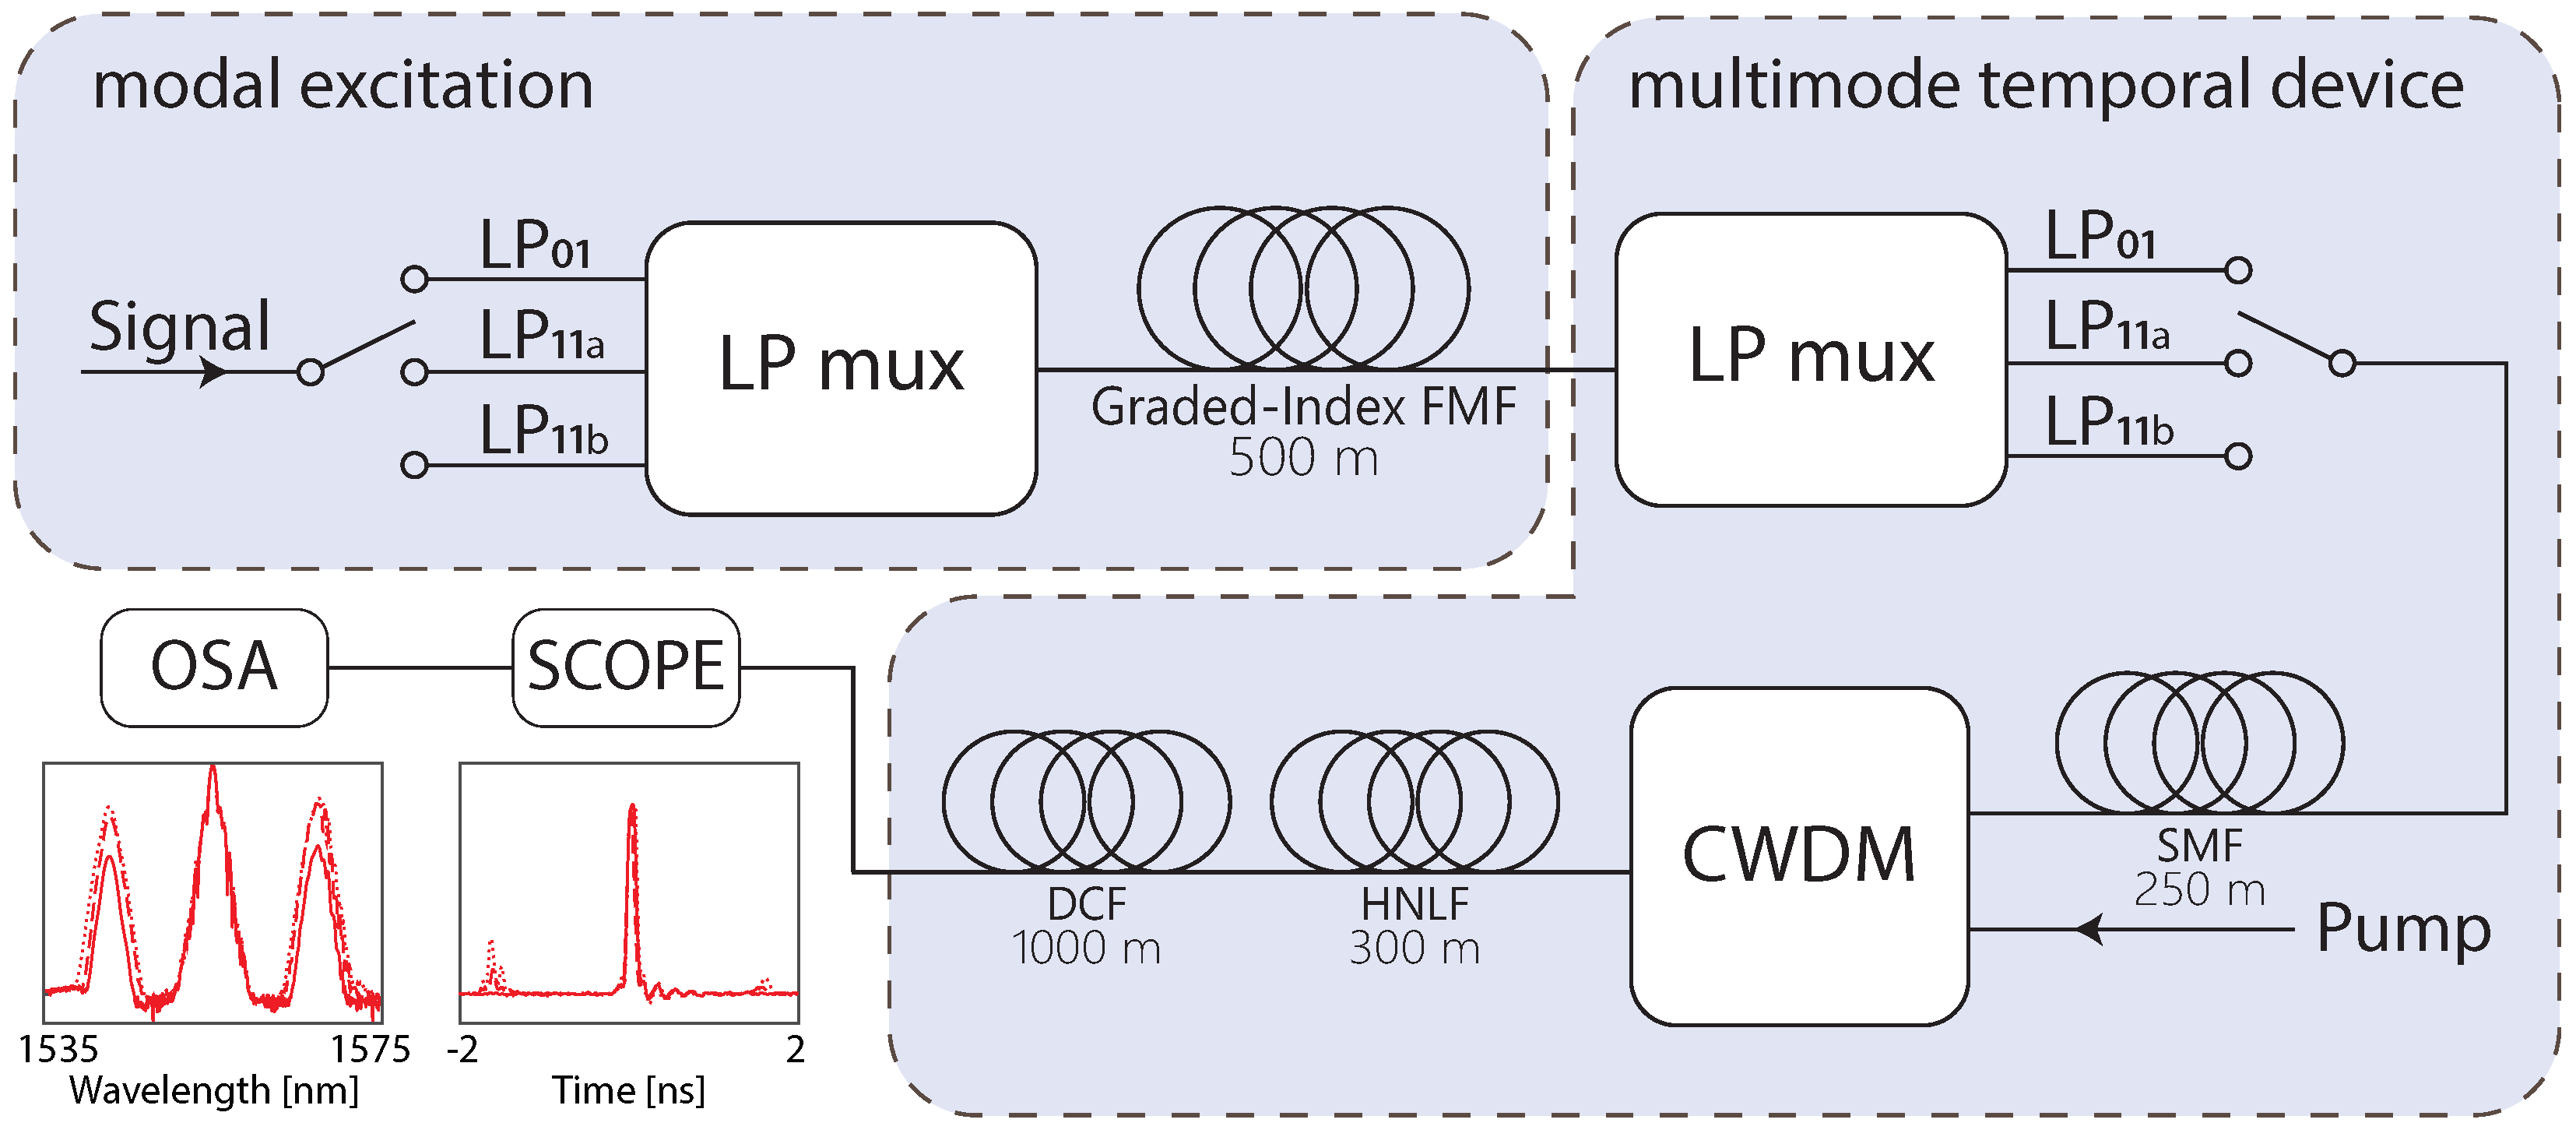
Figure 1. Schematics of the experimental setup. The two insets show representative results acquired by the optical spectrum analyzer (OSA) and oscilloscope (Scope) when we excite L P 11 b . Solid, dashed, and dotted curves represent output modes L P 01 , L P 11 a and L P 11 b , respectively.
Photonics 11 00591 g001
Figure 2. Spectral structures of the measured (a) idler and (b) signal at output mode L P 11 b , when exciting L P 11 a mode.
Photonics 11 00591 g002
Figure 3. Peak power as a function of the input power for (a) input mode L P 01 and output mode L P 01 at 1566.04 nm, and (b) input mode L P 11 a and output mode L P 11 a at 1566.66 nm. The accuracy of the fit is R 2 = 0.9852 and R 2 = 0.9787 for (a,b), respectively.
Photonics 11 00591 g003
Figure 4. Spectral structures of the output modes when (a) exciting L P 01 and measuring L P 01 , (b) exciting L P 11 a and measuring L P 11 a , (c) exciting L P 11 b and measuring L P 11 b , (d) exciting L P 11 a and measuring L P 01 , (e) exciting L P 11 b and measuring L P 11 a , and (f) exciting L P 11 a and measuring L P 11 b as a function of the input power. The different colors are for improving the visibility of the figure.
Photonics 11 00591 g004
Figure 5. Difference in the peak power between exciting a combination of modes and exciting the modes separately, as a function of the input power, for different input combinations: (a) L P 01 + L P 11 a , (b) L P 01 + L P 11 b and (c) L P 11 a + L P 11 b . Circles, stars, and squares represent output modes L P 01 , L P 11 a and L P 11 b , respectively.
Photonics 11 00591 g005
Figure 6. Difference between the spectrum of the output signals when exciting a combination of modes and exciting the modes separately: (a) L P 01 + L P 11 a , (b) L P 01 + L P 11 b , and (c) L P 11 a + L P 11 b . Red and blue curves represent 17.4 dBm and 8.5 dBm, respectively. Solid, dashed, and dotted curves represent output modes L P 01 , L P 11 a and L P 11 b .
Photonics 11 00591 g006
Figure 7. Numerical simulations of the spectral structures of the output modes when (a) exciting L P 01 and measuring L P 01 , (b) exciting L P 11 a and measuring L P 11 a , (c) exciting L P 11 b and measuring L P 11 b , (d) exciting L P 11 a and measuring L P 01 , (e) exciting L P 11 b and measuring L P 11 a , and (f) exciting L P 11 a and measuring L P 11 b as a function of the input power. The different colors are for improving the visibility of the figure.
Photonics 11 00591 g007
Disclaimer/Publisher’s Note: The statements, opinions and data contained in all publications are solely those of the individual author(s) and contributor(s) and not of MDPI and/or the editor(s). MDPI and/or the editor(s) disclaim responsibility for any injury to people or property resulting from any ideas, methods, instructions or products referred to in the content.