Article

A Practicable Optoelectronic Oscillator with Ultra-Low Phase Noise

School of Electrical and Information Engineering, Tianjin University, Tianjin 300072, China
*
Author to whom correspondence should be addressed.
Photonics 2024, 11(7), 614; https://doi.org/10.3390/photonics11070614
Submission received: 7 June 2024 / Revised: 23 June 2024 / Accepted: 25 June 2024 / Published: 28 June 2024
(This article belongs to the Section Optoelectronics and Optical Materials)

Abstract

:
In this paper, an optoelectronic oscillator (OEO) with ultra-low phase noise and high stability based on the injection-locked and phase-locked loop is proposed. In theory, the injection-locked frequency range of the injection signal is studied based on the phase dynamics equation, and the phase noise performance of the injection-locked OEO is analyzed. The role of the phase-locked loop on the frequency stability of the OEO is analyzed based on the phase-locked loop transfer function. In addition, this paper builds an injection-locked OEO based on a phase-locked loop. The injection-locked signal is the high-frequency output of the multiplication crystal oscillator (MCO). At the same time, this MCO synchronously outputs a low-frequency signal, which is used as the reference signal of the phase-locked loop. The experimental results show that the proposed OEO output frequency is 10 GHz, and the phase noise is −89.25 dBc/Hz@100 Hz, −121.71 dBc/Hz@1 kHz, and −145.39 dBc/Hz@10 kHz; the side-mode suppression ratio is 80 dB; the frequency stability is 2.06 × 10 11 @1 s, 9.03 × 10 11 @10 s, 1.03 × 10 10 @100 s, and 3.03 × 10 10 @1000 s. Consistent with the theoretical analysis results, the solution takes into account the frequency stability, side-mode suppression ratio, and phase noise performance. The simple structure is more advantageous in practical applications.

1. Introduction

As a key component of microwave technology, microwave oscillators are widely used in military and civil applications such as wireless communications, aerospace, radar, and electronic warfare [1,2,3,4]. With the increasing demand for high-rate, high-quality information transmission, microwave sources are constantly evolving towards higher frequencies and lower phase noise. The optoelectronic oscillator [5,6,7] converts optical energy into microwave energy through an optoelectronic feedback loop. With the advantages of ultra-low phase noise and a high Q, it has become a research hotspot with much attention in the field of microwave oscillation. In addition, the OEO is widely used in the fields of optical chaotic communication, pseudo-random number generation, optoelectronic machine learning, and sensing [8].
The OEO model was first proposed by Yao and Maleki of the Jet Propulsion Laboratory in the United States, and key features such as its starting conditions, spectral characteristics, and noise have been studied based on quasi-linear theory [6]. The OEO uses a long optical fiber as its energy-storage element. Due to the large bandwidth and low loss characteristics of optical fiber, the OEO has an ultra-high Q-value and is capable of generating high-frequency microwave signals with ultra-low phase noise. However, the long fiber makes the mode spacing in the resonant cavity smaller, and the long fiber is prone to mode hopping. In addition, the sensitivity of long optical fibers to factors such as temperature, pressure, and vibration can lead to a decrease in the frequency stability of the OEO. All of the above problems make it difficult to make the OEO practical. To obtain high-quality OEO microwave signals, scholars have proposed many methods [9].
The multi-loop OEO [10,11,12,13] achieves side-mode suppression by introducing a second or more fiber-optic loops into the resonant cavity. Due to the Vernier effect, only frequencies that simultaneously satisfy all OEO loop oscillation modes are able to oscillate, while other modes are suppressed. However, the Q-value of a multi-loop OEO is the average of the Q-values of multiple loops, which worsens the phase noise performance [14]. Therefore, in order to suppress side-modes and maintain a high Q, injection locking [15,16,17,18] is proposed as a simpler approach. Injection locking pulls the main oscillation mode onto the injected signal to achieve side-mode suppression and phase noise improvement.
As a high-quality microwave source, frequency stability is a very important measure in addition to the side-mode suppression ratio and phase noise. In order to improve the frequency stability of the system, some scholars have proposed the use of a feedback regulation to compensate the oscillation frequency of the OEO [19,20,21]. One of the more typical methods is phase-locked loop regulation. The OEO is equated to a voltage-controlled oscillator (VCO) in the phase-locked loop, which can effectively improve the frequency stability of the OEO.
Zhang et al. proposed a method to achieve long-term frequency stabilization of the OEO using a phase-locked loop with PID regulation [22]. The method can generate a 3.035 GHz microwave signal with a phase noise of about −110 dBc/Hz@10 kHz and a frequency stability of 6.98 × 10 14 @1000 s. Using a phase-locked loop and a dual-loop self-injection-locked technique [23], Fu et al. generated a 9.955 GHz microwave signal with a phase noise of −124.7 dBc/Hz@10 kHz and a frequency stability of 7.03 × 10 12 @100 s. Eliyahu et al.’s scheme uses a phase-locked loop structure and thermally stabilized optical fibers. This scheme produced a 10 GHz microwave signal with a phase noise of −143 dBc/Hz@10 kHz and a frequency stability of 6.41 × 10 11 @1 s [24]. Wang et al. used a phase-locked loop structure, a dual-loop OEO, and a high-precision temperature control module to generate a 10 GHz microwave signal with a phase noise of −151 dBc/Hz@10 kHz and a frequency stability of 3.4 × 10 14 @1 s [25].
In this paper, an injection-locked OEO scheme based on a phase-locked loop is proposed. The injection-locked frequency range of the injection signal is analyzed, and the effect of the injection signal on the OEO phase noise is investigated. The parameters of the phase-locked OEO system are designed, and the effect of the phase-locked loop on the frequency stability of the OEO is analyzed. The scheme combines the phase-locked loop and injection-locked technique. The MCO is used to output high-frequency and low-frequency signals. The high-frequency signal is used as the injection signal, and the low-frequency signal is used as the reference signal for the phase-locked loop. The experimental structure is simple, and the results are remarkable. Our experimental results take into account phase noise, side-mode suppression, and frequency stability. This OEO system can output a high-frequency signal at 10 GHz; the phase noise at a 10 kHz frequency offset can be lower than −145 dBc/Hz; the side-mode suppression ratio can up to 80 dB; the frequency stability is 2.06 × 10 11 @1 s, 9.03 × 10 11 @10 s, 1.03 × 10 10 @100 s, and 3.03 × 10 10 @1000 s. It provides a good technical basis for realizing the application of the OEO in communication, radar, and other systems.

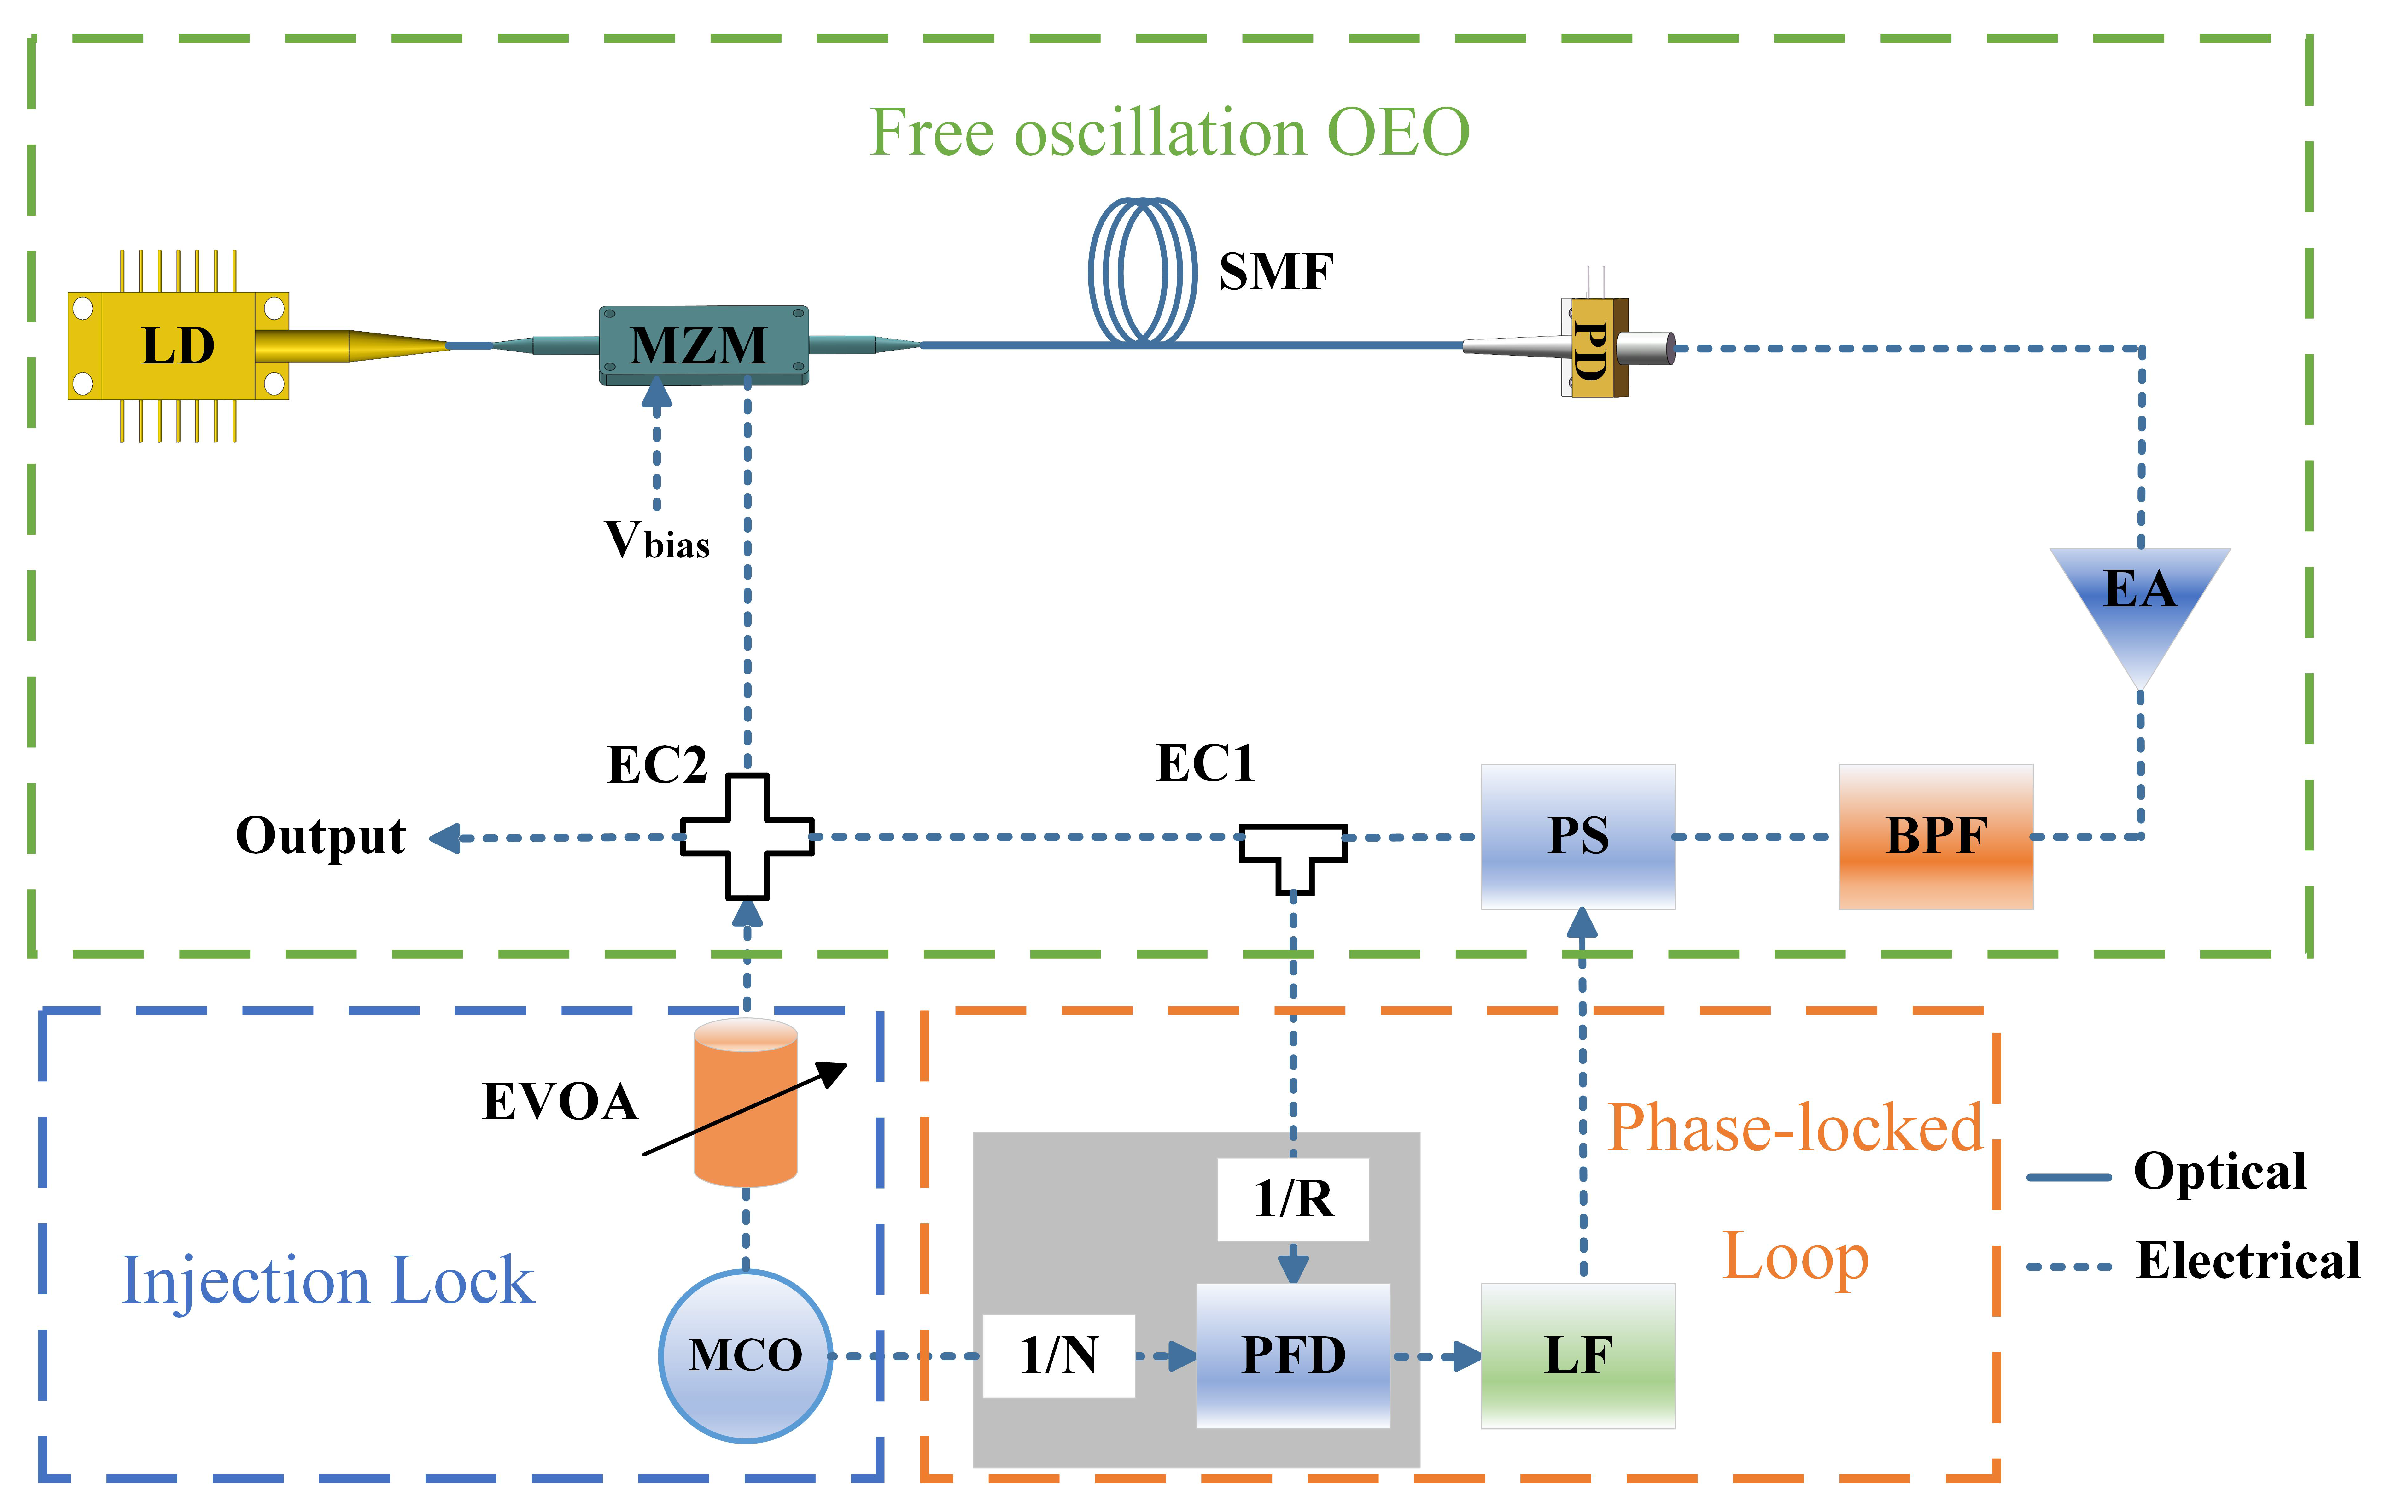
2. Experimental Principle

Figure 1 shows the schematic diagram of the injection-locked OEO based on the phase-locked loop in this paper. The system can be divided into the free oscillation OEO module, injection-locked module, and phase-locked Loop module. The high-frequency output of the MCO is used as the OEO injection signal V inj . The low-frequency output of the MCO is used as the reference signal V REF of the phase-locked loop. V REF and the OEO main oscillation mode signal V out are discriminated in the phase-locked loop to obtain the phase difference signal. The phase-locked loop outputs a control signal V control , which compensates for the variation of the OEO loop cavity length.

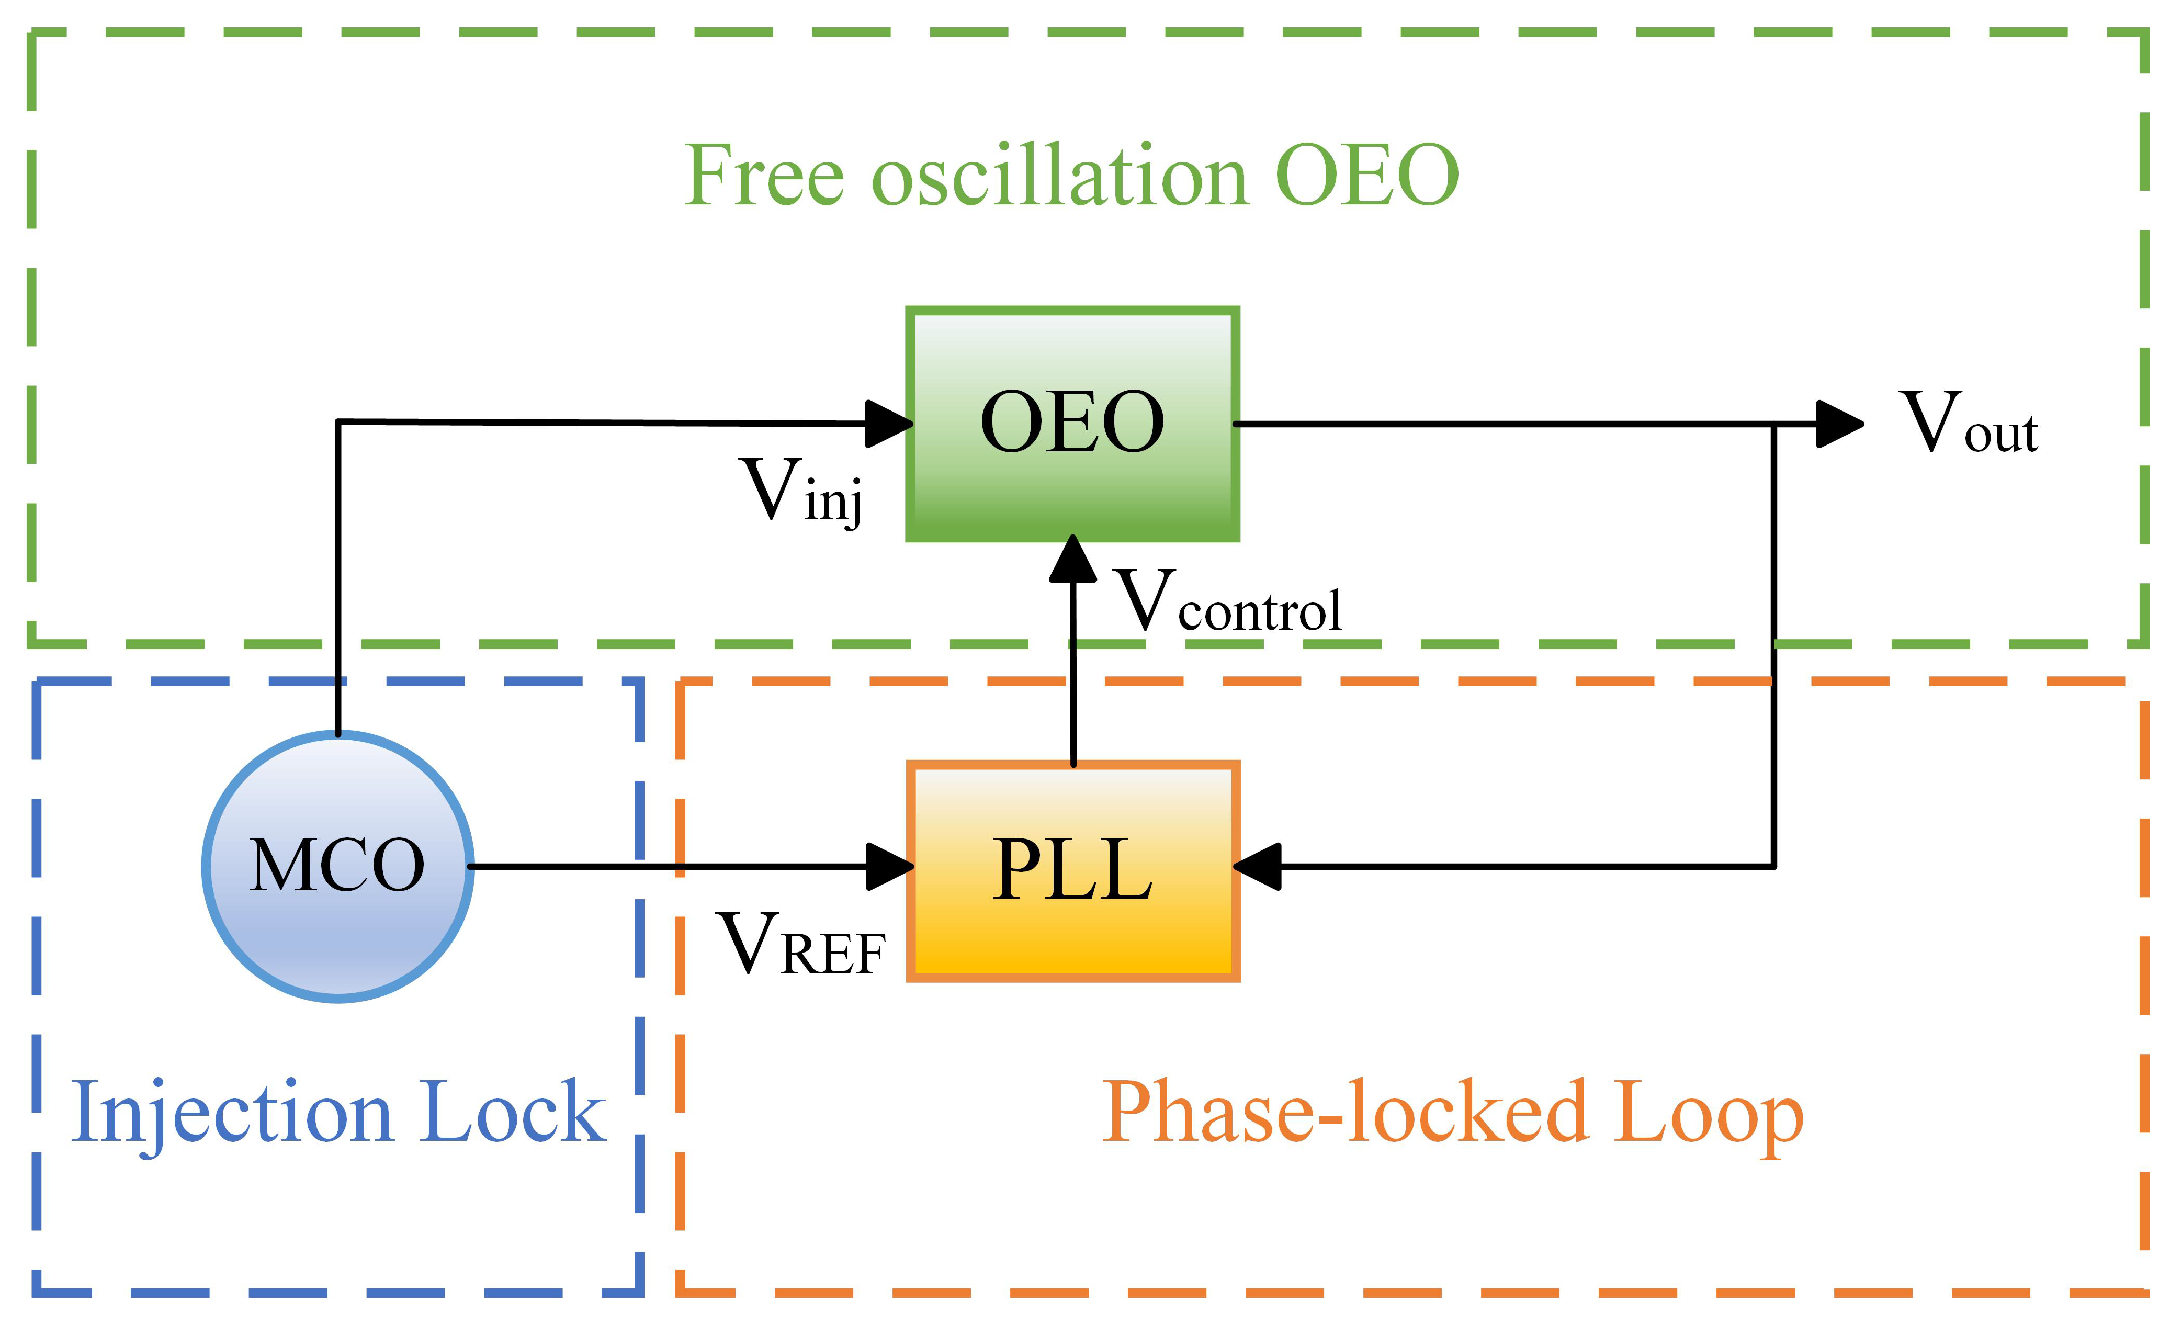
2.1. Injection-Locked Module

The high-frequency output of the MCO is injected as an injection signal into the free oscillation OEO. The OEO main oscillation mode signal is expressed as V 0 = A 0 cos ( ω 0 t + θ 0 ) , and the injection signal is expressed as V inj = A inj cos ( ω inj t + θ inj ) , where A 0 , A inj , ω 0 , ω inj , θ 0 , and θ inj are the amplitude, angular frequency, and initial phase of the OEO main oscillation mode signal and the injection signal, respectively. Considering the injection signal as a weak power injection, the phase equation for injection locking is [26]:
d φ d t = Δ ω 0 + μ tan ( Δ ω 0 τ ) α sin ( φ Δ ω 0 τ )
where φ is the instantaneous phase difference between the OEO main oscillation mode signal and the external injection signal, Δ ω 0 = ω 0 ω inj is the difference in angular frequency between the OEO main oscillation mode signal and the injection signal, μ = ω 0 2 Q f is the half-bandwidth of the band-pass filter, Q f is the quality factor of the band-pass filter, τ is the time delay of the optoelectronic feedback loop, α = μ K I / cos ( Δ ω 0 τ ) , and K I = A inj / A 0 is injection amplitude ratio. When the OEO achieves injection locking, then d φ / d t = 0 , and | sin ( φ Δ ω 0 τ ) | max = 1 , Equation (1) can be rewritten as:
0 = Δ ω 0 , max cos Δ ω 0 , max τ + μ sin ( Δ ω 0 , max τ ) μ K I
where Δ ω 0 , max is the maximum value of the injection-locked range, and the injection-locked range can be divided according to the injection amplitude ratio from Equation (2) (in this paper, the OEO equivalent cavity length is 4 km, the loop delay is τ 20 μs, and the quality factor of the bandpass filter is Q f = 1000). The blue part in Figure 2 shows the injection-locked range, and from Figure 2, the injection-locked range increases with the increase of the injection amplitude ratio. When the injection amplitude ratio is larger (e.g., near −10 dB), the injection-locked bandwidth is larger (about 4838 Hz). When the injection amplitude ratio is smaller (e.g., near −40 dB), the injection-locked bandwidth is smaller (about 158 Hz). When the difference between the frequency of the injection signal and the frequency of the free oscillation OEO main oscillation mode is less than or equal to the injection-locked range, and under certain injection power conditions and phase conditions, the frequency of the main oscillation mode will be pulled onto the injected signal [27].
After injection locking is implemented, injection locking can have a significant effect on the phase noise of the OEO system. The phase equation can be rewritten from Equation (1) as:
d φ s d t = Δ ω 0 + μ tan ( Δ ω 0 τ ) α sin ( φ s Δ ω 0 τ )
φ s is the steady-state phase difference between the OEO’s main oscillation mode signal and the external injection signal. Due to the phase perturbation of the injection signal and the OEO main oscillation mode signal, φ s is subjected to the phase perturbation φ r , and the steady-state phase difference after the phase perturbation is φ sr . φ sr = φ s + φ r . Equation (3) can be rewritten as [26]:
d φ sr d t = Δ ω 0 + μ tan ( Δ ω 0 τ ) α sin ( φ sr Δ ω 0 τ ) + d φ r 0 ( t ) d t d φ ri ( t ) d t
φ r 0 ( t ) and φ ri ( t ) denote the phase noise of the OEO main oscillation mode signal and the injection signal, respectively. Bringing Equation (3) into Equation (4), we obtain:
d φ r d t = α sin φ sr Δ ω 0 τ + α sin φ s Δ ω 0 τ + d φ r 0 ( t ) d t d φ ri ( t ) d t
Since φ r is a tiny perturbation near φ s , We can expand sin ( φ sr Δ ω 0 τ ) in a Taylor series around φ s , sin ( φ sr Δ ω 0 τ ) = sin ( φ s Δ ω 0 τ ) + φ r cos ( φ s Δ ω 0 τ ) , we obtain:
d φ r d t = α φ r cos ( φ s Δ ω 0 τ ) + d φ r 0 ( t ) d t d φ ri ( t ) d t
The angular frequency of the system output signal is ω out ( t ) = ω inj ( t ) + d φ r / d t , and we obtain:
ω out ( t ) = ω inj α φ r cos ( φ s Δ ω 0 τ ) + d φ r 0 ( t ) d t
Then, the angular frequency perturbation of the output signal in the neighborhood of ω inj can be expressed as:
ω rout ( t ) = α φ r cos ( φ s Δ ω 0 τ ) + d φ r 0 ( t ) d t
Integrating Equation (8) and applying the Laplace transform to Equations (6) and (8), we obtain the total phase noise in the frequency domain:
H rout ( s ) = H r 0 ( s ) φ r 0 ( s ) + H ri ( s ) φ ri ( s )
where H r 0 (s) and H ri (s) are the transfer functions of the phase noise of the OEO main oscillation mode signal and the injection signal, respectively. Substituting s = j 2 π f into H r 0 (s) and H ri (s) and taking the square modulus, the total phase noise power spectral density can be expressed as [26]:
S rout ( f ) = | H r 0 ( j f ) | 2 S r 0 ( f ) + | H ri ( j f ) | 2 S ri ( f )
where:
H r 0 ( j f ) 2 = ( f / α ) 2 1 [ ( Δ f 0 + μ tan ( Δ f 0 τ ) ) / α ] 2 + ( f / α ) 2
H ri ( j f ) 2 = 1 [ ( Δ f 0 + μ tan ( Δ f 0 τ ) ) / α ] 2 1 [ ( Δ f 0 + μ tan ( Δ f 0 τ ) ) / α ] 2 + ( f / α ) 2
Δ f 0 = Δ ω 0 / 2 π , and S r 0 ( f ) and S ri ( f ) are the phase noise power spectral density of the OEO main oscillation mode signal and of the the injection signal. When the injection signal is at the same frequency as the OEO main oscillation mode signal, Δ f 0 = 0 , the total phase noise power spectral density can be simplified as:
S rout ( f ) = ( f / α ) 2 1 + ( f / α ) 2 S r 0 ( f ) + 1 1 + ( f / α ) 2 S ri ( f )
Figure 3 shows the simulation results of the phase noise power spectral density of the free oscillation OEO, the injection signal, and the injection-locked OEO ( f 0 = 10 GHz, Q f = 1000, Δ ω 0 = 0). In Figure 3, the blue solid line represents the free oscillation OEO phase noise power spectral density, the black solid line represents the injection signal phase noise power spectral density, and the green, yellow, red, blue–green, and Magenta solid lines represent the injection-locked OEO phase noise power spectral densities at injection amplitude ratios of −10, −20, −25, −30, and −40, respectively. As can be seen from Figure 3, when the injection amplitude ratio is certain, the phase noise of the injection-locked OEO at the low-frequency offset is mainly dominated by the phase noise of the injection signal, and the phase noise of the injection-locked OEO at the high-frequency offset is mainly dominated by the phase noise of the free oscillation OEO. When the injection amplitude ratio increases, the phase noise of the injection-locked OEO at the high-frequency offset gradually becomes worse.
In addition to this, in the free oscillation OEO, there is a series of side-modes near the OEO main oscillation mode signal, corresponding to a series of peaks in the phase noise of the free oscillation OEO in Figure 3, with a 50 kHz interval between the modes. The side-modes’ noise diminishes as the injection amplitude ratio increases. The higher injection intensity increases the nonlinear gain of the OEO’s main oscillation mode [28] so that the OEO’s side-modes are more strongly suppressed.
Combining the effects of the injection amplitude ratio on the injection-locked range, the phase noise of the injection-locked OEO, and the side-modes, the injection amplitude ratio in this paper is set between −20 dB and −25 dB. This ensures a larger injection-locked range, lower phase noise, and higher side-mode suppression.

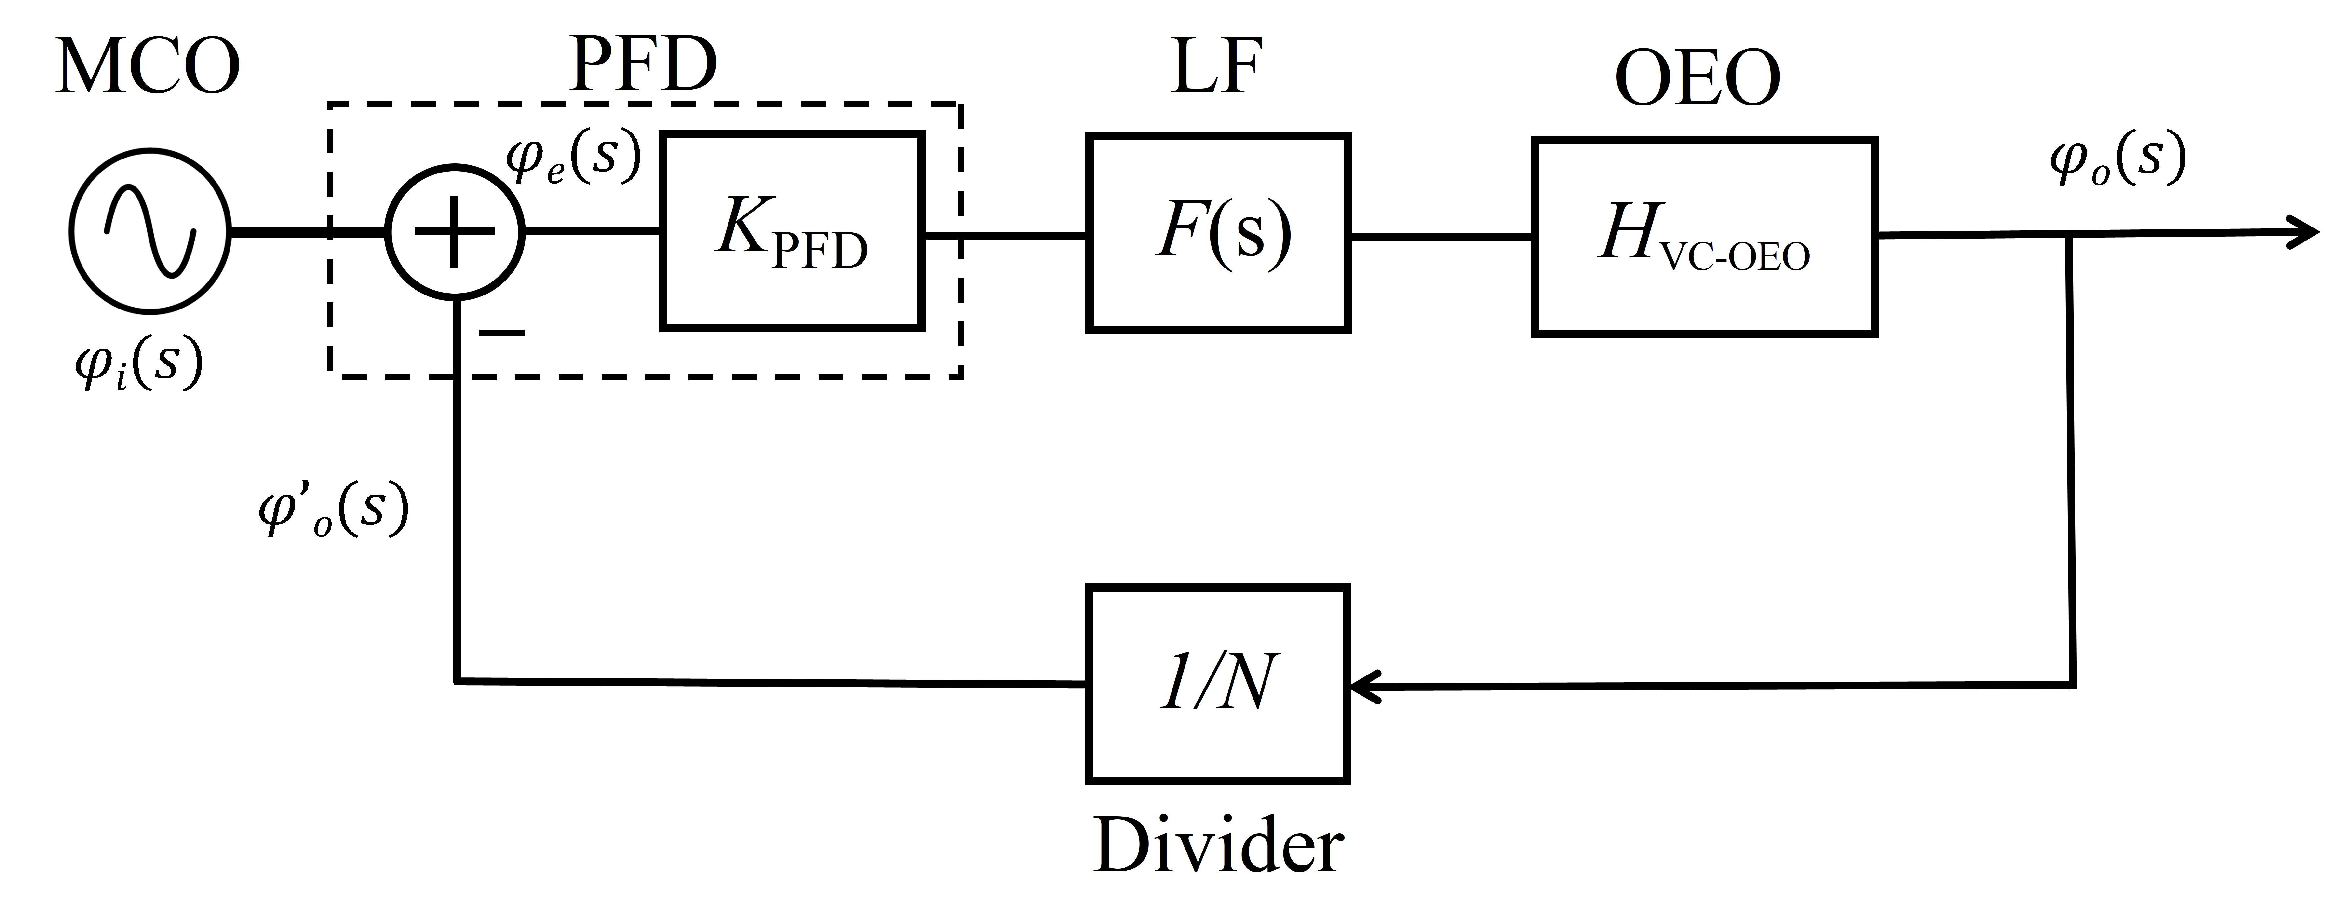
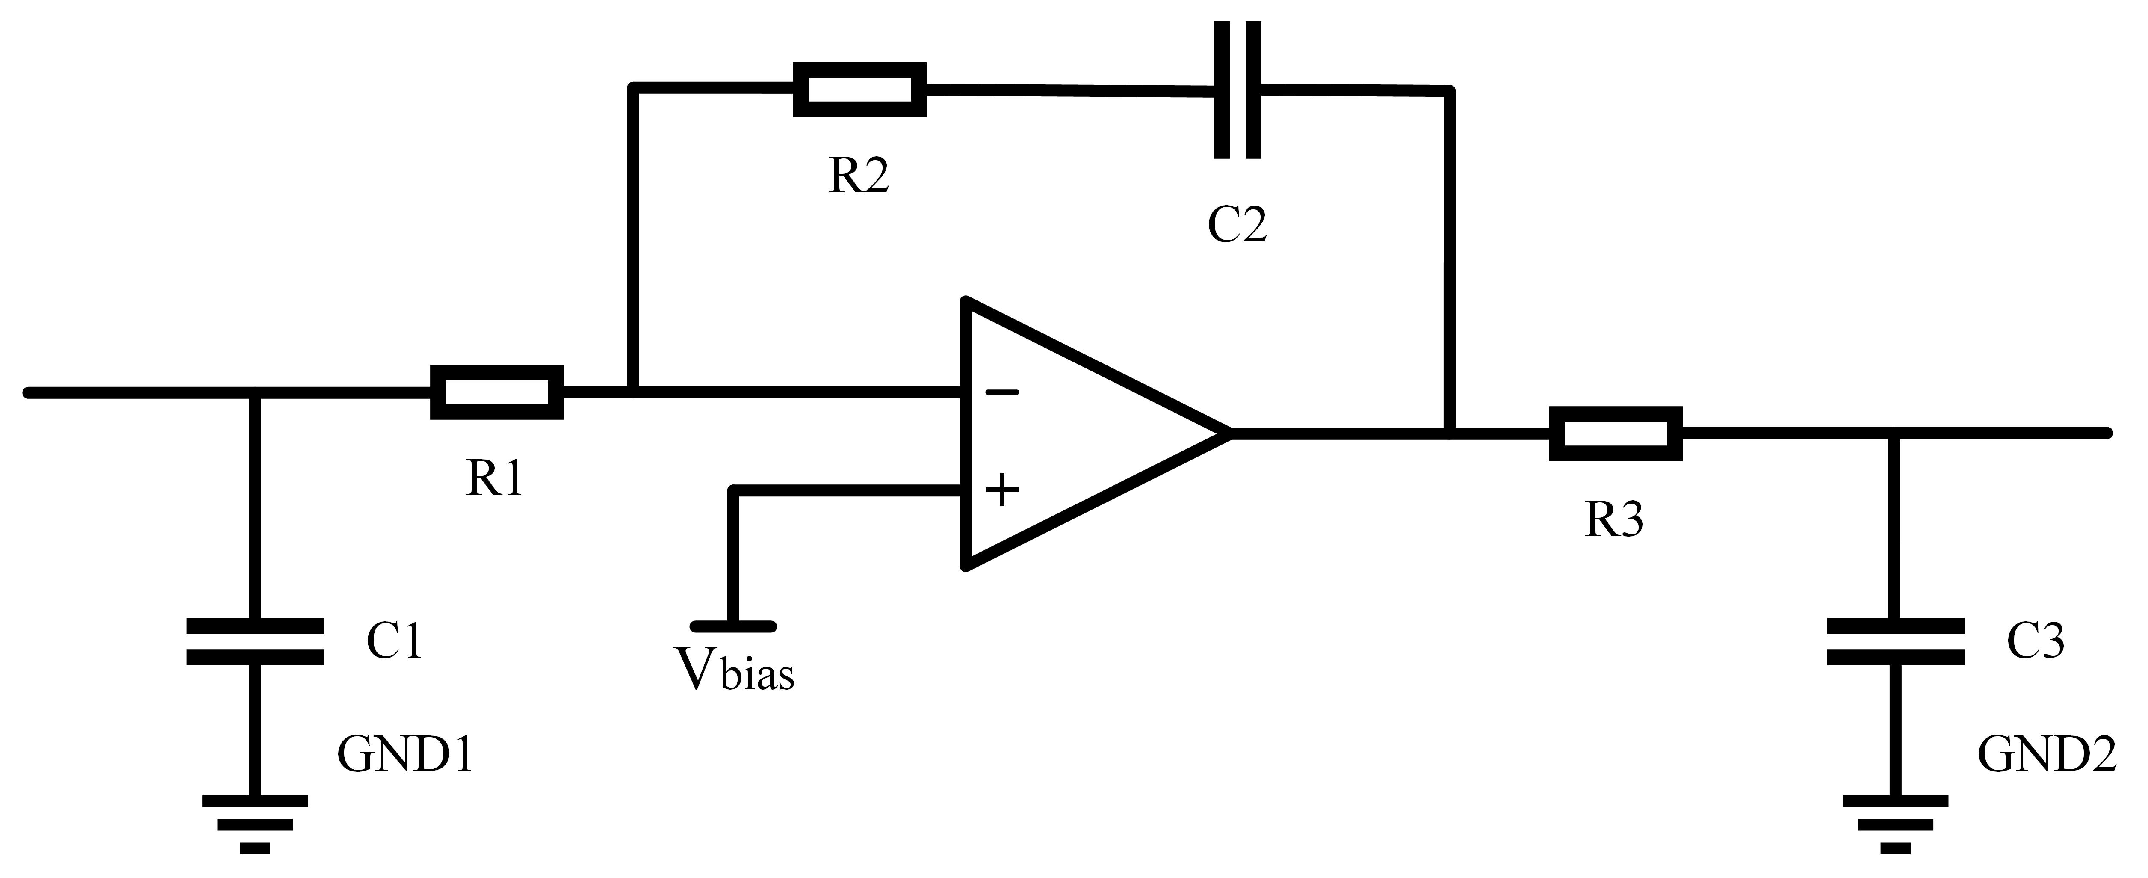
2.2. Phase-Locked Loop Module

When the resonant cavity in the OEO is disturbed by the environment, the frequency difference between the external injection signal and the OEO main oscillation mode easily exceeds the locking range. In order to ensure the long-term stability of the OEO, this paper adopts the phase-locked loop technique to stabilize the frequency of the OEO main oscillation mode. The phase-locked loop schematic diagram is shown in Figure 4. The phase-locked loop contains the multiplication crystal oscillator (MCO), frequency and phase discriminator (PFD), loop filter (LF), OEO, and frequency divider (divider). In this paper, the synchronous low-frequency signal output of the MCO is used as the reference signal of the phase-locked loop.
Set the phase of the input reference signal to be φ i and the phase of the OEO φ o after N-division to be φ o . The two signals are discriminated in the PFD, and the phase difference signal is φ e = φ i φ o . Then, φ e is converted to a voltage. The voltage is V PFD = K PFD ( φ i φ o ) , where K PFD is the discriminator gain.
The loop filter adopts the third-order active proportional integral loop filter, which is used to filter out the high-frequency components in the output voltage of the PFD. Figure 5 shows the schematic diagram of the third-order active proportional integral loop filter. Its transfer function is F ( s ) = ( 1 + s T 2 ) / ( s C 2 ( 1 + s T 1 ) ( 1 + s T 3 ) ) , where T 1 = C 1 R 1 , T 2 = C 2 R 2 , T 3 = C 3 R 3 ( C 1 = 1.5 u F ; R 1 = 220 Ω ; C 2 = 220 n F ; R 2 = 4.3 k Ω ; C 3 = 1.2 u F ; R 3 = 1 k Ω ) . The 3 dB bandwidth of the loop filter is 24 Hz.
The output voltage of the loop filter controls the phase shifter in the OEO loop. Phase shifters can change the OEO loop cavity length and frequency. Consequently, the OEO in this paper can be equated to a VCO. The transfer function of the voltage-controlled OEO can be expressed as H V C - O E O = K O E O / s , where K O E O is the sensitivity of the OEO.
The frequency divider divides the frequency and phase of the OEO by N . Its transfer function is 1/ N . According to the transfer function of each part of the phase-locked loop, the linear dynamic equation of the phase-locked loop system is obtained as:
φ e ( s ) = φ i ( s ) K P F D F ( s ) H V C - O E O φ e ( s ) / N
The closed-loop transfer function and error transfer function of the phase-locked loop system are obtained according to Equation (14) as:
H s = φ o s φ i s = K P F D F s H V C - O E O N + K P F D F s H V C - O E O
H e ( s ) = φ e ( s ) φ i ( s ) = N N + K P F D F ( s ) H V C - O E O
Bringing the transfer functions of the third-order active proportional–integral loop filter and the voltage-controlled OEO into Equations (15) and (16), the amplitude–frequency characteristic simulation results of the closed-loop transfer function and the error transfer function are shown in Figure 6 ( K O E O = 3.17 kHz/V, K P F D = 0.16 V/rad, N = 100). According to Figure 6, it can be seen that the phase-locked loop has a low-pass response to the input signal and can respond to phase error signals within a bandwidth of B W L F = 4230 rad/s. The phase-locked loop can filter out the high-frequency component of the input phase signal. When the frequency ramp signal is used as a reference signal, then φ i ( s ) = Δ ω / s 3 , and Δ ω is the rate of change of angular frequency. The steady-state error of a phase-locked loop system is:
φ e ( ) = lim s = j ω , ω 0 s φ i ( s ) H e ( s ) = 0
After the transient response disappears, the final phase error φ e of the phase-locked loop tends to zero. The phase-locked loop is used to achieve the tracking and control of the OEO phase. The scheme can respond to the phase error signals within the bandwidth range and filter out the high-frequency component of the input phase signal. The scheme can maintain the long-term frequency stability of the system.

3. Experimental Setup

The scheme of the injection-locked OEO system based on the phase-locked loop is shown in Figure 7. The system is divided into a free oscillation OEO module, an injection-locked module, and a phase-locked loop module. The free oscillation OEO module consists of a laser (LD, center wavelength 1550 nm, DC optical power 14 dBm, relative intensity noise less than −150 dBc/Hz), a Mach–Zehnder modulator (MZM, response bandwidth 20 GHz, half-wave voltage 4.5 V), single mode fiber (SMF, length 4 km, loss 0.45 dB), photodetector (PD, response bandwidth 16 GHz), electrical amplifier (EA, gain 30 dB), bandpass filter (BPF, center frequency 10 GHz, bandwidth 10 M), electrical phase shifter (PS, 0° to 360° phase shift range corresponding to a control voltage of 0 to 12 V, insertion loss 3.5 dB), and electrical coupler (EC, insertion loss 3 dB). The optical signal generated by the laser enters the MZM for intensity modulation, and the optical signal output from the modulator is transmitted through the single mode fiber. Then, the optical signal enters the photodetector for photoelectric conversion. The electrical amplifiers provide gain for the entire OEO loop. The electrical signal is selected by the band-pass filter and passes through the electric phase shifter, then is divided into two paths through the electric coupler 1. One path as the OEO oscillating signal feedback into the phase-locked loop, and the other path enters the electric coupler 2, as the output signal of the OEO and the modulation signal of the MZM. The injection-locked module consists of a MCO (high-frequency output of 10 GHz, low-frequency output of 100 MHz) and an electrically adjustable attenuator (EVOA, maximum attenuation value of 30 dB). The high-frequency output (10 GHz) of the MCO goes to the EVOA to regulate the injected power, and then injects into the free-oscillation OEO module. The phase-locked loop module consists of a phase-locked loop chip and a loop filter (LF, bandwidth 150 Hz). The phase-locked loop chip is HMC702, which divides the OEO oscillating signal by 100 and divides the 100 MHz reference signal of the MCO by 1. The chip outputs the phase error signal after discriminating the frequency and phase. The loop filter is a third-order active proportional–integral loop filter, which filters the input phase difference signal and provides control voltage for the electric phase shifter. In addition, the MZM is controlled by a microprocessor control module. The modulation curve of the MZM drifts due to temperature changes. The system monitors and regulates the bias voltage of the modulator in real time to improve long-term frequency stability.

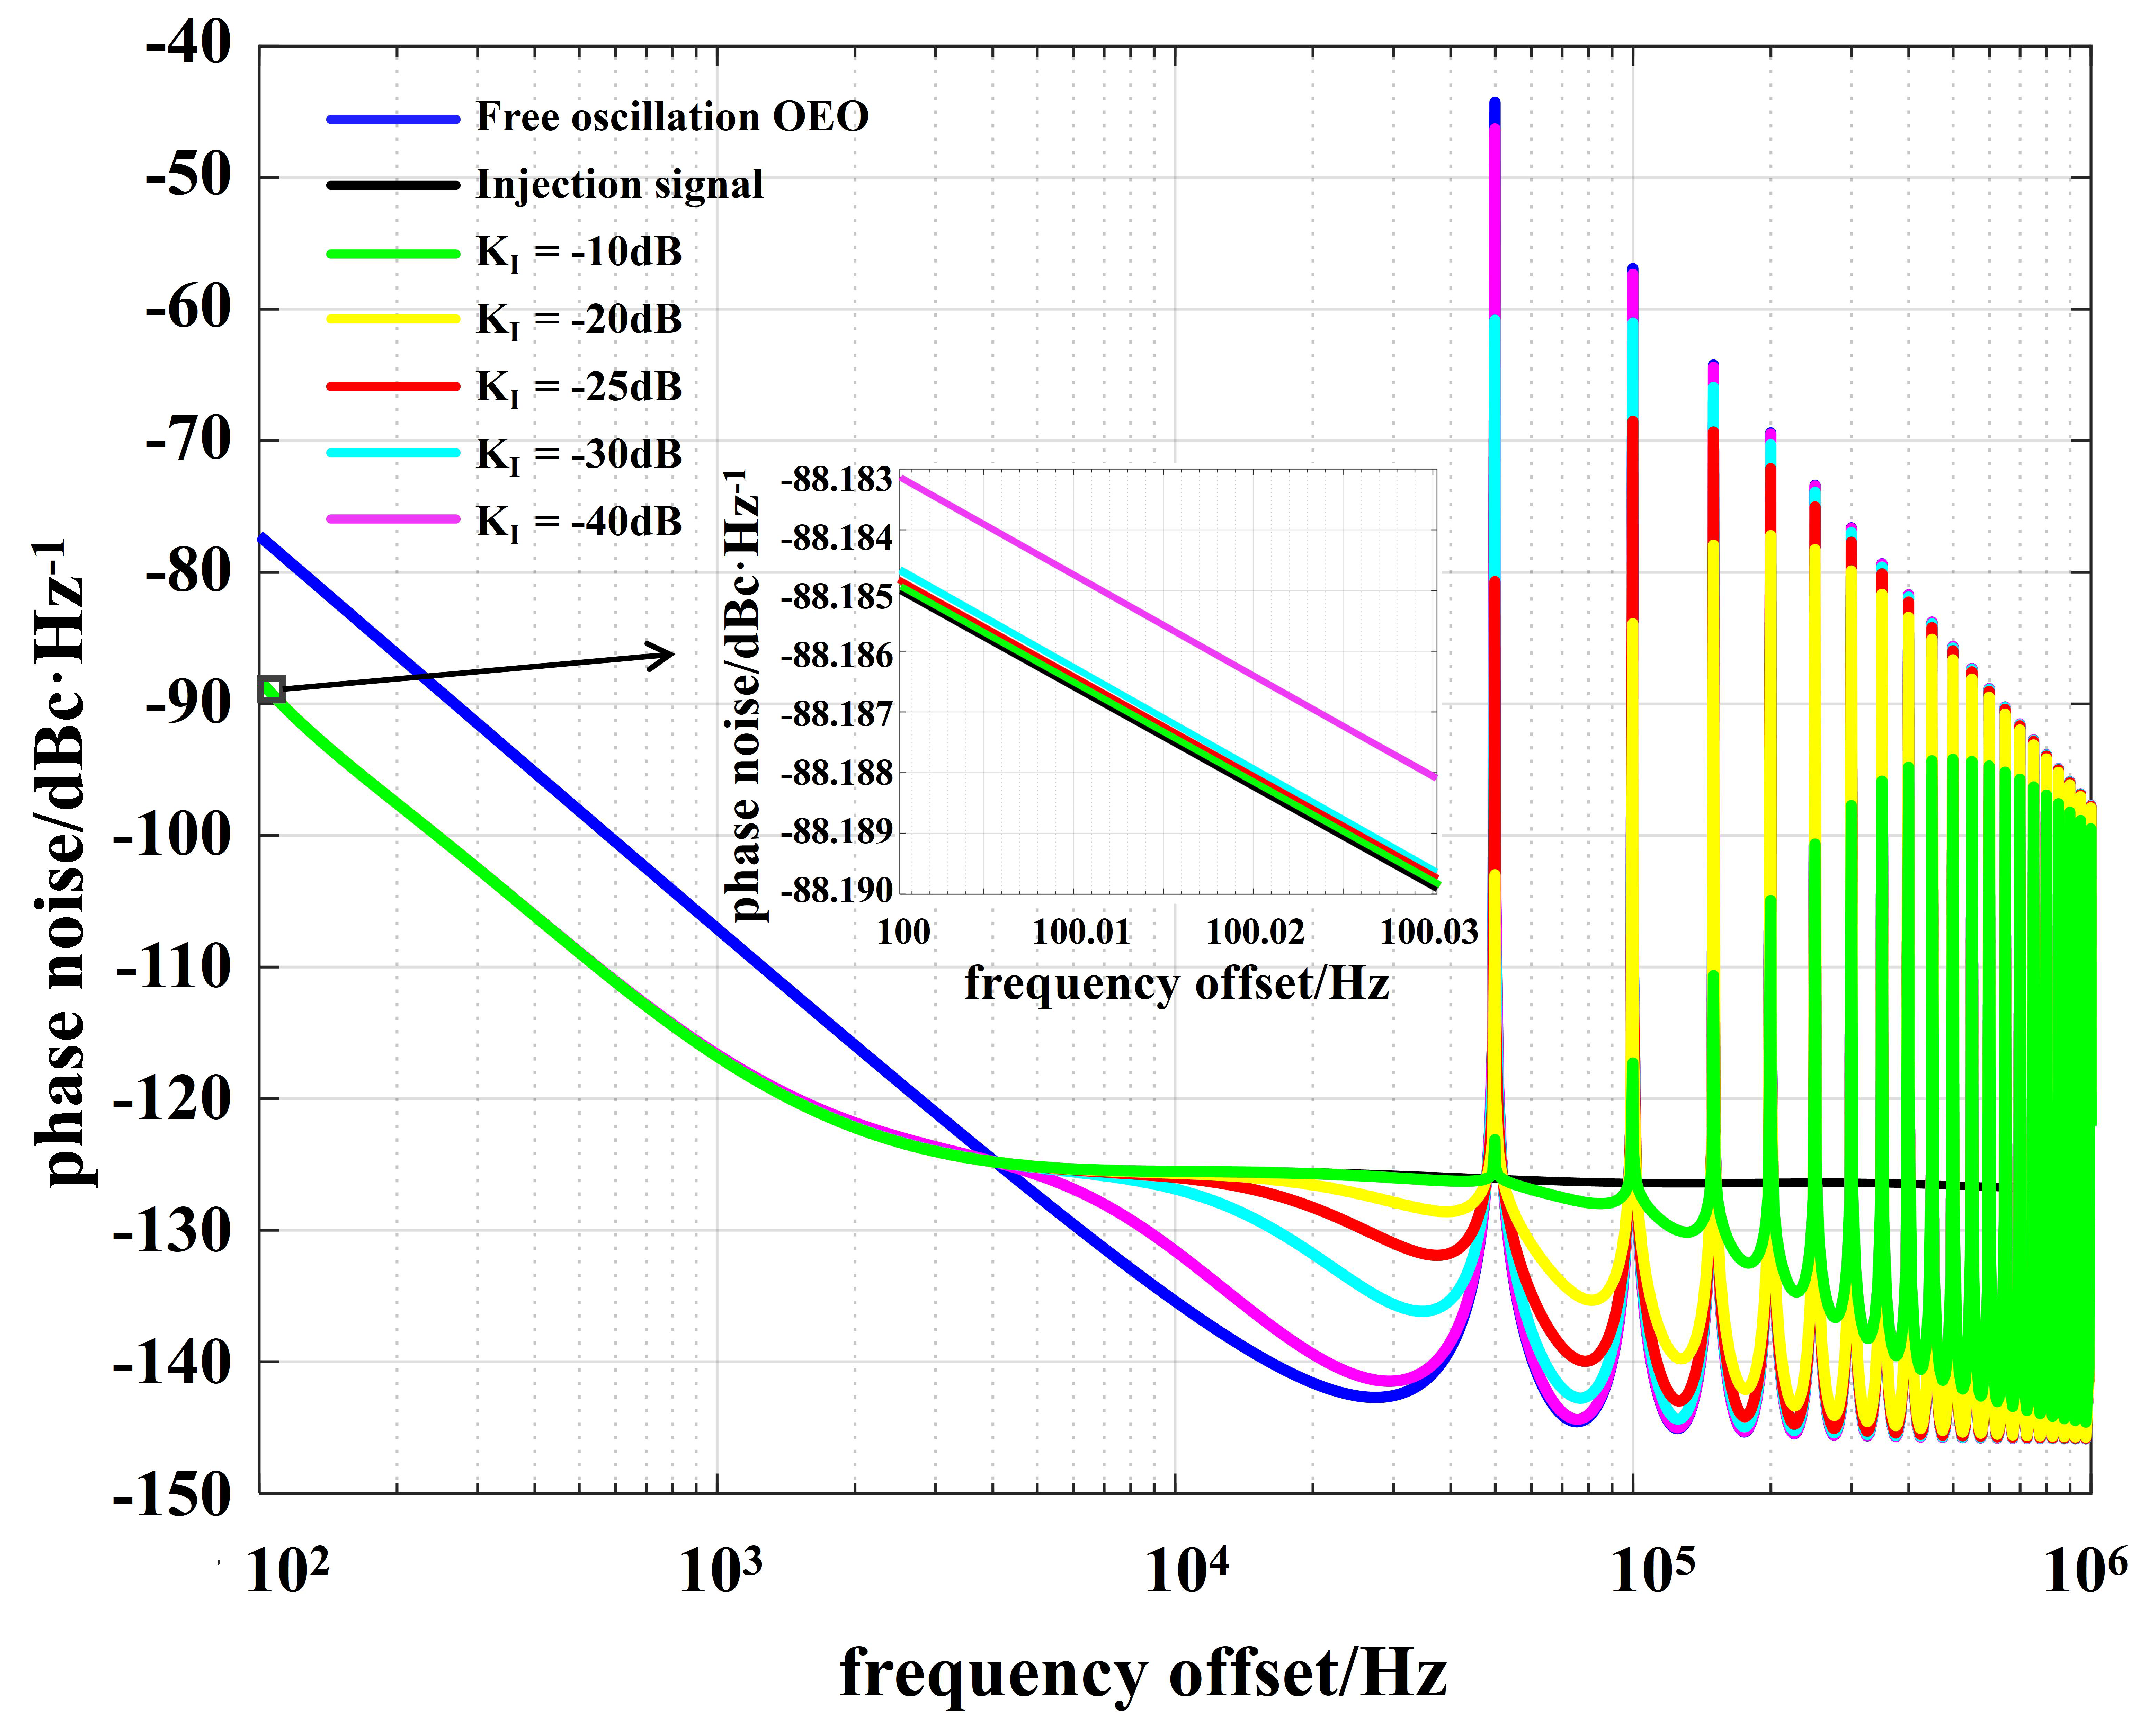
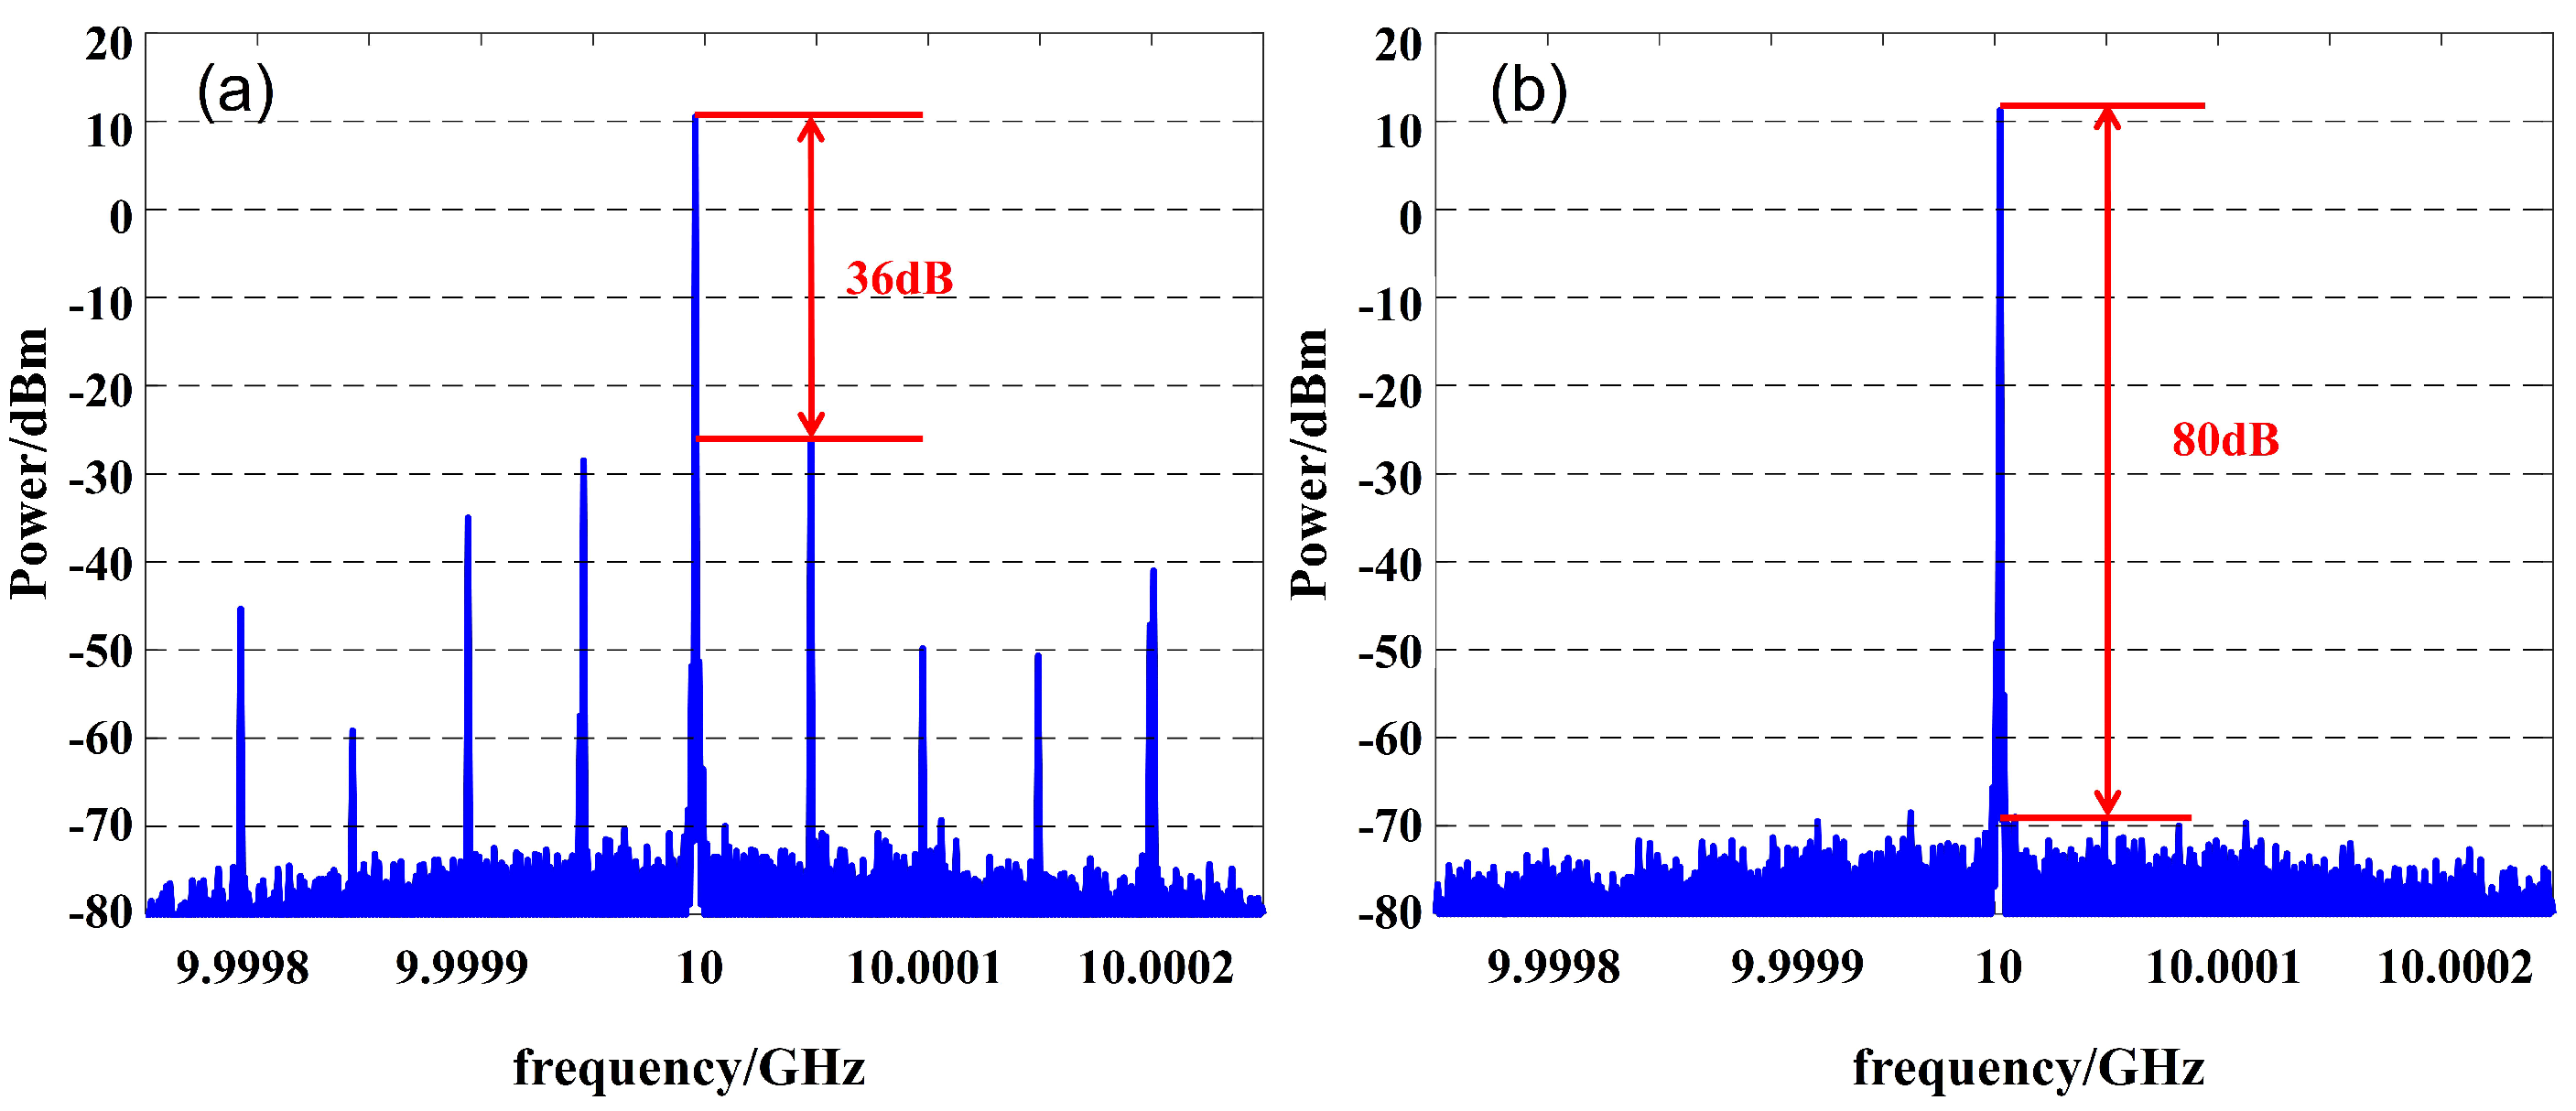
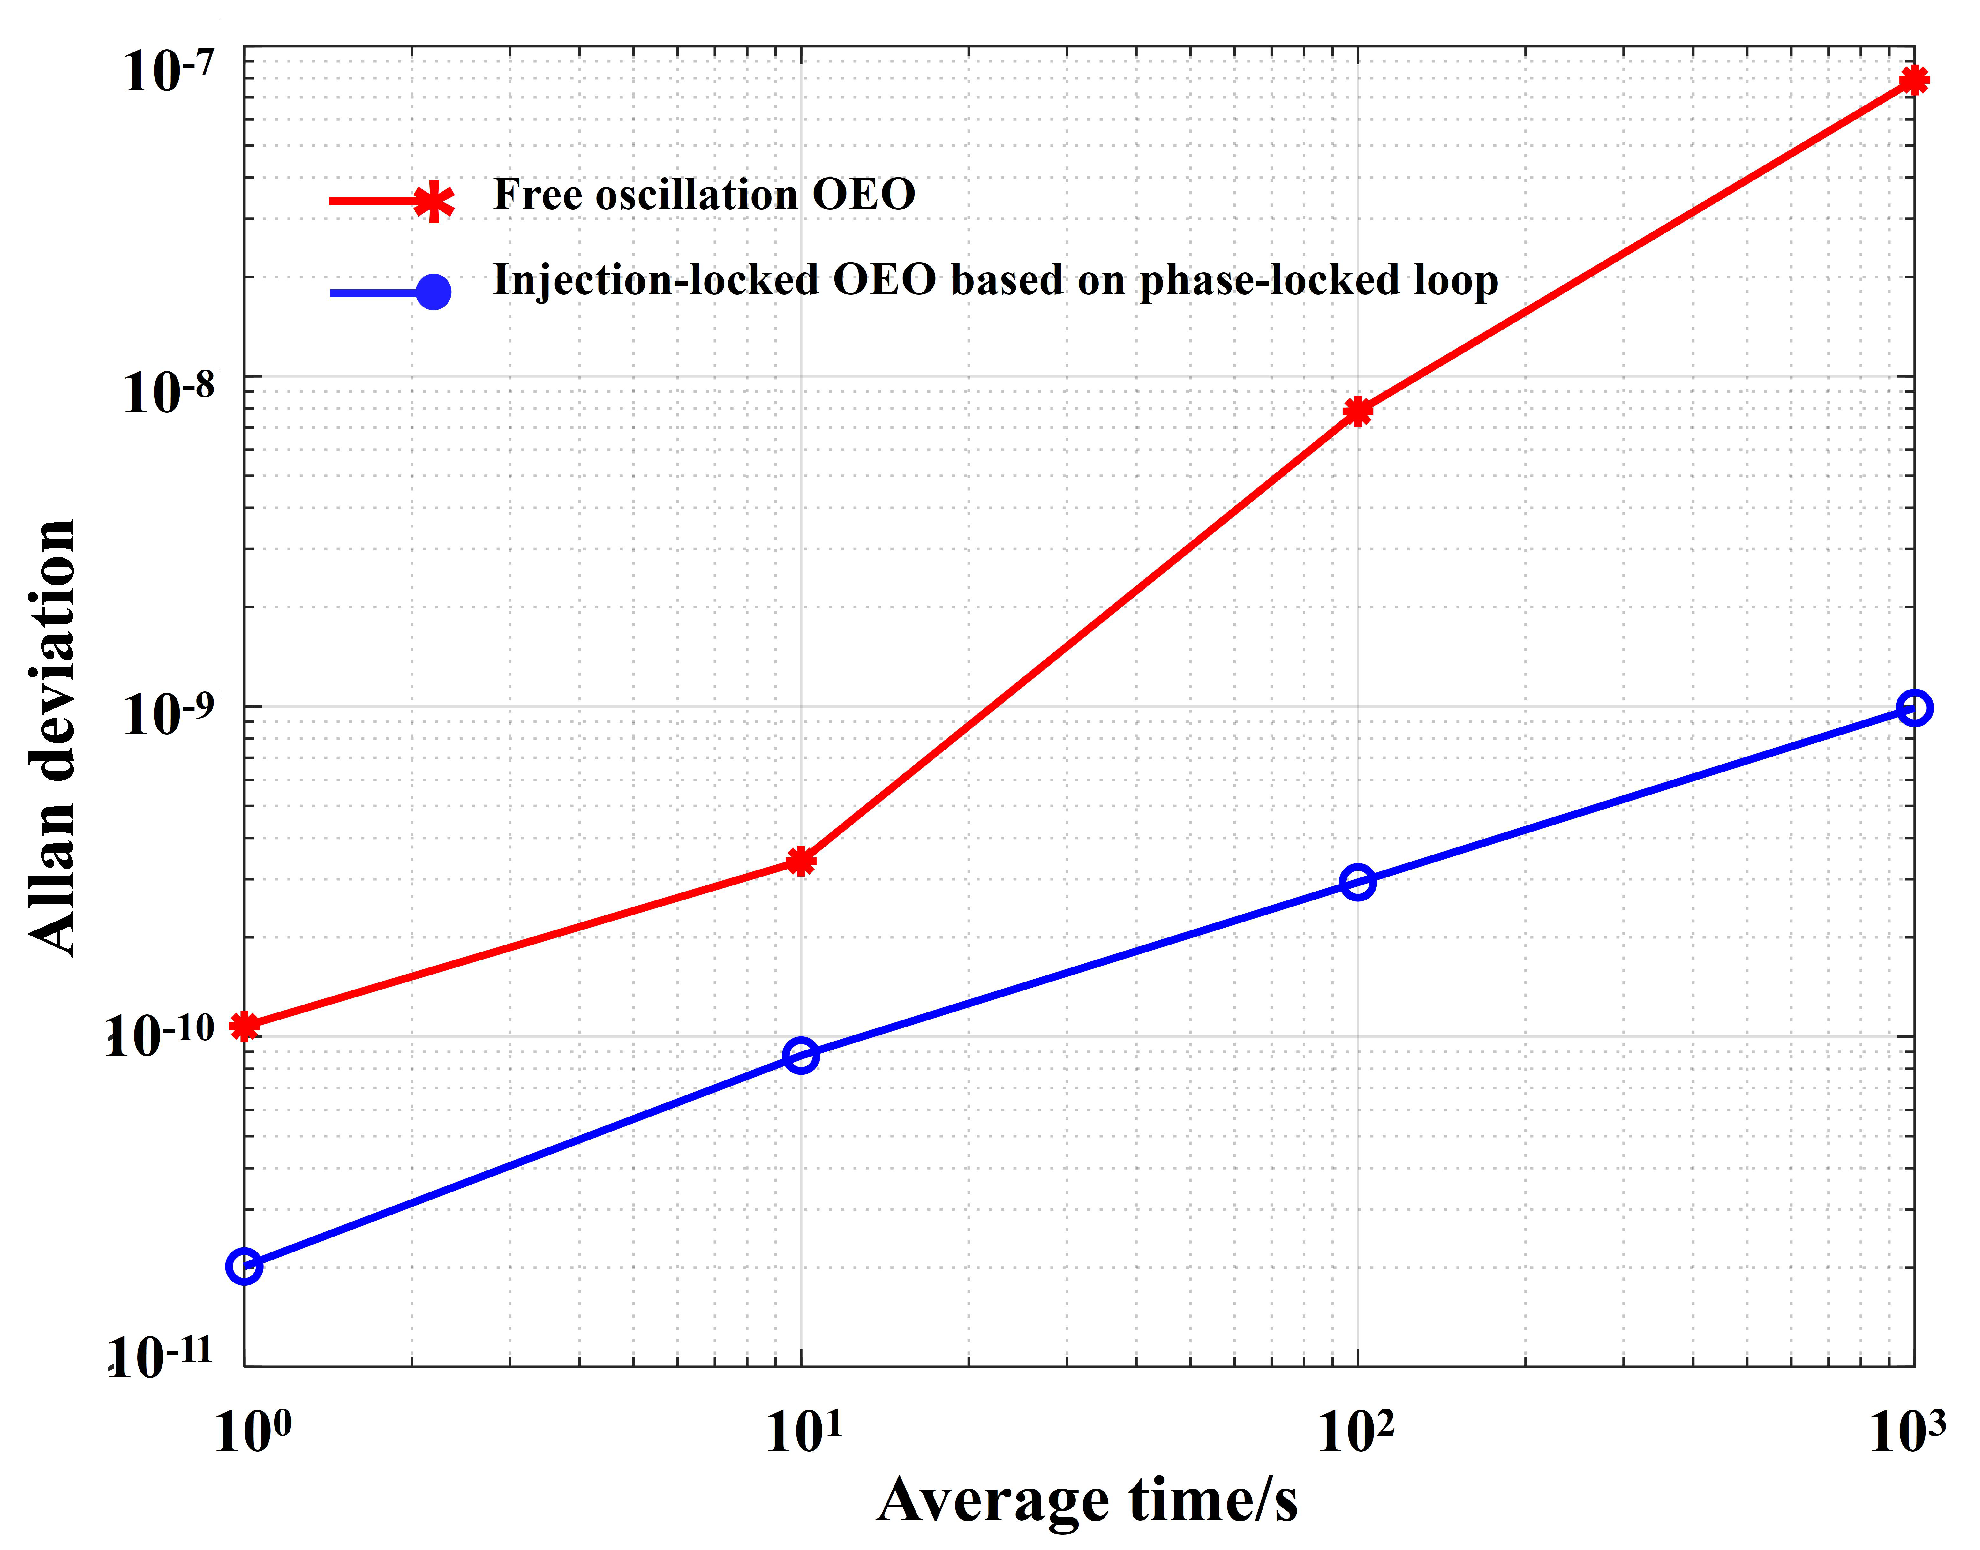
4. Experimental Results

Phase noise is a method to measure the short-term frequency stability of the OEO. A phase noise analyzer (R&S FSWP, Munich, German) is used to measure the phase noise of the OEO. First, we tested the phase noise of the injection-locked OEO. Figure 8a shows the phase noise measurements of the free oscillation OEO, the injection-locked OEO, and the injection signal. The blue and black lines are the results of the free oscillation OEO and injection signal, respectively. The green, yellow, and red lines are the measurement results of the injection-locked OEO, which correspond to the injection amplitude ratios of −10 dB, −20 dB, and −25 dB, respectively. At a frequency offset of 100 Hz, the phase noise is −92.50 dBc/Hz, −86.58 dBc/Hz, and −83.40 dBc/Hz, which correspond to the injection amplitude ratios of −10 dB, −20 dB, and −30 dB, respectively, and the phase noise increases gradually. At a frequency offset of 10kHz, the phase noise is −138.73 dBc/Hz, −143.48 dBc/Hz, and −145.64 dBc/Hz, which correspond to the injection amplitude ratios of −10 dB, −20 dB, and −30 dB, respectively, and the phase noise gradually decreases. With the increase of injected power, the side-mode gradually decreases. This is consistent with the theoretical model.
After the comparison, we used an injection amplitude ratio of −20 dB. Figure 8b shows the phase noise measurements of the free oscillation OEO (red), the injection-locked OEO based on the phase-locked loop (blue), and the injection-locked OEO (green). When the OEO operates in the free oscillation state, the phase noise is high and fluctuates greatly, and the phase noise is −74.31 dBc/Hz, −115.89 dBc/Hz, and −144.94 dBc/Hz at the frequency offset of 100 Hz, 1 kHz, and 10 kHz, respectively. The phase noise of the injection-locked OEO based on the phase-locked loop is significantly reduced, and the phase noise is −89.25 dBc/Hz, −121.71 dBc/Hz, and −145.39 dBc/Hz at the frequency offset of 100 Hz, 1 kHz, and 10 kHz, respectively. The comparison shows that the phase noise performance of the injection-locked OEO based on the phase-locked loop is greatly improved compared with the free oscillation OEO. The phase noise at the frequency offset of 100 Hz, 1 kHz, and 10 kHz can be reduced by 14.94 dB, 5.28 dB, and 0.9 dB, respectively. At the same time, we can see that the injection-locked OEO phase noise is slightly larger than the injection-locked OEO based on the phase-locked loop in the low offset frequency. This is the result of the phase-locked loop action, which corresponds to a response bandwidth of 673 Hz.
The side-mode suppression ratio is the ratio of the power of the OEO’s main oscillation mode to the side-mode. A spectrum analyzer (Agilent8564EC, Santa Clara, USA) is used to measure the side-mode suppression ratio of the free oscillation OEO and the injection-locked OEO based on the phase-locked loop. Figure 9 shows the measurement results of the side mode suppression of the free oscillation OEO and the injection-locked OEO based on the phase-locked loop. As can be seen from the figure, the output power can reach more than 10 dBm in both oscillation modes, and the interval between the main oscillation mode and the side-mode is about 50 kHz. For the OEO in the free oscillation state, the side-mode suppression ratio is 36 dB. For the injection-locked OEO based on the phase-locked loop, the side-mode suppression ratio is 80 dB, which is 44 dB better than that in the free oscillation state. The results show that the injection-locked OEO based on the phase-locked loop can better suppress the side-mode than the free oscillation OEO.
Allan deviation is the parameter that can measure the long-term frequency stability of OEO. A frequency meter (Keysight53230A, Santa Rosa, USA) was used for frequency acquisition. The frequency variations of the free oscillation OEO and injection-locked OEO based on the phase-locked loop were measured over a period of 3 h. Figure 10 shows the Allan deviation of the free oscillation OEO and injection-locked OEO based on the phase-locked loop. The Allan deviation of the free oscillation OEO is 1.14 × 10 10 @1 s, 3.60 × 10 10 @10 s, 8.68 × 10 9 @100 s, and 8.86 × 10 8 @1000 s. The Allan deviation of the injection-locked OEO based on phase-locked loop is 2.06 × 10 11 @1 s, 9.03 × 10 11 @10 s, 1.03 × 10 10 @100 s, and 3.03 × 10 10 @1000 s. The frequency stability of the injection-locked OEO based on the phase-locked loop is much higher than that of the OEO in the free oscillation state. The result can be further improved if the atomic clock will be used to synchronize the MCO.

5. Conclusions

In summary, an OEO with ultra-low phase noise and high stability based on a phase-locked loop and injection locking is proposed in this paper. It utilizes an external injection signal to achieve injection locking and controls the OEO loop through a phase-locked loop. This paper finally obtains a signal with a frequency of 10 GHz, and the phase noise at the frequency offset of 100 Hz, 1 kHz, and 10 kHz is −89.25 dBc/Hz@100 Hz, −121.71 dBc/Hz@1 kHz, and −145.39 dBc/Hz@10 kHz, respectively. The side-mode suppression ratio reaches 80 dB. The frequency stability is 2.06 × 10 11 @1 s, 9.03 × 10 11 @10 s, 1.03 × 10 10 @100 s, and 3.03 × 10 10 @1000 s. In the proposed OEO, the introduced MCO can simultaneously output the 10 GHz injection-locked signal and the 100 MHz phase-locked loop reference signal. This design greatly simplifies the system structure, reduces the cost, and is more forward-looking in the practical application of the OEO.

Author Contributions

Conceptualization, Z.Z. and C.M.; software, Z.Z., J.Y., J.W., C.M., H.L. and X.S.; validation, J.W., Y.G., J.Y. and H.L.; writing—original draft preparation, Z.Z. and C.M.; writing—review and editing, Y.G., J.Y. and J.W.; supervision, J.W., J.Y. and C.M. All authors have read and agreed to the published version of the manuscript.

Funding

This research was supported by the National Natural Science Foundation of China under Grant 62005194.

Institutional Review Board Statement

Not applicable.

Informed Consent Statement

Not applicable.

Data Availability Statement

The original contributions presented in the study are included in the article, further inquiries can be directed to the corresponding author.

Conflicts of Interest

The authors declare no conflicts of interest.

References

  1. Pozar, D.M. Microwave Engineering, 4th ed.; John Wiley& Sons: Hoboken, NJ, USA, 2011; pp. 1–4. [Google Scholar]
  2. Prasad, R. Overview of Wireless Personal Communications: Microwave Perspectives. IEEE Commun. Mag. 1997, 35, 104–108. [Google Scholar] [CrossRef]
  3. Peng, Z.; Li, C. Portable Microwave Radar Systems for Short-Range Localization and Life Tracking: A Review. Sensors 2019, 19, 1136. [Google Scholar] [CrossRef] [PubMed]
  4. Rong, W.B.; Shan, X.R. Influence of Frequency Source Vibration on Velocity Measurement Accuracy. IEEE J. Spacecr. Tt C Technol. 2015, 34, 230–233. [Google Scholar]
  5. Yao, X.S.; Maleki, L. Converting light into spectrally pure microwave oscillation. Opt. Lett. 1996, 21, 483–485. [Google Scholar] [CrossRef]
  6. Yao, X.S.; Maleki, L. Optoelectronic microwave oscillato. J. Opt. Soc. Am. B 1996, 13, 34–35. [Google Scholar]
  7. Yao, X.S.; Maleki, L. Optoelectronic oscillator for photonic systems. IEEE J. Quantum Electron. 1996, 32, 1141–1149. [Google Scholar] [CrossRef]
  8. Chembo, Y.K.; Brunner, D.; Jacquot, M.; Larger, L. Optoelectronic oscillators with time-delayed feedback. Rev. Mod. Phys. 2019, 91, 035006. [Google Scholar] [CrossRef]
  9. Li, M.; Hao, T.; Li, W.; Dai, Y. Tutorial on optoelectronic oscillators. APL Photonics 2021, 6, 061101. [Google Scholar] [CrossRef]
  10. Yao, X.S.; Maleki, L.; Ji, Y.; Lutes, G.; Tu, M. A Dua loop optoelectronic oscillor. In IEEE International Frequency Control Symposium; IEEE: Piscataway, NJ, USA, 1998; pp. 545–549. [Google Scholar]
  11. Guo, T.; Han, Y.; Lu, G.; Qie, T. Frequency model of dual-loop optoelectronic oscillators. In Proceedings of the 2021 China Automation Congress, Beijing, China, 22–24 October 2021; pp. 7725–7728. [Google Scholar]
  12. Kim, J.-Y.; Jo, J.-H.; Choi, W.-Y.; Sung, H.-K. Dual-Loop Dual-Modulation Optoelectronic Oscillators with Highly Suppressed Spurious Tones. IEEE Photonics Technol. Lett. 2012, 24, 706–708. [Google Scholar] [CrossRef]
  13. Yao, X.S.; Maleki, L. Multiloop optoelectronic oscillator. IEEE J. Quantum Electron. 2000, 36, 79–84. [Google Scholar] [CrossRef]
  14. Eliyahu, D.; Sariri, K.; Taylor, J.; Lute, M. Opto-electronic Oscillator with Improved Phase Noise and Frequency Stability. Proc. SPIE 2003, 4998, 139–147. [Google Scholar]
  15. Fleyer, M.; Sherman, A.; Horowitz, M.; Namer, M. Wideband-frequency tunable optoelectronic oscillator based on injection locking to an electronic oscillator. Opt. Lett. 2016, 41, 1993–1996. [Google Scholar] [CrossRef] [PubMed]
  16. Banerjee, A.; Britto, L.A.D.D.; Pacheco, G.M.A. Theoretical and Experimental Study of Injection-Locking and Injection-Pulling for Optoelectronic Oscillators Under Radio Frequency Signal Injection. J. Light. Technol. 2020, 38, 1210–1220. [Google Scholar] [CrossRef]
  17. Fan, Z.; Su, J.; Lin, Y.; Jiang, D.; Chen, Y.; Li, X.; Qiu, Q. Injection locking and pulling phenomena in an optoelectronic oscillator. Opt. Express 2024, 29, 4681–4699. [Google Scholar] [CrossRef]
  18. Lee, K.H.; Kim, J.Y.; Choi, W.Y. Injection-Locked Hybrid Optoelectronic Oscillators for Single-Mode Oscillation. IEEE Photonics Technol. Lett. 2008, 20, 1645–1647. [Google Scholar] [CrossRef]
  19. Lai, T.-H.; Jin, T.; Zhou, J.-H.; Chi, H.; Tong, G.-C.; Zhu, X.; Li, D.; Zuo, L.-L. Improving of Stability of Optoelectronic Oscillator Basedon Self-phase-locked Technique. Acta Photonica Sin. 2018, 47, 27–31. [Google Scholar]
  20. Wang, Y.F.; Yan, J.J. Stability improvement of a dual-loop optoelectronic oscillator based on self-phase locking. Appl. Opt. 2022, 61, 8912–8916. [Google Scholar] [CrossRef]
  21. Peng, H.; Liu, N.; Li, Y.; Xie, X.; Chen, Z. Low Phase Noise and Highly Stable Optoelectronic Oscillator by Using Frequency-Multiplying Phase Locked Loop. In Proceedings of the 2020 Joint Conference of the IEEE International Frequency Control Symposium and International Symposium on Applications of Ferroelectrics, Keystone, CO, USA, 19–23 July 2020; pp. 1–2. [Google Scholar]
  22. Zhang, Y.; Hou, D.; Zhao, J. Long-Term Frequency Stabilization of an Optoelectronic Oscillator Using Phase-Locked Loop. J. Light. Technol. 2014, 32, 2408–2414. [Google Scholar] [CrossRef]
  23. Fu, R.R.; Zhu, Y.H.; Jin, X.F. Frequency stabilization of an optoelectronic oscillator based on phase-locked loop. J. Spacecr. TT&C Technol. 2017, 36, 67–71. [Google Scholar]
  24. Eliyahu, D.; Sariri, K.; Kamran, A.; Tokhmakhian, M. Improving short and long term frequency stability of the opto-electronic oscillator. In Proceedings of the 2002 IEEE International Frequency Control Symposium and PDA Exhibition, New Orleans, LA, USA, 31 May 2002; pp. 580–583. [Google Scholar]
  25. Wang, X.; Yao, X.S. Phase-Locked Opto-Electronic Oscillator (OEO) of Ultralow Phase Noise With Record-Low Allan Deviation of 3.4 × 10⁻¹⁴ at 1 s. IEEE Clarivate Anal. Web Sci. 2023, 71, 5381–5391. [Google Scholar] [CrossRef]
  26. Banerjee, A.; de Britto, L.A.D.; Pacheco, G.M. Analysis of Injection Locking and Pulling in Single-Loop Optoelectronic Oscillator. IEEE Trans. Microw. Theory Tech. 2019, 67, 2087–2094. [Google Scholar] [CrossRef]
  27. Adler, R. A study of locking phenomena in oscillators. Proc. IEEE 1973, 61, 1380–1385. [Google Scholar] [CrossRef]
  28. Hosseini, S.E.; Banai, A. Theoretical investigation of the capture effect in intensity-modulation direct-detection microwave photonic links. Appl. Opt. 2013, 52, 7011–7021. [Google Scholar] [CrossRef] [PubMed]
Figure 1. Schematic diagram of injection-locked OEO based on phase-locked loop (OEO, optoelectronic oscillator; MCO, multiplication crystal oscillator; PLL, phase-locked loop).
Photonics 11 00614 g001
Figure 2. The relationship between injection amplitude ratio and injection-locked range.
Photonics 11 00614 g002
Figure 3. Simulation results of phase noise in free oscillation OEO, injection signal, and injection-locked OEO.
Photonics 11 00614 g003
Figure 4. Schematic diagram of phase-locked loop (MCO, multiplication crystal oscillator; PFD, frequency and phase discriminator; LF, loop filter; OEO, optoelectronic oscillator).
Photonics 11 00614 g004
Figure 5. Schematic diagram of third-order active proportional integral loop filter.
Photonics 11 00614 g005
Figure 6. (a) Closed-loop transfer function H ( s ) . (b) Error transfer function H e ( s ) . Amplitude frequency characteristics simulation results.
Photonics 11 00614 g006
Figure 7. Injection-locked OEO system scheme based on phase-locked loop (MZM, Mach–Zehnder; SMF, single mode fiber; PD, photodetector; EA, electric amplifier; BPF, bandpass filter; PS, phase shifter; EC, electric coupler; MCO, crystal oscillator frequency doubling source; EVOA, electrically adjustable attenuator; PFD, frequency and phase detector; LF, loop filter).
Photonics 11 00614 g007
Figure 8. (a) Phase noise measurements of free oscillation OEO (blue), injection signal (black), and injection-locked OEO with injection amplitude ratios of −10 dB (green), −20 dB (yellow), and −25 dB (red). (b) Phase noise measurements of free oscillation OEO (red), injection-locked OEO with injection amplitude ratios of −20 dB (green), and injection locked OEO with injection amplitude ratios of −20 dB based on phase-locked loop (blue).
Photonics 11 00614 g008
Figure 9. Side-mode suppression measurement results. (a) Free oscillation OEO (b) Injection-locked OEO based on phase-locked loop.
Photonics 11 00614 g009
Figure 10. Measurement results of Allan’s deviation of free oscillation OEO and injection-locked OEO based on the phase-locked loop.
Photonics 11 00614 g010
Disclaimer/Publisher’s Note: The statements, opinions and data contained in all publications are solely those of the individual author(s) and contributor(s) and not of MDPI and/or the editor(s). MDPI and/or the editor(s) disclaim responsibility for any injury to people or property resulting from any ideas, methods, instructions or products referred to in the content.

