Article

Optical and Scintillation Properties of Tb-Doped Gadolinium Pyrosilicate Single Crystals

by
Prom Kantuptim
1,*,
Takumi Kato
2,
Daisuke Nakauchi
2,
Nakarin Pattanaboonmee
1,
Noriaki Kawaguchi
2,
Kenichi Watanabe
3,
Weerapong Chewpraditkul
1 and
Takayuki Yanagida
2
1
Department of Physics, Faculty of Science, King Mongkut University of Technology Thonburi, 126 Pracha Uthit Rd, Bang Mot, Thung Khru, Bangkok 10140, Thailand
2
Division of Materials Science, Graduate School of Science and Technology, Nara Institute of Science and Technology, 8916-5 Takayama, Nara 630-0192, Japan
3
Department of Applied Quantum Physics and Nuclear Engineering, Faculty of Engineering, Kyushu University, 744 Motooka, Nishi, Fukuoka 819-0395, Japan
*
Author to whom correspondence should be addressed.
Photonics 2024, 11(7), 673; https://doi.org/10.3390/photonics11070673
Submission received: 11 June 2024 / Revised: 15 July 2024 / Accepted: 18 July 2024 / Published: 19 July 2024
(This article belongs to the Section Optoelectronics and Optical Materials)

Abstract

:
Gadolinium pyrosilicate (GPS, Gd2Si2O7) single crystals with different doping concentrations of Tb (0.1–2.0 mol%) are successfully fabricated using the floating-zone technique. In this work, the dependence of Tb-doping concentration on the photoluminescence (PL) and scintillation properties of Tb-doped GPS (Tb:GPS) has been investigated. The PL emission contour graph shows multiple emissions, with the strongest emissions at 378 nm for 0.1% and 0.5% Tb-doping and 544 nm for 1.0% and 2.0% Tb-doping, corresponding to Tb3+ 4f-4f transitions. The PL lifetimes of the specimens range from 4.89 to 5.22 ms. The scintillation spectra exhibit comparable wavelength and intensity trends to the PL emission. The scintillation lifetimes of the specimens range from 2.41 to 3.88 ms. The Tb:GPS specimens demonstrate a relatively excessive afterglow level, with Af20 values ranging from 1640 to 7250 ppm and Af40 values ranging from 136 to 362 ppm. Using recently developed pulse height measurement for millisecond decay scintillators, under excitation at 662 keV γ-rays, the 1.0% Tb:GPS specimen exhibits the highest scintillation light yield among all other specimens at 95,600 ph/MeV, making Tb:GPS one of the highest light yield oxide scintillators.

1. Introduction

One of the fascinating sub-categories of luminescent materials is a scintillator, which is capable of converting high-energy particulate and nonparticulate radiation into lower energy electromagnetic waves, including ultraviolet, visible, and infrared light [1,2]. Due to this special ability, a combination of scintillators and amplified photodiodes, known as scintillation detectors, is widely used in numerous specialized fields involving radiation detection. These fields include medical imaging [3,4,5], astrophysics [6,7], geophysics [8], environmental observation [9], homeland security [10], and natural resource exploration [11,12]. Scintillator materials come in a variety of forms to meet the specific demands of each application, such as single crystals [13,14], polymers [15], glass [16,17], transparent ceramics [18,19], and composites [20,21]. Today, lanthanide-doped single crystals are a primary focus for scintillators in both academic and commercial settings due to their appealing scintillation properties and advantageous physical properties, including relative consistency of performance over time, high chemical durability, and low hygroscopicity [22,23].
The research on a combination of lanthanide ions as a luminescence center and oxide crystals is highly anticipated. In some specific applications, namely flat-panel detectors for X-ray radiography, a high light yield is needed. Lanthanide ions such as Tb3+ and Dy3+ are typically selected as the luminescence center in this particular application. Nevertheless, the method for measuring scintillation light yield via the pulse height approach has historically been confined to scintillators with decay times in the microsecond range. Recently, Tb-doped Sr2Gd8(SiO4)6O2 (SrGS) achieved a significant breakthrough as the first millisecond decay time scintillator to have its scintillation light yield measured using a newly developed system [24]. For the host crystal, the pyrosilicate (X2Si2O7) has been selected. This compound is known for its remarkable scintillation properties, including a high light yield of 26,300 ph/MeV and a fast decay time of 38 ns in Ce-doped Lu2Si2O7 (LPS). Since its introduction, research on pyrosilicate crystals has spurred interest in developing new oxide scintillators using pyrosilicate crystals. This includes modifications in the pyrosilicate structure, exemplified by Pr-doped Y2Si2O7 (YPS) and Tm-doped La2Si2O7 (LaPS) [25,26]. In our recent study, a series of LaPS, LPS, YPS, and Gd2Si2O7 (GPS) with 1.0% Tb-doping have been investigated. The report presents Tb-doped GPS (Tb:GPS) as the most suitable combination for a scintillator among all other pyrosilicates, presenting a scintillation light yield of 95,600 ph/MeV [27].
Based on these recent updates, the study of Tb-doping concentration dependence on Tb:GPS is essential for determining the optimal concentration for this promising material. This report seeks to be the first to explore the effects of Tb-doping concentration on the physical, photoluminescence (PL), and scintillation properties, incorporating the newly developed pulse height measurement for millisecond decay time scintillators. Furthermore, it examines the potential, patterns, and prospective uses of these materials.

2. Materials and Methods

The GPS single crystals, 0.1, 0.5, 1.0, and 2.0 mol% Tb-doping, were synthesized and characterized as follows. For the specimen synthesis, powders of Gd2O3, Tb4O7, and SiO2 of 99.99% purity were thoroughly blended using a mineral mortar. Afterward, the blended powders were placed in a flexible mold for rod shaping using a uniform pressure press. After the shaping process, the sintering process of the specimen rods took 10 h at 1400 °C. With the sintered specimens, the single crystal growth process was achieved using a tabletop floating-zone furnace (FZD0192, Canon Machinery, Shiga, Japan) with two halogen lamps as a heat source. The specimens were crystal-grown at the rate of 4.5 mm/h. Finally, the single crystal rods were cut and polished, with a controlled thickness of 1 mm.
To characterize the phase composition of the grown crystals, the unpolished crystal specimens were ground into a fine homogeneous powder for X-ray diffraction (XRD) measurement. The characteristic structures of each specimen were analyzed by an X-ray diffractometer (MiniFlex600, Rigaku, Tokyo, Japan), with COD No. 9011106 (Gd2Si2O7) serving as the reference. The transmittance spectra were measured using a spectrophotometer (U-2900, Hitachi High-Tech, Tokyo, Japan). Photoluminescence (PL) properties were investigated through the Quantaurus-QY (C11347-01, Hamamatsu Photonics, Shizuoka, Japan), including the study of PL emission/excitation maps and PL Quantum Yield (QY). The excitation and observation wavelengths were set at 250–400 nm and 300–700 nm, respectively. Furthermore, PL decay time analysis was accomplished by using the Quantaurus-τ (C11367, Hamamatsu Photonics, Shizuoka, Japan), with excitation at 265 nm and monitoring at 550 nm. All the scintillation properties were evaluated using the in-house system. Scintillation spectra under 1.2 Gy X-ray exposure were recorded, and photons emitted from the specimen were delivered to a charge-coupled device (CCD) camera through an optical fiber. To minimize thermal background noise, the CCD’s temperature was lowered to −75 °C by a thermoelectric module [28]. Additionally, the scintillation decay time and afterglow signal were measured using a system equipped with a pulsed X-ray source, with an observation spectral range of 160−650 nm over a 20 ms time range [29]. The calculation of the afterglow level aligned with the methodologies described in our previous studies, as indicated by the following equation [30]: Af20 = (I20Ibg)/Imax, where Af20 represents the afterglow level at 20 ms after the X-ray irradiation. Here, I20 represents the signal intensity at 20 ms after the X-ray exposure stopped, Ibg refers to the signal intensity before the X-ray exposure started, and Imax is the signal intensity during the X-ray exposure. The same calculation and explanation were also applied for Af40.
The scintillation light yield was determined using the ms decay time pulse height system recently developed, as referenced in [24]. It should be noted that the system output technically represents the pulse area rather than the pulse height of the scintillation pulse. However, for simplicity and to maintain consistency with conventional terms, the term “pulse height” is used in this study. In this setup, polytetrafluoroethylene (Teflon) tape was use as the reflector. The photomultiplier tube (PMT R7600U-200, Hamamatsu Photonics) with a bias of −550 V provided a signal to the analog-to-digital converter (1819-16, Clear-Pulse, Tokyo, Japan). 137Cs was chosen as the γ-ray source with 662 keV. Furthermore, calculation of the light yield was undertaken using a reference bismuth germanate Bi4Ge3O12 (BGO) scintillator with a dimension of 5 × 5 × 5 mm3 obtained by the Czochralski method and having a scintillation light yield of 8200 photons/MeV [31].

3. Results and Discussions

3.1. Physical Properties
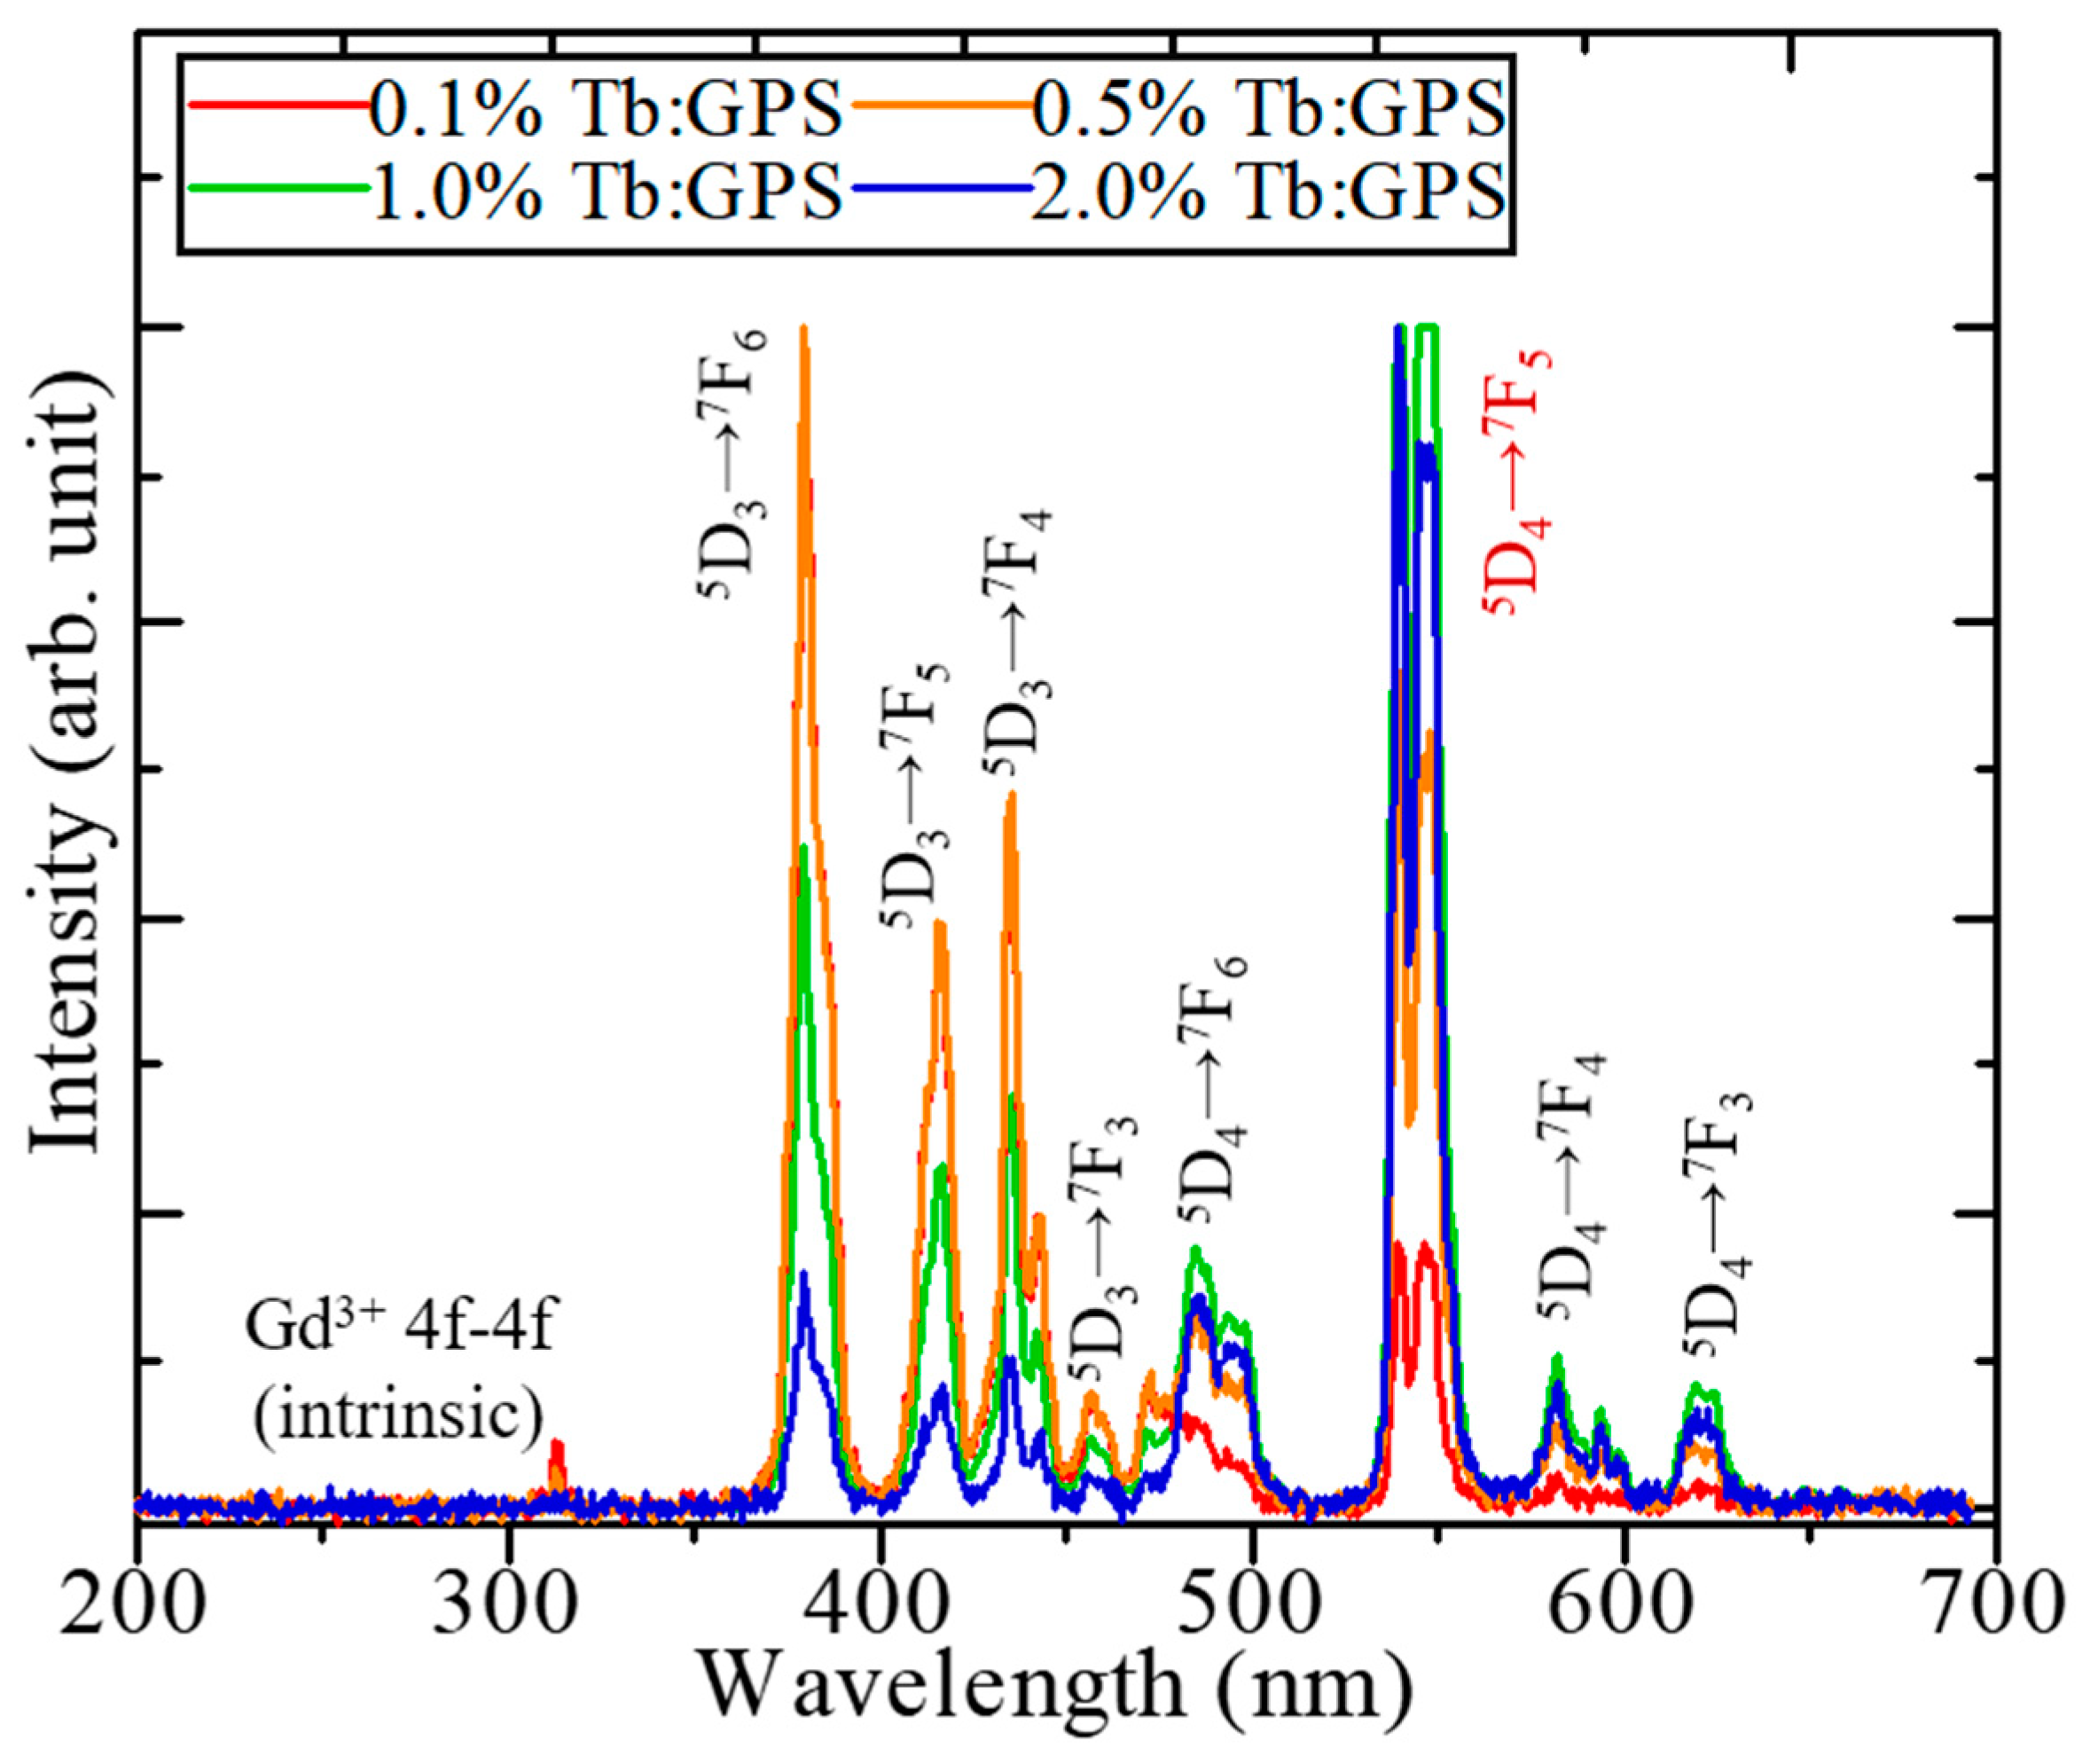
Figure 1A displays the photograph of a 1.0% Tb:GPS single crystal ingot before the cutting process. The obtained crystal ingots have lengths between 25 and 30 mm and diameters of approximately 4 mm. Noticeable fractures are present across the entire length of each crystal rod. These fractures are consistent with previous attempts to grow a crystal of a pyrosilicate compound using the same technique [32]. After cutting and polishing, all the specimens present a colorless and highly transparent appearance regardless of Tb-doping concentration, as presented in Figure 1B, unlike the specimen luminescence colors under 254 UV irradiation in Figure 1C. The Tb:GPS specimens have a bright blue luminescence at a low Tb-doping concentration (0.1%) and gradually develop a bright green luminescence as the Tb-doping concentration rises (2.0%).
The XRD patterns of powdered Tb:GPS specimens together with a reference pattern of pure GPS (COD 9011106) are presented in Figure 2. In comparison, the specimen’s XRD patterns show similar peaks to the reference pattern of the undoped GPS, which implies a single phase of GPS crystals without adulteration, within the XRD machine’s limitations.
The transmittance spectra of Tb:GPS specimens are illustrated in Figure 3. The strong absorption band centered around 220 nm comes from the spin-allowed 4f-5d transition of Tb3+. Two additional absorption lines at 272 and 312 nm, clearly observed in 1.0 and 2.0% specimens, are due to the 8S7/26IJ and 8S7/26PJ transitions of Gd3+, respectively. More importantly, all specimens exhibit high transparency around or exceeding 80% in the emission spectral range of 380–600 nm (see below).

3.2. PL Propterties

The PL emission contour graph of Tb:GPS specimens is presented in Figure 4. This measurement has emission and excitation ranges of 300–700 and 250–400 nm, respectively. Almost identical emission wavelengths from Tb3+ 4f-4f transitions are present in all specimens. The details of each emission origin will be discussed in connection with the scintillation spectra. One of the main points of interest of this measurement is the gradual shift of the peak intensity emission from 378 to 544 nm. This phenomenon is the result of 5D35D4 cross-relaxation, which is generally found in a Tb-doping concentration dependence study [33,34]. This also explains why Tb:GPS specimens under the same 254 nm UV irradiation have different luminescence colors. The PL QY of the specimens increases as the Tb-doping concentration rises to 22.7, 38.7, 68.9, and 83.9% for the 0.1, 0.5, 1.0, and 2.0% Tb-doped specimens.
The PL lifetime profiles of Tb:GPS specimens is exhibited in Figure 5. To focus on the main 5D47F5 emission transition of Tb3+ at 544 nm, this measurement uses the excitation and observation wavelength of 265 and 550 nm, respectively, according to the previous PL emission results. It is crucial to note that all specimens exhibit rise time characteristics in the initial decay part of the profiles originating from the 5D4 level. This should be related to the above-mentioned cross-relaxation process between closely lying Tb3+ pairs (the donor Tb3+ ion transits from 5D3 to 5D4, whilst the acceptor ion transits from 7F6 to 7F0) [35]. The PL decay profiles, excluding the rise time in the initial parts, can be well fitted by an exponential decay function, as depicted under the names of each specimen. The PL decay constants for 0.1, 0.5, 1.0, and 2.0% Tb:GPS specimens are 5.22, 5.05, 4.95, and 4.89 ms, respectively. These results align with prior research on Tb-doped scintillator materials [36]. However, a decreasing trend in the decay time constant at higher Tb-doping concentrations is observed, a phenomenon that could be influenced by concentration quenching. The identical trends in decay time reduction are also noted in published articles examining concentration dependence in inorganic scintillators [37,38].

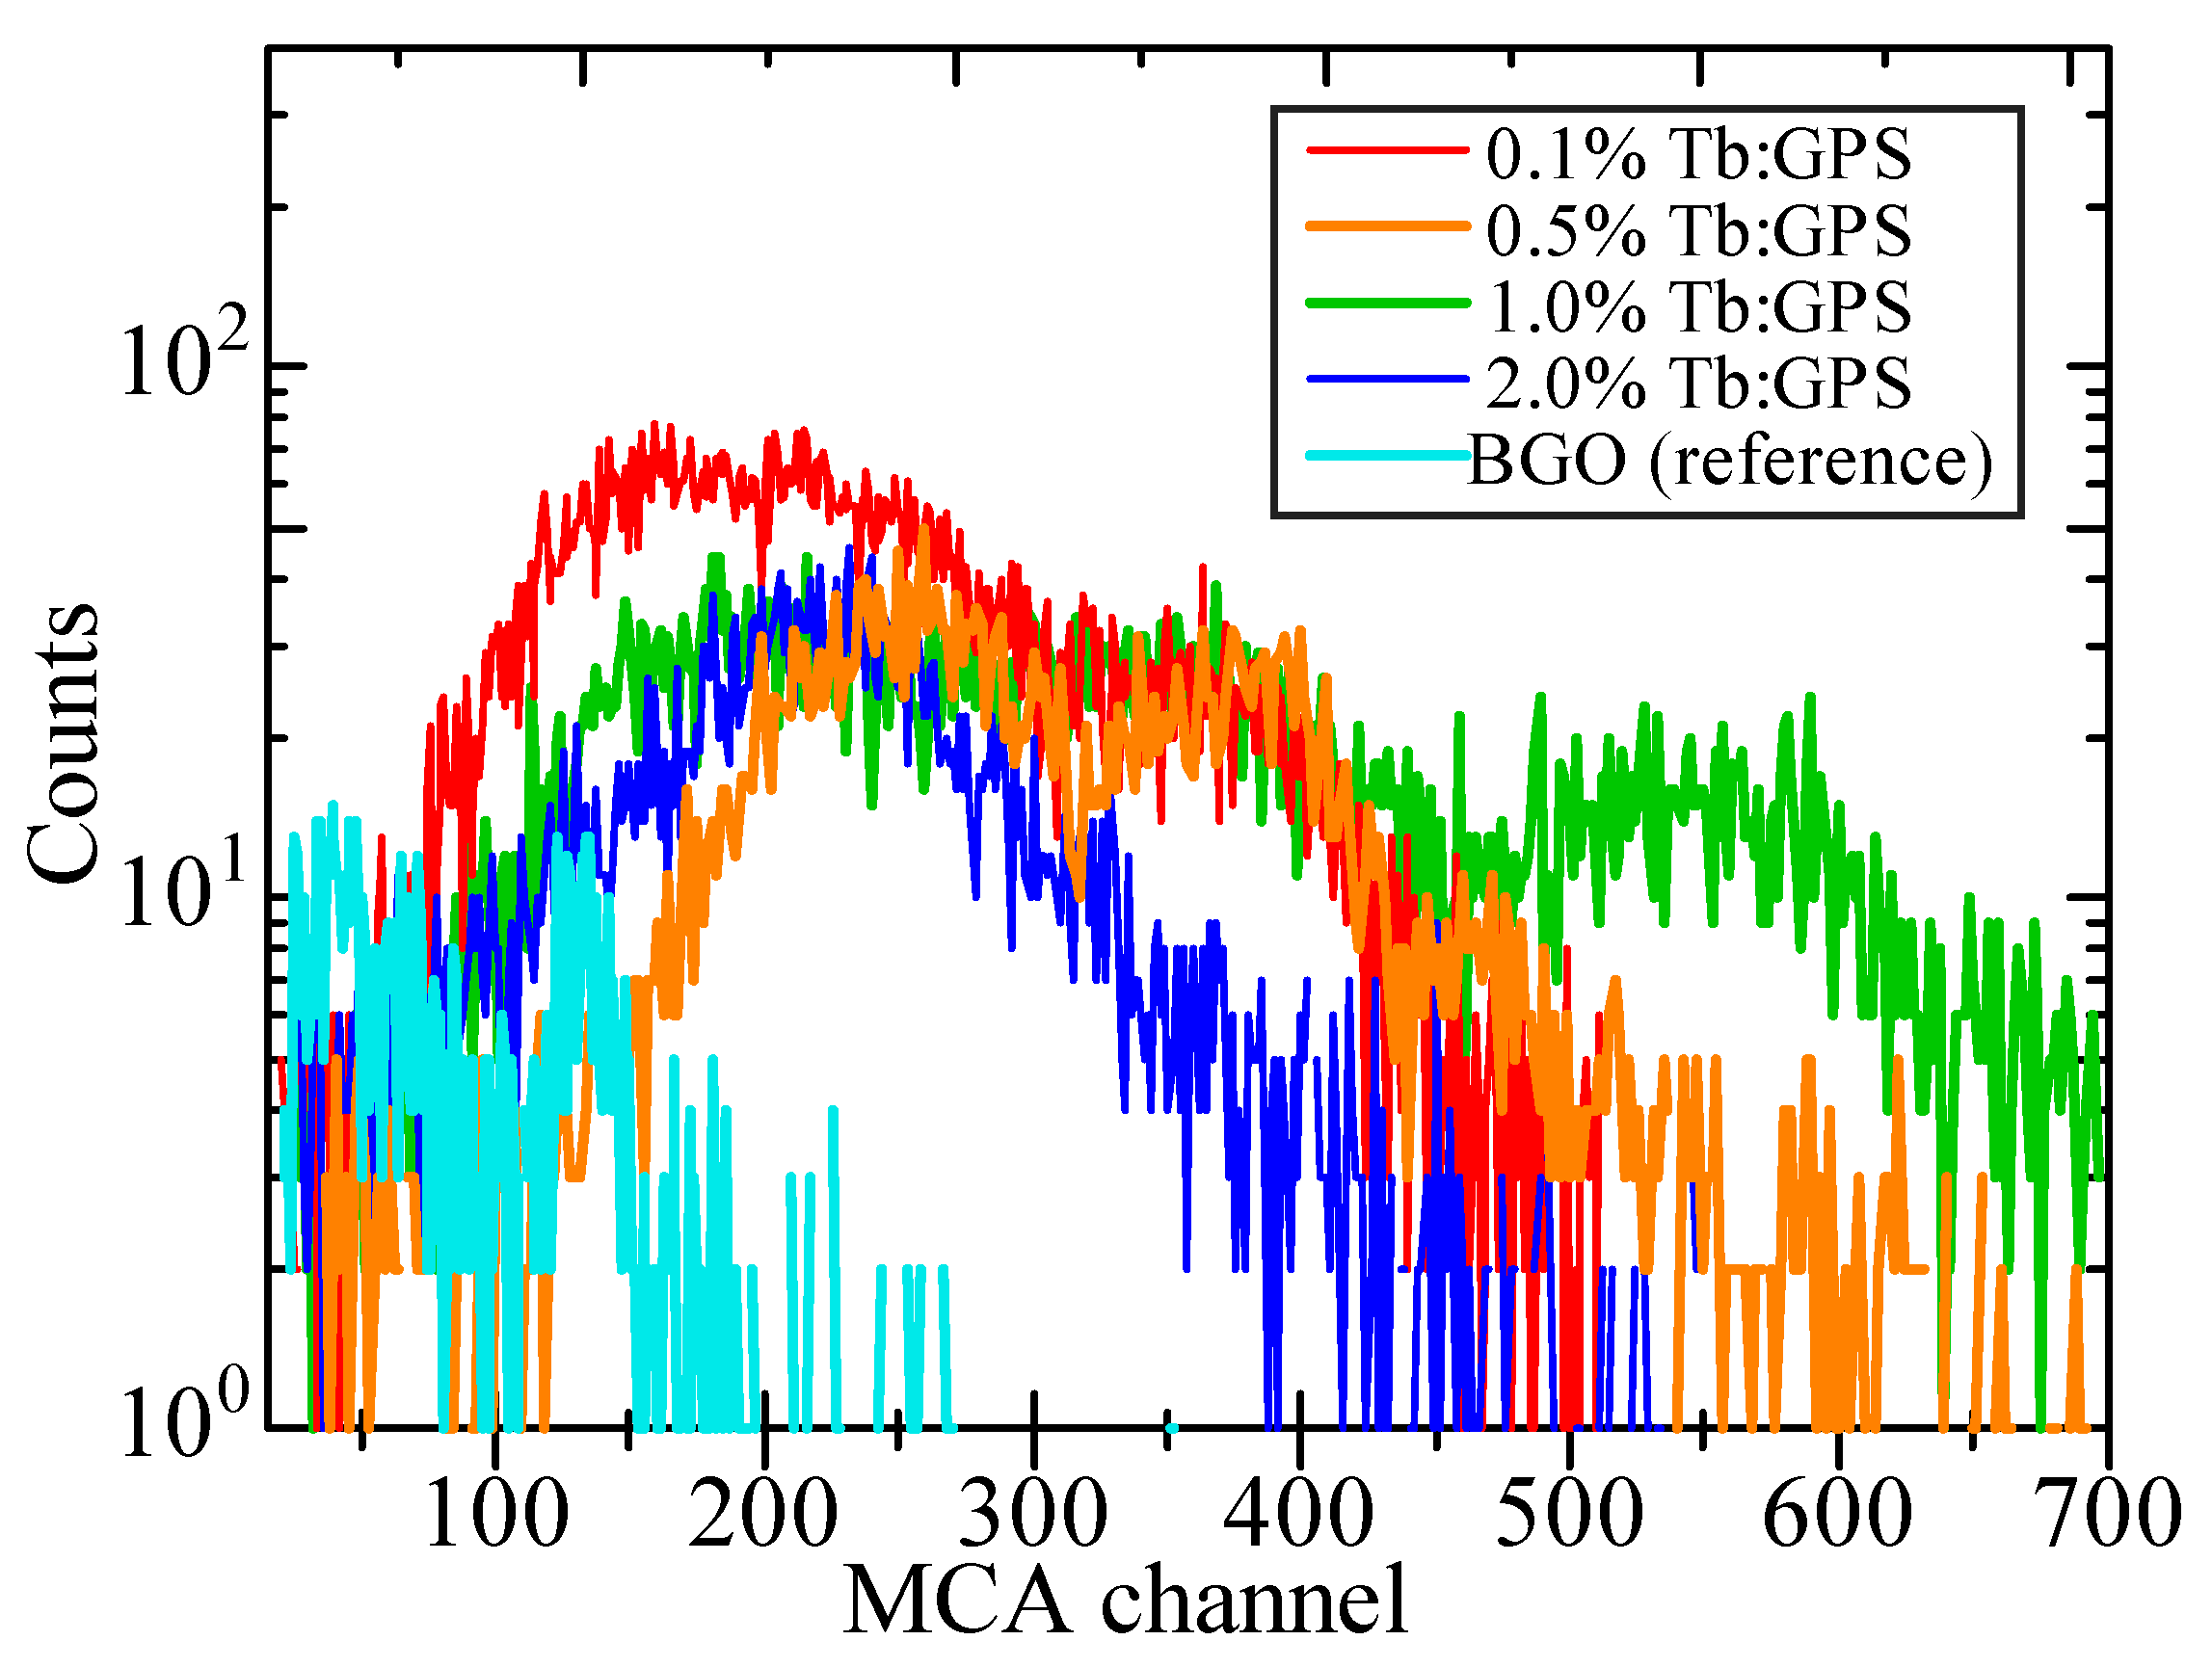
3.3. Scintillation Properties

The X-ray-induced scintillation spectra of Tb:GPS specimens are displayed in Figure 6. The vertical axis (intensity) represents the qualitative value of this measurement. All specimens exhibit nearly identical spectral wavelengths. Additionally, the scintillation wavelengths are also nearly identical to the PL emission wavelengths (Figure 4), alongside intensity shifts due to 5D35D4 cross-relaxation. In sum, the scintillation from Tb3+ 4f-4f transitions, including 378 (5D37F6), 420 (5D37F5), 440 (5D37F5), 489 (5D47F6), 544 (5D47F5, strongest), 586 (5D47F4), and 622 nm (5D47F3), is found in all specimens. Besides the Tb3+ 4f-4f transitions, the scintillation from the intrinsic Gd3+ 4f-4f transition at 312 nm (8S7/26P7/2) is uniquely observed in the 0.1% Tb-doped specimen due to the relatively low Tb-doping concentration [39]. Overall, the scintillation spectrum of Tb:GPS resembles the other Tb-activated scintillators [40].
The X-ray-induced scintillation lifetime profiles of the Tb:GPS specimens, which are fitted by a double exponential function, are exhibited in Figure 7. The first decay constant in all specimens is affected by IRF, which potentially distorts the initial segment of the decay. Conversely, the second decay constant is attributed to scintillation from the Tb3+ 4f-4f transitions. The scintillation decay constants for 0.1, 0.5, 1.0, and 2.0% Tb:GPS specimens are 2.40, 2.63, 3.22, and 3.88 ms, respectively. Compared to the previous PL decay time results, each specimen exhibits a faster scintillation decay time [41]. The shortening of scintillation decay time is possibly due to the limitation in emission range of this measurement, spanning 350–650 nm, which encompasses more emissions than just the 550 nm emission observed in PL decay time measurements.
The afterglow profiles of Tb:GPS specimens are displayed in Figure 8, with Af20 and Af40 values detailed in Table 1. Compared to commercial scintillators, Tb:GPS specimens exhibit significantly higher Af20 values than CdWO4 (CWO) and Tl-doped CsI, which have Af20 values of approximately 100 and 268 ppm, respectively [42,43]. Notably, the Af40 value (measured at 40 ms after the exposure cut-off) of the Tb:GPS specimens is comparable to the Af20 value of these commercial scintillators. As an illustration, Tb:GPS takes twice as long as commercial scintillators to reduce the afterglow to the same level. The elevated afterglow levels in Tb:GPS specimens are primarily attributed to their slow scintillation decay time in the millisecond range.
The 662 keV (137Cs) γ-ray pulse height spectra of Tb:GPS specimens and a BGO reference are presented in Figure 9. To calculate the scintillation light yield, the different quantum efficiencies of the PMT at the wavelength of maximum scintillation intensity for Tb:GPS specimens are considered: 0.1% and 0.5% Tb:GPS (378 nm, 40%), 1.0% and 2.0% Tb:GPS (544 nm, 9%), and the BGO reference (480 nm, 25%). Table 1 collects the scintillation light yield values for all Tb:GPS specimens. In this study, the 1.0% Tb:GPS showed the highest scintillation light yield of 95,600 ph/MeV among all the Tb:GPS specimens. From this result, a Tb concentration of 1.0% is the most suitable for this Tb:GPS scintillator. Two reasons support this statement. Firstly, concentration quenching of the 2.0% Tb-doped specimen can be observed by a reduction in scintillation light yield when compared with the 1.0% Tb-doped specimen. Secondly, the advantage of 5D35D4 cross-relaxation shifts the wavelength of maximum scintillation light from 378 nm in 0.1 and 0.5 Tb-doped specimens to 544 nm in the 1.0% Tb-doped specimen. The obtained light yield value is significantly higher than those previously investigated for Tb-doped SrGS (23,000 ph/MeV) [44] and even surpasses some of the most common scintillators, such as CdWO4 (28,000 ph/MeV) [31] and Tl-doped NaI (40,000 ph/MeV) [12].
In future work, it is recommended to improve the crystal quality by adopting a more refined crystal growth method, such as the Czochralski method, to enhance energy resolution. Improvements in scintillation decay time and afterglow are highly interesting for mitigating the main weakness of this compound. In a recent study [45], co-doping with a trace amount of Mg2+ or Ca2+ in Ce-doped LPS can shorten the scintillation decay time by eliminating shallow electron traps. A similar hypothesis is also possible for Tb:GPS development.

4. Conclusions

Single crystals of 0.1, 0.5, 1.0, and 2.0% Tb:GPS are successfully fabricated by a dual halogen lamp floating-zone furnace. The single phase of GPS is validated by XRD analysis. The photoluminescence (PL) characteristics are examined, showing multiple emissions with the strongest emissions at 378 nm (for 0.1% and 0.5%) and 544 nm (for 1.0% and 2.0%) due to Tb3+ 4f-4f transitions on PL emission contour graphs. PL decay times of the specimens range from 4.89 to 5.22 ms. Regarding scintillation properties, the X-ray-induced scintillation spectra of the samples exhibit similar peaks and intensity patterns to the PL emission. The scintillation decay times of the samples range from 2.41 to 3.88 ms. Tb:GPS shows a high afterglow level (Af20) of approximately 1640–7250 ppm. Tb:GPS takes twice as long as CdWO4 to reduce the afterglow to the same level (CdWO4’s Af20 = Tb:GPS’s Af40). Under 662 keV γ-ray excitation, the 1.0% Tb:GPS specimen exhibits the highest scintillation light yield among all studied specimens at 95,600 ph/MeV, granting Tb:GPS one of the highest light yields in oxide scintillators.
Overall, 1.0% Tb:GPS is a suitable candidate for a novel high-light-yield oxide scintillator. However, due to the decay time in the millisecond range, the potential applications of Tb-doped pyrosilicate are limited to those that prioritize brightness over response time or to integrated-type scintillation detectors, such as flat-panel detectors for X-ray radiography. Tb:GPS clearly demonstrates an advantage over CsI:Tl, the conventional crystal scintillators for X-ray radiography, in terms of hygroscopicity. On the other hand, a direct light yield comparison between Tb:GPS and CsI:Tl remains an intriguing topic for future research, primarily because the light yield evaluation system for scintillators with millisecond decay times is still relatively new.

Author Contributions

Conceptualization, P.K. and T.Y.; methodology, P.K., K.W. and T.Y.; validation, N.P., T.K., D.N. and N.K.; formal analysis, P.K. and T.Y.; investigation, P.K., K.W. and T.Y.; resources, K.W. and T.Y.; data curation, P.K. and N.K.; writing—original draft preparation, P.K.; writing—review and editing, P.K., W.C. and T.Y.; visualization, P.K.; supervision, T.Y. and W.C.; funding acquisition, P.K., W.C., N.P., N.K. and T.Y. All authors have read and agreed to the published version of the manuscript.

Funding

This work was supported by King Mongkut’s University of Technology Thonburi’s Postdoctoral Fellowship (Project ID 27858) and the Fundamental Research Fund of Thailand Science Research and Innovation (Project No. FRB660073/0164) of King Mongkut’s University of Technology Thonburi.

Institutional Review Board Statement

Not applicable.

Informed Consent Statement

Not applicable.

Data Availability Statement

Data for the results presented in this article are not publicly available.

Acknowledgments

This work was supported by King Mongkut’s University of Technology Thonburi’s Postdoctoral Fellowship. The Radiation Physics and Measurement Laboratory, Department of Applied Quantum Physics and Nuclear Engineering in the Faculty of Engineering at Kyushu University is acknowledged for providing the pulse area experimental equipment and related data curation. This acknowledgment is extended to the Applied Quantum Physics Laboratory, Division of Materials Science at Nara Institute of Science and Technology and the Faculty of Science and Technology at Muban Chombueng Rajabhat University for materials synthesis and equipment.

Conflicts of Interest

The authors declare no conflicts of interest.

References

  1. Dorenbos, P. The quest for high resolution γ-ray scintillators. Opt. Mater. X 2019, 1, 100021. [Google Scholar] [CrossRef]
  2. Van Eijk, C.W.E. Inorganic-scintillator development. Nucl. Instrum. Methods Phys. Res. A 2001, 460, 1–14. [Google Scholar] [CrossRef]
  3. Kiwsakunkran, N.; Chaiphaksa, W.; Chanthima, N.; Kim, H.J.; Kothan, S.; Prasatkhetragarn, A.; Kaewkhao, J. Fabrication of K2O–Al2O3–Gd2O3–P2O5 glasses for photonic and scintillation materials applications. Radiat. Phys. Chem. 2021, 188, 109639. [Google Scholar] [CrossRef]
  4. Lecoq, P. Development of new scintillators for medical applications. Nucl. Instrum. Methods Phys. Res. A 2016, 809, 130–139. [Google Scholar] [CrossRef]
  5. Cavouras, D.; Kandarakis, I.; Panayiotakis, G.S.; Evangelou, E.K.; Nomicos, C.D. An evaluation of the Y2O3:Eu3+ scintillator for application in medical x-ray detectors and image receptors. Med. Phys. 1996, 23, 1965–1975. [Google Scholar] [CrossRef]
  6. Arnaboldi, C.; Beeman, J.W.; Cremonesi, O.; Gironi, L.; Pavan, M.; Pessina, G.; Pirro, S.; Previtali, E. CdWO4 scintillating bolometer for Double Beta Decay: Light and Heat anticorrelation, light yield and quenching factors. Astropart. Phys. 2010, 34, 143–150. [Google Scholar] [CrossRef]
  7. Fuschino, F.; Campana, R.; Labanti, C.; Evangelista, Y.; Feroci, M.; Burderi, L.; Fiore, F.; Ambrosino, F.; Baldazzi, G.; Bellutti, P.; et al. HERMES: An ultra-wide band X and gamma-ray transient monitor on board a nano-satellite constellation. Nucl. Instrum. Methods Phys. Res. A 2019, 936, 199–203. [Google Scholar] [CrossRef]
  8. Lesparre, N.; Marteau, J.; Déclais, Y.; Gibert, D.; Carlus, B.; Nicollin, F.; Kergosien, B. Design and operation of a field telescope for cosmic ray geophysical tomography. Geosci. Instrum. Methods Data Syst. 2012, 1, 33–42. [Google Scholar] [CrossRef]
  9. Kowatari, M.; Tanimura, Y.; Kessler, P.; Neumaier, S.; Roettger, A. Development of a simultaneous evaluation method of radioactivity in soil and dose rate using CeBr3 and SrI2(Eu) scintillation detectors for environmental monitoring. Prog. Nucl. Sci. Technol. 2019, 6, 81–85. [Google Scholar] [CrossRef]
  10. Cieślak, M.; Gamage, K.; Glover, R. Critical Review of Scintillating Crystals for Neutron Detection. Crystals 2019, 9, 480. [Google Scholar] [CrossRef]
  11. Melcher, C.L. Scintillators for well logging applications. Nucl. Instrum. Methods Phys. Res. B 1989, 40–41, 1214–1218. [Google Scholar] [CrossRef]
  12. Burachas, S.P.; Danevich, F.A.; Georgadze, A.S.; Klapdor-Kleingrothaus, H.V.; Kobychev, V.V.; Kropivyansky, B.N.; Kuts, V.N.; Muller, A.; Muzalevsky, V.V.; Nikolaiko, A.S.; et al. Large volume CdWO4 crystal scintillators. Nucl. Instrum. Methods Phys. Res. A 1996, 369, 164–168. [Google Scholar] [CrossRef]
  13. Rinaldi, D.; Montalto, L.; Lebeau, M.; Mengucci, P. Influence of a Surface Finishing Method on Light Collection Behaviour of PWO Scintillator Crystals. Photonics 2018, 5, 47. [Google Scholar] [CrossRef]
  14. Takagi, K.; Fukazawa, T. Cerium-activated Gd2SiO5 single crystal scintillator. Appl. Phys. Lett. 1983, 42, 43–45. [Google Scholar] [CrossRef]
  15. Song, S.; Park, J.H.; Kim, J.; Kim, S.; Jegal, S.; Lee, S.; Lee, B. Acquiring Gamma-Ray Energy Spectrum Using a Plastic Scintillation Optical Fiber Detector. Photonics 2024, 11, 493. [Google Scholar] [CrossRef]
  16. Lertloypanyachai, P.; Chewpraditkul, W.; Pattanaboonmee, N.; Yawai, N.; Sreebunpeng, K.; Nimphaya, T.; Beitlerova, A.; Nikl, M.; Chewpraditkul, W. Luminescence and light yield of Ce3+-doped (60−x)SiO2-xBaF2-20Al2O3-20Gd2O3 scintillation glasses: The effect of BaF2 admixture. Optik 2023, 289, 171272. [Google Scholar] [CrossRef]
  17. Wantana, N.; Kaewnuam, E.; Tariwong, Y.; Quang, N.D.; Pakawanit, P.; Phoovasawat, C.; Vittayakorn, N.; Kothan, S.; Kim, H.J.; Kaewkhao, J. Na2O-Gd2O3-Al2O3-P2O5 glass scintillator doped with Dy 3+: X-rays and proton responses. Jpn. J. Appl. Phys. 2023, 62, 010602. [Google Scholar] [CrossRef]
  18. Seeley, Z.M.; Cherepy, N.J.; Payne, S.A. Expanded phase stability of Gd-based garnet transparent ceramic scintillators. J. Mater. Res. 2014, 29, 2332–2337. [Google Scholar] [CrossRef]
  19. Dubov, V.; Kuznetsova, D.; Kamenskikh, I.; Komendo, I.; Malashkevich, G.; Ramanenka, A.; Retivov, V.; Talochka, Y.; Vasil’ev, A.; Korzhik, M. On the Quenching Mechanism of Ce, Tb Luminescence and Scintillation in Compositionally Disordered (Gd, Y, Yb)3Al2Ga3O12 Garnet Ceramics. Photonics 2023, 10, 615. [Google Scholar] [CrossRef]
  20. He, S.; Li, Y.; Chen, L.; Jin, T.; Liu, L.; Ruan, J.; Ouyang, X. Positive Effects of a Perovskite Film on the Radioluminescence Properties of a ZnO:Ga Crystal Scintillator. Materials 2022, 15, 1487. [Google Scholar] [CrossRef]
  21. Koshimizu, M. Composite scintillators based on polymers and inorganic nanoparticles. Funct. Mater. Lett. 2020, 13, 2030003. [Google Scholar] [CrossRef]
  22. Dujardin, C.; Auffray, E.; Bourret-Courchesne, E.; Dorenbos, P.; Lecoq, P.; Nikl, M.; Vasil’ev, A.N.; Yoshikawa, A.; Zhu, R.-Y. Needs, Trends, and Advances in Inorganic Scintillators. IEEE Trans. Nucl. Sci. 2018, 65, 1977–1997. [Google Scholar] [CrossRef]
  23. Kim, C.; Lee, W.; Melis, A.; Elmughrabi, A.; Lee, K.; Park, C.; Yeom, J.-Y. A Review of Inorganic Scintillation Crystals for Extreme Environments. Crystals 2021, 11, 669. [Google Scholar] [CrossRef]
  24. Watanabe, K.; Yanagida, T.; Nakauchi, D.; Kawaguchi, N. Scintillation light yield of Tb:Sr2Gd8(SiO4)6O2. Jpn. J. Appl. Phys. 2021, 60, 106002. [Google Scholar] [CrossRef]
  25. Kantuptim, P.; Nakauchi, D.; Kato, T.; Kawaguchi, N.; Yanagida, T. Comparative Study of Optical and Scintillation Properties of Tm-doped La2Si2O7 and Lu2Si2O7 Single Crystals. Sens. Mater. 2022, 34, 603. [Google Scholar] [CrossRef]
  26. Kantuptim, P.; Akatsuka, M.; Kawaguchi, N.; Yanagida, T. Optical and scintillation properties of Pr-doped Y2Si2O7 single crystal. Jpn. J. Appl. Phys. 2020, 59, SCCB17. [Google Scholar] [CrossRef]
  27. Kantuptim, P.; Kato, T.; Nakauchi, D.; Kawaguchi, N.; Watanabe, K.; Yanagida, T. Optical and Scintillation Properties of Tb-Doped Rare-Earth Pyrosilicate Single Crystals. Photonics 2022, 9, 765. [Google Scholar] [CrossRef]
  28. Yanagida, T.; Kamada, K.; Fujimoto, Y.; Yagi, H.; Yanagitani, T. Comparative study of ceramic and single crystal Ce:GAGG scintillator. Opt. Mater. 2013, 35, 2480–2485. [Google Scholar] [CrossRef]
  29. Yanagida, T.; Fujimoto, Y.; Ito, T.; Uchiyama, K.; Mori, K. Development of X-ray-induced afterglow characterization system. Appl. Phys. Express 2014, 7, 062401. [Google Scholar] [CrossRef]
  30. Fukushima, H.; Nakauchi, D.; Kawaguchi, N.; Yanagida, T. Photoluminescence and Scintillation Properties of Ce-doped SrHfO3. Sens. Mater. 2019, 31, 1273. [Google Scholar] [CrossRef]
  31. Holl, I.; Lorenz, E.; Mageras, G. A measurement of the light yield of common inorganic scintillators. IEEE Trans. Nucl. Sci. 1988, 35, 105–109. [Google Scholar] [CrossRef]
  32. Wolff, N.; Klimm, D. Determination of the phase diagram Tb2O3–SiO2 and crystal growth of the rare earth pyrosilicate Tb2Si2O7 by the optical floating-zone (OFZ) technique. J. Solid State Chem. 2022, 312, 123269. [Google Scholar] [CrossRef]
  33. Robbins, D.J.; Cockayne, B.; Lent, B.; Glasper, J.L. The mechanism of 5D3-5D4 cross-relaxation in Y3Al5O12: Tb3+. Solid State Commun. 1976, 20, 673–676. [Google Scholar] [CrossRef]
  34. Kawaguchi, N.; Watanabe, K.; Shiratori, D.; Kato, T.; Nakauchi, D.; Yanagida, T. Scintillation Light Yields of Tb-doped SiO2 Glasses. Sens. Mater. 2023, 35, 499. [Google Scholar] [CrossRef]
  35. Chewpraditkul, W.; Shen, Y.; Chen, D.; Beitlerova, A.; Nikl, M. Luminescence of Tb3+-doped high silica glass under UV and X-ray excitation. Opt. Mater. 2013, 35, 426–430. [Google Scholar] [CrossRef]
  36. Kawano, N.; Akatsuka, M.; Kimura, H.; Okada, G.; Kawaguchi, N.; Yanagida, T. Scintillation and TSL properties of Tb-doped NaPO3-Al(PO3)3 glasses. Radiat. Meas. 2018, 117, 52–56. [Google Scholar] [CrossRef]
  37. van Loef, E.V.; Dorenbos, P.; van Eijk, C.W.; Krämer, K.; Güdel, H. Scintillation properties of LaBr3:Ce3+ crystals: Fast, efficient and high-energy-resolution scintillators. Nucl. Instrum. Methods Phys. Res. A 2002, 486, 254–258. [Google Scholar] [CrossRef]
  38. Kantuptim, P.; Kato, T.; Nakauchi, D.; Kawaguchi, N.; Yanagida, T. Ce concentration dependence of optical and scintillation properties on Ce-doped La2Si2O7 crystal. Jpn. J. Appl. Phys. 2022, 61, SB1038. [Google Scholar] [CrossRef]
  39. Kaewkhao, J.; Wantana, N.; Kaewjaeng, S.; Kothan, S.; Kim, H.J. Luminescence characteristics of Dy3+ doped Gd2O2-CaO-SiO2-B2O3 scintillating glasses. J. Rare Earths 2016, 34, 583–589. [Google Scholar] [CrossRef]
  40. Wantana, N.; Kaewnuam, E.; Ruangtaweep, Y.; Valiev, D.; Stepanov, S.; Yamanoi, K.; Kim, H.J.; Kaewkhao, J. Radio, cathodo and photoluminescence investigations of high density WO3-Gd2O3-B2O3 glass doped with Tb3+. Radiat. Phys. Chem. 2019, 164, 108350. [Google Scholar] [CrossRef]
  41. Matsuo, T.; Kato, T.; Kimura, H.; Nakamura, F.; Nakauchi, D.; Kawaguchi, N.; Yanagida, T. Evaluation of dosimetric properties of Tb-doped MgF2 transparent ceramics. Optik 2020, 203, 163965. [Google Scholar] [CrossRef]
  42. Nakauchi, D.; Kato, T.; Kawaguchi, N.; Yanagida, T. Characterization of Eu-doped Ba2SiO4, a high light yield scintillator. Appl. Phys. Express 2020, 13, 2–5. [Google Scholar] [CrossRef]
  43. Nagornaya, L.; Onyshchenko, G.; Pirogov, E.; Starzhinskiy, N.; Tupitsyna, I.; Ryzhikov, V.; Galich, Y.; Vostretsov, Y.; Galkin, S.; Voronkin, E. Production of the high-quality CdWO4 single crystals for application in CT and radiometric monitoring. Nucl. Instrum. Methods Phys. Res. A 2005, 537, 163–167. [Google Scholar] [CrossRef]
  44. Yanagida, T.; Kawaguchi, N. Optical and Scintillation Properties of Tb-doped Apatite Single Crystals. J. Ceram. Process. Res. 2019, 20, 577–581. [Google Scholar] [CrossRef]
  45. Laguta, V.; Havlak, L.; Babin, V.; Barta, J.; Pejchal, J.; Nikl, M. Charge Transfer and Charge Trapping Processes in Ca- or Al-Co-doped Lu2SiO5 and Lu2Si2O7 Scintillators Activated by Pr3+ or Ce3+ Ions. Materials 2023, 16, 4488. [Google Scholar] [CrossRef]
Figure 1. Photographs of Tb:GPS specimens directly after crystallizing by the FZ method (A); polished specimens under general lighting (B); and under 254 nm UV (C).
Photonics 11 00673 g001
Figure 2. XRD patterns of powdered Tb:GPS specimens with pure GPS (COD 9011106).
Photonics 11 00673 g002
Figure 3. Transmittance spectra of Tb:GPS specimens.
Photonics 11 00673 g003
Figure 4. PL emission contour graph of Tb:GPS specimens in the excitation wavelength (vertical axis) and emission wavelength (horizontal axis) ranges of 250–400 and 300–700 nm, respectively.
Photonics 11 00673 g004
Figure 5. PL lifetime profiles of Tb:GPS specimens upon excitation at 265 nm and observation at 550 nm, with the decay time fitting equation.
Photonics 11 00673 g005
Figure 6. X-ray-induced scintillation spectra of Tb:GPS specimens.
Photonics 11 00673 g006
Figure 7. X-ray-induced scintillation lifetime profiles of Tb:GPS specimens observed at UV–visible range, with the decay time fitting equation.
Photonics 11 00673 g007
Figure 8. X-ray-induced afterglow profiles of Tb:GPS specimens.
Photonics 11 00673 g008
Figure 9. Pulse height spectra of 662 keV (137Cs) γ-rays measured with Tb:GPS specimens and a BGO reference.
Photonics 11 00673 g009
Table 1. Summary measurement results of Tb:GPS specimens.
Tb-Doping
Concentration in GPS
(%)
PL QY
(%)
PL Decay Time
(ms)
PL and Scintillation
Wavelength
(Strongest, nm)
Scintillation
Decay Time (ms)
Af20, Af40
(ppm)
Light Yield at
662 keV γ-Rays
±10%
(ph/MeV)
0.122.75.22378 (5D37F6)2.411640, 140 14,600
0.538.75.05378 (5D37F6)2.633240, 136 18,200
1.068.94.95544 (5D47F5)3.225110, 22595,600
2.083.94.89544 (5D47F5)3.887250, 36243,800
Disclaimer/Publisher’s Note: The statements, opinions and data contained in all publications are solely those of the individual author(s) and contributor(s) and not of MDPI and/or the editor(s). MDPI and/or the editor(s) disclaim responsibility for any injury to people or property resulting from any ideas, methods, instructions or products referred to in the content.

