Article

Evaluation of Fluorescence Contrast for the Differentiation of Ex Vivo Tissue Slides from Collagen-Related Degenerative Skin Diseases

1
Institute of Electronics, Bulgarian Academy of Sciences, 1784 Sofia, Bulgaria
2
Department of Computer Systems and Technologies, Faculty of Electronics and Automatics, Branch Plovdiv, Technical University of Sofia, 4000 Plovdiv, Bulgaria
3
University Hospital “Tzaritza Yoanna—ISUL”, 1527 Sofia, Bulgaria
*
Author to whom correspondence should be addressed.
Photonics 2024, 11(8), 687; https://doi.org/10.3390/photonics11080687
Submission received: 17 May 2024 / Revised: 15 July 2024 / Accepted: 19 July 2024 / Published: 24 July 2024
(This article belongs to the Special Issue Photonics: 10th Anniversary)

Abstract

:
Histopathological analysis is one of the primary pillars in clinical diagnostics. The efforts to implement optical techniques aim at alleviating the burden of delivering timely and accurate diagnoses. We have explored the potential application of unstained tissue slides’ autofluorescence to differentiate collagen-related skin degenerative diseases, such as psoriasis, lupus erythematosus, scleroderma, and Syndrome of Raynaud. This exploration involved two techniques: fluorescence microscopy combined with colorimetric analysis and synchronous fluorescence spectroscopy. We addressed the main characteristic peculiarities of the examined samples and discussed the evaluation of potential classification parameters along with their diagnostic values.

1. Introduction

Various optical techniques found their way in the clinical practices for diagnosis in order to assist physicians and improve the overall diagnostic accuracy [1,2]. In addition, even more are currently under development for implementation in clinical practice, either as a red-flag or stand-alone diagnostic modalities. All of these methods rely on the alteration of a tissue’s optical properties during pathogenesis, which can be assessed through its interaction with light. One of the main advantages is the ability to evaluate specific parameters with defined values, enabling objective differentiation between healthy and abnormal tissue, as well as the identification of various abnormalities.
The development of optical modalities such as reflectance confocal fluorescence microscopy (RCFM) and optical coherence tomography provides means for real-time, non-invasive, in vivo pathology diagnosis. In the case of CFM, it offers quasi-histological resolution without the need for any biopsy [3,4,5]. While studies have demonstrated the cost effectiveness of implementing RCFM into clinical practice in the long run, the initial investment is beyond the reach of the majority of medical centers [6].
On the other hand, optical techniques could be used to aid histopathological analyses, which serve as the gold standard for diagnosing various diseases. The utilization of optical techniques, alongside the so-called digital histology, could enhance reproducibility and objectivity and reduce the time necessary for tissue evaluation. Different approaches, such as fluorescence polarization [7] or hyperspectral imaging [8], some combined with the use of dyes, have been explored. However, a more intriguing concept involves acquiring contrast solely based on the alteration of a tissue’s optical properties. In recent years, polarimetry has gained significant momentum as a potential diagnostic technique [9,10] within this concept. Nonetheless, the fluorescence approach, despite being one of the most intensively researched optical modalities for clinical applications, holds unexplored potential for differentiating between pathological and healthy tissues based on their interaction with light.
The application of different imaging approaches through fluorescence aims towards the evaluation of diagnostically valuable patterns and structures, akin to the classic histology. However, the endogenous fluorescence of tissues varies according to their condition and is affected by pathological alterations in different ways. In this case, the high sensitivity of the method is beneficial but also requires costly research into the diagnostic meaning and the origin of the observed spectral peculiarities of healthy and pathological tissues.
Hence, we have implemented a novel approach for the evaluation of fluorescence techniques’ potential for the diagnosis of skin degenerative conditions, such as Syndrome of Raynaud, scleroderma, lupus erythematosus, and psoriasis. These pathologies affect collagen, one of the main endogenous fluorophores, with diagnostic significance. The accurate and timely diagnosis of these conditions poses a great challenge for clinicians, requiring numerous clinical tests and histopathological examinations. Additionally, the number of histology patterns typical for each of these diseases is great, and their evaluation requires highly trained pathologists. Often, the results are ambiguous, leading patients and clinicians to spend considerable time and effort before assigning the appropriate treatment for their condition.
Traditionally, fluorescence microscopy has a place in clinical diagnostics for the immunopathological identification of infectious diseases, autoimmune and vesiculobullous lesions, and for cancer diagnostics. However, these applications require the use of fluorescent dyes, which are most often target-specific [11].
In our work, fluorescence microscopy was applied on non-stained, deparaffinized skin tissue slides. The images were further processed for colorimetric analysis, in order to obtain optical parameters for objective differentiation between the fluorescence microscopy images of different pathologies. We have chosen to convert the images from the standard RGB (red, green, blue) color space to HSV (hue-saturation-value) color space, due to its superiority in terms of evaluating diagnostically valuable features. This strategy has proven beneficial for wound evaluation [12]; detection of imperceptible colon bleeding [13]; colorectal polyp detection [14]; and other biomedical applications [15].
Additionally, we have utilized synchronous fluorescence spectroscopy (SFS) to explore the spectral peculiarities of the investigated tissue slides. SFS is a relatively novel technique developed by Lloyd [16], and it was introduced in biomedical research by Vo-Dinh [17]. Essentially, through the fluorescence measurement, the excitation and emission monochromators move synchronously with a constant wavelength offset. Moreover, this allows for the observation of narrower spectral widths of the fluorescence maxima, reduction in spectral overlapping, and better addressing of the fluorophores present in the investigated sample [18]. We have previously applied this technique for the evaluation of fluorescence properties in ex vivo healthy and cancerous skin [19,20], as well as gastrointestinal [21,22] tissue samples.
Our approach aims at obtaining optical parameters that define the characteristic differences in fluorescence properties between tissue slides of skin affected by collagen-related degenerative diseases. Ideally, this could be implemented in clinical diagnostics, improving turnaround time for diagnosis, providing objective classification, and reducing the burden on pathologists.

2. Materials and Methods

The tissue slides evaluated in this study are histology samples, which underwent a standard processing procedure up to the step of applying histology dyes. The process of staining with eosin and hematoxylin was omitted due to their optical characteristics. Both dyes exhibit high absorption of light. Eosin absorbs light within the range of 450–550 nm, while hematoxylin absorbs light within the range of 400–700 nm. Additionally, eosin exhibits substantial fluorescence emission in the spectral range from 500 to 700 nm [23]. Our study aims to provide contrast between healthy and abnormal tissue based on their intrinsic optical properties, which could aid in their differentiation. The slides are with standard nominal thickness of 4–5 μm, according to the microtome settings. No mounting media or coverglass were used. A consecutive slide, which was routinely processed, was used for reference during measurement. A total of 12 slides were evaluated for every pathology.
Fluorescence microscopy was performed through Axiolab 5FL-LED Fluorescence Microscope (Carl Zeiss, Oberkochen, Germany) with excitation wavelengths of 385 nm, 470 nm, 565 nm, and 625 nm (LED 10 W light source and Filter Set 90 HE) and simultaneous detection for all excitation wavelengths in the ranges 410–440 nm; 499–529 nm; 580–604 nm; and 659–759 nm (detection Filter Set 90 HE). Pseudo colors were assigned for the images obtained at different excitation wavelengths, instead of the original gray levels, for better visualization with an excitation wavelength of 385 nm—pseudo color blue, of 470 nm—pseudo color green, of 565 nm—pseudo color yellow, and of 625 nm—pseudo color red. The images were obtained with 20×/0.45 NA objective, since this is the routinely used magnification in pathology assessment.
The useful information in the three channels of the color reproducing signals—R (red), G (green), B (blue)—in the pseudo-colored images are related to the emission signals after the filters, as described in Table 1.
Fluorescence spectroscopy was executed with Fluorolog3 (Horiba Jobin Yovon) and adapter F-3000 with optical fiber used for illumination and detection. The spectral resolution of the device can be adjusted up to 0.2 nm and its accuracy is ±0.5 nm. In the process of the initial establishment of the experimental protocol, two geometries for the optical fiber were tested—perpendicular and at 45° to the glass slide surface, respectively. In both cases, the distance between the edge of the optical fiber and the sample was 3 mm. Although perpendicular geometry is the standard for fluorescence spectroscopy of tissue samples, in our case, considering that the sample was a thin slide on microscopy glass, angled geometry provided better experimental results in terms of background from direct reflection. The parameters applied for the fluorescence spectroscopy included excitation wavelength at 405 nm and emission range of 420–700 nm. Additionally, synchronous fluorescence spectroscopy was applied for sample evaluation. The excitation was in the range of 280–600 nm, with an increment of 1 nm and with the offset for emission detection being in the range of 10–90 nm, with an increment of 10 nm.

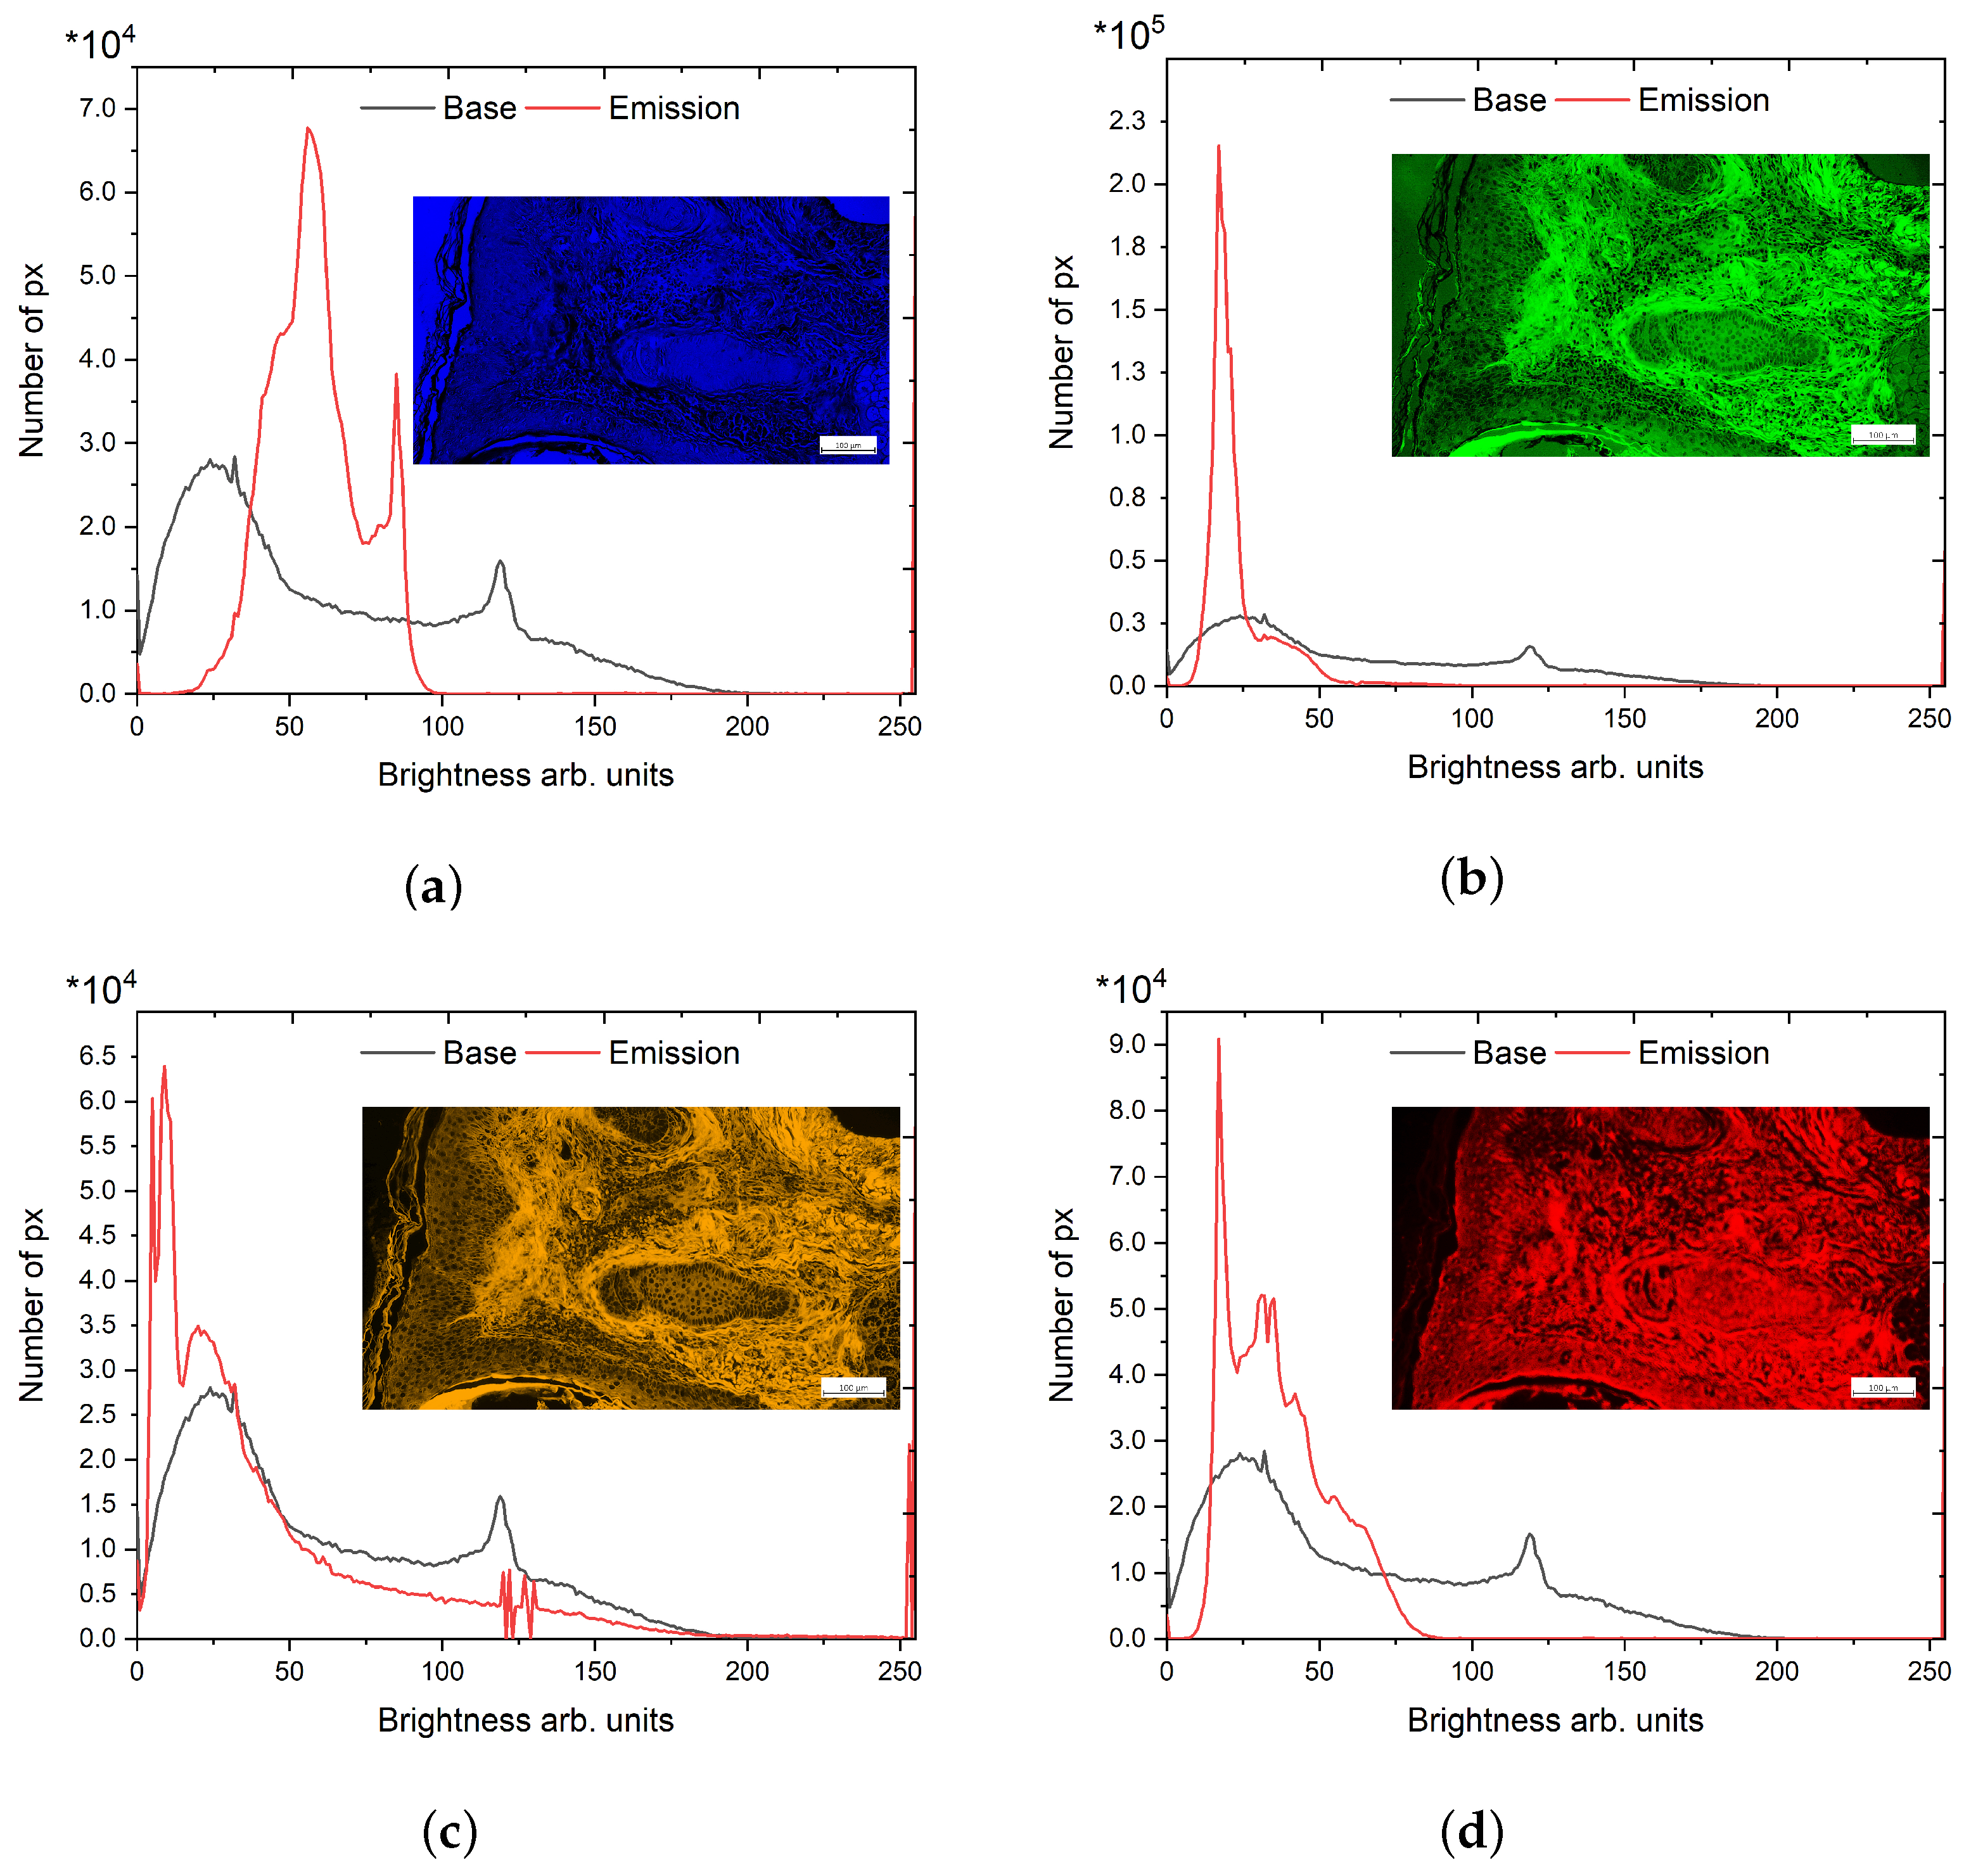
Data Processing for Relative Quantitative Assessment

The fluorescence microscopy images under processing are represented by RGB (red, green, blue)-reproducing signals, saved in TIFF file format with a raster of 1920 × 1080 pixels. Their analysis was completed by histograms for coloring presented in the HSV color system [24]. The HSV was selected considering the distribution of the useful information according to Table 1 and the fact that the visible color is determined by the maximum value between the color reproducing signals. The model describes color feature parameters as hue, saturation, and value (representing the brightness). Hue corresponds to the dominant wavelength of the detected light. Saturation refers to the purity of a color, indicating its degree of not being mixed with white. In terms of the brightness describing more or less light emitted by the source, it is closely tied to the physical property luminance (cd/m2) [25]. The result of the parameters from the transformation of red-, green-, and blue-color-reproducing signals was the achromatic parameter V—maximum brightness among the R, G, and B (Equation (1)).
V = max ( R , G , B )
The V value ranges from 0 (black) to 1 (white)—or from 0 to 255. Chromaticity is formed by S (saturation) and H (hue). S is calculated with Equation (2):
S = ( V min ) V
where the “min” is the minimal component among R, G, and B. The corresponding values are between 0 and 1 (or 0–255). Moreover, if the S = 0 , the H is undefined (color is achromatic). Hue is determined by the ratios between R, G, and B calculated using coefficients c r , c g and c b (Equation and Condition 3), where “max” is the maximum value among the R, G, and B, and “min” is the minimum value among the R, G, and B:
c r = ( max R ) ( max min ) c g = ( max G ) ( max min ) c b = ( max B ) ( max min ) If V = R H = c b c g If V = G H = 2 + c r c b If V = B H = 4 + c g c r Hue = H 60 If H < 0 Hue = Hue + 360 If Hue > = 360 Hue = Hue 360 ,
The scale of parameter defines its values from 0 to 359 degrees. H, S, and V parameters are defined for each pixel of the image. The applied algorithm for image processing and histogram calculation follows the subsequent steps:
  • Scanning the image;
  • Transformation from RGB to HSV for each pixel;
  • Calculation of the histograms by counting the pixels with the same values for hue, saturation, and brightness.
In order to perform a relative quantitative assessment, the fluorescence spectra with an excitation wavelength of 405 nm and emission wavelength in the range of 420–700 nm (Figure 1) were used to normalize the image data, to calculate the spectral base for image processing, and to evaluate colorimetric parameters. The main fluorophores responsible for the observed fluorescence are elastin, collagen, and collagen cross-links at 460 nm [26,27,28]. Collagen is bound to bilirubin residues at 550 nm [29]. Both maxima at 590 nm and 618 nm could be attributed to the basic and neutral forms of porphyrins [30].
Based on the normalization, the accumulated emission for the image detection spectral ranges was calculated for every measured sample. The results show that the appropriate region for conducting a comparison with significant differences is the spectral interval of 410–529 nm.
The brightness distributions of the images are calculated first for a “base” image—grayscale image without emission—and an “emission” image—the same area with registered fluorescence. It must be said that the number of pixels with the same value of brightness depends on the structure of the registered area. This is why the distribution values could not be directly used for a comparison. However, the lengths of the localization intervals and specific positions depend only on the brightness and are suitable separation markers.

3. Results

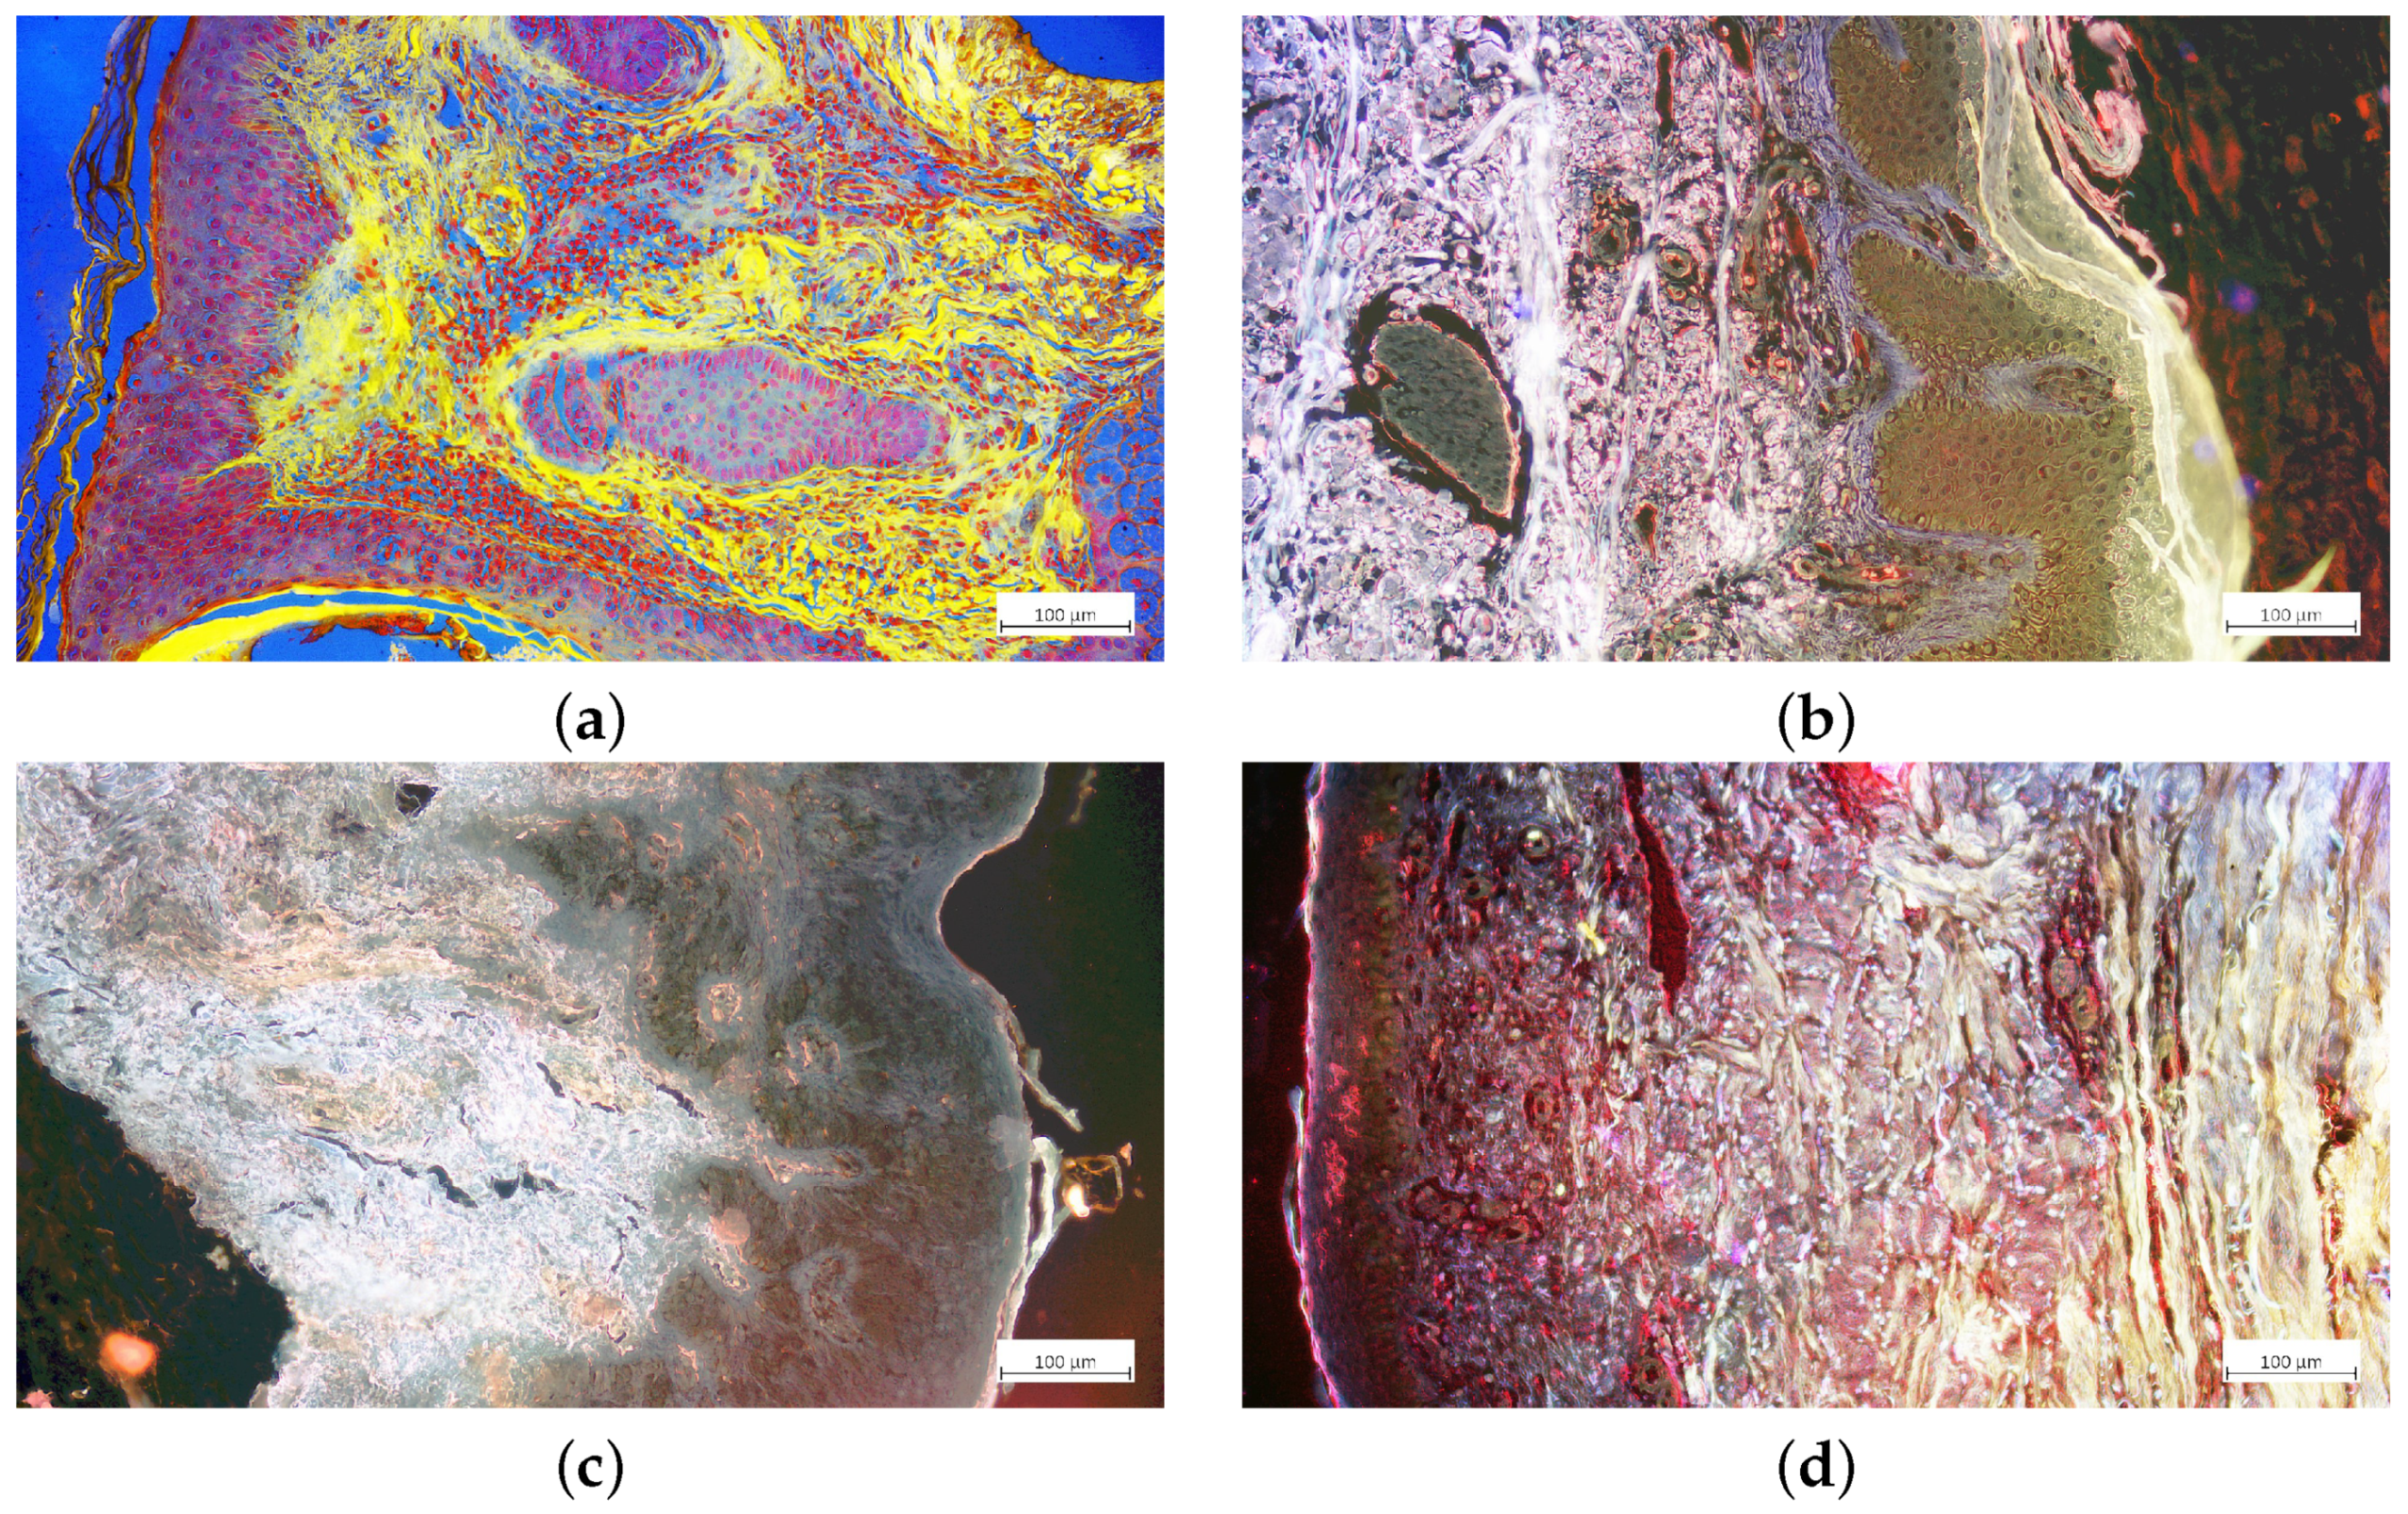
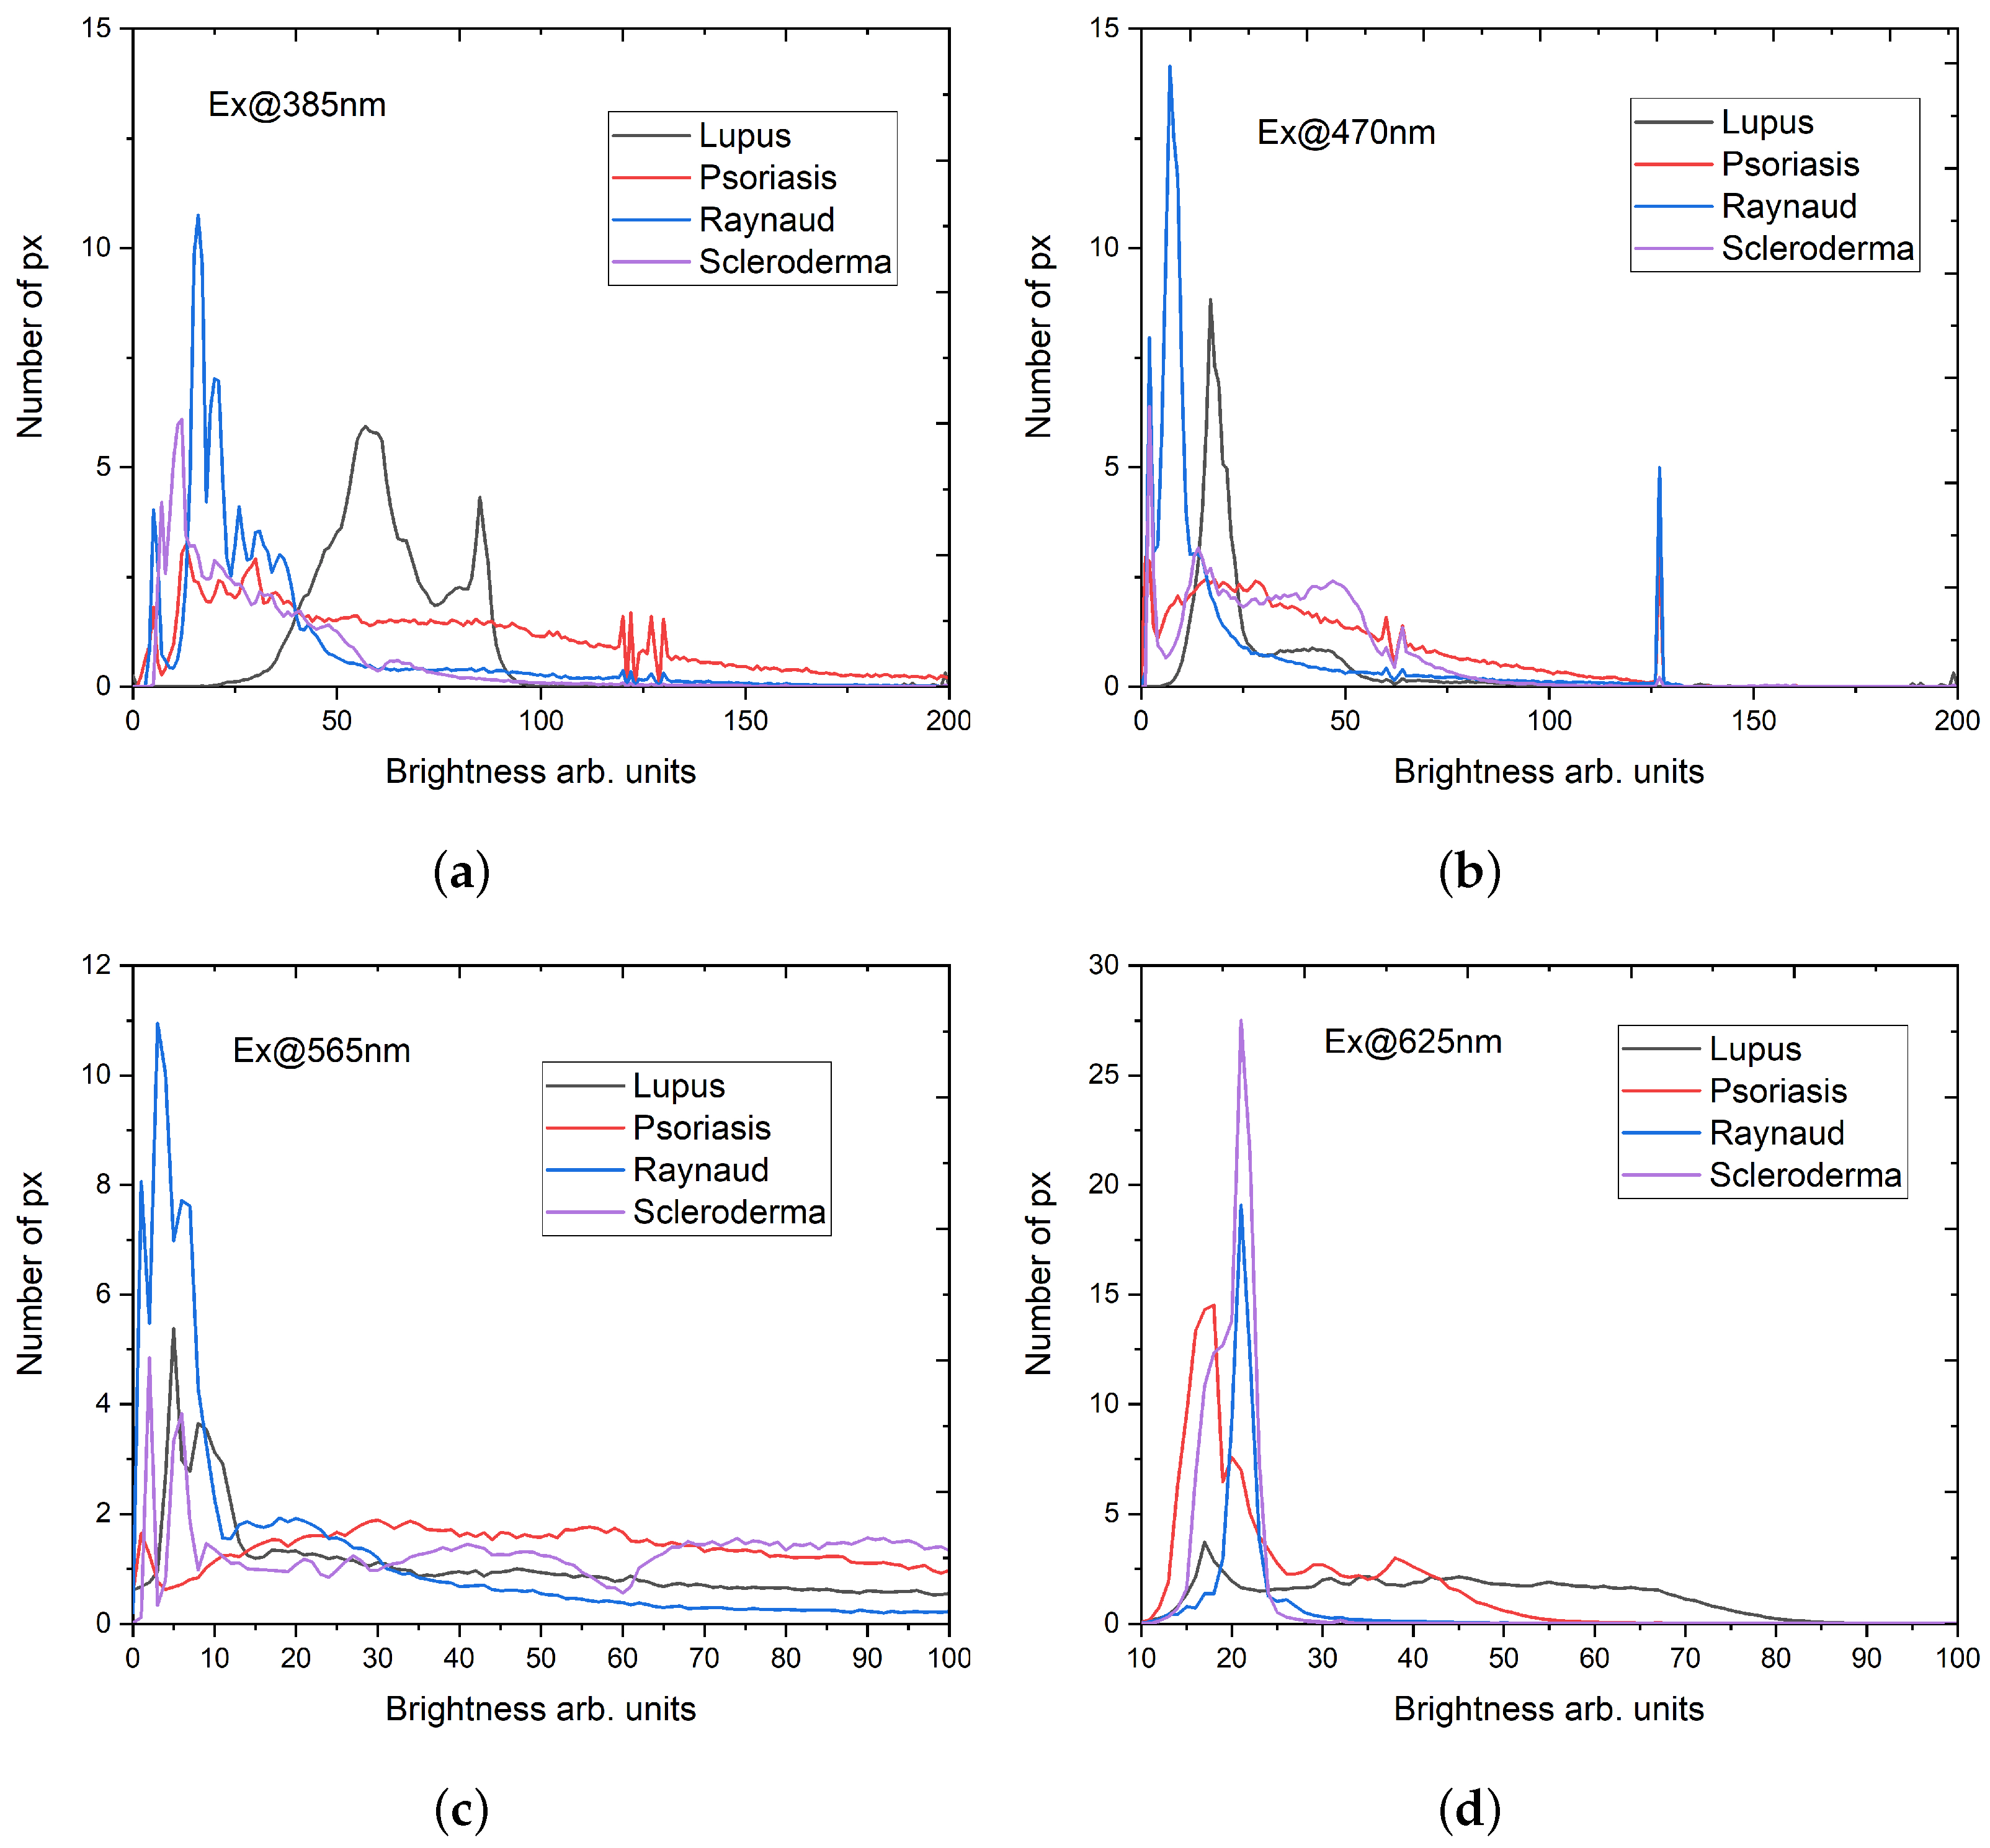
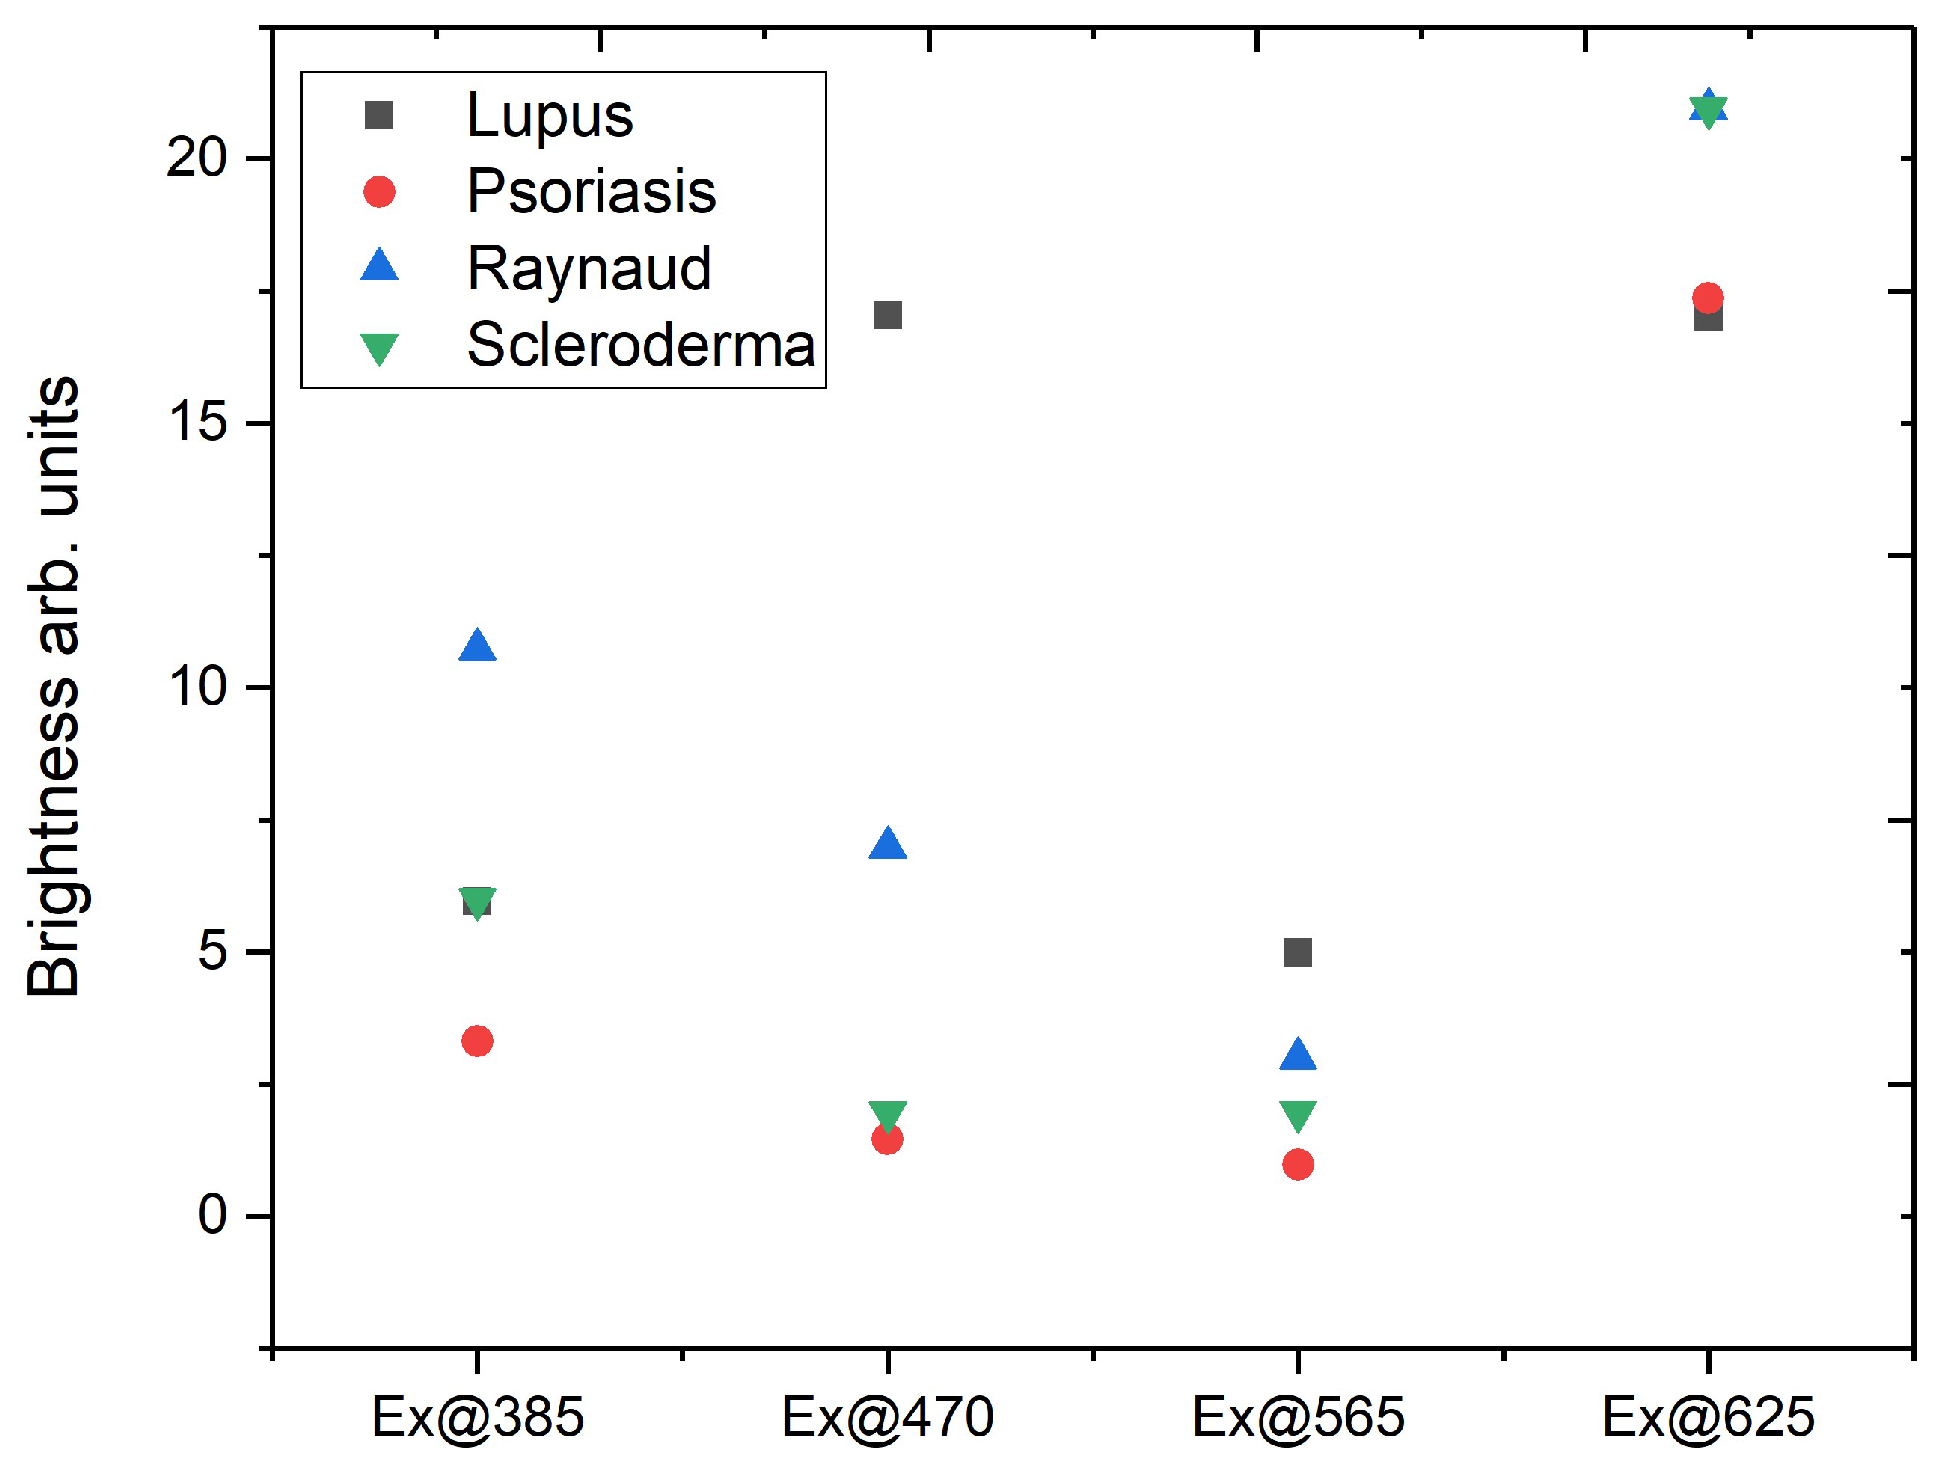
3.1. Relative Quantitative Assessment

An overlay of the fluorescence microscopy images of different pathologists for the applied excitation wavelengths and detection ranges is presented in Figure 2.
The processing of fluorescence microscopy images using the HSV model protocol described in the previous section yielded three parameters: hue, representing the color; saturation, indicating different shades of that color; and brightness, which describes the intensity of lightness. Significant differences among the images of different excitation wavelengths are observed only in the values of brightness. The available fluorescence can be observed only in the pixels having a specific color. The graph in Figure 3 shows a histogram assembled by the histograms for the four differently colored images of one sample.
For a red, green, and blue image, the maximum component defines one value of hue: H = 0 deg—red; H = 120 deg—green; H = 240 deg—blue. For the yellow image in this particular case, the values are between 30 and 60 degrees with a maximum pixel of about 40, which means that the predominant component is red.
Figure 4 represents the processing results for the fluorescence microscopy images of the lupus erythematosus sample. The images in Figure 4 have improved visibility; this was achieved via the global equalization of the V parameter in the histogram. The graphics depict the values of the brightness for fluorescence (Figure 4 “Emission”) and the image without a fluorescence signal (Figure 4 “Base”). The brightness distribution corresponds with the visual assessment of the images (Figure 4). The brightness of the image obtained with an excitation wavelength of 565 nm (Figure 4c) demonstrates the lowest maximum value of the brightness and the lowest number of pixels holding this values. The fluctuations in the number of pixels in the histogram in Figure 4c are due to structures with a close level of luminosity. Since the histogram’s levels are not related to the location of the pixels in the image compared to the histogram of the base image, it can only be assumed that there is some inhomogeneity. Although the image obtained with an excitation wavelength of 385 nm (Figure 4a) exhibits a slightly higher maximum brightness value, the number of pixels holding this value is more than five times larger. On the other hand, the image obtained with an excitation wavelength of 470 nm (Figure 4b) consists of a relatively low number of high-value pixels, with the highest values of brightness among the investigated images. The image containing the second highest brightness values was obtained with an excitation wavelength of 625 nm (Figure 4d); however, in contrast with the data in Figure 4b, there was also a higher number of pixels holding lower brightness values. Effectively, we observed different responses of the sample to different excitation wavelengths.
In the following Figure 5, we presented a comparison of the brightness distribution, corrected with the base or the values for an image without fluorescence, for the investigated collagenosis, and for the utilized excitation wavelengths. For the most of the observed distributions, higher brightness values are demonstrated by a low number of pixels, except for the sample of lupus erythematosus and excitation wavelength of 385 nm (Figure 5a), where the higher brightness values are distributed among the higher number of pixels. Additionally, the same sample exhibits a relatively negligible brightness value for the excitation wavelength of 625 nm. The sample of Syndrome of Raynaud yields the most brightness for the excitation wavelengths of 470 nm and 565 nm, in comparison with all the other samples. Also, we observe that the psoriasis sample demonstrates relatively lower brightness values, apart from the case of the excitation wavelength of 625 nm (Figure 5d). The highest brightness values for the excitation wavelength of 625 nm were evaluated for the scleroderma sample. For the other excitation wavelengths, this sample exhibited lower brightness values, which, for the excitation wavelength of 565 nm, nearly exhibited a homogeneous distribution among the pixels.

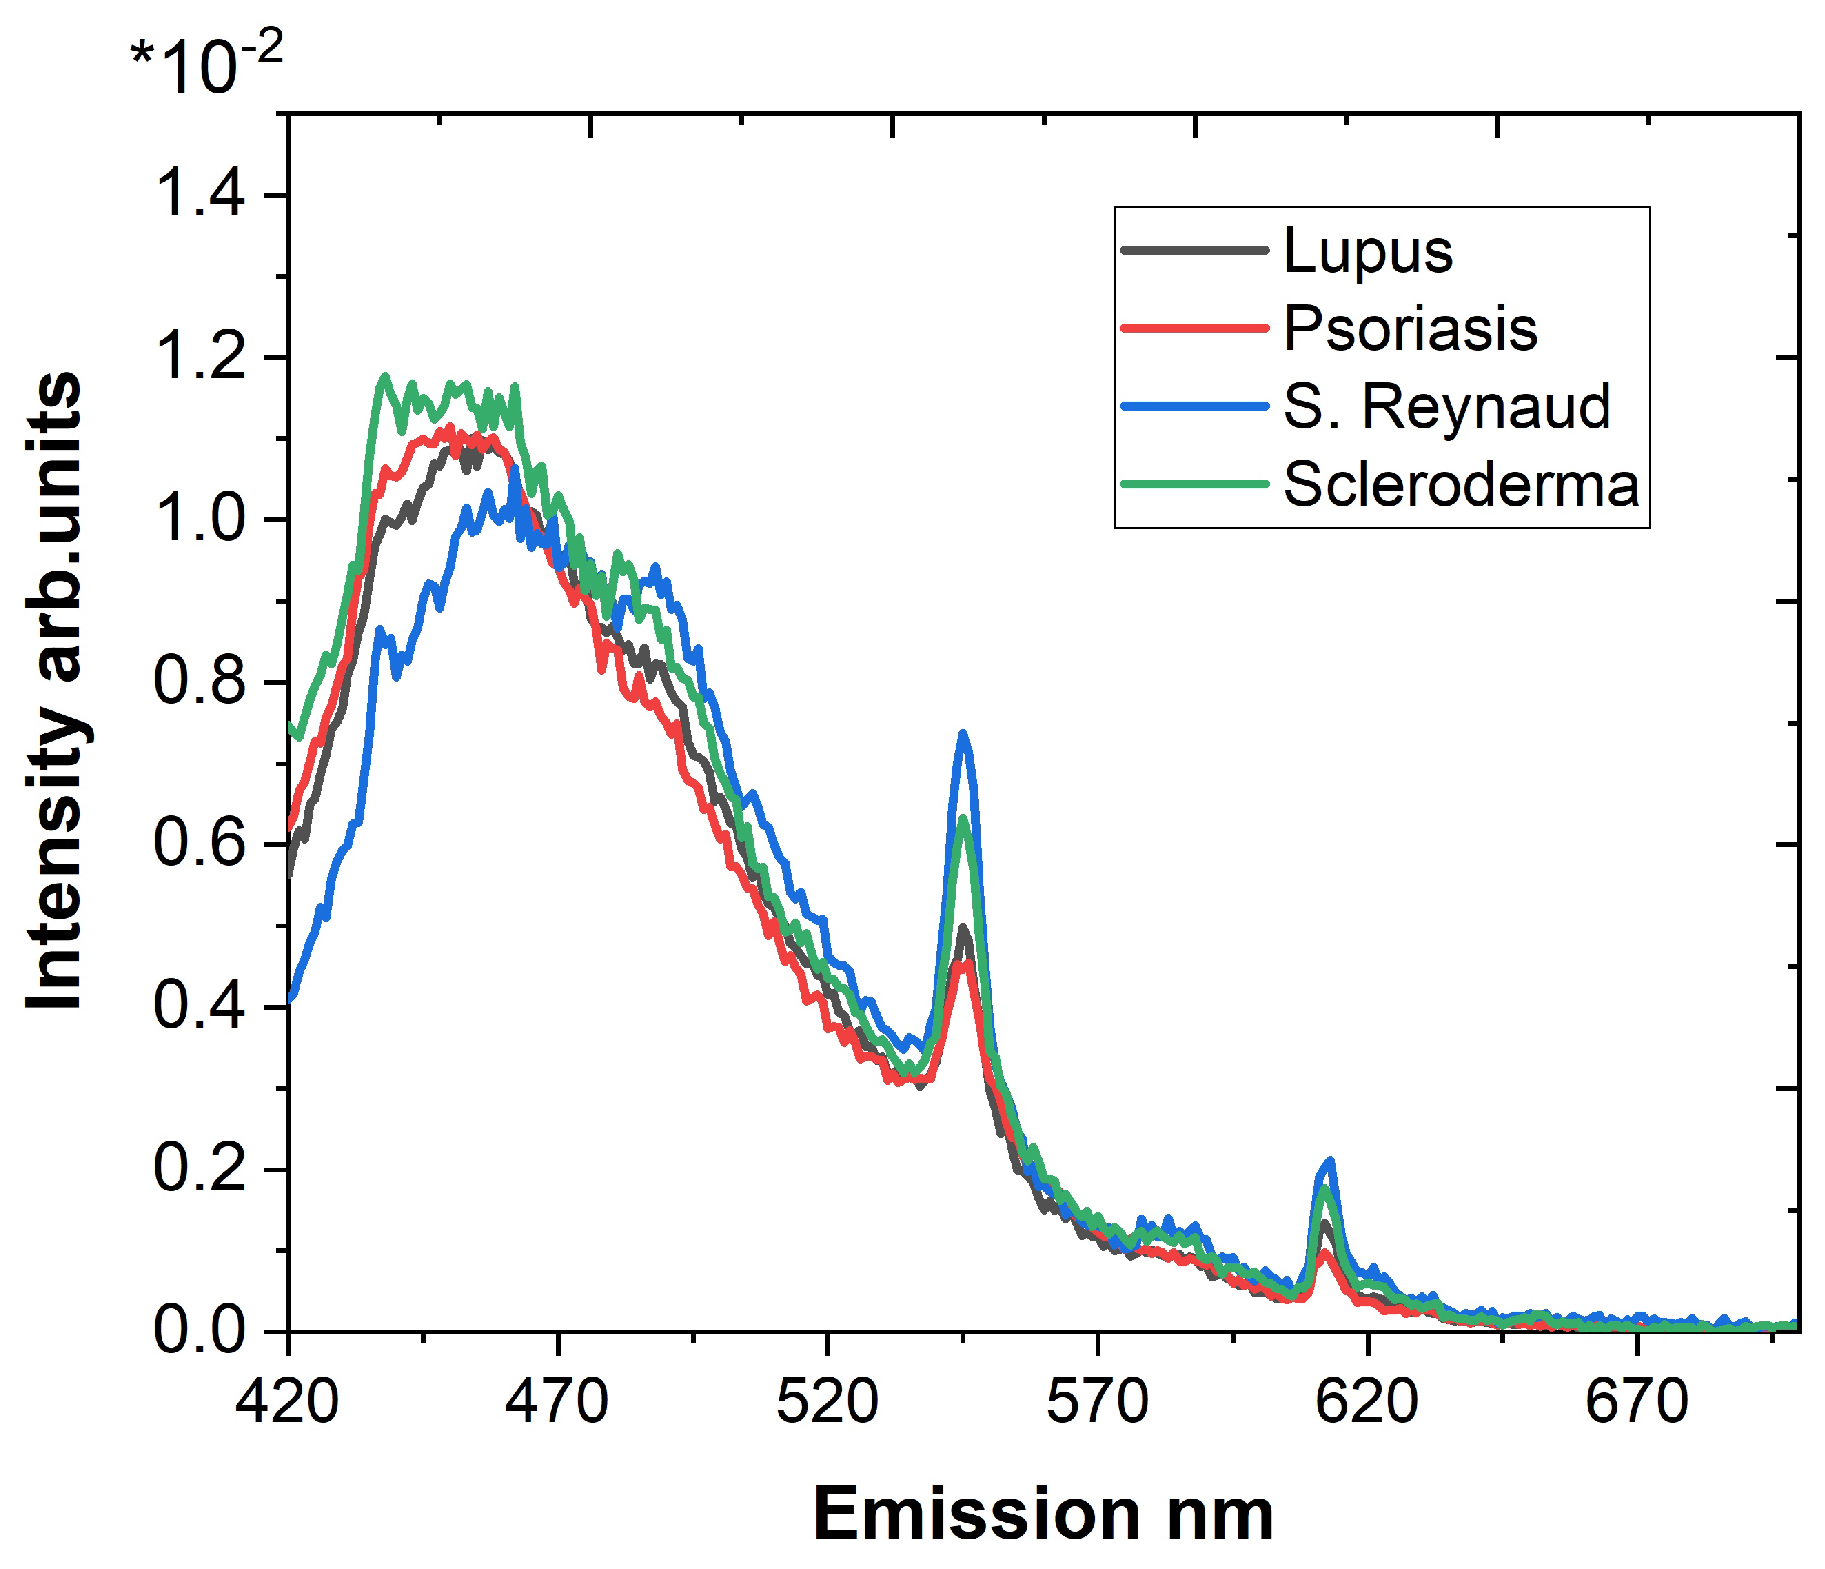
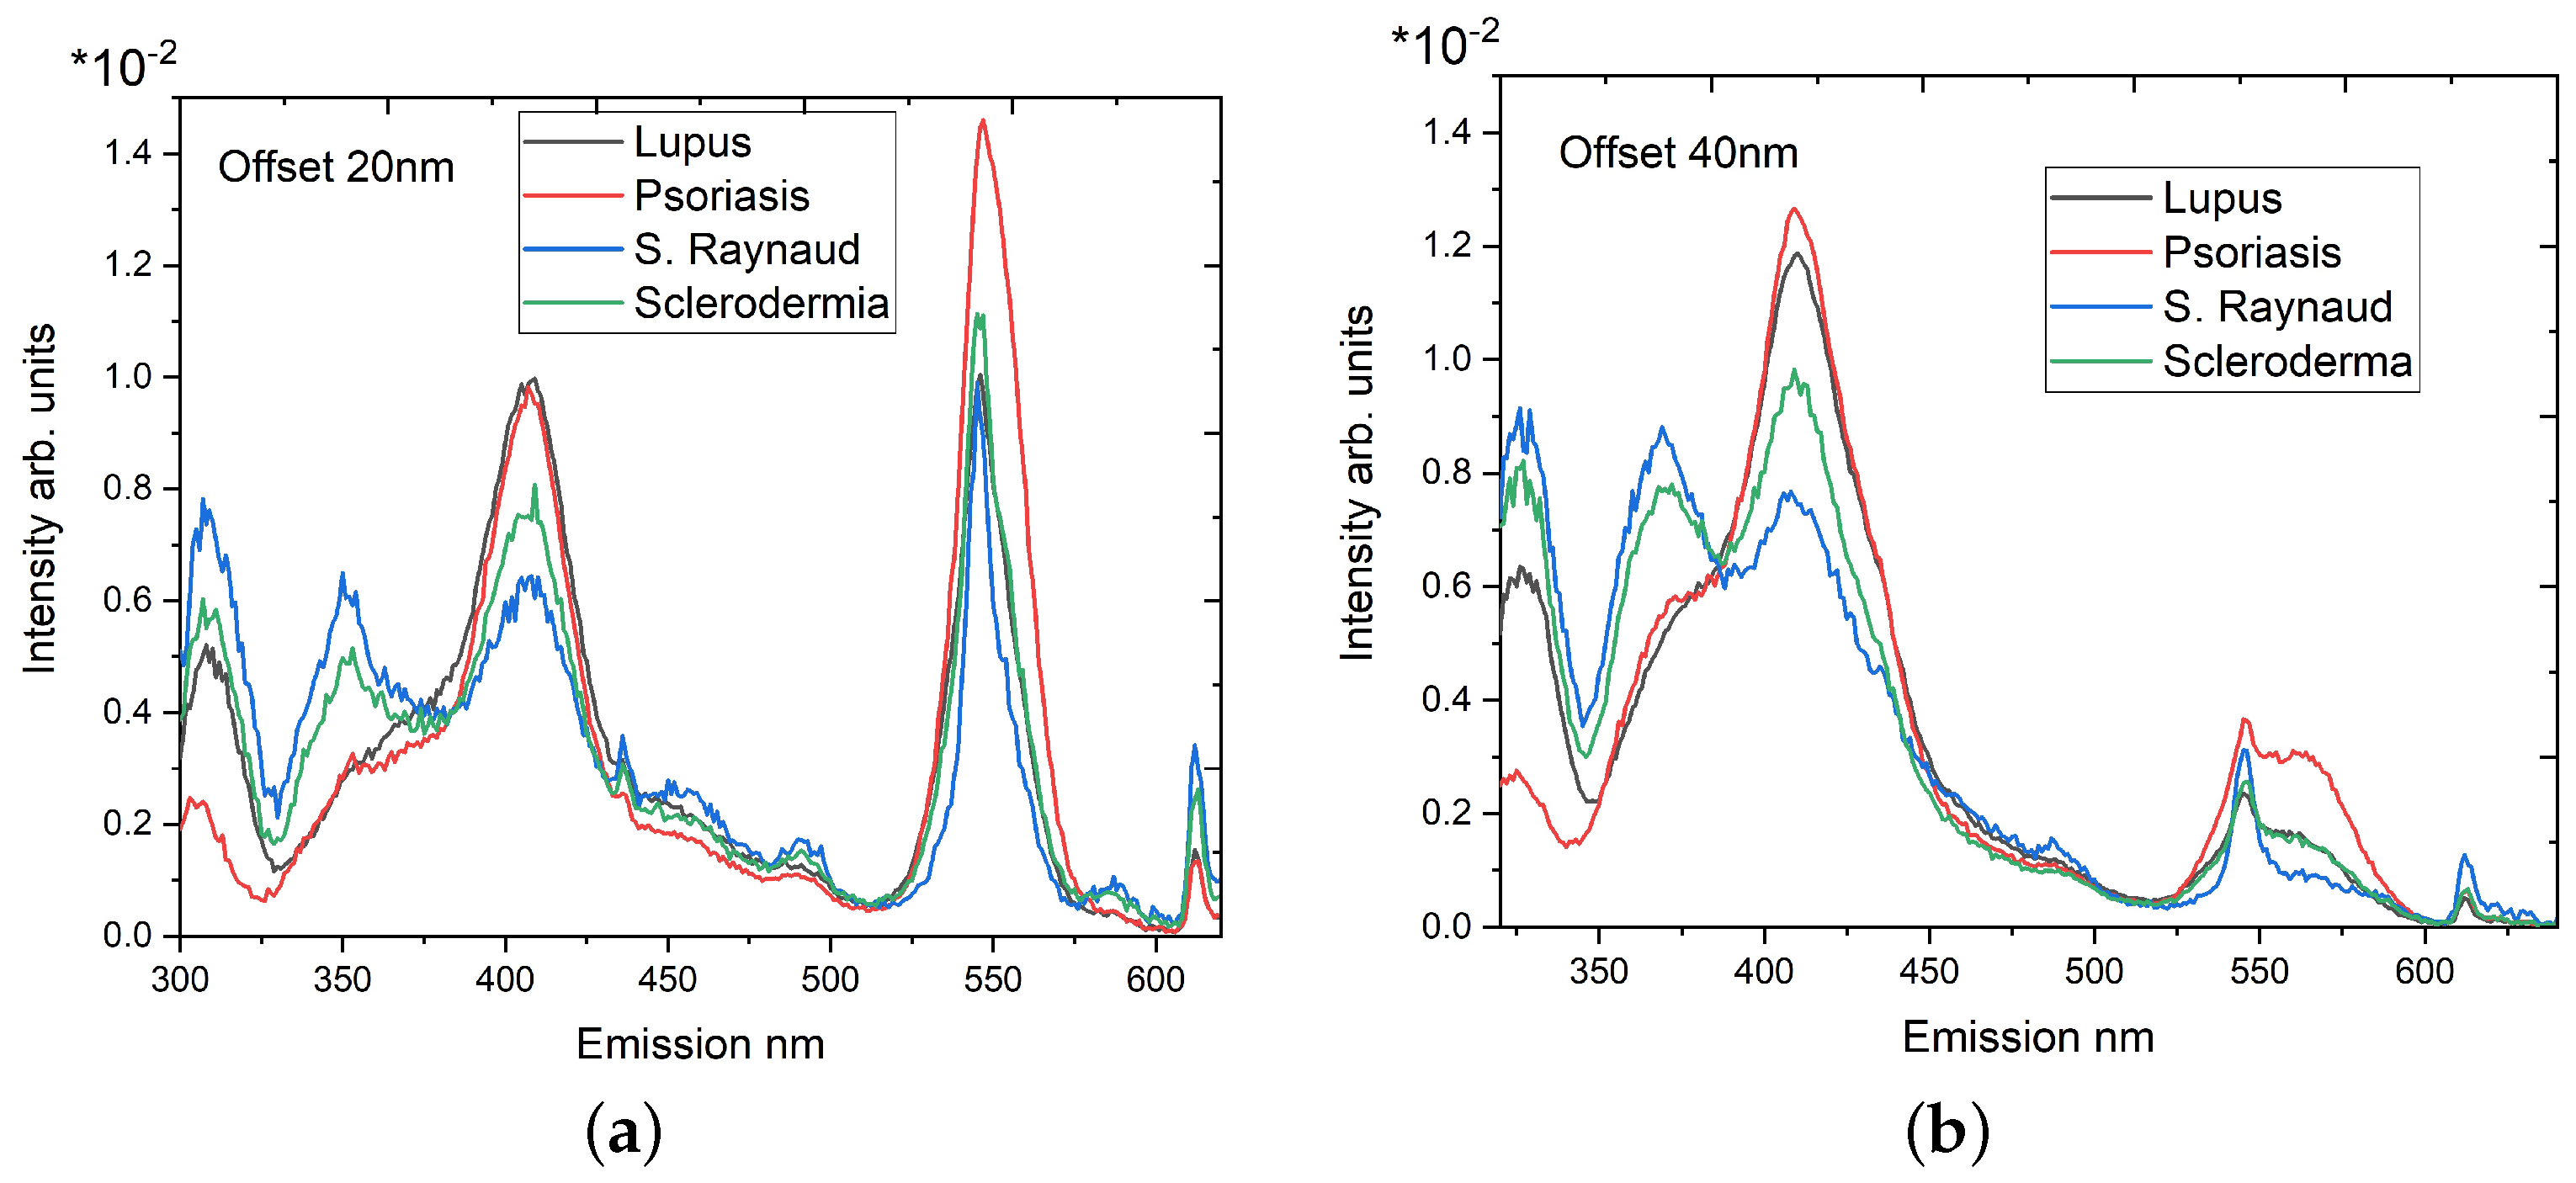
3.2. Synchronous Fluorescence Spectroscopy

All synchronous fluorescence spectra were normalized in respect to the total integrated area. This allowed us to minimize the effect of inter-patient differences and brought more reliability to the comparison of the spectral peculiarities of different samples. The total SFS obtained for the tissue slides of skin affected by lupus, psoriasis, Syndrome of Raynaud, and scleroderma are presented in Figure 6.
We expected to observe the main fluorophores in the fluorescence of the skin tissue slides that are listed in Table 2. Considering the processing of the samples, we did not expect to observe fluorescence from co-enzymes NADH and FAD. Additionally, while most of the free amino acids were washed out, there were still some residual traces of tyrosine, tryptophan, and phenylalanine in the collagen structure. Among the three compounds—phenylalanine, tyrosine, and tryptophan—phenylalanine has the highest content, followed by tyrosine, and lastly by tryptophan, which has the lowest content [31]. Since excitation with wavelengths longer than 280 nm is negligible for phenylalanine [32] and the content of tryptophan is three times lower than tyrosine [31], we suggested that the observed maximum at around 290 nm in Figure 6 was mostly contributed by tyrosine. There were two fluorescence maxima in the range of 310–420 nm, which were more prominent for the shorter wavelength offsets up to 50 nm. The first maximum might have been attributed to elastin fluorescence, while the second, around 400 nm, could be due to collagen and pepsin-digestible collagen cross-link fluorescence. The next maximum at 436 nm could be contributed to collagenase-digestible cross-links. The following maxima at 460 nm was also observed for collagen type I [27] and collagen type IV [28]. However, the next maximum at 490 nm was observed only for collagen type IV [28]. An interesting maximum is the one at 550 nm, since this fluorescence could be attributed mostly to the collagen–bilirubin complex in the processed skin samples. The final peak we will address is the one at 613 nm, which probably arises from the characteristic fluorescence of porphyrins [33].
We have chosen to focus on two wavelength offsets for the SFS: 20 nm and 40 nm (Figure 7a,b). The choice of these two offsets is a result of the following aspects:
  • Maximum number of fluorescence maxima are obtained in a single scan;
  • Offsets lower than 20 nm could include elastic scattering of the excitation light;
  • Longer wavelength offsets exhibit a worse spectral resolution;
  • Offsets greater than the Stokes shift of the dominating fluorophore mask smaller fluorescence maxima [36,37].

4. Discussion

The applied approach to process data from fluorescence microscopy images of collagen-related skin diseases revealed specific features. For instance, in the lupus sample, a notable change in the brightness interval was observed in the image obtained with excitation at 385 nm. This change included a decrease in the length of the localization interval and a shift in the position of the maximum brightness.
While no single excitation wavelength provided sufficient differences in fluorescence microscopy image data among the investigated samples, implementing a combination of the four wavelengths could aid in classification. As previously discussed, a parameter suitable for differentiation is the specific position of the brightness maxima. A comparison of the values of this parameter for the different pathologies and the applied excitation wavelengths is presented in Figure 8. The excitation wavelength of 385 nm provides good differentiation between the samples of Syndrome of Raynaud, psoriasis, and the overlapping brightness maximum positions of scleroderma and lupus erythematosus. Particularly, the sample of lupus erythematosus is distinctly separated from all other samples due to the position of its brightness maxima for an excitation wavelength of 470 nm. However, this task is not trivial, and the optimal approach would likely involve the implementation of a machine learning approach.
The utilization of synchronous fluorescence spectroscopy provided not only additional characteristics for differentiation between the investigated pathologies but also valuable insights into the origin of the observed fluorescence. The SFS technique gives the opportunity to obtain valuable information for multiple fluorophores with diagnostic meaning in a single scan, mainly due to the improved spectral resolution and reduced overlapping of fluorescence maxima [38,39,40].
The results presented in the previous section’s Figure 7 for SFS with offsets of 20 nm and 40 nm demonstrate some peculiar differences between the signals from the investigated samples.
There is a difference in the intensity of the observed amino acids’ fluorescence maximum. The sample of Syndrome of Raynaud demonstrates the highest intensity of amino acid fluorescence, while the sample of psoriasis exhibits the lowest. However, the intensities of lupus and scleroderma are too close to be considered significantly different.
The samples of psoriasis and lupus erythematosus both demonstrate a higher intensity for the maximum at 400 nm, in comparison with the samples of Syndrome of Raynaud and scleroderma. Exactly the opposite is observed for the maximum at 350 nm. Disregulation of elastogenesis has been previously observed in patients with psoriasis, which could be linked with the lower intensity of the respective fluorescence maximum (Figure 7) [41]. Loss of elastin is also typical for lupus erythematosus [42,43], and this can be observed when analyzing its fluorescence. On the contrary, higher depositions of elastin are typical for scleroderma [44,45], hence the higher intensity of the respective maximum around 350 nm (Figure 7).
The abnormal accumulation of collagen in the tissue is typical for psoriasis [46] and corresponds well with the observed higher fluorescence for the collagen- and pepsin-digestible collagen cross-link fluorescence.
The fluorescence maximum at 436 nm, which we have attributed to the collagenase-digestible collagen cross-links, is sufficiently prominent for all samples’ fluorescence, except for psoriasis.
Fluorescence maximum at 460 nm is observed for two types of collagen (type I and type IV) abundant in skin. The fluorescence of the sample of Syndrome of Raynaud demonstrates the highest intensity for this maximum. The fluorescence of keratin [47], with an excitation wavelength of 395 nm and emission maximum at 470 nm, could be considered as a contributor to the observed fluorescence from the samples of lupus erythematosus and Syndrome of Raynaud [48] since keratin build-up is observed for both pathological conditions. Lupus erythematosus causes follicular hyperkeratosis [49], characterized by keratin build-up. However, considering that keratin is mostly present in the epithelial layer and collagen in the underlying layers, the contribution of keratin to the overall fluorescence of the skin is often overshadowed by collagen [50].
The following maxima at 490 nm are characteristic for collagen type IV, which is primary network-forming and is mostly responsible for building basement membranes [51]. Alterations in skin affected by psoriasis include the infiltration of the dermal papillae into the epidermis with highly aligned collagen fibers assembled into thick, long collagen bundles and overall deformations in basement membrane [52]. The basement membrane in psoriatic skin demonstrates overexpression of type IV collagenase and a lower content of collagen type IV [53], which coincides with the observed lower intensity of the fluorescence maximum of collagen type IV’s fluorescence at 490 nm (Figure 7a).
Fluorescence of the collagen–bilirubin complex in skin is the most probable source of fluorescence at 550 nm, and it is more prominent in the SFS with an offset of 20 nm (Figure 7a). For a longer offset of 40 nm (Figure 7b), there is an additional maxima of 560 nm. Considering the processing of the tissue, it could be contributed to the melanin fluorescence [54]. For both maxima, the psoriasis sample is distinguished by having the highest fluorescence intensity.
All observed spectral features, which could be used for differentiation between the investigated pathologies, were discussed. As a result, we propose the following parameters for differentiation between psoriasis, lupus erythemathosus, scleroderma, and Syndrome of Raynaud, listed in Table 3.
Combination of at least two parameters listed in Table 3 gives good discrimination between the samples.
The most palpable drawback of our work is the limited number of samples, which are insufficient for a statistically significant evaluation. However, some of the spectral peculiarities could be clearly connected, specific to the the observed pathologies’ alterations. This is promising enough to propel us to further develop this techniques for their up-and-coming applications in digital histology.

5. Conclusions

In this work, we implemented colorimetric analysis for fluorescence images and synchronous fluorescence spectroscopy for the evaluation of diagnostically valuable parameters of unstained, deparaffinized skin tissue sections of four skin degenerative diseases—Syndrome of Raynaud, scleroderma, lupus erythematosus, and psoriasis. Although the scope of this study is entirely pilot-based, both approaches applied for the evaluation of skin tissue slides have shown promising potential to be utilized as optical contrast techniques for applications in digital histology. Considering that a plethora of different pathologies affect structural proteins [55,56,57,58,59] and that our approaches mostly reflect their alterations, they could possibly be applied for the identification and classification of other tissue-affecting diseases. Further steps in the assessment of the diagnostic potential of both methods require expanding the number of evaluated samples, conducting statistically significant evaluations, and implementing classification algorithms. Ultimately, the implementation of such techniques in clinical practice is challenging. Although the fluorescence microscopy is already used in clinical practice for histopathology, its standard protocol relays mostly on exogenous fluorescence dyes. At the same time the fluorescence from endogenous fluorophores is unwanted and usually filtered in some way. The current application of spectroscopic techniques in diagnostics is limited, mostly by the obstacle of translating laboratory techniques and methods in user-friendly clinical equipment with the same diagnostic accuracy. However, the intensive development of optical techniques for providing objective contrasts between classifications of normal and abnormal tissues is pushing digital pathology closer to its routine application for day-to-day diagnostics.

Author Contributions

Conceptualization and methodology, P.P. and T.G.; sample acquisition and preparation, P.T. and I.T.; writing—original draft preparation and review and editing, T.G. and P.P.; writing—review and editing L.Z.; funding acquisition, T.G. All authors have read and agreed to the published version of the manuscript.

Funding

The investigations were supported by the Bulgarian National Science Fund under grants #KP06-N28/11/2018 and #KP-06-N38/13/2019. The spectrofluorimetric equipment used was purchased under the NSF grant #DO-02-112/2008.

Institutional Review Board Statement

Ethical approval was not sought out for this particular study since this research was limited to the secondary use of previously collected tissue samples, with patients retaining their anonymity.

Informed Consent Statement

Written informed consent was obtained from all patients involved in this study.

Data Availability Statement

Due to both ethical and confidentiality reasons, the data are not available for redistribution.

Acknowledgments

All authors acknowledge the anonymous patients who volunteered for this study. The fluorescence microscopy images were obtained under the generous facilitation of Aquachim JSC, Bulgaria. The current article is also intended to pay special tribute in memory of Ekaterina Borisova.

Conflicts of Interest

The authors declare no conflicts of interest. The funders had no role in the design of this study; in the collection, analysis, or interpretation of data; in the writing of the manuscript; or in the decision to publish the results.

Abbreviations

The following abbreviations are used in this manuscript:
RGBRed, green, and blue
HSVHue, saturation, and value
HHue
SSaturation
VValue/brightness
SFSSynchronous fluorescence spectroscopy

References

  1. He, Z.; Wang, P.; Ye, X. Novel endoscopic optical diagnostic technologies in medical trial research: Recent advancements and future prospects. BioMed Eng. OnLine 2021, 20, 5. [Google Scholar] [CrossRef] [PubMed]
  2. Ilisanu, M.A.; Moldoveanu, F.; Moldoveanu, A. Multispectral Imaging for Skin Diseases Assessment—State of the Art and Perspectives. Sensors 2023, 23, 3888. [Google Scholar] [CrossRef]
  3. Pellacani, G.; Scope, A.; Gonzalez, S.; Guitera, P.; Farnetani, F.; Malvehy, J.; Witkowski, A.; De Carvalho, N.; Lupi, O.; Longo, C. Reflectance confocal microscopy made easy: The 4 must-know key features for the diagnosis of melanoma and nonmelanoma skin cancers. J. Am. Acad. Dermatol. 2019, 81, 520–526. [Google Scholar] [CrossRef] [PubMed]
  4. Yélamos, O.; Manubens, E.; Jain, M.; Chavez-Bourgeois, M.; Pulijal, S.V.; Dusza, S.W.; Marchetti, M.A.; Barreiro, A.; Marino, M.L.; Malvehy, J.; et al. Improvement of diagnostic confidence and management of equivocal skin lesions by integration of reflectance confocal microscopy in daily practice: Prospective study in 2 referral skin cancer centers. J. Am. Acad. Dermatol. 2020, 83, 1057–1063. [Google Scholar] [CrossRef]
  5. Borsari, S.; Pampena, R.; Lallas, A.; Kyrgidis, A.; Moscarella, E.; Benati, E.; Raucci, M.; Pellacani, G.; Zalaudek, I.; Argenziano, G.; et al. Clinical Indications for Use of Reflectance Confocal Microscopy for Skin Cancer Diagnosis. JAMA Dermatol. 2016, 152, 1093–1098. [Google Scholar] [CrossRef]
  6. Braghiroli, N.; Sugerik, S.; Rodrigues de Freitas, L.; Oliviero, M.; Rabinovitz, H. The skin through reflectance confocal microscopy—Historical background, technical principles, and its correlation with histopathology. An. Bras. Dermatol. 2022, 97, 697–703. [Google Scholar] [CrossRef]
  7. Yaroslavsky, A.N.; Salomatina, E.V.; Neel, V.; Anderson, R.R.; Flotte, T.J. Fluorescence polarization of tetracycline derivatives as a technique for mapping nonmelanoma skin cancers. J. Biomed. Opt. 2007, 12, 014005. [Google Scholar] [CrossRef]
  8. Ortega, S.; Halicek, M.; Fabelo, H.; Camacho, R.; Plaza, M.D.L.L.; Godtliebsen, F.; Callicó, G.M.; Fei, B. Hyperspectral Imaging for the Detection of Glioblastoma Tumor Cells in H&E Slides Using Convolutional Neural Networks. Sensors 2020, 20, 1911. [Google Scholar] [CrossRef] [PubMed]
  9. Wang, Y.; He, H.; Chang, J.; Zeng, N.; Liu, S.; Li, M.; Ma, H. Differentiating characteristic microstructural features of cancerous tissues using Mueller matrix microscope. Micron 2015, 79, 8–15. [Google Scholar] [CrossRef]
  10. Sieryi, O.; Ushenko, Y.; Ushenko, V.; Dubolazov, O.; Syvokorovskaya, A.V.; Vanchulyak, O.; Ushenko, A.G.; Gorsky, M.; Tomka, Y.; Bykov, A.; et al. Optical anisotropy composition of benign and malignant prostate tissues revealed by Mueller-matrix imaging. Biomed. Opt. Express 2022, 13, 6019–6034. [Google Scholar] [CrossRef]
  11. Sanborn, W.R.; Heuck, C.C.; El Aouad, R.; Storch, W.B. Fluorescence Microscopy for Disease Diagnosis and Environmental Monitoring; World Health Organization: Geneva, Switzerland, 2005; pp. 19–23. [Google Scholar]
  12. Shi, R.B.; Qiu, J.; Maida, V. Towards algorithm-enabled home wound monitoring with smartphone photography: A hue-saturation-value colour space thresholding technique for wound content tracking. Int. Wound J. 2019, 16, 211–218. [Google Scholar] [CrossRef] [PubMed]
  13. Usman, M.A.; Satrya, G.B.; Usman, M.R.; Shin, S.Y. Detection of small colon bleeding in wireless capsule endoscopy videos. Comput. Med Imaging Graph. 2016, 54, 16–26. [Google Scholar] [CrossRef] [PubMed]
  14. Mandal, S.; Chaudhuri, S.S. Polyps Segmentation using Fuzzy Thresholding in HSV Color Space. In Proceedings of the 2020 IEEE-HYDCON, Hyderabad, India, 11–12 September 2020; IEEE: Piscataway Township, NJ, USA, 2020; pp. 1–5. [Google Scholar]
  15. Satrya, G.B.; Ramatryana, I.N.A.; Shin, S.Y. Compressive Sensing of Medical Images Based on HSV Color Space. Sensors 2023, 23, 2616. [Google Scholar] [CrossRef] [PubMed]
  16. Lloyd, J. Synchronized excitation of fluorescence emission spectra. Nat. Phys. Sci. 1971, 231, 64–65. [Google Scholar] [CrossRef]
  17. Vo-Dinh, T. Multicomponent analysis by synchronous luminescence spectrometry. Anal. Chem. 1978, 50, 396–401. [Google Scholar] [CrossRef] [PubMed]
  18. Kumar, K.; Tarai, M.; Mishra, A.K. Unconventional steady-state fluorescence spectroscopy as an analytical technique for analyses of complex-multifluorophoric mixtures. TrAC Trends Anal. Chem. 2017, 97, 216–243. [Google Scholar] [CrossRef]
  19. Borisova, E.; Gisbrecht, A.; Genova-Hristova, T.; Troyanova, P.; Pavlova, E.; Penkov, N.; Bratchenko, I.; Zakharov, V.; Lihachova, I.; Kuzmina, I.; et al. Multispectral autoflourescence detection of skin neoplasia using steady-state techniques. In Proceedings of the 20th International Conference and School on Quantum Electronics: Laser Physics and Applications, Nessebar, Bulgaria, 17–21 September 2018; p. 1104704. [Google Scholar]
  20. Borisova, E.; Zhelyazkova, A.; Keremedchiev, M.; Penkov, N.; Semyachkina-Glushkovskaya, O.; Avramov, L. Endogenous synchronous fluorescence spectroscopy (SFS) of basal cell carcinoma-initial study. Opt. Spectrosc. 2016, 120, 38–44. [Google Scholar] [CrossRef]
  21. Genova, T.; Borisova, E.; Penkov, N.; Vladimirov, B.; Zhelyazkova, A.; Avramov, L. Excitation—Emission matrices and synchronous fluorescence spectroscopy for cancer diagnostics in gastrointestinal tract. Quantum Electron. 2016, 46, 510. [Google Scholar] [CrossRef]
  22. Genova, T.; Borisova, E.; Zhelyazkova, A.; Penkov, N.; Vladimirov, B.; Terziev, I.; Semyachkina-Glushkovskaya, O.; Avramov, L. Colorectal cancer stage evaluation using synchronous fluorescence spectroscopy technique. Opt. Quant. Electron. 2016, 48, 378. [Google Scholar] [CrossRef]
  23. Gibbs, S.L.; Genega, E.; Salemi, J.; Kianzad, V.; Goodwill, H.L.; Xie, Y.; Oketokoun, R.; Khurd, P.; Kamen, A.; Frangioni, J.V. Near-Infrared Fluorescent Digital Pathology for the Automation of Disease Diagnosis and Biomarker Assessment. Mol. Imaging 2015, 14, 1–9. [Google Scholar] [CrossRef]
  24. Smith, A.R. Color gamut transform pairs. SIGGRAPH Comput. Graph. 1978, 12, 12–19. [Google Scholar] [CrossRef]
  25. Rangayyan, R.M.; Acha, B.; Serrano, C. Color Image Processing with Biomedical Applications; SPIE Press: Bellingham, WA, USA, 2011; pp. 12–15. [Google Scholar]
  26. Zheng, W.; Lau, W.; Cheng, C.; Chee Soo, K.; Olivo, M. Optical excitationemission wavelengths for autofluorescence diagnosis of bladder tumors. Int. J. Cancer 2003, 104, 477–481. [Google Scholar] [CrossRef] [PubMed]
  27. Kuehn, A.; Graf, A.; Wenzel, U.; Princz, S.; Mantz, H.; Hessling, M. Development of a highly sensitive spectral camera for cartilage monitoring using fluorescence spectroscopy. J. Sens. Sens. Syst. 2015, 4, 289–294. [Google Scholar] [CrossRef]
  28. Smirnova, O.D.; Rogatkin, D.A.; Litvinova, K.S. Collagen as In Vivo Quantitative Fluorescent Biomarkers of Abnormal Tissue Changes. J. Innov. Opt. Health Sci. 2012, 5, 1250010. [Google Scholar] [CrossRef]
  29. Nagarajan, U.; Christopher, J.G.; Jonnalagadda, R.R.; Chandrasekaran, B.; Balachandran, U.N. Studies on the chemico-biological characteristics of bilirubin binding with collagen. Mater. Sci. Eng. C 2013, 33, 4965–4971. [Google Scholar] [CrossRef] [PubMed]
  30. Wang, M.; Long, F.; Tang, F.; Jing, Y.; Wang, X.; Yao, L.; Ma, J.; Fei, Y.; Chen, L.; Wang, G.; et al. Autofluorescence Imaging and Spectroscopy of Human Lung Cancer. Appl. Sci. 2017, 7, 32. [Google Scholar] [CrossRef]
  31. Bolboacă, S.; Jantschi, L. Amino acids sequence analysis on collagen. Bull. USAMV-CN 2007, 63–64, 311–316. [Google Scholar]
  32. Martin Tornero, E.; Sierra-Tadeo, F.; Durán-Merás, I.; Espinosa-Mansilla, A. Phenylalanine Photoinduced Fluorescence and Characterization of the Photoproducts by LC-MS. J. Fluoresc. 2019, 29, 1445–1455. [Google Scholar] [CrossRef] [PubMed]
  33. König, K.; Meyer, H.; Schneckenburger, H.; Schneckenburger, H.; Rück, A. The study of endogenous porphyrins in human skin and their potential for photodynamic therapy by laser induced fluorescence spectroscopy. Laser Med. Sci. 1993, 8, 127–132. [Google Scholar] [CrossRef]
  34. Kollias, N.; Gillies, R.; Moran, M.; Kochevar, I.E.; Anderson, R.R. Endogenous Skin Fluorescence In Vivo on Human Skin. J. Invest. Dermatol. 1998, 111, 776–780. [Google Scholar] [CrossRef] [PubMed]
  35. Muir, R.; Forbes, S.; Birch, D.J.S.; Vyshemirsky, V.; Rolinski, O.J. Collagen Glycation Detected by Its Intrinsic Fluorescence. J. Phys. Chem. B. 2021, 125, 11058–11066. [Google Scholar] [CrossRef] [PubMed]
  36. Gnanatheepam, E.; Kanniyappan, U.; Dornadula, K.; Prakasarao, A.; Singaravelu, G. Synchronous Luminescence Spectroscopy as a Tool in the Discrimination and Characterization of Oral Cancer Tissue. J. Fluoresc. 2019, 29, 361–367. [Google Scholar] [CrossRef] [PubMed]
  37. Singaravelu, G.; Gnanatheepam, E.; Prakasarao, A. Synchronous luminescence spectroscopy of tryptophan in head and neck cancer. In Biophotonics, Tryptophan and Disease; Sordillo, L.A., Sordillo, P.P., Eds.; Academic Press: Cambridge, MA, USA, 2022; pp. 147–155. [Google Scholar]
  38. Alfano, R.R.; Yang, Y. Stokes shift emission spectroscopy of human tissue and key biomolecules. IEEE J. Sel. Top Quantum Electron 2003, 9, 148–153. [Google Scholar] [CrossRef]
  39. Liu, Q.; Grant, G.; Vo-Dinh, T. Investigation of synchronous fluorescence method in multicomponent analysis in tissue. IEEE J. Sel. Top. Quantum Electron. 2010, 16, 927–940. [Google Scholar]
  40. Devi, S.; Mozumder, M.; Ghosh, N.; Pradhan, A. Extraction of masked fluorescence peaks through synchronous fluorescence spectroscopy. In Imaging, Manipulation, and Analysis of Biomolecules, Cells, and Tissues X; SPIE Press: Bellingham, WA, USA, 2012; Volume 8225, p. 822517. [Google Scholar]
  41. Karas, A.; Holmannova, D.; Borsky, P.; Fiala, Z.; Andrys, C.; Hamakova, K.; Svadlakova, T.; Palicka, V.; Krejsek, J.; Rehacek, V.; et al. Significantly Altered Serum Levels of NAD, AGE, RAGE, CRP, and Elastin as Potential Biomarkers of Psoriasis and Aging—A Case-Control Study. Biomedicines 2022, 10, 1133. [Google Scholar] [CrossRef] [PubMed]
  42. Schmitt, D.; Thivolet, J.; Perrot, H. Ultrastructural study of the cutaneous elastic fibres in lupus erythematosus. Br. J. Dermatol. 1972, 87, 355–360. [Google Scholar] [CrossRef] [PubMed]
  43. Jeong, N.; Park, S.; Im, M.; Seo, Y.; Lee, J.; Lee, Y. Eruptive anetoderma in a patient with systemic lupus erythematosus. Ann. Dermatol. 2014, 26, 621–623. [Google Scholar] [CrossRef]
  44. Quaglino, D., Jr.; Bergamini, G.; Boraldi, F.; Manzini, E.; Davidson, J.; Pasquali, R. Connective tissue in skin biopsies from patients suffering systemic sclerosis. J. Submi.-Crosc. Cytol. Pathol. 1996, 28, 287–296. [Google Scholar]
  45. Chatterjee, S.; Mark, M.E.; Wooley, P.H.; Lawrence, W.D.; Mayes, M.D. Increased dermal elastic fibers in the tight skin mouse. Clin Exp Rheumatol. 2004, 22, 617–620. [Google Scholar] [PubMed]
  46. Koivukangas, V.; Kallionen, M.; Karvonen, J.; Autio-Harmainen, H.; Risteli, J.; Risteli, L.; Oikarinen, A. Increased Collagen Synth. Psoriasis Vivo. Arch. Dermatol. Res. 1995, 287, 171–175. [Google Scholar] [CrossRef]
  47. Zheng, W.; Wu, Y.; Li, D.; Qu, J.Y. Autofluorescence of epithelial tissue: Single-photon versus two-photon excitation. J. Biomed. Opt. 2008, 13, 054010. [Google Scholar] [CrossRef] [PubMed]
  48. Yang, J.H.; Kim, J.W.; Park, H.S.; Jang, S.J.; Choi, J.C. Calcinosis cutis of the fingertip associated with Raynaud’s phenomenon. J. Dermatol. 2006, 33, 884–886. [Google Scholar] [CrossRef]
  49. Guleva, D.; Balabanova, M.; Miteva, L.; Dourmishev, L. Histology of Skin Alterations in Lupus Erythematosus. Acta Medica Bulg. 2022, 49, 28–32. [Google Scholar] [CrossRef]
  50. Wu, Y.; Xi, P.; Qu, J.Y.; Cheung, T.H.; Yu, M.Y. Depth-resolved fluorescence spectroscopy reveals layered structure of tissue. Opt. Express 2004, 12, 3218–3223. [Google Scholar] [CrossRef]
  51. Sand, J.M.B.; Genovese, F.; Karsdal, M.A. Type IV Collagen. Biochemistry of Collagens, Laminins and Elastin; Karsdal, M.A., Ed.; Academic Press: Cambridge, MA, USA, 2016; pp. 31–41. [Google Scholar]
  52. Balsini, P.; Weinzettl, P.; Samardzic, D.; Zila, N.; Buchberger, M.; Tschandl, P.; Wielscher, M.; Weninger, W.; Pfisterer, K. Stiffness-dependent LOX regulation via HIF-1 drives extracellular matrix modifications in psoriasis. bioRxiv 2024. preprint. [Google Scholar] [CrossRef]
  53. Fleischmajer, R.; Kuroda, K.; Hazan, R.; Gordon, R.E.; Lebwohl, M.G.; Sapadin, A.N.; Unda, F.; Iehara, N.; Yamada, Y. Basement membrane alterations in psoriasis are accompanied by epidermal overexpression of MMP-2 and its inhibitor TIMP-2. J. Investig. Dermatol. 2000, 115, 771–777. [Google Scholar] [CrossRef]
  54. Ustinova, A.O.; Bratchenko, I.A.; Artemyev, D.N. Monte Carlo simulation of skin multispectral autofluorescence. J. Biomed. Photonics Eng. 2019, 5, 020306. [Google Scholar] [CrossRef]
  55. Deshmukh, S.; Dive, A.; Moharil, R.; Munde, P. Enigmatic insight into collagen. J. Oral Maxillofac. Pathol. 2016, 20, 276–283. [Google Scholar] [CrossRef]
  56. Xu, S.; Xu, H.; Wang, W.; Li, S.; Li, H.; Li, T.; Zhang, W.; Yu, X.; Liu, L. The role of collagen in cancer: From bench to bedside. J. Transl. Med. 2019, 17, 309. [Google Scholar] [CrossRef] [PubMed]
  57. Winkler, J.; Abisoye-Ogunniyan, A.; Metcalf, K.J.; Werb, Z. Concepts of extracellular matrix remodelling in tumour progression and metastasis. Nat. Commun. 2020, 11, 5120. [Google Scholar] [CrossRef]
  58. Saletnik, Ł.; Wesołowski, R. Fluorescent spectroscopy of collagen as a diagnostic tool in medicine. J. Med. Sci. 2022, 91, e584. [Google Scholar] [CrossRef]
  59. Raineri, D. The Role of Extracellular Matrix Proteins in Pathogenesis. Int. J. Mol. Sci. 2024, 25. [Google Scholar]
Figure 1. Emission spectra in the range of 420–700 nm for an excitation wavelength of 405 nm of all samples used for normalization of the image data.
Photonics 11 00687 g001
Figure 2. An overlay of the fluorescence microscopy images for different excitation wavelengths and detection ranges for lupus erythematosus (a), psoriasis (b), Syndrome of Raynaud (c), and scleroderma (d).
Photonics 11 00687 g002
Figure 3. Histogram assembled by the histograms for the four differently colored images of one sample.
Photonics 11 00687 g003
Figure 4. The brightness distribution for the fluorescence microscopy images (the respective graphics inserts) of skin affected by lupus erythematosus. The image in blue pseudo color (a) is obtained with excitation at 385 nm, the image (b) in pseudo color green—at 470 nm, the image (c) in pseudo color yellow—at 565 nm, and the image (d) in pseudo color red—at 625 nm. The red line “Emission” represents the brightness distribution for the fluorescence, and the black line “Base” represents the brightness distribution for an image without fluorescence.
Photonics 11 00687 g004
Figure 5. Distribution of brightness values obtained from the fluorescence microscope images for four excitation wavelengths: (a) 385 nm; (b) 470 nm; (c) 565 nm; and (d) 625 nm. The detection for all excitation wavelengths in the ranges 410–440 nm; 499–529 nm; 580–604 nm; and 659–759 nm.
Photonics 11 00687 g005
Figure 6. SFS for the samples of lupus erythematosus (a), psoriasis (b), Syndrome of Reynaud (c), and scleroderma (d). The SFS with different offsets are represented with different colors. The offsets between the excitation and emission wavelengths are between 10 and 90 nm, with increments of 10 nm.
Photonics 11 00687 g006
Figure 7. SFS for offsets of 20 nm (a) and 40 nm (b) for the four pathologies: lupus, psoriasis, Syndrome of Reynaud, and scleroderma.
Photonics 11 00687 g007
Figure 8. A comparison of the values of the maximum brightness position for the different pathologies (marker according to the legend) for the applied excitation wavelengths.
Photonics 11 00687 g008
Table 1. Distribution of the integrated signal from the fluorescence images to RGB channels.
Image Pseudo ColorRGB
Red659–759 nm;
NS *
NSNS
Yellow580–604 nm;
659–759 nm;
NS
580–604 nm;
659–759 nm;
NS
NS
GreenNS499–529 nm;
580–604 nm;
659–759 nm;
NS
NS
BlueNSNS410–440 nm;
499–529 nm;
580–604 nm;
659–759 nm;
NS
* NS denotes noise and available black and white fields (pixels).
Table 2. Excitation and emission maxima of the main fluorophores addressed in the skin tissue slides of psoriasis, lupus erythematosus, Syndrome of Raynaud, and scleroderma [34,35].
FluorophoreExcitation nmEmission Maxima nm
Tyrosin275–290305
Elastin290, 325340, 400
Collagen325400, 405
Collagen cross-links, collagenase digestible360440
Collagen cross-links, pepsin digestible340400
Collagen–bilirubin complex [29]300550
Table 3. Parameters suitable for differentiation between tissue samples of psoriasis, lupus erythemathosus, scleroderma, and Syndrome of Raynaud.
ParameterSyndrome of RaynaudSclerodermaLupusPsoriasis
Offset 20 nm
I 407 / 351 1.0073 ± 0.03761.5252 ± 0.02313.3883 ± 0.05663.1711 ± 0.0501
I 547 / 308 1.1406 ± 0.03291.8825 ± 0.06041.9047 ± 0.03856.27 ± 0.2142
Offset 40 nm
I 409 / 368 0.8650 ± 0.00961.2676 ± 0.00782.3652 ± 0.02812.2982 ± 0.0102
I 327 / 546 2.7789 ± 0.11631.1644 ± 0.01672.6984 ± 0.05640.7171 ± 0.0308
Disclaimer/Publisher’s Note: The statements, opinions and data contained in all publications are solely those of the individual author(s) and contributor(s) and not of MDPI and/or the editor(s). MDPI and/or the editor(s) disclaim responsibility for any injury to people or property resulting from any ideas, methods, instructions or products referred to in the content.

