Article

Application of Gap Mode Ultrasensitive P-GERTs in SERS-Based Rapid Detection

by
Mingzhong Zhang
1,†,
Shanshan Xu
2,†,
Peng-Cheng Guan
3,
Yue-Jiao Zhang
1,* and
Jian-Feng Li
1,2,3,4,5,*
1
College of Energy, Xiamen University, Xiamen 361005, China
2
College of Chemistry and Chemical Engineering, Xiamen University, Xiamen 361005, China
3
College of Materials, Xiamen University, Xiamen 361005, China
4
Scientific Research Foundation of State Key Laboratory of Vaccines for Infectious Diseases, Xiamen 361005, China
5
Xiang An Biomedicine Laboratory, Xiamen 361005, China
*
Authors to whom correspondence should be addressed.
These authors contributed equally to this work.
Photonics 2024, 11(8), 708; https://doi.org/10.3390/photonics11080708
Submission received: 1 July 2024 / Revised: 22 July 2024 / Accepted: 24 July 2024 / Published: 30 July 2024
(This article belongs to the Special Issue Research, Development and Application of Raman Scattering Technology)

Abstract

:
In surface-enhanced Raman scattering (SERS) detection research, the shape, structure, surface modification, and material selection of nanoparticles can significantly impact the SERS intensity. Petal-like gap-enhanced Raman tags (P-GERTs) possess numerous sharp tips and edges, which generate localized electric field enhancements, further amplifying the electric field enhancement effect on neighboring molecules and enhancing the SERS signal. Additionally, the surface of P-GERTs can be modified with functional molecules, enabling their application in the detection of disease biomarkers. Using COVID-19 as an example, the performance of P-GERTs in disease biomarker detection was validated, demonstrating that the signal intensity of this probe can reach 55 times that of regular gold nanoparticles and 36.7 times that of smooth shell gap-enhanced Raman tags (S-GERTs). Furthermore, in combination with magnetically retrievable magnetic bead substrates, the N-protein antigen was specifically detected in a one-step process. N-protein was detected within 15 min using a portable Raman spectrometer. The limit of detection (LOD) for the standard sample was 4.28 pg/mL, and the LOD for the actual throat swab sample system was 25.4 pg/mL. This workflow can be extended to the detection of other biomarkers, making it widely applicable.

1. Introduction

Surface-enhanced Raman scattering (SERS), as an analytical technique, has been widely applied in various scientific fields [1]. SERS tags based on plasmonic nanostructures have attracted great interest in biomedical applications such as disease biomarker detection [2,3,4], circulating tumor cell detection [5], the sensing of cellular microenvironments [6], and cellular/tissue imaging [7]. This technique utilizes the plasmon resonance effect on the surface of metal nanoparticles to significantly enhance the electromagnetic (EM) signal, effectively overcoming the low sensitivity limitations of traditional colorimetric or fluorescence detection. In summary, SERS offers high sensitivity, high specificity, and molecular-level analytical capabilities in the detection of biological markers [8]. It holds vast potential in biomedical research, clinical diagnostics, and drug development, serving as a powerful tool for the detection and analysis of disease biomarkers.
The synthesis of sensitive and stable label particles is crucial in SERS detection. The shape, structure, surface modification, and material selection of nanoparticles can significantly impact the SERS intensity [9]. By optimizing these factors, stronger SERS enhancement can be achieved, thereby improving the sensitivity and reliability of detection. Yang et al. synthesized porous Au–Ag alloy nanoparticles to amplify Raman signals for the multiplexed immunoanalysis of carcinoembryonic antigen (CEA) and alpha-fetoprotein (AFP), achieving detection limits of 1.22 × 10⁻⁸ ng/mL and 2.47 × 10⁻⁵ ng/mL, respectively [10]. Luo et al. designed a core-satellite-assembled Au@label@Ag@Au SERS tag for the highly sensitive detection of microcystin, achieving a detection limit of 0.8 pM [11].
The weak intensity of typical Raman labels severely limits the sensitivity of SERS detection [12]. Previous studies have demonstrated that nanostructures with sharp tips or edges can generate stronger, localized electric field enhancement, thereby enhancing the SERS signal [13]. Researchers have made significant efforts to create such “hotspots” for SERS enhancement. Petal-like gap-enhanced Raman tags (P-GERTs), which are gold nanoparticles with numerous sharp tips and edges, can generate localized electric field enhancement, amplifying the electric field enhancement effect on neighboring molecules [7,14]. This localized electric field enhancement effect significantly enhances the Raman scattering signal of nearby molecules. The gaps and cross-points between the branches and tendrils of the gold nanoflowers can result in charge accumulation and electric field enhancement. Additionally, the surface of P-GERTs can be chemically modified, for example, by adsorbing molecules or functional molecules such as antibodies, DNA, etc. [15,16]. These modifications can enhance the interaction between P-GERTs and target molecules, further boosting the SERS signal. Therefore, P-GERTs have great potential in the SERS detection of disease biomarkers.
In this study, we utilized the petal-like shell structure and larger surface area of P-GERTs to generate abundant strong electromagnetic (EM) hotspots, resulting in a 55-fold enhancement in SERS signal intensity compared to regular gold nanoparticles, and a 36.7-fold enhancement compared to smooth shell gap-enhanced Raman Tags (S-GERTs) with spherical gap-enhanced structures. In the synthesis of P-GERTs, thiol molecules are used as bridges. Therefore, thiol molecules not only play a role during the synthesis process, but they also serve as signal molecules, eliminating the need for additional modification of the signal molecules and improving the repeatability of the particles. To validate the application of P-GERTs in the SERS detection of disease biomarkers, we used the nucleocapsid (N) protein of the novel coronavirus (SARS-CoV-2) as an example [17]. As shown in the schematic in Figure 1, the N protein antigen has multiple spatial sites on its surface that can bind simultaneously to various antibodies through specific antigen–antibody recognition. Different antibodies recognizing the N protein antigen are modified on both P-GERT and magnetic beads, allowing them to bind to the N protein simultaneously, forming a “sandwich-like” complex. The magnetic beads, attracted by a magnet, can rapidly separate the formed complexes from the solution, enriching the N protein. The incubation process involves a simple and rapid one-step mode to form a sandwich structure. SEM images of the sandwich structure are displayed in Figure 1b. Nanoprobes prepared based on single-particle P-GERTs contributed to the quantitative detection of the virus, achieving a detection limit of 4.28 pg/mL for the novel coronavirus. This system not only offers a low detection limit, but it also maintains advantages such as low cost, simple operation, high accuracy, and fast speed. This approach can also be applied to the detection of other systems.

2. Materials and Methods

2.1. Reagents

Chloroauric acid (HAuCl4·H2O) 99.0%, trisodium citrate (C6H5Na3O7) 99.0%, sodium phosphate (Na2HPO4) 99.5%, sodium bicarbonate (NaHCO3) 99.5%, magnesium chloride (MgCl2) 99.5%, and sodium hydroxide (NaOH) 96.0% were purchased from China National Pharmaceutical Group Chemical Reagent Co., Ltd. Ascorbic acid (AA) 99.7% was purchased from Shanghai Hu Trial Environmental Protection Reagent Technology Co., Ltd. (Shanghai, China). Sodium dihydrogen phosphate (NaH2PO4) 99.0% and potassium dihydrogen phosphate (KH2PO4) 99.5% were purchased from Xilong Scientific Co., Ltd. (Shantou, (Guangdong) China). p-Nitrophenyl thiol (40-NBT), 4-mercaptobenzonitrile (4-MBN), 3-methoxyphenyl thiol (3-MeoBT), and 2-naphthalenethiol (2-NT) were all purchased from Shanghai Aladdin Bio-Chem Technology Co., Ltd. (Shanghai, China). N-Hexadecyltrimethylammonium Chloride (CTAC) (C19H42ClN) 99.0%, 1-Ethyl-3-(3-dimethylaminopropyl) carbodiimide (EDC), and N-Hydroxysuccinimide (NHS) were purchased from Shanghai yuanye Bio-Technology Co., Ltd. (Shanghai, China). The capture antibodies and detection antibodies were both obtained from Vazyme Biotech Co., Ltd. (Nanjing, (Jiangsu), China).

2.2. Synthesis of GERTs

Synthesis of the Au seed: In a 10 mL solution of 0.1 M CTAC, add 515 µL of a 4.86 mM HAuCl4 solution and sonicate vigorously. Then, at 30 °C, add 450 µL of 0.02 M NaBH4, sonicate for uniform mixing, and let it stand for 1 h.
Synthesis of 20 nm-sized Au NPs: In a 15 mL solution of 0.1 M CTAC, add 515 µL of a 5 M chloroauric acid solution and 75 µL of a 0.04 M AA solution. Then, add 100 µL of the diluted 10-fold Au seed solution and stir continuously at 40 °C for 1 h to obtain approximately 22 nm-sized Au NPs.
Modification with thiol molecules: Add 500 µL of a 10 mM thiol solution (4-NBT/4-MBN/2-NT/3-MeoBT) to the obtained 10 mL of gold nanosphere sol and sonicate at 30 °C for 30 min. Then, wash the solution three times with a 0.05 M CTAC solution. Finally, resuspend the thiol-modified Au cores in 5 mL of a 0.05 M CTAC solution. If other thiol-labeled molecules are needed, simply add 4-NBT at the same concentration during gold core modification.
Synthesis of P-GERTs and S-GERTs: Add 1 mL of a 4-NBT-modified Au core sol to a mixture of 16 mL of a 0.05 M CTAC solution, 480 µL of a 0.04 M AA, and 960 µL of a 5 mM HAuCl4 growth solution. The solution color changes from colorless to pink, purple, and blue, resulting in thiol-modified, petal-shaped, and gap-enhanced nanoparticles. Wash the solution with a 0.025 M CTAC solution to obtain the final solution [18,19].

2.3. Synthesis of the SERS Tags

First, wash 4 mL of P-GERTs with a 0.02 M CTAC solution and then adjust the volume to half of the original with PBS. Add 8 µL of a 10 mM DSP solution to the P-GERTs solution and incubate at 30 °C and 700 rpm for 30 min. After the incubation, wash the solution with PBS to remove the excess DSP solution and adjust the volume to 800 µL. Add the antibody at a concentration of 100 mg/mL and incubate overnight at 4 °C in an inverted position in the refrigerator. After centrifugation of the obtained solution, block it with a 0.05% BSA concentration in PBS for 1 h, followed by centrifugation. Finally, adjust the volume with a BSA solution to 4 mL for storage.

2.4. Detection of N Protein

Preparation of sandwich structure complexes. First, resuspend SERS nanoprobes conjugated with detection antibodies and magnetic beads conjugated with capture antibodies in a PBS buffer containing different concentrations of the antigen. Incubate the resulting solution on a fast oscillation platform for 10 min. Finally, wash the complexes three times with PBS-T buffer and separate the sandwich structure complexes using a magnet to complete the enrichment and achieve specific detection of the N protein. This sensor’s experimental steps are simple, low-cost, reproducible, and exhibit good linear fitting, making it suitable for large-scale and rapid screening.

2.5. Characterization Equipment

Field emission scanning electron microscopy (SEM) images were obtained using a Zeiss Gemini SEM 500 instrument (Jena, (Baden-Württemberg), Germany) at an accelerating voltage of 3 kV. The UV−vis absorption spectra were measured with a UV−vis spectrophotometer (Shimadzu, Japan, UV1280). A portable Raman spectrometer (SHINS-P785V) with a 785 nm laser were employed for Raman spectral collection and were obtained from Xiamen SHINs Technology Co., Ltd. (Xiamen, (Fujian), China).

3. Results

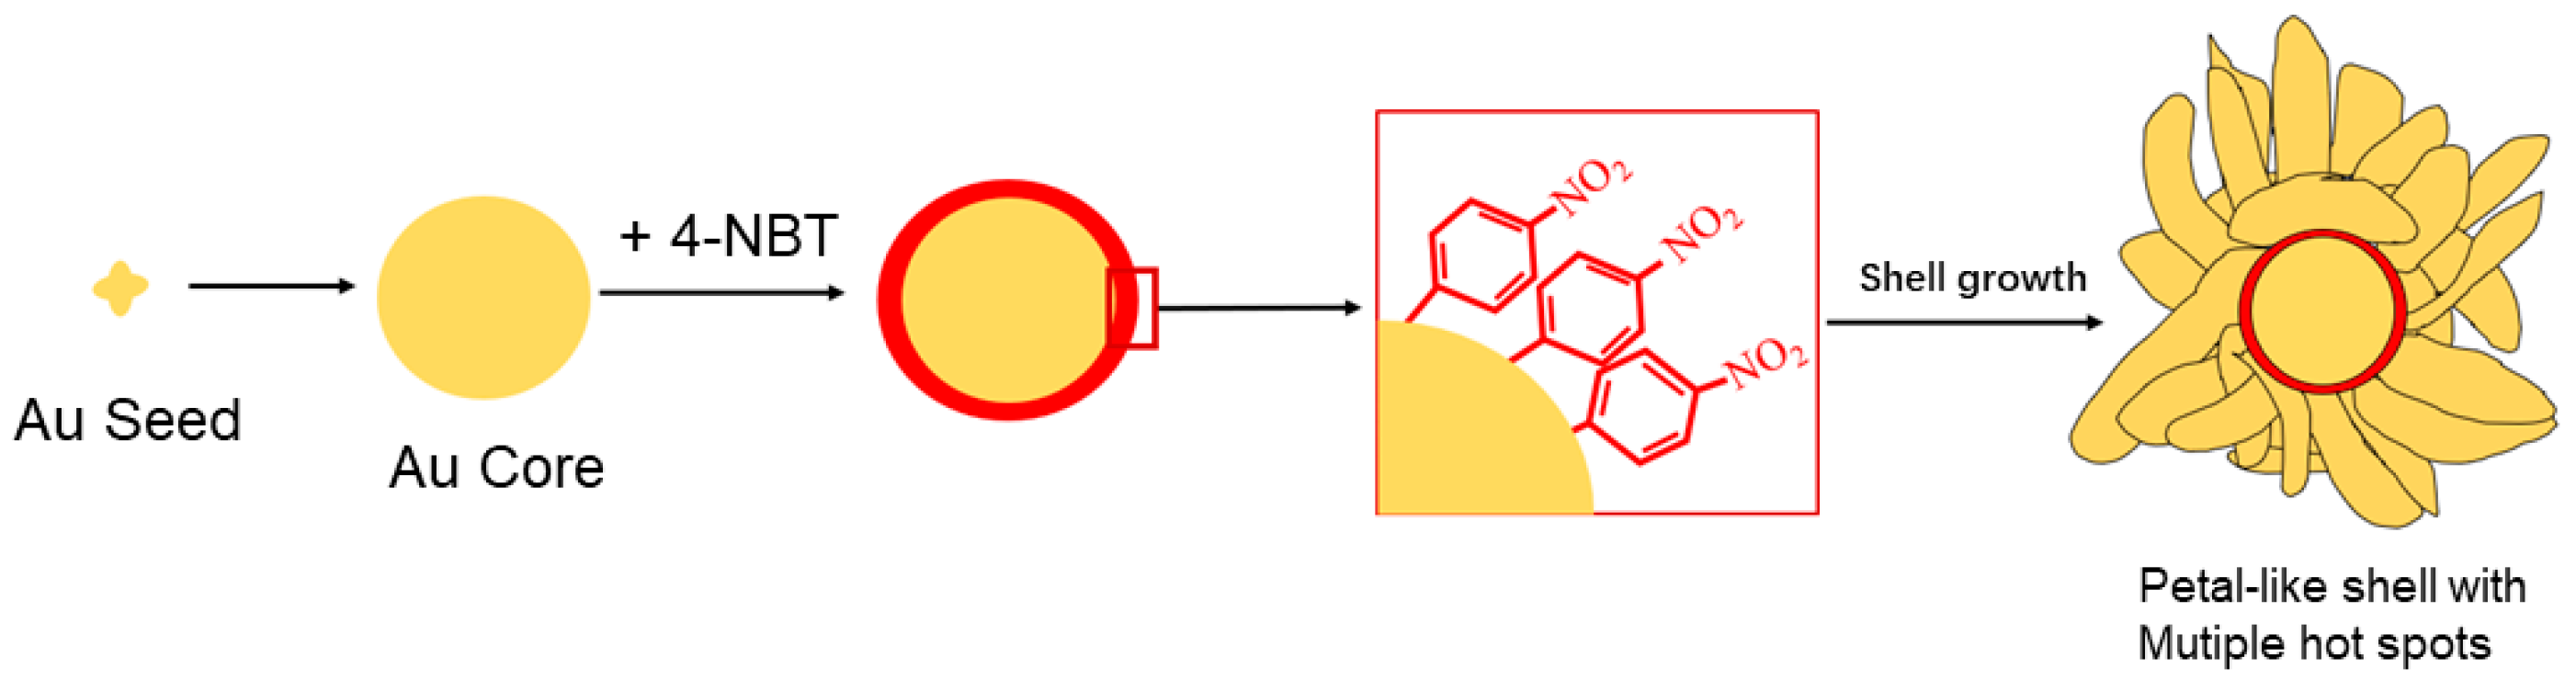
3.1. The Properties of P-GERTs

In the molecular selection for synthesizing gap-enhanced particles, it is common to choose benzene rings with rigid structures to support the formation of the gap structure. Molecules with thiol groups are selected to connect the molecules to the Au core, and the specific binding of Au-S ensures the stability of the binding. In addition, the size and electronegativity of the functional groups on the thiol also influence the adsorption and growth of Au clusters on the Au core and the thiol molecules during the synthesis process, indirectly affecting the final particle morphology. Generally, smaller groups such as nitro and cyano groups are preferred [20].
During the synthesis process, the modification of thiol groups on the Au core can result in nanoparticles with distinct particle morphologies, far-field and near-field plasmonic properties, and SERS performance. The impact of thiol group modification on subsequent growth can be summarized as follows: interfacial gaps between the shell and Au core, resulting morphology, and signal intensity [18,21].
The specific synthesis process is shown in Figure 2. During the synthesis process, the amount of thiol group modification on the Au core affects the adsorption configuration of the thiol groups on the Au core surface. The adsorption states of the thiol groups can be mainly classified into two cases based on the residual space on the Au core surface: upright and flat-lying. Subsequent growth can also be classified into two categories.
When the thiol groups on the Au core surface are not fully monolayer covered, the thiol groups lie flat on the Au core surface, resulting in a reduced interfacial gap between the shell and Au core. During the synthesis process, the contact area between the reduced Au clusters and thiol molecules increases. The Au core grows relatively uniformly, leading to the formation of spherical particles. The particle morphology is shown in Figure 3a, and the SEM images indicate that the surface of S-GERTs are smooth and densely packed, exhibiting a uniform spherical shape.
For fully monolayer-modified Au cores, the thiol molecules stand upright on the Au core surface, resulting in a relatively larger interfacial gap between the shell and Au core. The contact area between the thiol molecules and the reduced Au clusters is smaller, and the functional groups carried by the thiol molecules are insufficient to support the subsequent growth of the Au clusters. The reduced Au clusters preferentially contact the Au core, forming petal-shaped Au bridges, ultimately leading to the formation of petal-shaped, gap-enhanced structures on the surface. The particle size distribution is relatively uneven, and the SEM characterization of the particles is shown in Figure 3b, indicating an irregular petal-shaped structure on the particle’s surface. For a single nanoparticle with a petal-shaped surface and gap-enhanced structure, the molecules are located in the nanogap layer and are adsorbed as a monolayer. The external uneven petal-shaped structure was fixed, resulting in stable hotspots and enhancement for the molecules in the gap. Therefore, we believe that the resulting Raman signal was uniform and stable.
To further compare the signal intensity of the two types of particles under the same conditions, portable Raman spectroscopy (785 nm) was used with an integration time of 1000 ms and 1% power. First, without surface modification, the P-GERTs, S-GERTs, and commonly used 50 nm Au NPs (3 μL each) were drop-casted on a silicon wafer. In the case where only thiol molecules in the gap provided the signal, the signal intensity of P-GERTs with petal-shaped shell structures was found to be 30 times higher than that of regular gold nanoparticles, as well as 36.7 times higher than that of S-GERTs with spherical gap-enhanced structures. This is shown by the solid line in Figure 3c. This experiment provided a side validation that the petal-shaped surface shell of P-GERTs is relatively porous.
To further compare the intensities of S-GERTs and P-GERTs, we continued to modify the fully monolayer of the shell surface with 4-nitrobenzenethiol (4-NBT). We took 1 mL each of 50 nm Au NPs, P-GERTs, and S-GERTs, and we added 200 μL of 10 mM 4-NBT. The mixture was vigorously shaken at 30 °C for 1 h. Afterward, the particles were washed three times with 0.05 M CTAC, resulting in fully monolayer-modified thiol molecules on the P-GERTs and S-GERTs. The intensities were compared as follows: the solid line in solid color in Figure 3c represents the Raman signal intensity of S-GERTs before the 4-NBT modification, the dashed line in black represents the Raman signal intensity of S-GERTs after the 4-NBT modification, the solid line in red represents the signal intensity of P-GERTs before the 4-NBT modification, and the dashed line in red represents the signal intensity of P-GERTs after the 4-NBT modification. From the comparison of the surface-modified S-GERTs and P-GERTs with 4-NBT, it can be observed that the signal of S-GERTs did not show significant improvement after the 4-NBT modification, while the Raman signal of P-GERTs significantly increased after the 4-NBT modification. This phenomenon was attributed to the smooth outer shell of S-GERTs providing relatively weak SERS enhancement, while the petal-shaped outer shell of P-GERTs further enhanced the signal intensity of the molecules modified on the shell surface through external “hotspots” [22].
After the surface modification with 4-NBT, the signal intensity of P-GERTs with petal-shaped shell structures was 55 times higher than that of regular Au NPs and 36.7 times higher than that of S-GERTs with spherical gap-enhanced structures.
The porous and loose surface of P-GERTs enables it to adsorb more molecules and provide better Raman enhancement. The signal of P-GERTs originate not only from the gap between the shell and the Au core, but also from the abundant external “hotspots” provided by the petal-shaped surface shell. Additionally, these external and internal “hotspots” exist independently, and they expand the application potential of P-GERTs in the field of analysis. P-GERTs offer several advantages when applied to detection and analysis:
  • Uniform and stable signals from the gap structure [23]: The presence of a well-defined gap structure in P-GERTs ensures uniform and stable Raman signals;
  • Larger specific surface area due to the irregular surface shape [7]: The irregular shape of P-GERTs provides a larger surface area, allowing for the adsorption of more molecules and enhanced Raman signals;
  • Independence of external “hotspots” and internal “hotspots” for different functional modifications: The external “hotspots” and internal “hotspots” in P-GERTs are relatively independent, allowing for the modification of different functional molecules.
To demonstrate this, we synthesized P-GERTs by replacing the Raman reporter molecules fixed in the external nanogaps with molecules that had different Raman characteristic peaks. We used 4-mercaptobenzonitrile (4-MBN), 3-methoxybenzenethiol (3-MeoBT), and 2-naphthalenethiol (2-NT), which have thiol groups and different Raman characteristic bands, to modify the gold core and synthesize the P-GERTs. Figure 3d shows the Raman spectra of the synthesized P-GERTs with 4-MBN, 3-MeoBT, and 2-NT, exhibiting distinct Raman characteristic peaks and good signal quality. SEM images of the P-GERTs synthesized with 4-MBN, 3-MeoBT, and 2-NT are shown in Figure S1a–c, indicating that all three thiol molecules can be used to synthesize P-GERTs with petal-shaped outer shells. In our work, we used 4-NBT molecules as an example for the preparation of P-GERTs, and the UV characterization of the particles is shown in Figure S2. The UV spectrum of the prepared P-GERTs exhibited a noticeable red shift, with the maximum absorption peak close to 700 nm and a broadening of the peak shape occurring. This resonance with the 785 nm excitation light partially contributed to the significant enhancement of the signal in P-GERTs.

3.2. P-GERT Label Optimization

In SERS technology, the construction of SERS substrates involves the removal of “hotspots”. To achieve specific binding with antigens, SERS requires conjugation with antibodies. We selected DSP (dithiobis[succinimidyl propionate]) as the coupling agent. DSP is a homobifunctional N-hydroxysuccinimide (NHS) ester cross-linker with a succinimidyl amide bond, in which the disulfide bonds form two thiols that bind to gold in aqueous conditions. In addition, each end of the two spacer arms of the DSP molecule contain an amine-reactive NHS ester. NHS esters react with primary amines under pH conditions of 7–9 to form stable amide bonds. The specific antibody modification process is illustrated in Figure 4. The modification of the amide bond directly determines the subsequent antibody modification. Therefore, the modification status of DSP is a crucial step in the process.
We added 2.5 μL, 2 μL, 1.5 μL, 1 μL, 0.5 μL, and 0.25 μL of a 10 mM DSP solution to each 4 mL of P-GERTs, resulting in SERS labels with different detection performances. The verification analysis was conducted under the same conditions, as shown in Figure 5a. From the graph, it can be observed that the addition of 2 μL of DSP to every 4 mL of P-GERTs reached saturation and achieved the best performance for detecting the N protein at a concentration of 1 ng/mL. Figure 5b shows a comparison of the integrated bar charts after baseline correction for the characteristic peak range of 1300 cm−1 to 1350 cm−1.
During the process of antibody modification, an appropriate amount of antibody is also required. Therefore, we designed an experiment to investigate the impact of different antibody concentrations on the modification results. As shown in Figure 4, we added 2 μL of 10 mM DSP to each 4 mL of P-GERTs. After modification and washing, different amounts of antibodies (120 μg, 100 μg, 80 μg, 60 μg, 40 μg, 20 μg, and 10 μg) were added. The Raman spectra of P-GERTs modified with different antibody concentrations were obtained for detecting 1 ng/mL of the N protein, as shown in Figure 5c. Figure 5d displays the bar chart of the integrated peak areas after baseline correction. The results indicate that, under the same conditions, P-GERT exhibited the highest Raman signal intensity for detecting the N protein when the antibody concentration was 80 μg/mL. Therefore, an antibody concentration of 80 μg/mL is considered the optimal loading condition for the antibody.
In the face of the global public health crisis posed by the COVID-19 pandemic, the application of specific screening techniques has become crucial and important. Specific screening, through precise biomolecular recognition and meticulous analysis processes, can efficiently and accurately identify specific antibodies or antigens targeting the SARS-CoV-2 virus. These specific biomolecules not only provide reliable tools for the rapid diagnosis of SARS-CoV-2 infection, but they also hold significant importance in vaccine development, drug therapy, and epidemiological investigations. Using the acquired nanolabels, we conducted specificity tests on the antigen proteins of the respiratory syncytial virus antigen (RSV), purified lysate, blank samples, influenza A virus antigen (H1N1 antigen), and influenza B virus antigen (FLU B antigen). The results, as shown in Figure 6, demonstrate that the nanolabels exhibited good specificity in detecting the SARS-CoV-2 virus N protein.

3.3. Detection Sensitivity and Actual Throat Swab System Verification

Under the optimal particle modification conditions, we validated the detection sensitivity of the system for the N protein. We used P-GERTs with 4-nitrobenzene thiol (4-NBT) as an internal standard molecule to test the N protein standard, as shown in Figure 7a. It represents the detection performance of P-GERTs prepared with 4-NBT for different concentrations of the N protein. Figure 7b presents the linear fitting curve after integrating the Raman peak at 1330 cm−1 after baseline correction. The fitting equation is y = 2239.66x + 8217.78, with an R2 value of 0.95. The LOD calculated from the curve was 4.28 pg/mL. Despite the influence of the stability of the antibody–virus binding on the linearity, the experiment exhibited good stability and relatively high accuracy based on the fluctuation of the error bars. This system can be used to distinguish severe cases as it demonstrates good linearity and precision in the low concentration range.
To validate the detection performance of P-GERTs in actual samples, we collected throat swab samples from volunteers who had not been infected with any respiratory diseases. We added a concentration gradient of the N protein standard ranging from 1 ng/mL to 10 pg/mL to simulate clinically positive samples. The detection results are shown in Figure 7c. In the throat swab system, our approach still exhibits excellent linearity. Additionally, the blank samples show minimal signals, indicating that our system maintains outstanding accuracy in complex real-world samples. The fitted equation for the curve is y = 1984.57x + 8486.04, with an R2 value of 0.96. The calculated LOD was 25.4 pg/mL.

4. Conclusions

We developed an antibody-based sandwich detection system for detecting the novel coronavirus. We synthesized P-GERT particles that utilize internal sub-nanometer gaps and external petal-like shell structures to provide signals for detection. The surface of P-GERTs has a larger specific surface area compared to spherical particles, allowing for the attachment of a greater number of antibodies. The signal is provided by the high-sensitivity and highly reproducible internal thiol molecules in P-GERTs. The synthesized P-GERT detection probes exhibit a signal intensity 55 times higher than that of regular gold nanoparticles and 36.7 times higher than S-GERT particles with an interstitial structure. During the detection process, we employed a one-step incubation method to significantly shorten the detection time. Furthermore, we enhanced the sensitivity by using magnetic beads for enrichment. The detection of the novel coronavirus can be completed within 15 min using this approach. The LOD for the standard samples was 4.28 pg/mL, while the LOD for actual throat swab samples was 25.4 pg/mL. This process can be extended to the detection of other viruses such as influenza and RSV, and this workflow can be extended to the detection of other biomarkers, making it widely applicable.

Supplementary Materials

The following supporting information can be downloaded at: https://www.mdpi.com/article/10.3390/photonics11080708/s1, Figure S1: (a) SEM image of P-GERTs synthesized with 4-MBN; (b) SEM image of P-GERTs synthesized with 3-MeoBT; (c) SEM image of P-GERTs synthesized with 2-NT; Figure S2. The UV spectrum of the prepared P-GERTs.

Author Contributions

Conceptualization, M.Z. and S.X.; methodology, M.Z.; software, S.X.; validation, M.Z., S.X., and P.-C.G.; resources, Y.-J.Z.; data curation, M.Z.; writing—original draft preparation, M.Z. and S.X.; writing—review and editing, Y.-J.Z.; project administration, J.-F.L.; funding acquisition, Y.-J.Z. and J.-F.L. All authors have read and agreed to the published version of the manuscript.

Funding

This research was funded by the Science and Technology Planning Project of Fujian Province (grant number 2023Y0002) and the Scientific Research Foundation of State Key Laboratory of Vaccines for Infectious Diseases, Xiang An Biomedicine Laboratory (grant number 2023XAKJ0103078).

Institutional Review Board Statement

Not applicable.

Informed Consent Statement

Not applicable.

Data Availability Statement

Data are contained within the article.

Conflicts of Interest

The authors declare no conflicts of interest.

References

  1. Gu, Y.Q.; Bi, X.Y.; Ye, J. Gap-enhanced resonance Raman tags for live-cell imaging. J. Mater. Chem. B. 2020, 8, 6944–6955. [Google Scholar] [CrossRef] [PubMed]
  2. Sha, M.Y.; Xu, H.X.; Natan, M.J.; Cromer, R. Surface enhanced Raman scattering tags for rapid and homogeneous detection of circulating tumor cells in the presence of human whole blood. J. Am. Chem. Soc. 2008, 130, 17214–17215. [Google Scholar] [CrossRef] [PubMed]
  3. Kircher, M.F.; Zerda, A.D.L.; Jokerst, J.V.; Zavaleta, C.L.; Kempen, P.J.; Mittra, E.; Pitter, K.; Huang, R.M.; Campos, C.; Habte, F.; et al. A brain tumor molecular imaging strategy using a new triple-modality MRI-photoacoustic Raman nanoparticle. Nat. Med. 2012, 18, 829–834. [Google Scholar] [CrossRef] [PubMed]
  4. Xie, W.; Walkenfort, B.; Schlucker, S. Label-free SERS monitoring of chemical reactions catalyzed by small gold nanoparticles using 3D plasmonic superstructures. J. Am. Chem. Soc. 2013, 135, 1657–1660. [Google Scholar] [CrossRef] [PubMed]
  5. Su, X.; Zhang, J.W.; Sun, L.; Koo, T.W.; Chan, S.; Sundararajan, N.; Yamakawa, M.; Berlin, A.A. Composite organic–inorganic nanoparticles (COINs) with chemically encoded optical signatures. Nano Lett. 2005, 5, 49–54. [Google Scholar] [CrossRef]
  6. Zhang, Y.; Yang, P.; Muhammed, M.A.H.; Alsaiari, S.K.; Moosa, B.; Almalik, A.; Kumar, A.; Ringe, E.; Khashab, N.M. Tunable and linker free nanogaps in coreshell plasmonic nanorods for selective and quantitative detection of circulating tumor cells by SERS. ACS Appl. Mater. Interfaces 2017, 9, 37597–37605. [Google Scholar] [CrossRef] [PubMed]
  7. Zhang, Y.Q.; Gu, Y.Q.; He, J.; Thackray, B.D.; Ye, J. Ultrabright gap-enhanced Raman tags for high-speed bioimaging. Nat. Commun. 2019, 10, 3905–3916. [Google Scholar] [CrossRef] [PubMed]
  8. Xu, S.S.; Wu, X.H.; Wu, L.; Zhai, J.M.; Li, S.J.; Kou, Y.C.; Peng, W.; Zheng, Q.N.; Tian, J.H.; Zhang, Y.J.; et al. Systematic Optimization of Universal Real-Time Hypersensitive Fast Detection Method for HBsAg in Serum Based on SERS. Anal. Chem. 2024, 96, 6784–6793. [Google Scholar] [CrossRef]
  9. Li, C.C.; Huang, Y.M.; Li, X.Y.; Zhang, Y.R.; Chen, Q.L.; Ye, Z.W.; Alqarni, Z.; Bell, S.E.J.; Xu, Y.K. Towards practical and sustainable SERS: A review of recent developments in the construction of multifunctional enhancing substrates. J. Mater. Chem. C 2021, 9, 11517–11552. [Google Scholar] [CrossRef]
  10. Yang, H.Z.; Li, J.Y.; Rao, Y.; Yang, L.N.; Xue, Y.D.; Zhang, Y.; Yang, Z.J.; Li, J. Ultrasensitive multiplex SERS immunoassay based on porous Au-Ag alloy nanoparticle-amplified Raman signal probe and encoded photonic crystal beads. Mikrochim. Acta 2022, 190, 13–22. [Google Scholar] [CrossRef]
  11. Luo, X.J.; Zhao, X.J.; Wallace, G.Q.; Brunet, M.H.; Wilkinson, K.J.; Wu, P.; Cai, C.X.; Bazuin, C.G.; Masson, J.F. Multiplexed SERS Detection of Microcystins with Aptamer-Driven Core-Satellite Assemblies. ACS Appl. Mater. Interfaces 2021, 13, 6545–6556. [Google Scholar] [CrossRef] [PubMed]
  12. Nam, W.; Ren, X.; Tali, S.A.S.; Ghassemi, P.; Kim, I.; Agah, M.; Zhou, W. Refractive-index-insensitive nanolaminated SERS substrates for label-free Raman profiling and classification of living cancer cells. Nano Lett. 2019, 19, 7273–7281. [Google Scholar] [CrossRef] [PubMed]
  13. Shan, B.B.; Pu, Y.H.; Chen, Y.F.; Liao, M.L.; Li, M. Novel SERS labels: Rational design, functional integration and biomedical applications. Coordin. Chem. Rev. 2018, 371, 11–37. [Google Scholar] [CrossRef]
  14. Khlebtsov, B.N.; Burov, A.M.; Bratashov, D.N.; Tumskiy, R.S.; Khlebtsov, N.G. Petal-like Gap-Enhanced Raman Tags with Controllable Structures for High-Speed Raman Imaging. Langmuir 2020, 36, 5546–5553. [Google Scholar] [CrossRef] [PubMed]
  15. Khlebtsov, N.G.; Lin, L.; Khlebtsov, B.N.; Ye, J. Gap-enhanced Raman tags: Fabrication, optical properties, and theranostic applications. Theranostics 2020, 10, 2067–2094. [Google Scholar] [CrossRef] [PubMed]
  16. Liu, H.Q.; Gao, X.; Xu, C.; Liu, D.B. SERS Tags for Biomedical Detection and Bioimaging. Theranostics 2022, 12, 1870–1903. [Google Scholar] [CrossRef]
  17. Surjit, M.; Lal, S.K. The SARS-CoV nucleocapsid protein: A protein with multifarious activities. Infect. Genet. Evol. 2008, 8, 397–405. [Google Scholar] [CrossRef] [PubMed]
  18. Nayak, T.R.; Andreou, C.; Oseledchyk, A.; Marcus, W.D.; Wong, H.C.; Massagué, J.; Kircher, M.F. Tissue factor-specific ultra-bright serrs nanostars for raman detection of pulmonary micrometastases. Nanoscale 2017, 9, 1110–1119. [Google Scholar] [CrossRef]
  19. Lin, L.; Zapata, M.; Xiong, M.; Liu, Z.H.; Wang, S.S.; Xu, H.; Borisov, A.G.; Gu, H.C.; Nordlander, P.; Aizpurua, J.; et al. Nanooptics of plasmonic nanomatryoshkas: Shrinking the size of a core–shell junction to subnanometer. Nano Lett. 2015, 15, 6419–6428. [Google Scholar] [CrossRef]
  20. Yin, B.H.; Ho, W.K.H.; Xia, X.Y.; Chan, C.K.W.; Zhang, Q.; Ng, Y.M.; Lam, C.Y.K.; Cheung, J.C.W.; Wang, J.F.; Yang, M.; et al. A Multilayered Mesoporous Gold Nanoarchitecture for Ultraeffective Near-Infrared Light-Controlled Chemo/Photothermal Therapy for Cancer Guided by SERS Imaging. Small 2023, 19, 2206762–2206775. [Google Scholar] [CrossRef]
  21. Thomas, R.G.; Jeong, Y.Y. NIRF Heptamethine Cyanine Dye Nanocomplexes for Multi Modal Theranosis of Tumors. Chonnam Med. J. 2017, 53, 83–94. [Google Scholar] [CrossRef] [PubMed]
  22. Hao, F.; Nehl, C.L.; Hafner, J.H.; Nordlander, P. Plasmon Resonances of a Gold Nanostar. Nano Lett. 2007, 7, 729–732. [Google Scholar] [CrossRef] [PubMed]
  23. Lin, B.Y.; Yao, Y.Y.; Wang, Y.L.; Kannan, P.; Chen, L.F.; Guo, L.H. A universal strategy for the incorporation of internal standards into SERS substrates to improve the reproducibility of Raman signals. Analyst 2021, 146, 7168–7777. [Google Scholar] [CrossRef] [PubMed]
Figure 1. (a) A scheme of the one-step test. (b) SEM picture of the sandwich structure.
Photonics 11 00708 g001
Figure 2. The synthesis of the P-GERTs process.
Photonics 11 00708 g002
Figure 3. (a) SEM image of an S-GERT; (b) SEM image of a P-GERT; (c) comparison of the Raman signal intensity for the S-GERT and P-GERT; and (d) the Raman characteristic peaks and a SEM image of a P-GERT synthesized with different thiol molecules.
Photonics 11 00708 g003
Figure 4. SERS probe modification process.
Photonics 11 00708 g004
Figure 5. (a) Different DSP concentrations for detecting the same concentration of N protein; (b) different DSP concentrations for detecting the same concentration of N protein; (c) different antibody concentrations for detecting the same concentration of N protein; and (d) different antibody concentrations for detecting the same concentration of N protein.
Photonics 11 00708 g005
Figure 6. Screening for specificity.
Photonics 11 00708 g006
Figure 7. (a) The Raman spectra of antibody-modified P-GERTs for different concentrations of the N protein; (b) the fitting curve after baseline correction of the integrated peak (1330 cm−1) for detecting different concentrations of the N protein; (c) the Raman spectra of antibody-modified P-GERTs for different concentrations of the N protein; and (d) the fitting curve after baseline correction of the integrated peak (1330 cm−1) for detecting different concentrations of the N protein.
Photonics 11 00708 g007
Disclaimer/Publisher’s Note: The statements, opinions and data contained in all publications are solely those of the individual author(s) and contributor(s) and not of MDPI and/or the editor(s). MDPI and/or the editor(s) disclaim responsibility for any injury to people or property resulting from any ideas, methods, instructions or products referred to in the content.

