Article

Photonic Crystal Fiber Based on Surface Plasmon Resonance Used for Two Parameter Sensing for Magnetic Field and Temperature

1
Joint Laboratory for Extreme Conditions Matter Properties, Key Laboratory of Manufacturing Process Testing Technology of Ministry of Education, State Key Laboratory of Environment-Friendly Energy Materials, Southwest University of Science and Technology, Mianyang 621010, China
2
College of Physics and Electronics, Central South University, Changsha 410083, China
3
School of Physics and Optoelectronic Engineering, Yangtze University, Jingzhou 434023, China
4
School of Chemistry and Chemical Engineering, Jishou University, Jishou 416000, China
5
Hubei Key Laboratory of Mechanical Transmission and Manufacturing Engineering, Wuhan University of Science and Technology, Wuhan 430081, China
6
College of Physics, Zhejiang University of Technology, Hangzhou 310023, China
7
College of Physics & Information Engineering, Quanzhou Normal University, Quanzhou 362000, China
8
School of Physics and Electronic-Information Engineering, Hubei Engineering University, Xiaogan 432000, China
*
Author to whom correspondence should be addressed.
These authors contributed equally to this work.
Photonics 2024, 11(9), 784; https://doi.org/10.3390/photonics11090784 (registering DOI)
Submission received: 14 July 2024 / Revised: 19 August 2024 / Accepted: 20 August 2024 / Published: 23 August 2024
(This article belongs to the Special Issue Thermal Radiation and Micro-/Nanophotonics)

Abstract

:
This paper presents a photonic crystal fiber (PCF) sensor that can be used to measure the temperature and magnetic field simultaneously, and to monitor the changes in them in the environment. When we designed the fiber structure, two circular channels of the same size were added to the fiber to facilitate the subsequent addition of materials. A gold film is added to the upper channel (ch1), and the channel is filled with a magnetic fluid (MF). The sensor can reflect changes in the temperature and magnetic field strength. The two channels containing MF and PDMS in the proposed fiber are called ch1 and ch2. The structure, mode and properties (temperature and magnetic field) were analyzed and discussed using the finite element method. By using the control variable method, the influence of Ta2O5 or no Ta2O5, the Ta2O5 thickness, the diameter of the special air hole, the distance from the fiber core and the distance between them in the displacement of the loss spectrum and the phase-matching condition of the coupling mode were studied. The resulting maximum temperature sensitivity is 6.3 nm/°C (SPR peak 5), and the maximum magnetic field sensitivity is 40 nm/Oe (SPR peak 4). Because the sensor can respond to temperature and magnetic field changes in the environment, it can play an important role in special environmental monitoring, industrial production and other fields.

1. Introduction

As a basic physical parameter, magnetic fields are of great significance in earthquake early warning, medical detection, geological exploration, microscopic measurement, planetary research, industrial production and so on [1,2,3]. Application magnetic field sensors can be divided into low-intensity magnetic field sensors and high-intensity magnetic field sensors. Low-intensity magnetic field sensors are mostly used in the medical and military fields. Fluxgate and anisotropic magnetoresistive sensors are medium-strength magnetic field sensors. The high-intensity magnetic field sensor includes a reed switch, Lorentz force device, Hall sensor, giant magnetoresistive magnetic field sensor and so on [4,5,6]. Most of these sensors are complex in structure, large in volume, expensive in price, easily affected by the geomagnetic field or surrounding magnetic field when working, and have low sensitivity, and migration and noise are obvious [7,8,9]. Temperature magnetic field sensors are sensors that can measure both the temperature and magnetic field at the same time. They usually operate on the principle of the magnetoresistive effect or the Hall effect. Magnetoresistive effect sensors take advantage of the fact that the magnetoresistance ratio of a material changes with the temperature and magnetic field. When the temperature or magnetic field changes, the resistance value of the sensor will also change, so that the temperature and magnetic field strength can be determined by measuring the resistance. Hall effect sensors are based on the Hall effect, which creates a voltage difference when a magnetic field exerts an effect on a semiconductor chip. By measuring the magnitude of this voltage difference, the strength of the magnetic field can be determined. Some Hall effect sensors can also measure temperature by combining the temperature sensor and Hall effect sensor, so that the temperature and magnetic field can be measured at the same time. Their simultaneous-measurement capabilities make it easier to obtain environmental information in some applications and can improve the accuracy of monitoring and control. The optical fiber magnetic field sensor proposed in this paper has the characteristics of a small structure and excellent sensitivity and is easily disturbed by the external environment, and it has wide application prospects in the aerospace, metallurgy, medical and other fields [10,11,12,13]. The basic principle of magneto-liquid fiber magnetic field sensors is that light directly or indirectly interacts with the magneto-optical materials during transmission, thereby changing the parameters of the light, including its intensity, wavelength and polarization state.
With the development and replacement of technology, the demand for information monitoring has greatly promoted the development and updating of optical fiber. Optical fiber has the characteristics of high sensitivity, a smaller size, a quick response speed and a strong anti-interference ability. Photonic crystal fiber has attracted more and more attention. Compared with laser-type fiber, its unique structure and excellent performance have greater development prospects. One of its characteristics is its porosity, which makes it easy to fill with analytes with different sensing characteristics [14]. By introducing the SPR effect of PCF, high-sensitivity, multi-parameter sensing can be realized, and the application range of optical fiber sensing is expanded. Surface plasmon resonance (SPR) sensing is a sensing technology that can achieve high-sensitivity, real-time monitoring without fluorescent labeling [15,16,17,18,19]. The SPR effect caused by the change in refraction caused by the change in the surrounding environment is introduced into the optical fiber sensor to improve its sensitivity. By analyzing the change in wavelength, the refractive index and corresponding physical parameters of the analyte can be calculated by the formula function [20,21,22,23,24]. Photonic crystals are regular optical structures made of periodically arranged media of different refractive indices. The refractive indices of these media present a periodic change in space, resulting in a change in the spatial refractive index. When the refractive index of the medium changes sufficiently and the period of the change is related to the wavelength of the light wave, the dispersion relationship of the light wave will appear as a band structure [25,26]. Photonic band gaps are one of the most significant characteristics of photonic crystals. They consist of a range of frequencies (or energies) in which no mode of propagation of electromagnetic waves exists [27,28].
Based on the finite element method, the SPR sensor was analyzed using COMSOL software (https://www.comsol.com/, accessed on 19 August 2024). When designing the sensor, we considered adding two circular channels to the fiber of the sensor. A gold film is added to the upper channel (ch1), and the channel is filled with magnetic fluid (MF). ch2 is coated with gold film and Ta2O5 film, two media that can improve the sensing performance of SPR. ch2 is filled with polydimethylsiloxane (PDMS) to achieve a temperature response. Finally, the modal characteristics, structural parameters and sensing properties were studied. The influence of Ta2O5, the thickness of Ta2O5, the thickness of the gold layer, the diameter of the special air hole, the distance from the core and the distance between them in the phase-matching condition of the coupling mode and the displacement of the loss spectrum were studied by using the control variable method. Finally, we discuss the performance of the 50–150Oe sensor under varying magnetic field strengths. The PCF can be produced by the stake-and-draw method [29]. To incorporate nanomaterials into the pores inside the PCF, high-pressure chemical vapor deposition (HPCVD) can be used [30]. There are many processes for filling PCF pores with liquid in order to realize the liquid filling of the holes in the optical fiber, and the capillary and the holes can be added by using a splicer. For the splicer, we can adopt the method of manual splicing, which is a cheap method that can reduce the cost [31,32,33,34].
In order to study how the sensor works, the first thing was to determine the polarization direction of the study. Then, by analyzing the simulation results of the different structural parameters, better sensor parameters were obtained. Finally, the effects of the temperature and magnetic field intensity on the sensor operation were studied, and the corresponding data were obtained.

2. Modeling and Structural Parameters of the PCF Biosensor

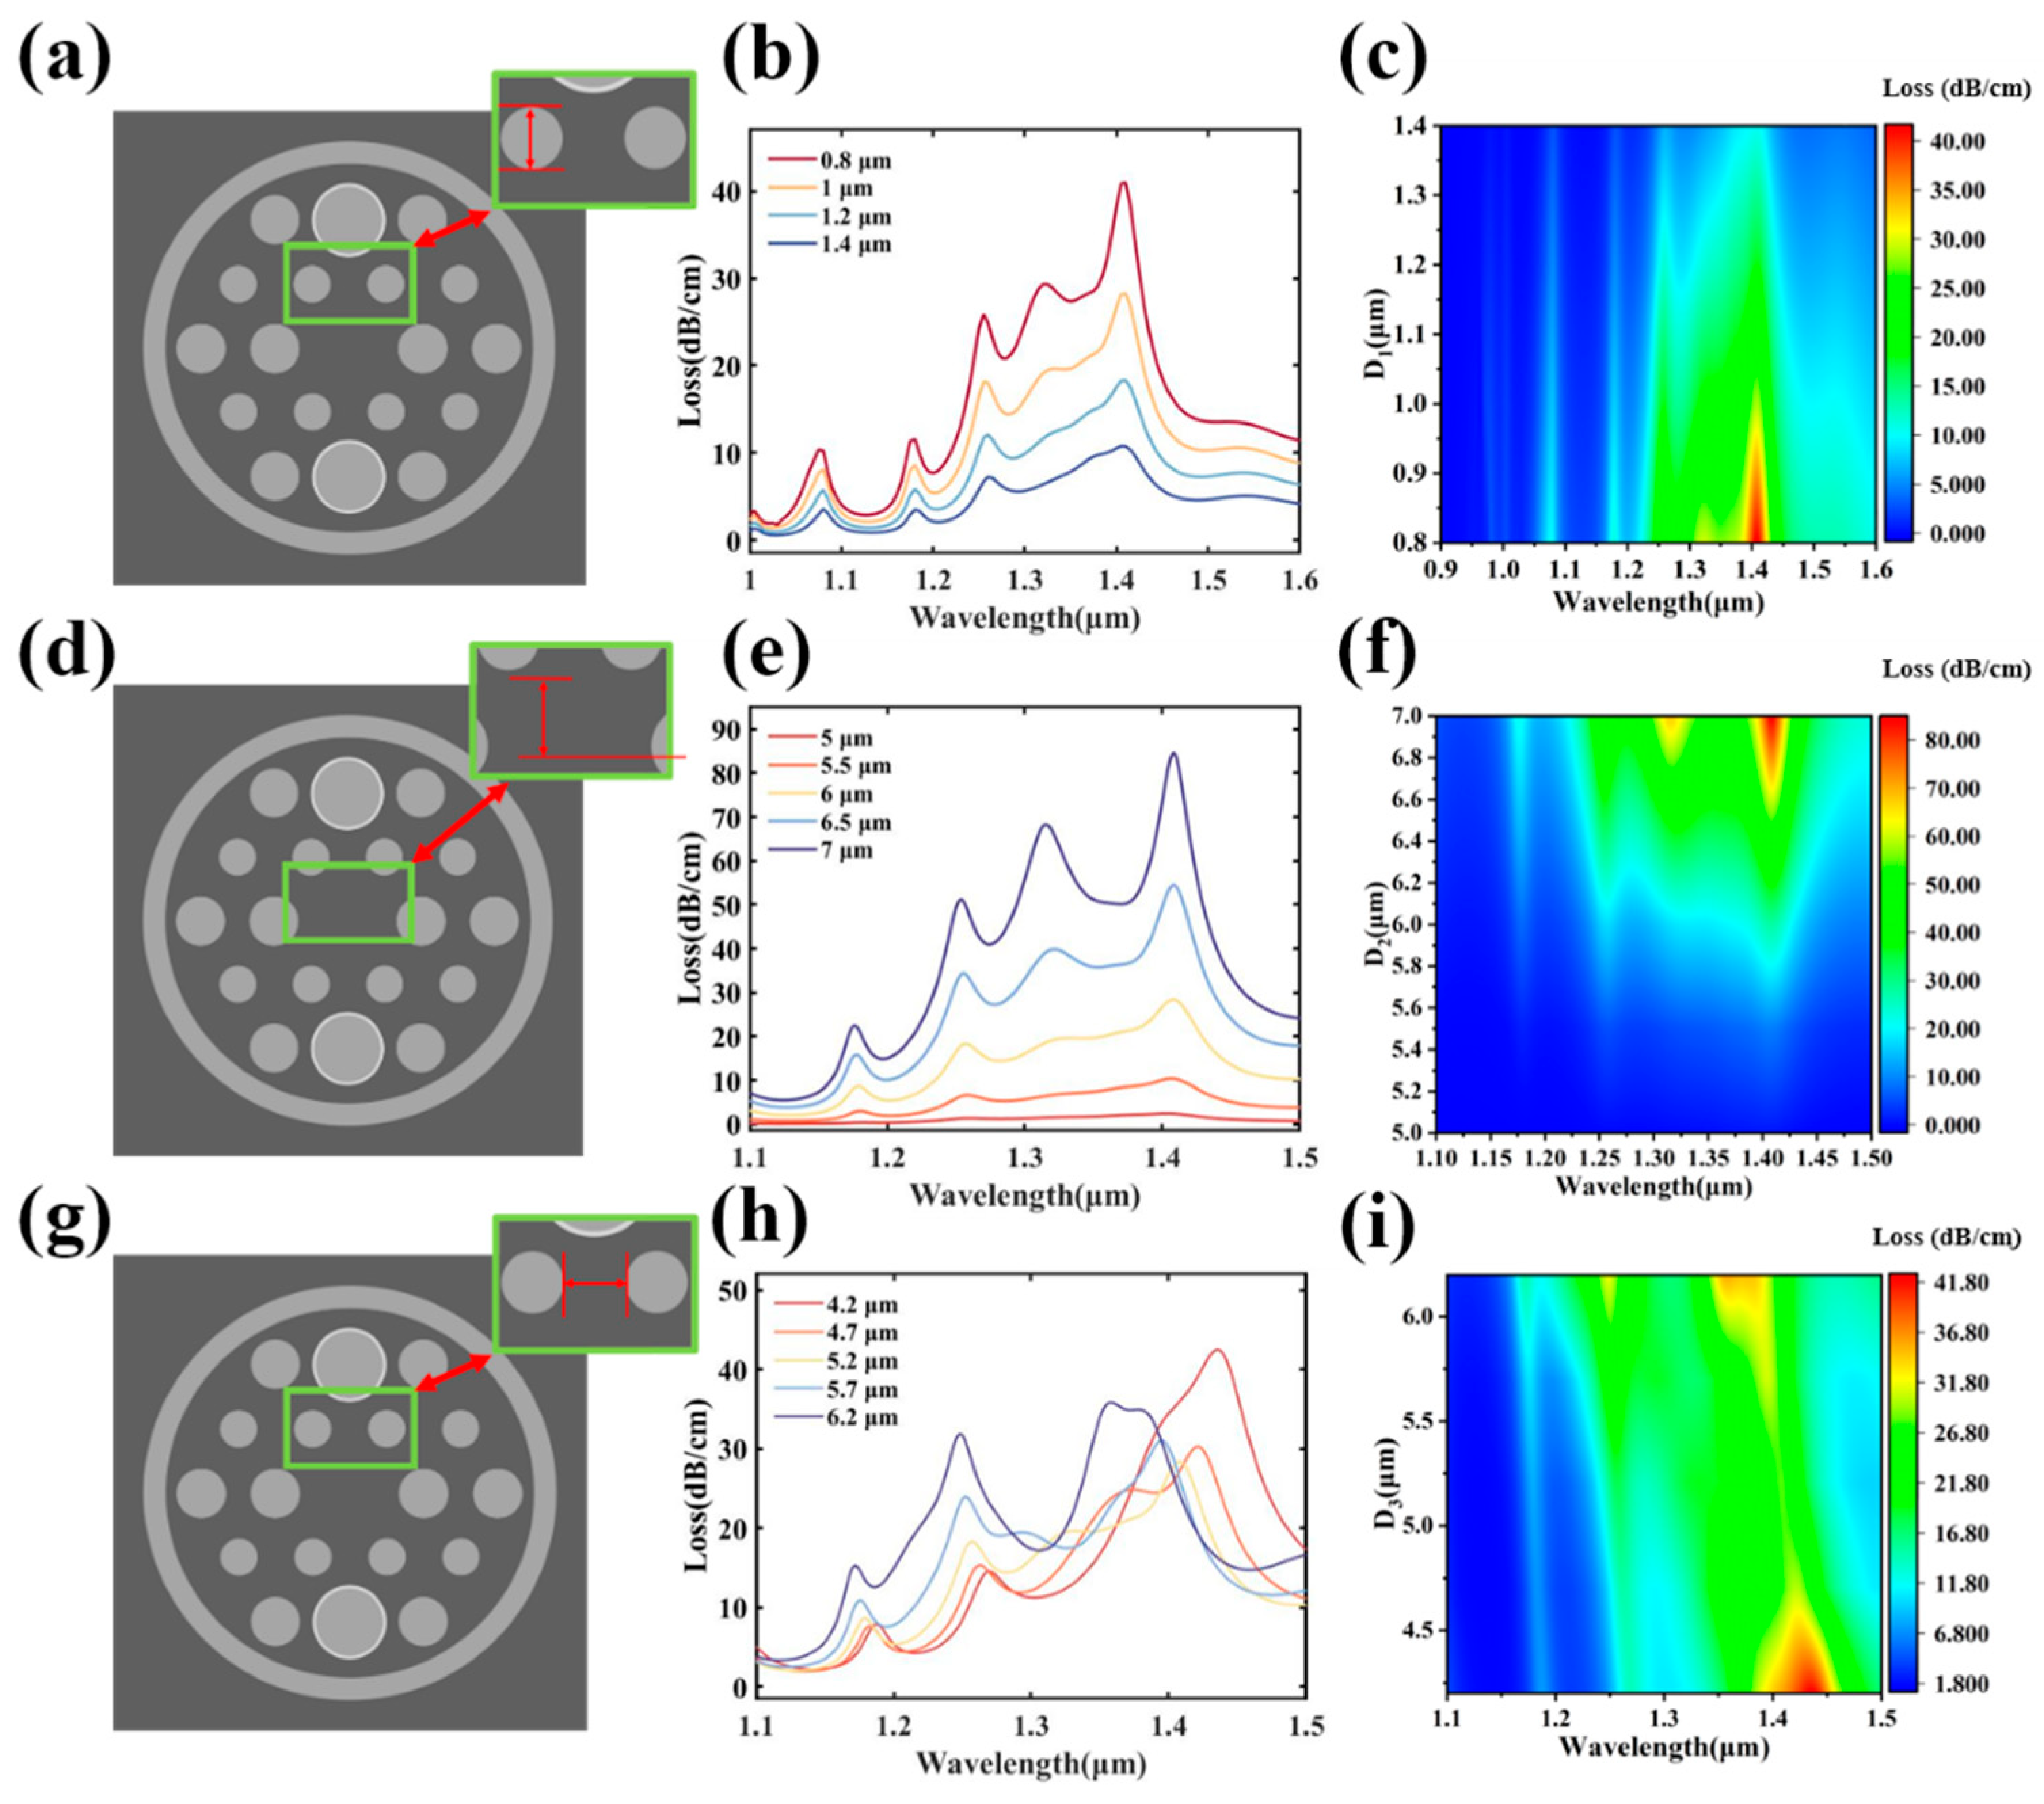
2.1. Basic Structure

Figure 1a shows the cross section of the SPR sensor, where the PCF air holes are distributed hexagonally and contain three different diameters. Channel 1 is filled with MF, and a gold layer is added to improve the performance. Channel 2 is filled with PDMS, and Ta2O5 and gold film are added. When the temperature in the environment increases or decreases, and the magnetic field becomes stronger or weaker, the refractive index of the material in the two channels will change accordingly. This enables the simultaneous sensing of the temperature and magnetic field.
The basic parameters are set as follows (some of the following values will be changed in subsequent studies):
SymbolParameterValue
-Radius of PCF15 μm
-Radius of circular channel3 μm
-Ordinary air hole radius2 μm
-Special air hole radius1 μm
dAuGold thickness40 nm
dTThickness of Ta2O540 nm
When there is a loss peak in the spectrometer, it means that energy is transferred. Energy is transferred from the core to the reaction surface, which is where mode coupling occurs. We use the following formula to calculate and express the loss value [35,36]:
α l o s s = 8.686 × 2 π λ I m n e f f × 1 0 7 d B c m
The constant values of B1, B2, B3, C1, C2 and C3 are 0.6961663, 0.4079426, 0.9874794, 0.0684043, 0.1162414 and 9.896161, respectively, where I m ( n e f f ) represents the imaginary part of the refractive index of the correct fiber core mode that we calculated [37]. The change in the refractive index will cause the SPP data to change to a certain extent. So, when we count the wavelength change, we can obtain the trend of the refractive index change. After the refractive index changes, the measured loss summit changes to a certain extent, such as the size and displacement of the peak. The change can be displayed by the instrument to realize the visualization of external changes affecting the data. For the convenience of calculation and statistics, the refractive index of air is always assumed to be 1. The main component of silicon is expressed by the Sellmeier equation [38]:
n 2 λ = 1 + X 1 λ 2 λ 2 C 1 + X 2 λ 2 λ 2 C 2 + X 3 λ 2 λ 2 C 3
In the expression, λ is the wavelength in microns. The constants, X 1   X 2 , X 3 , C 1 , C 2 and C 3 are 0.696166, 0.407942, 0.897479, 0.068404, 0.116241 and 9.896161. We quote the following Drude–Lorentz model to represent the dielectric constant of the thin gold layer [39]:
ε ω = ε ω p 2 ω ω + j γ + Δ ε Ω L 2 ω 2 Ω L 2 + j Γ L ω
In the equation, Ω L ,   ω , ε , γ , Γ L , Δ ε and ω p stand for the oscillator strength (1300.14π THz), angular frequency, permittivity at a high frequency (5.9673), damping frequency (31.84π), spectral width of the Lorentz oscillators (209.72π), weighting factor (1.09) and plasma frequency (4227.2π). The wavelength sensitivity ( S λ ) is expressed as follows for a more detailed study [40,41,42,43]:
S λ = δ λ p e a k
S λ is the wavelength sensitivity. δ λ p e a k is the change in the resonance wavelength. So, is the change. In order to further study the performance of the sensor for temperature change and magnetic field change, the magnetic field and temperature sensitivities are expressed as the following two formulas [44,45,46]:
S T = δ λ p e a k T
S H = δ λ p e a k H
where T is the change in the temperature and H is the change in the magnetic field.
PDMS is a new polymer material (polydimethylsiloxane) that has the characteristics of transparency, elasticity and biocompatibility. Its refractive index changes with the temperature as follows:
n P D M S = 4.5 × 10 4 T + 1.4176
The temperature in this study ( T ) was calculated in degrees Celsius (°C).
Ta2O5 coated in ch2 is an oxide with a high dielectric constant, insulation and high temperature resistance and corrosion resistance. The sensing performance can be changed by modulating the effective refractive index of the light field. The refractive index of Ta2O5 film can be given by the following formula [47]:
n T a 2 O 5 = 1.88 + 178.4 × 10 2 λ 2 + 52.7 × 10 7 / λ 4
where λ is the wavelength.
Changes in the m f caused by changes in the external environment are represented by the following functions:
n m f = ( n s n 0 ) coth α H H c , n T T α ( H H c , n ) + n 0
where n s is the saturation of the refractive index of the m f , n 0 is the initial refractive index of the m f , α is the fitting coefficient, T is the working temperature, H c , n is the threshold value of the magnetic field and H is the external magnetic field intensity. In this paper, these parameters are set to α = 5, H c , n = 30 Oe, n 0 = 1.4352 and n s = 1.4385.

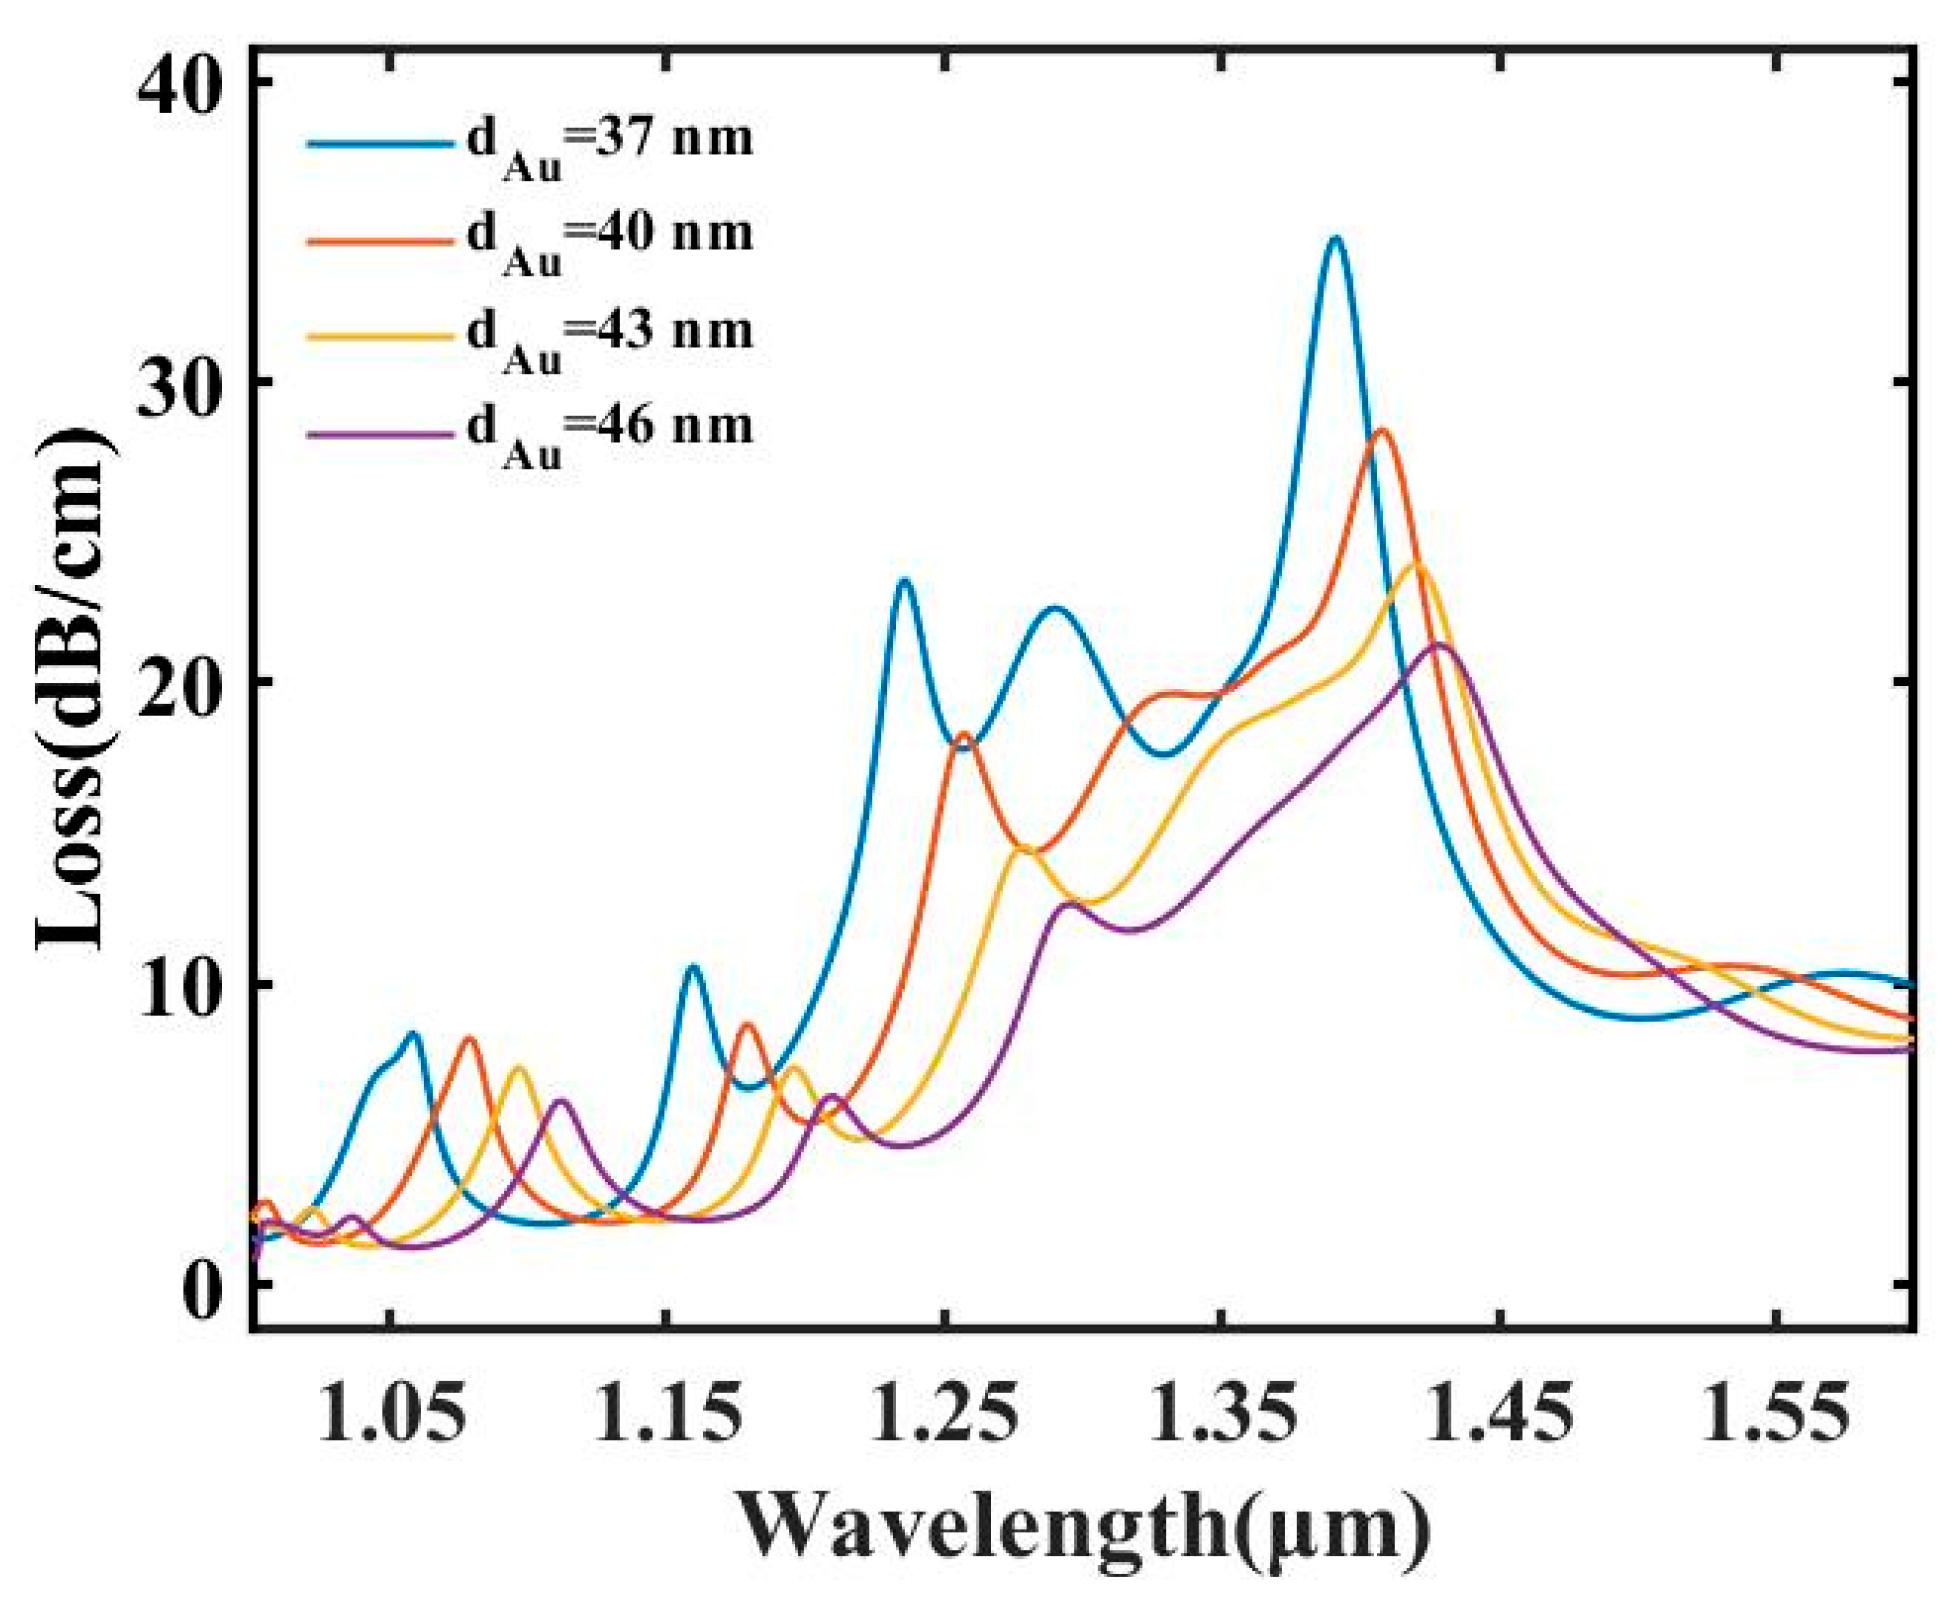
2.2. Influence of Structural Parameters

Firstly, the mode characteristics of the sensor with a refractive index of 1.38 were analyzed, as shown in Figure 2. It can be seen that there are five different loss peaks in the measured wavelength range. At loss peak 1 (1078 nm) and loss peak 2 (1178 nm), the SPP mode of ch1 regulated by the mf is a high-order mode [48]. The temperature-controlled PDMS is low-order only at loss peak 5 (1408 nm). The loss plot for x polarization is not given because the loss value is particularly small in this wavelength range compared to y polarization. Therefore, the following studies will only focus on the y-pol nuclear model. Since all SPR peaks may be related to the temperature and magnetic field, we focused on the influence of these two parameters on the sensor performance during the study. Comparing the SPR peaks, it is found that the y-pol core mode with loss peak 5 has more coupling energy and a higher temperature sensitivity to the SPP mode [49,50], while loss peak 4 is very insignificant and can even be found to be coupled with loss peak 5 later. Since most coupling modes occur in the long-wavelength range, the sensor is more sensitive.
The influence of Ta2O5 on the sensing performance was studied. Figure 3 shows the relation of the loss spectrum with or without Ta2O5. Figure 2 shows that without Ta2O5, loss peak 1 and loss peak 4 have little influence, while loss peak 2, loss peak 3 and loss peak 4 seem to disappear. Because in Figure 2, we can see that the main mode of loss peak 4 is in ch1, while the other four peaks are the result of the joint action of ch1 and ch2, the electric field of the SPP mode exists in the PDMS and MF. Therefore, it is not difficult to conclude that in the absence of Ta2O5, the temperature sensitivity is very low, and, on the contrary, when ch2 is coated with Ta2O5 films, the SPP mode is further penetrated in the PDMS [51]. The results show that the Ta2O5 thickness can obviously affect the SPR peak value, and different SPR peaks can be separated better to reduce the mutual influence between them [52,53]. At the same time, the increase in the SPP mode energy that occurs in the circular hole containing PDMS can improve the sensitivity [54].
Then, the thickness of the Ta2O5 film is optimized. The loss spectrum is shown in the figure, where Ta2O5 goes from 37 to 46 nm. By observing the dark-blue curve, it can be found that there are four obvious peaks. In relation to the other three colors, when the thickness of Ta2O5 increases, the corresponding wavelength of each peak is redshifted and, until the red line can be found, there are only three distinct peaks [55]. One of the peaks increases with the increase in the thickness of Ta2O5, which is due to the enhanced energy coupling capacity of Ta2O5. As shown in Figure 4, the highest losses under different Ta2O5 thicknesses are 30.98dB cm−1, 28.4 dB cm−1, 29.83 dB cm−1 and 33.66 dB cm−1. The wavelength intervals are 46, 48 and 50 nm. It can be found that when Ta2O5 went from 37 to 46 nm, the maximum peak value did not change significantly, and the reason why 37 nm is a slightly higher maximum loss is that loss peak 4 and loss peak 5 are coupled together. The sensor is set at 46 nm, the loss is obvious, the observation sensitivity is good and the crosstalk is low.
As the key to stimulate the SPR effect, it is necessary to discuss the influence of gold on the sensor, as shown in Figure 5. It can be seen from the loss spectrum that the thinner the gold, the higher the loss value corresponding to each peak value. But, overall, the difference is not particularly large, but in the manufacturing process, thinner gold will lead to a more difficult process [56]. In particular, only SPR peak 3 has the most obvious change in loss value, when the gold was thinner, and the other loss peaks are relatively not so prominent. Therefore, to sum up, it is appropriate to select 40 nm gold for the next study.

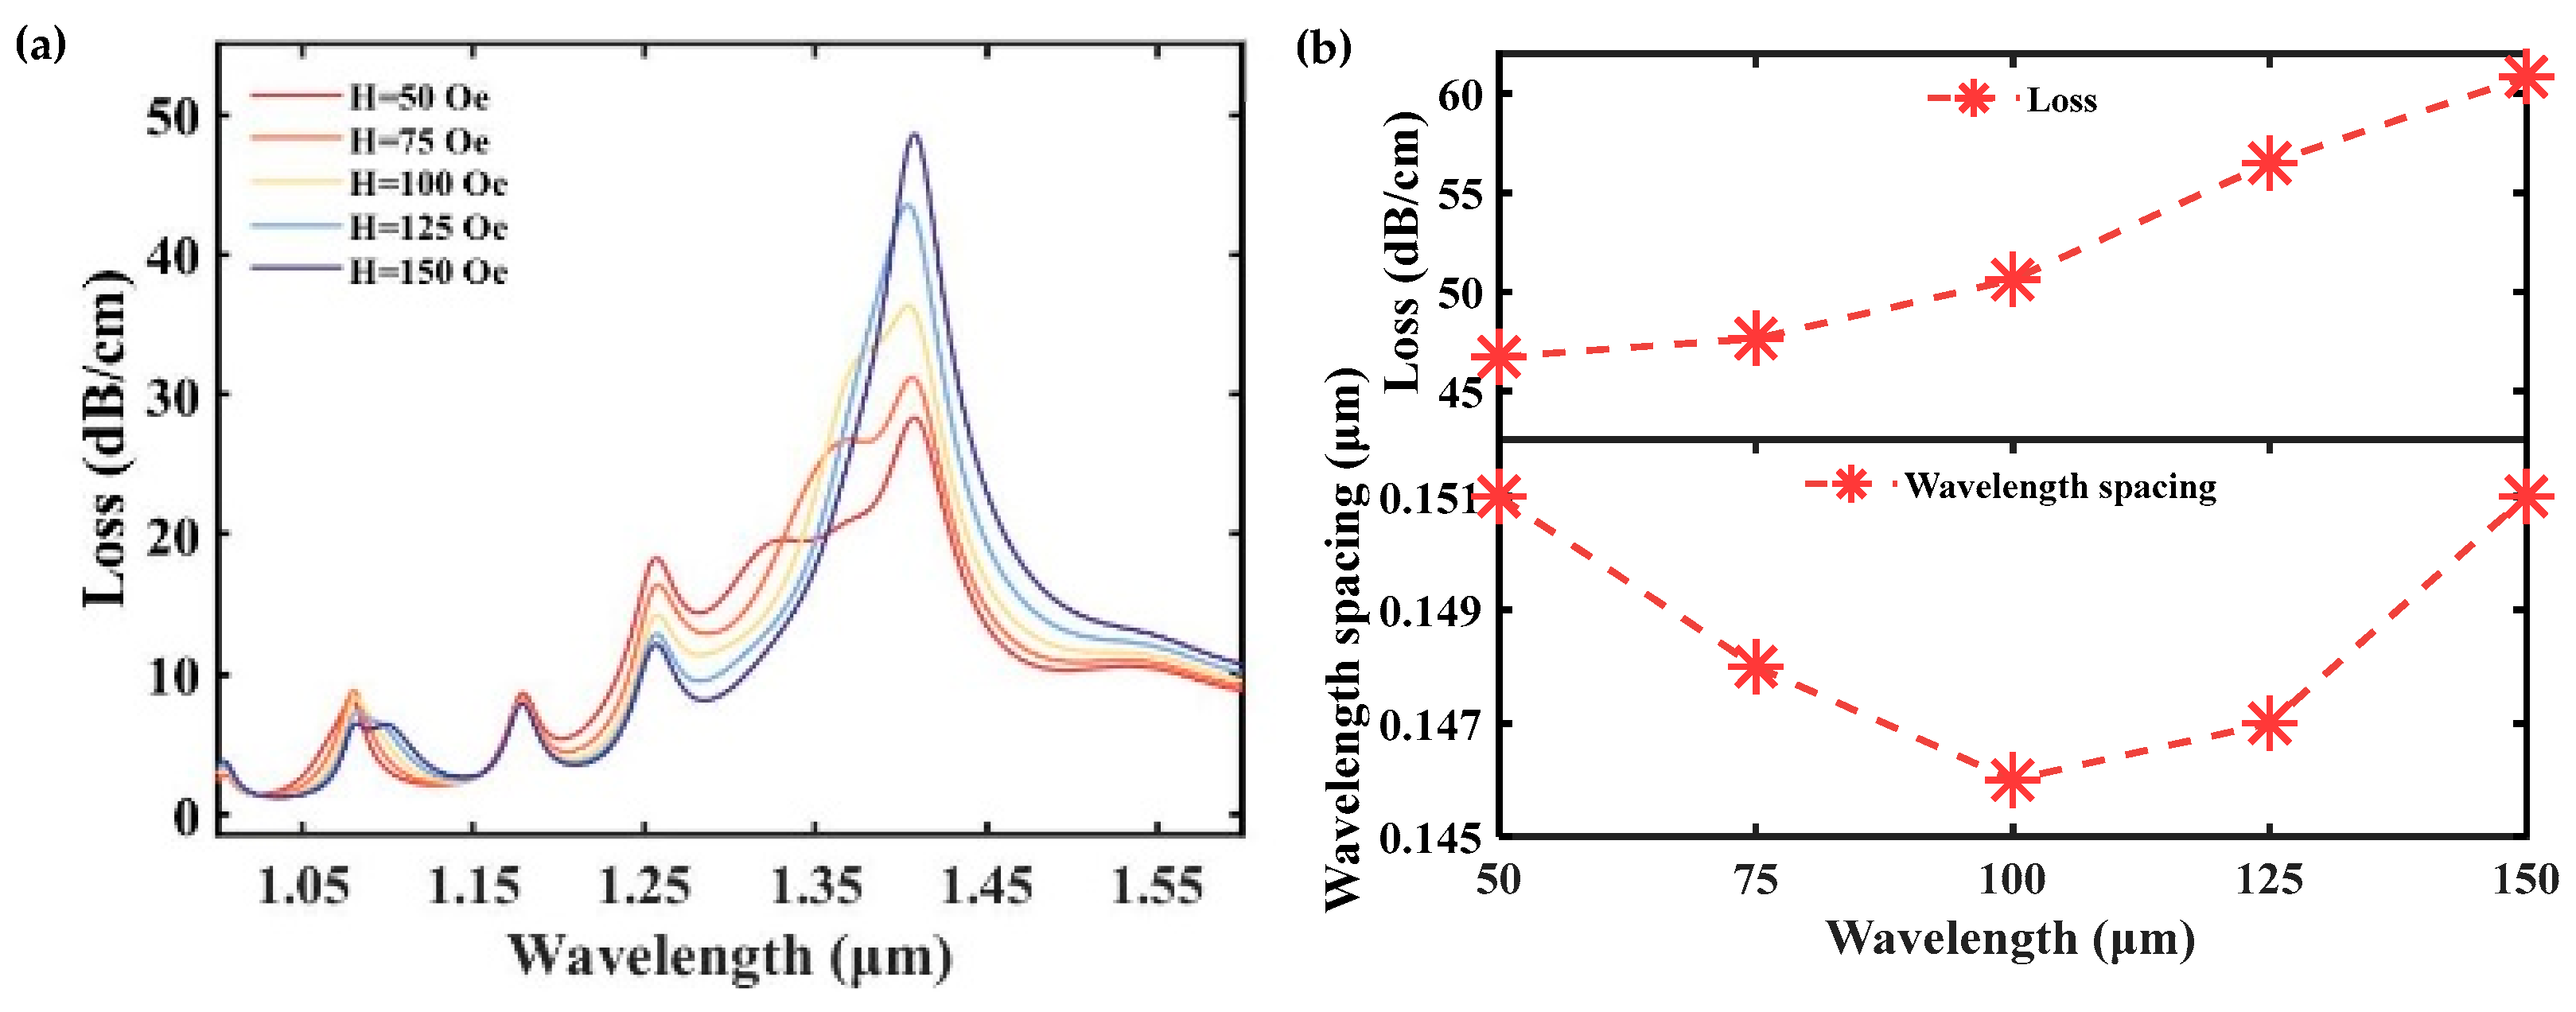
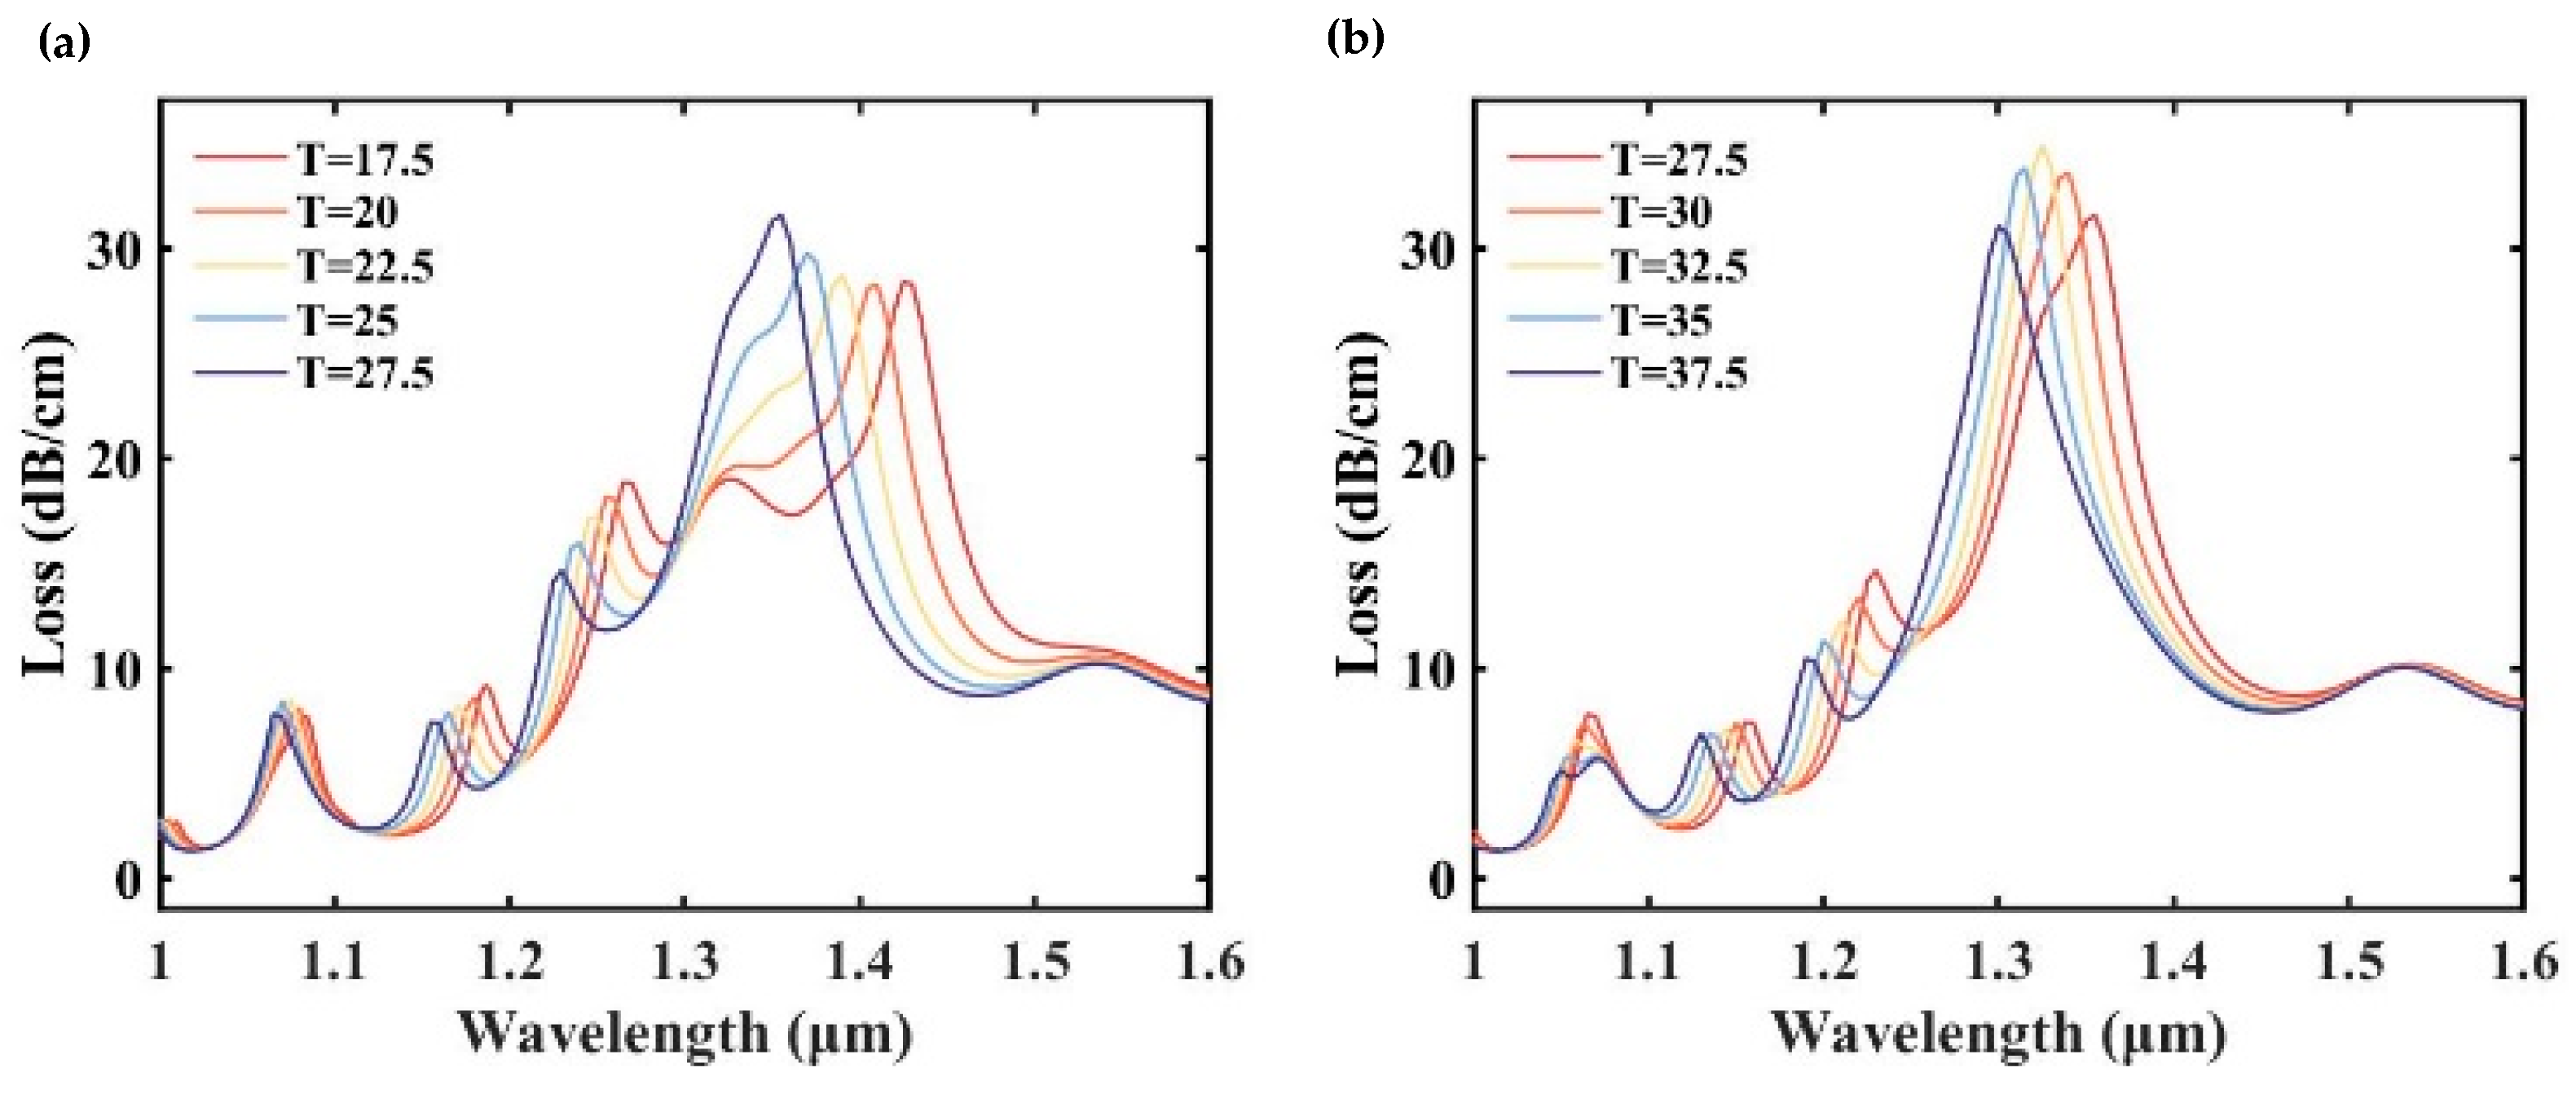
3. Effect of Temperature and Magnetic Field

The flexible structure is one of the advantages of the sensor, and the size and arrangement of the pores play a crucial role in the study of the sensor performance [57,58]. Figure 6 depicts the distance position relationship between the small pores that constrain evanescent waves. In the section diagram given, Figure 6b,e,h is the relationship curve between the wavelength and loss, and Figure 6e,f,i is their contour diagram. It can be seen from Figure 6a–c that when the constrained pore diameter gradually increases from 0.8 to 1.4 μm, the energy loss decreases, and the loss peak gradually smooths out, but it does not move significantly. The loss values of the highest loss peaks are 40.82 dB cm−1, 28.25 dB cm−1, 18.26 dB cm−1 and 10.78 dB cm−1, and the corresponding wavelengths of the maximum loss peaks are 1410 nm, 1410 nm, 1405 nm and 1405 nm, respectively. This shows that if the confined porosity is too large, it will affect the transmission of polarized light. Figure 6e shows the dependence of the loss on the resonance wavelength when the porosity is constrained. As can be seen from Figure 6d–f, when the distance between the restraint hole and the core changes from 5 to 7 μm, the loss peak becomes obvious. But there is no significant redshift or blueshift. The loss values of the highest loss peaks are 84.73 dB cm−1, 54.5 dB cm−1, 28.4 dB cm−1 and 10.37 dB cm−1, respectively, and the corresponding wavelengths of the maximum loss peaks are all 1408 nm. By comparing Figure 6f–g, it can be seen that the contour diagram is symmetrical up and down, which indicates that the constraint of the constraint hole on the polarized light will be weaker as the distance gradually increases. In the contour diagram, red and blue represent, respectively, the highest and lowest energies in the color card on the right. The corresponding d1 = 0.8 μm corresponds to the highest energy at a wavelength of 1.4 μm, and d2 = 70 μm corresponds to the highest energy at a wavelength of 1.4 μm. As can be seen from Figure 6d–f, the influence of the constrained pore spacing on the loss-making wind corresponding to longer wavelengths is rather chaotic. The maximum losses of peak 5 with its change are 42.49 dB cm−1, 30.26 dB cm−1, 28.4 dB cm−1, 31.01 dB cm−1 and 34.92 dB cm−1, corresponding to the wavelengths of 1436 nm, 1422 nm, 1408 nm, 1396 nm and 1380 nm. The reason for the transition is that loss peak 4 and loss peak 5 are gradually coupled. It can be guessed that different pore positions can make polarized light transmit from different places, thereby leading to a relatively chaotic loss spectrum state.
The magnetic field temperature performance of the optimized sensor is studied in this paper. Figure 7 shows the result of the perception data. Since the PDMS is not affected by the magnetic field, the second peak in Figure 7a does not change. However, the first loss peak is split due to increasing changes in the magnetic field, presumably because the SPP is a higher-order mode. When the magnetic field is 50 Oe, loss peak 4 gradually redshifts to loss peak 5 corresponding to a longer wavelength. Therefore, with the increase in the magnetic field strength, the loss of the highest loss peak gradually increases because when the magnetic field strength is greater, the new loss peak contains the original two loss peaks [59]. Figure 7b shows the changes in the total loss and wavelength interval for loss peaks 4 and 5. It can be concluded that the field strength increases and the loss increases everywhere in the explored wavelength range, indicating that the magnetic field strength is positively correlated with the energy size. However, the wavelength spacing between loss peak 4 and loss peak 5 does not change significantly. Therefore, due to the change in the magnetic field intensity, the loss peak is affected by PDMS to a certain extent. The energy loss of peak 5 is always the highest. According to Figure 2, the SPP mode is caused by a low-order mode.
The change in the sensor performance at temperatures of 17.5 °C–37.5 °C was studied. The temperature in this section is divided into two parts as shown in Figure 8. This will make the image easier to see. When the temperature is the lowest temperature discussed, 17.5 °C, loss peak 4 is more obvious than the other temperatures, but it gradually disappears as the temperature rises. The most obvious loss peak in the calculated range is 19.01 dB/cm. As can be seen from the simulation diagram in Figure 2, the SPP mode is mainly concentrated in the ch1 region [60,61]. With the increase in temperature, this energy is gradually fitted with loss peak 5, and finally fused into a loss peak. Figure 9d shows the change in loss peak 1. The maximum loss is 8.51771 dB cm−1. The resonance wavelength can be found to blueshift between 17.5 °C and 37.5 °C. The maximum loss peak (loss peak 5) is blueshifted by 130 nm from 17.5 °C to 37.5 °C, with a temperature sensitivity of 6.5 nm/°C. The blueshift of loss peak 2 is 80 nm. The blueshift of loss peak 3 is 54 nm, and the temperature sensitivity is 2.7 nm /°C. By comparing Figure 8a, it can be found that the loss peak is split into two peaks, which indicates that the loss peak generated by the influence of temperature on the PDMS is gradually separated from the interaction between the magnetic field, which is also reflected in the inflection point diagram (32.5 °C) in Figure 9d. It can be seen from Figure 9b,c that with the increase in temperature, the loss peak energy gradually decreases, and the resonance wavelength also decreases, indicating that PDMS affected by temperature plays a leading role, and the MF affected by the magnetic field is not inhibited [62,63]. In Figure 8b, the loss peak value changes by 17.655 dB/cm and the wavelength changes by 40 nm in the temperature range studied. The peak loss variation in the temperature range explored in Figure 9c is 2.143 dB /cm, and the wavelength variation is 59 nm. All we can tell is that the temperature changes the resonance wavelength by about the same amount. Figure 9a shows loss peak 5. It can be seen that, as the temperature increases, the resonance wavelength shifts blue, but there is a less obvious peak. It can be seen that, above 32.5 °C, the increase in temperature causes the blueshift of the loss wind, and the loss peak decreases [64,65,66]. The redshift of loss peak 5 was linearly fitted, as shown in Figure 10. The result is     λ = 6.3 × + 107.14. For loss peak 5, the loss peak value changes by 6.77 dB/cm, and the corresponding wavelength change is 80 nm. Because 32.5 °C is the highest value corresponding to the explored range, all wavelength changes are not 125 nm [67,68]. In Table 1, we present a comparison between our work and the existing work [69,70].

4. Conclusions

In this study, a PCF sensor was designed to respond to temperature and magnetic field changes at the same time. The modal characteristics of the sensor were studied using COMSOL software. It was found that the y-pol core mode has better sensing characteristics, and Ta2O5 can improve the sensitivity of the sensor and reduce the interaction between different SPR peaks. Then, the structural parameters of the sensor, such as the thickness of the gold layer, the thickness of the Ta2O5 and whether there is Ta2O5 or not, were analyzed. Finally, the data obtained from the optimized sensor were analyzed and studied. We found that the temperature sensitivity in the sensor performance was suppressed when the temperature exceeded 32.5°C. The maximum sensitivity of 6.5 nm/°C was calculated from 17.5 °C to 37.5°C. Due to its unique structural characteristics and excellent sensing performance, the sensor has the potential to perform sensing under complex environmental conditions. Selective detection and multi-parameter sensing are the keys to the development of multi-functional PCF sensor devices.

Author Contributions

Conceptualization, T.D., Y.Y. (Yingting Yi), Y.T. and Z.Y.; data curation, T.D., Y.Y. (Yingting Yi), Y.T., Z.Y., Y.Y. (Yougen Yi), S.C., Z.H., C.T., P.W. and Q.Z.; formal analysis, T.D. and Z.Y.; methodology, T.D., Y.Y. (Yingting Yi), Y.T., Z.Y., Y.Y. (Yougen Yi), S.C., Z.H. and Q.Z.; resources, T.D., Y.Y. (Yingting Yi), Y.T. and Q.Z.; software, T.D., Y.Y. (Yingting Yi), Y.T., Z.Y., Y.Y. (Yougen Yi), S.C., and Z.H.; data curation, T.D., S.C. and Z.H.; writing—original draft preparation, T.D.; writing—review and editing, T.D., Y.Y. (Yingting Yi), Y.T., Z.H., C.T., P.W. and Z.Y. All authors have read and agreed to the published version of the manuscript.

Funding

The authors are grateful for the support by the National Natural Science Foundation of China (Nos. 51606158, 11604311, 12074151); the funding by the Natural Science Foundation of Fujian Province (2022J011102, 2022H0048); the funding by the Guangxi Science and Technology Base and Talent Special Project (No. AD21075009); the funding by the Sichuan Science and Technology Program (No. 2021JDRC0022); the funding by the Research Project of the Fashu Foundation (MFK23006); the funding by the Open Fund of the Key Laboratory for Metallurgical Equipment and Control Technology of Ministry of Education at Wuhan University of Science and Technology, China (Nos. MECOF2022B01; MECOF2023B04); the funding by the project supported by the Guangxi Key Laboratory of Precision Navigation Technology and Application, Guilin University of Electronic Technology (No. DH202321); the funding by the Scientific Research Project of Huzhou College (2022HXKM07).

Institutional Review Board Statement

Not applicable.

Informed Consent Statement

Not applicable.

Data Availability Statement

Publicly available datasets were analyzed in this study. These data can be found at [https://www.lumerical.com/].(accessed on 1 January 2020).

Conflicts of Interest

The authors declare no conflicts of interest.

References

  1. Dorr, A.E.; Lerch, J.P.; Spring, S.; Kabani, N.; Henkelman, R.M. High resolution three-dimensional brain atlas using an average magnetic resonance image of 40 adult C57Bl/6J mice. NeuroImage 2008, 42, 60–69. [Google Scholar] [CrossRef]
  2. Luo, J.; Zhang, J.H.; Gao, S.S. Design of Multi-Band Bandstop Filters Based on Mixed Electric and Magnetic Coupling Resonators. Electronics 2024, 13, 1552. [Google Scholar] [CrossRef]
  3. Kim, C.; Sohn, I.B.; Park, H.; Lee, Y.J.; Lee, H. Comparison of laser-assisted damage in soft tissue using bi-directional and forward-firing optical fiber. Opt. Laser Technol. 2014, 56, 196–201. [Google Scholar] [CrossRef]
  4. Li, W.X.; Zhao, W.C.; Cheng, S.B.; Zhang, H.F.; Yi, Z.; Sun, T.Y.; Wu, P.H.; Zeng, Q.D.; Raza, R. Tunable Metamaterial Absorption Device based on Fabry–Perot Resonance as Temperature and Refractive Index Sensing. Opt. Lasers Eng. 2024, 181, 108368. [Google Scholar] [CrossRef]
  5. Reyes, M.; Monzón-Hernández, D.; Martínez-Ríos, A.; Silvestre, E.; Díez, A.; Cruz, J.L.; Andrés, M.V. A Refractive Index Sensor Based on the Resonant Coupling to Cladding Modes in a Fiber Loop. Sensors 2013, 13, 11260–11270. [Google Scholar] [CrossRef]
  6. Leal-Junior, A.; Avellar, L.; Biazi, V.; Soares, M.S.; Frizera, A.; Marques, C. Multifunctional flexible optical waveguide sensor: On the bioinspiration for ultrasensitive sensors development. Opto-Electron. Adv. 2022, 5, 210098. [Google Scholar] [CrossRef]
  7. Liu, H.H.; Hu, D.J.J.; Sun, Q.Z.; Wei, L.; Li, K.W.; Liao, C.; Li, B.; Zhao, C.; Dong, X.; Tang, Y.; et al. Specialty optical fibers for advanced sensing applications. Opto-Electron. Sci. 2023, 2, 220025. [Google Scholar] [CrossRef]
  8. Ma, J.; Wu, P.H.; Li, W.X.; Liang, S.R.; Shangguan, Q.Y.; Cheng, S.B.; Tian, Y.H.; Fu, J.Q.; Zhang, L.B. A five-peaks graphene absorber with multiple adjustable and high sensitivity in the far infrared band. Diam. Relat. Mater. 2023, 136, 109960. [Google Scholar] [CrossRef]
  9. Deng, J.H.; Xiong, H.; Yang, Q.; Wang, B.X.; Zhang, H.Q. Metasurface-based Microwave Power Detector for Pola-ri-zation Angle Detection. IEEE Sens. J. 2023, 23, 22459–22465. [Google Scholar] [CrossRef]
  10. Jiang, S.L.; Chen, F.F.; Zhao, Y.; Gao, S.F.; Wang, Y.Y.; Ho, H.L.; Jin, W. Broadband all-fiber optical phase modulator based on photo-thermal effect in a gas-filled hollow-core fiber. Opto-Electron. Adv. 2023, 6, 220085. [Google Scholar] [CrossRef]
  11. Jing, J.Y.; Liu, K.; Jiang, J.F.; Xu, T.H.; Wang, S.; Liu, T. Highly sensitive and stable probe refractometer based on configurable plasmonic resonance with nano-modified fiber core. Opto-Electron. Adv. 2023, 6, 220072. [Google Scholar] [CrossRef]
  12. Nishitsuji, R.; Sueyoshi, K.; Hisamoto, H.; Endo, T. Fabrication of Gold Nanostructures on Quartz Crystal Microbalance Surface Using Nanoimprint Lithography for Sensing Applications. Micromachines 2022, 13, 1430. [Google Scholar] [CrossRef] [PubMed]
  13. Jiang, B.Q.; Hou, Y.G.; Wu, J.X.; Ma, Y.X.; Gan, X.T.; Zhao, J. In-fiber photoelectric device based on graphene-coated tilted fiber grating. Opto-Electron. Sci. 2023, 2, 230012. [Google Scholar] [CrossRef]
  14. Knight, J.C. Photonic crystal fibres. Nature 2003, 424, 847–851. [Google Scholar] [CrossRef]
  15. Xia, S.X.; Zhai, X.; Wang, L.L.; Wen, S.C. Polarization-independent plasmonic absorption in stacked anisotropic 2D material nanostructures. Opt. Lett. 2020, 45, 93–96. [Google Scholar] [CrossRef]
  16. Zhu, J.; Xiong, J.Y. Tunable terahertz graphene metamaterial optical switches and sensors based on plasma-induced transparency. Measurement 2023, 220, 113302. [Google Scholar] [CrossRef]
  17. Cheng, S.B.; Li, W.X.; Zhang, H.F.; Akhtar, M.N.; Yi, Z.; Zeng, Q.D.; Ma, C.; Sun, T.Y.; Wu, P.H.; Ahmad, S. High sensitivity five band tunable metamaterial absorption device based on block like Dirac semimetals. Opt. Commun. 2024, 569, 130816. [Google Scholar] [CrossRef]
  18. Chen, Z.Y.; Cheng, S.B.; Zhang, H.F.; Yi, Z.; Tang, B.; Chen, J.; Zhang, J.G.; Tang, C.J. Ultra wideband absorption absorber based on Dirac semimetallic and graphene metamaterials. Phys. Lett. A 2024, 517, 129675. [Google Scholar] [CrossRef]
  19. Xiong, H.; Ma, X.D.; Wang, B.X.; Zhang, H.Q. Design and analysis of an electromagnetic energy conversion device. Sens. Actuators A Phys. 2024, 366, 114972. [Google Scholar] [CrossRef]
  20. Xia, S.X.; Zhai, X.; Huang, Y.; Liu, J.Q.; Wang, L.L.; Wen, S.C. Multi-band perfect plasmonic absorptions using rectangular graphene gratings. Opt. Lett. 2017, 42, 3052–3055. [Google Scholar] [CrossRef] [PubMed]
  21. Zheng, Y.; Khan, F.; Asrafali, B.; Wang, Q. Photonic Crystal Waveguides Composed of Hyperbolic Metamaterials for High-FOM Nano-Sensing. Crystals 2023, 13, 1389. [Google Scholar] [CrossRef]
  22. Li, W.; Cheng, S.; Zhang, H.; Yi, Z.; Tang, B.; Ma, C.; Wu, P.; Zeng, Q.; Raza, R. Multi-functional metasurface: Ultra-wideband/multi-band absorption switching by adjusting guided mode resonance and local surface plasmon resonance effects. Commun. Theor. Phys. 2024, 76, 065701. [Google Scholar] [CrossRef]
  23. Li, W.X.; Liu, Y.H.; Ling, L.; Sheng, Z.X.; Cheng, S.B.; Yi, Z.; Wu, P.H.; Zeng, Q.D.; Tang, B.; Ahmad, S. The tunable absorber films of grating structure of AlCuFe quasicrystal with high Q and refractive index sensitivity. Surf. Interfaces 2024, 48, 104248. [Google Scholar] [CrossRef]
  24. Gu, P.; Yang, H.J.; Li, D.Q.; Zhu, H.Q.; Chen, J.; Zhang, Z.X.; Yan, Z.D.; Tang, C.J.; Liu, F.X.; Chen, Z. High-Q and intense lattice plasmon resonance in hexagonal nonclose packed thin silver nanoshells array. J. Phys. Chem. C 2024, 128, 6431–6437. [Google Scholar] [CrossRef]
  25. Yablonovitch, E. Inhibited spontaneous emission in solid-state physics and electronics. Phys. Rev. Lett. 1987, 58, 2059. [Google Scholar] [CrossRef] [PubMed]
  26. Joannopoulos, J.D.; Villeneuve, P.R.; Fan, S. Photonic crystals. Solid. State Commun. 1997, 102, 165–173. [Google Scholar] [CrossRef]
  27. She, Y.; Liu, D.; Li, J.; Yao, M.; Zheng, Y.; Wu, F. Tunable wide-angle high-efficiency polarization selectivity based on a one-dimensional photonic crystal containing elliptical metamaterials. Phys. Lett. A 2024, 494, 129299. [Google Scholar] [CrossRef]
  28. Wu, F.; Chen, M.; Xiao, S. Wide-angle polarization selectivity based on anomalous defect mode in photonic. Opt. Lett. 2022, 47, 2153–2156. [Google Scholar] [CrossRef]
  29. Yan, M.; Shum, P. Guidance varieties in photonic crystal fibers. J. Opt. Soc. Am. B 2006, 23, 1684–1691. [Google Scholar] [CrossRef]
  30. Xiong, H.; Deng, J.H.; Yang, Q.; Wang, X.; Zhang, H.Q. A metamaterial energy power detector based on electromag-netic energy harvesting technology. ACS Appl. Electron. Mater. 2024, 6, 1204–1210. [Google Scholar] [CrossRef]
  31. Khonina, S.N.; Kazanskiy, N.L.; Butt, M.A.; Karpeev, S.V. Optical multiplexing techniques and their marriage for on-chip and optical fiber communication: A review. Opto-Electron. Adv. 2022, 5, 210127. [Google Scholar] [CrossRef]
  32. Imas, J.J.; Matías, I.R.; Del Villar, I.; Ozcáriz, A.; Zamarreño, C.R.; Albert, J. All-fiber ellipsometer for nanoscale dielectric coatings. Opto-Electron. Adv. 2023, 6, 230048. [Google Scholar] [CrossRef]
  33. Lv, J.W.; Li, W.; Wang, J.X.; Lu, X.L.; Li, Q.; Ren, Y.R.; Yu, Y.; Liu, Q.; Chu, P.K.; Liu, C. High-sensitivity strain sensor based on an asymmetric tapered air microbubble Fabry-Pérot interferometer with an ultrathin wall. Opt. Express 2024, 32, 19057–19068. [Google Scholar] [CrossRef]
  34. Wu, G.X.; Zhu, R.Z.; Lu, Y.Q.; Hong, M.; Xu, F. Optical scanning endoscope via a single multimode optical fiber. Opto-Electron. Sci. 2024, 3, 230041. [Google Scholar] [CrossRef]
  35. Liang, S.R.; Xu, F.; Li, W.X.; Yang, W.X.; Cheng, S.B.; Yang, H.; Chen, J.; Yi, Z.; Jiang, P.P. Tunable smart mid infrared thermal control emitter based on phase change material VO2 thin film. Appl. Therm. Eng. 2023, 232, 121074. [Google Scholar] [CrossRef]
  36. Luo, J. Dynamical behavior analysis and soliton solutions of the generalized Whitham–Broer–Kaup–Boussineq–Kupershmidt equations. Results Phys. 2024, 60, 107667. [Google Scholar] [CrossRef]
  37. Khan, M.R.H.; Chowdhury, A.A.; Islam, M.R.; Hosen, M.S.; Mim, M.H.; Nishat, M.M. Wave-Shaped Microstructure Cancer Detection Sensor in Terahertz Band: Design and Analysis. Appl. Sci. 2023, 13, 5784. [Google Scholar] [CrossRef]
  38. Pan, J.; Wang, Q.; Gao, S.K.; Zhang, Z.; Xie, Y.; Yu, L.; Zhang, L. Knot-inspired optical sensors for slip detection and friction measurement in dexterous robotic manipulation. Opto-Electron. Adv. 2023, 6, 230076. [Google Scholar] [CrossRef]
  39. Liang, S.R.; Cheng, S.B.; Zhang, H.F.; Yang, W.X.; Yi, Z.; Zeng, Q.D.; Tang, B.; Wu, P.; Ahmad, S.; Sun, T. Structural color tunable intelligent mid-infrared thermal control emitter. Ceram. Int. 2024, 50, 23611–23620. [Google Scholar] [CrossRef]
  40. Zhu, H.T.; Luo, J.X.; Dai, Q.; Zhu, S.G.; Yang, H.; Zhou, K.; Zhan, L.; Xu, B.; Chen, Y.; Lu, Y.; et al. Spatiotemporal hemodynamic monitoring via configurable skin-like microfiber Bragg grating group. Opto-Electron. Adv. 2023, 6, 230018. [Google Scholar] [CrossRef]
  41. Gigli, C.; Leo, G. All-dielectric χ(2) metasurfaces: Recent progress. Opto-Electron. Adv. 2022, 5, 210093. [Google Scholar] [CrossRef]
  42. Li, W.; Yi, Y.; Yang, H.; Cheng, S.; Yang, W.X.; Zhang, H.; Yi, Z.; Yi, Y.; Li, H. Active Tunable Terahertz Band-width Absorber Based on single layer Graphene. Commun. Theor. Phys. 2023, 75, 045503. [Google Scholar] [CrossRef]
  43. Xie, Y.D.; Liu, Z.M.; Zhou, F.Q.; Luo, X.; Gong, Y.M.; Cheng, Z.Q.; You, Y. Tunable nonreciprocal metasurfaces based on nonlinear quasi-Bound state in the Continuum. Opt. Lett. 2024, 49, 3520–3523. [Google Scholar] [CrossRef]
  44. Du, H.; Cai, L.; Ma, Z.; Rao, Z.; Shu, X.; Jiang, S.; Li, Z.; Li, X. A Method for Identifying External Short-Circuit Faults in Power Transformers Based on Support Vector Machines. Electronics 2024, 13, 1716. [Google Scholar] [CrossRef]
  45. Kau, Y.-L.; Lin, I.-H.; Juang, C.-L.; Chang, C.-K.; Ho, W.-H.; Wen, H.-C. Metabolite Variations in the Hippocampus and Corpus Callosum of Patients with Mild Cognitive Impairment Using Magnetic Resonance Spectroscopy with Three-Dimensional Chemical Shift Images. Brain Sci. 2023, 13, 1244. [Google Scholar] [CrossRef]
  46. Alghalayini, A.; Hossain, K.R.; Moghaddasi, S.; Turkewitz, D.R.; D’Amario, C.; Wallach, M.; Valenzuela, S.M. In Vitro Enzymatic Studies Reveal pH and Temperature Sensitive Properties of the CLIC Proteins. Biomolecules 2023, 13, 1394. [Google Scholar] [CrossRef]
  47. Li, Z.; Chen, J.X.; Li, L.Z.; Zhang, J.J.; Yao, J.P. Exceptional-point-enhanced sensing in an all-fiber bending sensor. Opto-Electron. Adv. 2023, 6, 230019. [Google Scholar] [CrossRef]
  48. Yu, W.; Yao, N.; Pan, J.; Fang, W.; Li, X.; Tong, L.M.; Zhang, L. Highly sensitive and fast response strain sensor based on evanescently coupled micro/nanofibers. Opto-Electron. Adv. 2022, 5, 210101. [Google Scholar] [CrossRef]
  49. Kosoy, G.; Miller, B.L. Two Decades of Arrayed Imaging Reflectometry for Sensitive, High-Throughput Biosensing. Biosensors 2023, 13, 870. [Google Scholar] [CrossRef]
  50. Li, W.X.; Liu, M.S.; Cheng, S.B.; Zhang, H.F.; Yang, W.X.; Yi, Z.; Zeng, Q.D.; Tang, B.; Ahmad, S.; Sun, T.Y. Polarization independent tunable bandwidth absorber based on single-layer graphene. Diam. Relat. Mater. 2024, 142, 110793. [Google Scholar] [CrossRef]
  51. Khonina, S.N.; Kazanskiy, N.L.; Butt, M.A. Optical Fibre-Based Sensors—An Assessment of Current Innovations. Biosensors 2023, 13, 835. [Google Scholar] [CrossRef]
  52. Liang, S.; Xu, F.; Yang, H.; Cheng, S.; Yang, W.; Yi, Z.; Song, Q.; Wu, P.; Chen, J.; Tang, C. Ultra long infrared met-amaterial absorber with high absorption and broad band based on nano cross surrounding. Opt. Laser Technol. 2023, 158, 108789. [Google Scholar] [CrossRef]
  53. Huang, Z.; Zheng, Y.; Li, J.; Cheng, Y.; Wang, J.; Zhou, Z.K.; Chen, L. High-Resolution Metalens Imaging Polarimetry. Nano Lett. 2023, 23, 10991–10997. [Google Scholar] [CrossRef] [PubMed]
  54. Sang, T.; Mi, Q.; Yang, C.Y.; Zhang, X.H.; Wang, Y.K.; Ren, Y.Z.; Xu, T. Achieving asymmetry parameter-insensitive resonant modes through relative shift–induced quasi-bound states in the continuum. Nanophotonics 2024, 13, 1369–1377. [Google Scholar] [CrossRef]
  55. Zhu, J.; Xiong, J.Y. Logic operation and all-optical switch characteristics of graphene surface plasmons. Opt. Express 2023, 31, 36677. [Google Scholar] [CrossRef] [PubMed]
  56. Li, W.X.; Ma, J.; Zhang, H.F.; Cheng, S.B.; Yang, W.X.; Yi, Z.; Yang, H.; Zhang, J.G.; Wu, X.W.; Wu, P.H. Tunable broadband absorber based on a layered resonant structure with a Dirac semimetal. Phys. Chem. Chem. Phys. 2023, 25, 8489–8496. [Google Scholar] [CrossRef]
  57. Gao, H.; Fan, X.H.; Wang, Y.X.; Liu, Y.C.; Wang, X.G.; Xu, K.; Deng, L.; Zeng, C.; Li, T.; Xia, J.; et al. Multi-foci metalens for spectra and polarization ellipticity recognition and reconstruction. Opto-Electron. Sci. 2023, 2, 220026. [Google Scholar] [CrossRef]
  58. Wang, B.X.; Duan, G.Y.; Xu, C.Y.; Jiang, J.Y.; Xu, W.; Pi, F.W. Design of multiple-frequency-band terahertz metamaterial absorbers with adjustable absorption peaks using toothed resonator. Mater. Des. 2023, 225, 111586. [Google Scholar] [CrossRef]
  59. Li, W.X.; Zhao, W.C.; Cheng, S.B.; Yang, W.X.; Yi, Z.; Li, G.F.; Zeng, L.C.; Li, H.L.; Wu, P.H.; Cai, S.S. Terahertz Selective Active Electromagnetic Absorption Film Based on Single-layer Graphene. Surf. Interfaces 2023, 40, 103042. [Google Scholar] [CrossRef]
  60. Zhang, T.X.; Tao, C.; Ge, S.X.; Pan, D.W.; Li, B.; Huang, W.X.; Wang, W.; Chu, L.Y. Interfaces coupling defor-mation mechanisms of liquid-liquid-liquid three-phase flow in a confined microchannel. Chem. Eng. J. 2022, 434, 134769. [Google Scholar] [CrossRef]
  61. Li, Z.L.; Xie, M.X.; Nie, G.Z.; Wang, J.H.; Huang, L.J. Pushing Optical Virus Detection to a Single Particle through a High Q Quasi-bound State in the Continuum in an All-dielectric Metasurface. J. Phys. Chem. Lett. 2023, 14, 10762–10768. [Google Scholar] [CrossRef] [PubMed]
  62. Deng, X.; Shui, T.; Yang, W.X. Inelastic two-wave mixing induced high-efficiency transfer of optical vortices. Opt. Express 2024, 32, 16611–16628. [Google Scholar] [CrossRef]
  63. Fu, R.; Chen, K.X.; Li, Z.L.; Yu, S.H.; Zheng, G.X. Metasurface-based nanoprinting: Principle, design and advances. Opto-Electron. Sci. 2022, 1, 220011. [Google Scholar] [CrossRef]
  64. Liang, X.; Guan, H.; Luo, K.; He, Z.; Liang, A.; Zhang, W.; Lin, Q.; Yang, Z.; Zhang, H.; Xu, C.; et al. Van der Waals integrated LiNbO3/WS2 for High-Performance UV-Vis-NIR Photodetection. Laser Photonics Rev. 2023, 17, 2300286. [Google Scholar] [CrossRef]
  65. Zhang, Y.X.; Pu, M.B.; Jin, J.J.; Lu, X.J.; Guo, Y.H.; Cai, J.; Zhang, F.; Ha, Y.; He, Q.; Xu, M.; et al. Crosstalk-free achromatic full Stokes imaging polarimetry metasurface enabled by polarization-dependent phase optimization. Opto-Electron. Adv. 2022, 5, 220058. [Google Scholar] [CrossRef]
  66. He, Z.; Guan, H.; Liang, X.; Chen, J.; Xie, M.; Luo, K.; An, R.; Ma, L.; Ma, F.; Yang, T.; et al. Broadband, polarization-sensitive, and self-powered high-performance photodetection of hetero-integrated MoS2 on lithium niobate. Research 2023, 6, 0199. [Google Scholar] [CrossRef]
  67. Sherburne, M.; Harjes, C.; Klitsner, B.; Gigax, J.; Ivanov, S.; Schamiloglu, E.; Lehr, J. Rapid Prototyping for Nanoparticle-Based Photonic Crystal Fiber Sensors. Sensors 2024, 24, 3707. [Google Scholar] [CrossRef]
  68. Vladimirova, D.; Pervadchuk, V.; Konstantinov, Y. Manufacture of Microstructured Optical Fibers: Problem of Optimal Control of Silica Capillary Drawing Process. Computation 2024, 12, 86. [Google Scholar] [CrossRef]
  69. Li, B.; Zhang, F.; Yan, X.; Zhang, X.; Wang, F.; Cheng, T. An optical fiber-based surface plasmon resonance sensor for simultaneous measurement of temperature and magnetic field intensity. IEEE Trans. Instrum. Meas. 2021, 71, 7000407. [Google Scholar] [CrossRef]
  70. Wang, D.; Yi, Z.; Ma, G.; Dai, B.; Yang, J.; Zhang, J.; Yu, Y.; Liu, C.; Wu, X.; Bian, Q. Two-channel photonic crystal fiber based on surface plasmon resonance for magnetic field and temperature dual-parameter sensing. Phys. Chem. Chem. Phys. 2022, 24, 21233–21241. [Google Scholar] [CrossRef]
Figure 1. (a) Two-dimensional cross section of the sensor. (b) The sensing model with stack-and-draw fabrication method.
Photonics 11 00784 g001
Figure 2. The y polarization mode of the sensor, and the effective refractive index of the SPP mode and the loss spectrum.
Photonics 11 00784 g002
Figure 3. Loss spectra and electric fields of nuclear modes with and without Ta2O5 films.
Photonics 11 00784 g003
Figure 4. Loss diagram of thickness of Ta2O5 at 37–46 nm.
Photonics 11 00784 g004
Figure 5. Under the initial parameter setting, the loss spectrum changes only when the gold layer thickness changes (from 37 to 46 nm).
Photonics 11 00784 g005
Figure 6. The cross section of the sensor structure under different parameters: the size of the special air hole, the distance from the center of the fiber (three variables (a,d,g)) and the relationship between the three variables and the wavelength (b,e,h); contour analysis (c,f,i).
Photonics 11 00784 g006
Figure 7. (a) Schematic diagram of the loss spectrum of the sensor at different magnetic field intensities of 50~130 Oe. (b) Total loss and change in wavelength spacing of SPR peaks 3 and 4.
Photonics 11 00784 g007
Figure 8. (a) Influence of the optimized sensor on the loss spectra with different temperatures from 17.5°C to 27.5 °C. (b) Influence of the optimized sensor on the loss spectra with different temperatures from 27.5 °C to 37.5 °C.
Photonics 11 00784 g008
Figure 9. (ad) Wavelength variation diagrams corresponding to the maximum losses of SPR peaks.
Photonics 11 00784 g009
Figure 10. Wavelength redshift fitting results at different temperatures.
Photonics 11 00784 g010
Table 1. Comparison of temperature and magnetic field sensitivities of several sensors.
Magnetic Field SensitivityTemperature SensitivityWork
132 pm/Gs (1,320,000 pm/Oe)−1.960 nm/°C (−1960 pm/°C)[69]
65 pm Oe(−1) (65 pm/Oe)520 pm/°C and 2360 pm/°C[70]
40 nm/Oe (40,000 pm/Oe)6.5 nm/°C (6500 pm/°C)This work
Disclaimer/Publisher’s Note: The statements, opinions and data contained in all publications are solely those of the individual author(s) and contributor(s) and not of MDPI and/or the editor(s). MDPI and/or the editor(s) disclaim responsibility for any injury to people or property resulting from any ideas, methods, instructions or products referred to in the content.

