Article

Super-Oscillating Diffractive Optical Spot Generators

by
Markus E. Testorf
1,2,*,†,
Praneeth Gadamsetti
3,†,
Paolo Batoni
4,†,‡ and
Menelaos K. Poutous
3,†
1
Thayer School of Engineering, Dartmouth College, 15 Thayer Drive, Hanover, NH 03755, USA
2
New Hampshire Academy of Science, 95 Dartmouth College Highway, Lyme, NH 03768, USA
3
Department of Physics and Optical Science, University of North Carolina at Charlotte, 9201 University City Blvd., Charlotte, NC 28223, USA
4
NuSpot Technologies LLC, Charlotte, NC 28269, USA
*
Author to whom correspondence should be addressed.
These authors contributed equally to this work.
Current affiliation: Broadcom Inc., Micro Optics, Charlotte, NC 28262, USA.
Photonics 2024, 11(9), 790; https://doi.org/10.3390/photonics11090790 (registering DOI)
Submission received: 23 July 2024 / Revised: 16 August 2024 / Accepted: 19 August 2024 / Published: 23 August 2024
(This article belongs to the Special Issue Recent Advances in Diffractive Optics)

Abstract

:
The prior discrete Fourier transform (PDFT) is applied to the design of super-oscillating diffractive optical elements with rotational symmetry. Numerical simulations of the filter response are used to demonstrate the potential of the PDFT-based approach, which includes a regularization method for improved numerical and functional stability of the filter design. For coherent monochromatic illumination, the Strehl ratio of spot generators as a function of the spot radius is compared to the theoretical upper bound. It is shown that the performance of the PDFT design varies significantly depending on the aperture function and the encoding as a phase-only diffractive element. Experimental results are in good agreement with simulations and demonstrate the moderate demands to implement super-oscillating diffractive optical elements.

1. Introduction

Since Toraldo diFrancia introduced the concept of super-gain antennae to optics [1], there has been continued interest in the design and implementation of diffractive optical elements (DOEs), which generate diffraction patterns with features smaller than the resolution limit of the associated optical system [2,3]. This interest was renewed when super-resolving point spread functions were recognized as specific manifestations within the wider class of super-oscillating signals [4,5,6]. Progress in developing the theoretical framework for the latter has significantly extended the range of optical applications for super-oscillation phenomena [7], namely within the context of computational imaging [8]. Recognizing super-oscillations as a concept with broad implications to optical sciences has also propelled the design and implementation of photonic structures to generate electromagnetic signals with super-resolving response functions [9]. It is noted, however, that the usefulness of super-oscillating signals is generally limited by the trade-off between the minimum feature size and the optical power required to observe the super-oscillating portion of the signal [10,11,12].
The prior discrete Fourier transformation (PDFT) was originally formulated as a linear spectral estimation technique [13] and super-resolution imaging method [14], with applications to phase retrieval [15], image processing [16], and microwave imaging [17]. Prior knowledge about the detected signal in the form of a multiplicative signal component can be used for super-resolved signal recovery [18,19]. The formal similarity with certain classes of super-oscillating signals suggested the use of the PDFT as an attractive alternative to existing methods for designing DOEs with super-ocillating response functions [20]. It can be formally shown that it is always possible to construct a bandlimited signal with a finite number of predetermined discrete sample values [11]. Selecting the discrete sample values strategically results in a continuous super-ocillating signal. The PDFT provides the mechanism to find a closed form solution for the bandlimited signal which interpolates the discrete sampling locations. As an approach for designing super-oscillating DOEs, the PDFT shares properties with competing methods [21]. The earlier use of the PDFT as an algorithm for signal recovery mentioned above, however, facilitates the transfer of insights developed for imaging applications to the domain of optical design, namely, the use of numerical regularization to mitigate the numerical and experimental instabilities associated with super-oscillating signals [22,23].
In this contribution, the PDFT is formulated for the first time in cylindrical coordinates to apply the design algorithm to two-dimensional super-oscillating signals with rotational symmetry. Numerical simulations are used to demonstrate the properties of PDFT-based DOE designs. This includes selected examples of regularized designs. We discuss the encoding of the PDFT output as a phase-only DOE. As an important example of super-oscillating signals, we then focus on super-resolving spot generators. Numerical simulations are used to characterize the PDFT design in terms of the Strehl ratio as a function of the spot radius, which we compare both with a generic non-linear optimization method for DOEs [2], as well as with the theoretical upper bound [10]. The discussion also includes the results of the fabrication and experimental characterization of a spot generator with a spot radius of 0.45 times the diffraction limit. The latter are complementing experimental results for a PDFT-based spot generator design which were published previously [24,25].

2. PDFT-Based Design of Super-Oscillating DOEs

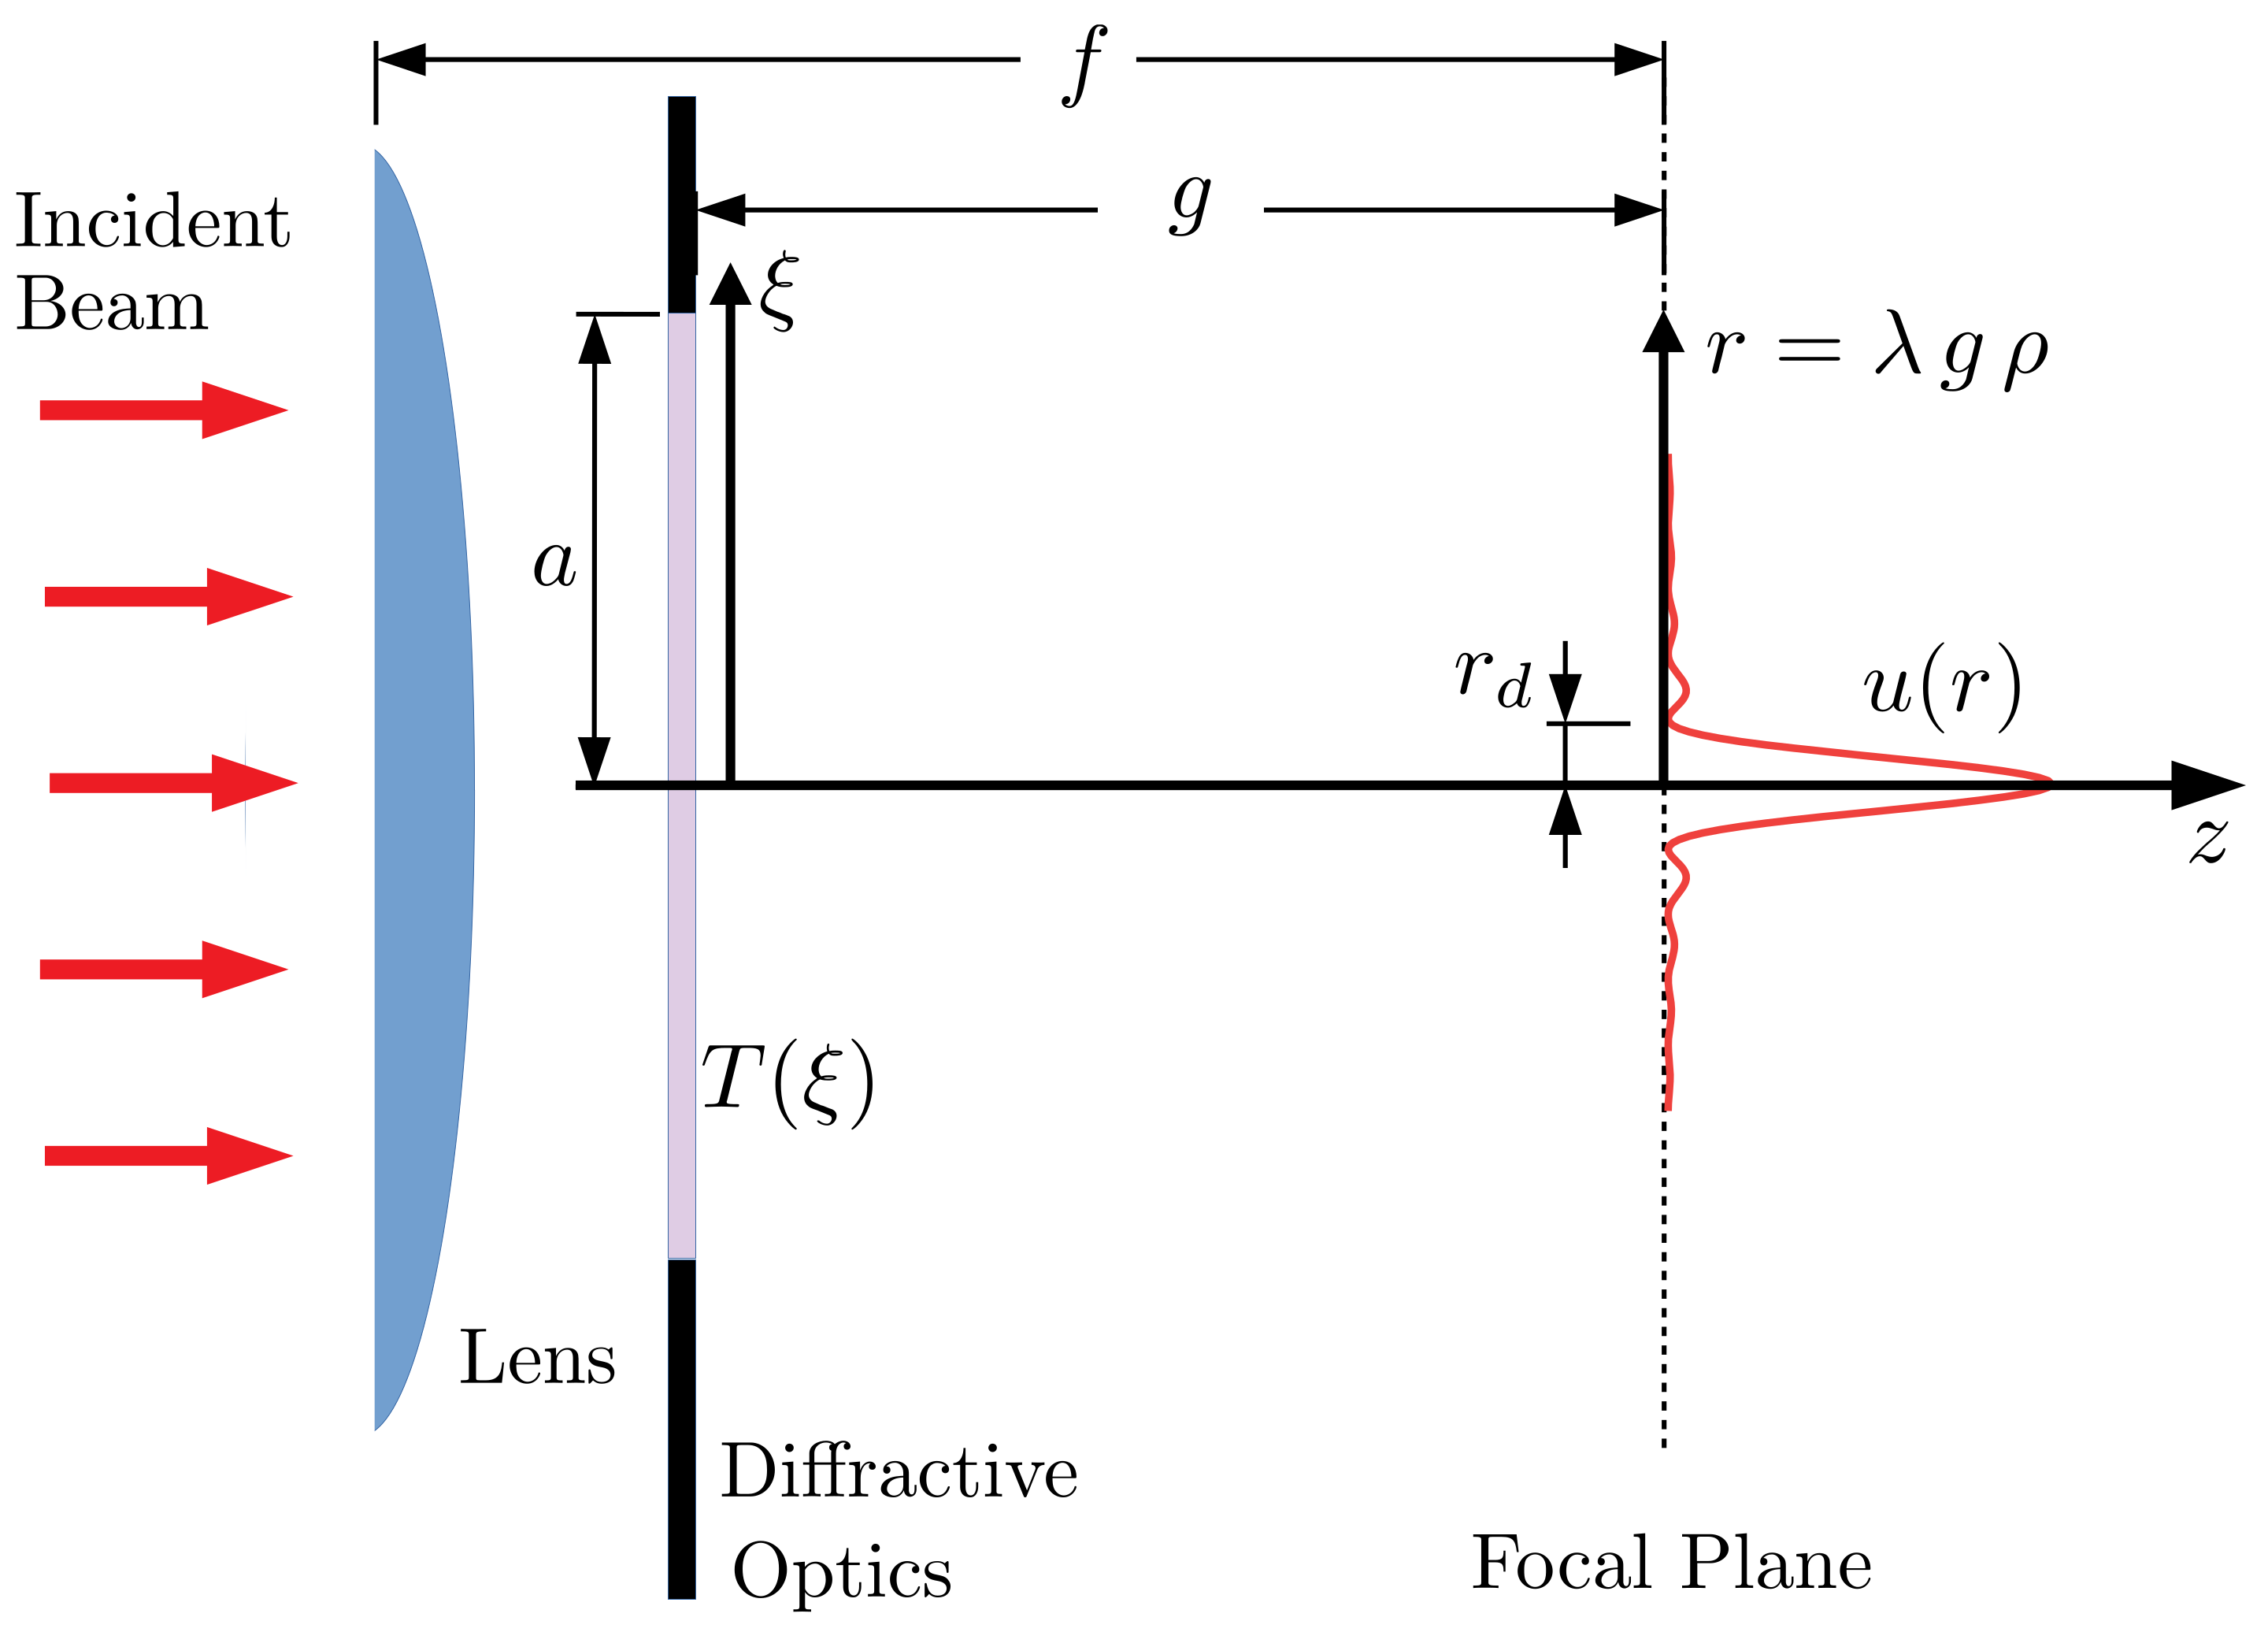
2.1. Optical System Model

The PDFT has been widely used and explored as a signal recovery algorithm [19]. Our goal presently is to formulate the PDFT algorithm explicitly for the first time in cylindrical coordinates for designing super-oscillating two-dimensional signals with axial rotational symmetry.
The system model we consider for the remainder of our discussion is shown in Figure 1. The DOE is illuminated with a coherent optical beam. The lens represents an optical system that focuses the beam to the observation plane. The DOE is placed into the converging beam. This means that in the observation plane we observe the Fraunhofer diffraction pattern of the DOE’s transmission function T ( ξ ) .
Formally, we can model the complex amplitude in the output plane as the two-dimensional Fourier transform of the DOE transmission function. In cylindrical coordinates, this is expressed for systems with a rotational symmetry via the Fourier–Bessel transform [26]
u ( ρ ) = 2 π 0 T ( ξ ) J 0 ( 2 π ρ ξ ) ξ d ξ
where ξ is the radial coordinate in the plane of the DOE. The complex amplitude u ( ρ ) in the output plane is given as a function of the radial spatial frequency ρ . The physical location in the observation plane scales with the wavelength λ and the distance g between the DOE and output plane,
r = λ g ρ
Super-oscillations are characterized in reference to the diffraction limited resolution. Thus, we define the radius of the Airy disc r d in the output plane. For a clear aperture of radius a in the plane of the DOE, we find the well-known relation
r d = 0.61 λ g a
for the radius of the first zero crossing.

2.2. The PDFT Algorithm in Cylindrical Coordinates

One important approach to construct super-oscillating signals is in the form of a superposition of an arbitrary but finite number N of bandlimited functions. If these functions form a set of linearly independent functions, it is possible to determine the expansion coefficients such that the resulting bandlimited function assumes pre-defined values at N arbitrary sampling points [11,22]. The PDFT algorithm can be interpreted as a practical way to determine the superposition coefficients for a wider set of design constraints.
We are seeking a continuous bandlimited function u ( r ) with discrete sample values u n = u ( r n ) , where the bandlimit is determined by the radius a of the DOE, i.e.,
T ( ξ ) = T ( ξ ) c i r c ( ξ / a )
with
c i r c ( ξ ) = 1 i f   ξ 1 0 i f   ξ > 1
We note that, compared to conventional diffractive optics design algorithms, which solve a phase retrieval problem to match | u ( r ) | 2 over some domain in the observation plane, the PDFT-based approach specifies complex amplitude values at discrete locations only. This means that there is in general no phase freedom which may be exploited by the design method.
The PDFT allows us to factor the design problem into the transmission function, which is derived from the discrete samples in the output plane, and a prior, which expresses system constraints independent of the particular signal that is implemented and not subject to design. The latter, most notably, includes the aperture, which defines the bandlimit, but may also consist of any other constraint on the magnitude of the transmission function. This means that we can express the transmission function of the DOE as
T ( ξ ) = P ( ξ ) A ( ξ )
This provides the Fourier transform relationship between the given samples in the output plane and the part of the transmission function that is subject to design as
u n = 2 π 0 A ( ξ ) ϕ n ( ξ ) ξ d ξ
with
ϕ n ( ξ ) = P ( ξ ) J 0 ( 2 π ρ n ξ )
To keep the notation compact, we have expressed the discrete locations in the output plane in terms of ρ rather than r. The functions ϕ n ( ξ ) may be interpreted as an incomplete set of basis functions. For the PDFT to construct super-oscillating signals, it is pivotal that the ϕ n ( ξ ) are linearly independent but not mutually orthogonal.
The PDFT formalism then determines the transmission function A ( ξ ) as a linear superposition of the same set of basis functions,
A ( ξ ) = 2 π k = 0 N 1 a k ϕ k * ( ξ )
Substituting this expression for A ( ξ ) into Equation (7) allows us to obtain the expansion coefficients a k as the solution of a set of simultaneous linear equations,
u n = k = 0 N P n , k a k
with the so-called P-matrix
P n , k = 4 π 2 0 ϕ k * ( ξ ) ϕ n ( ξ ) ξ d ξ = = 4 π 2 0 | P ( ξ ) | 2 J 0 ( 2 π ρ k ξ ) J 0 ( 2 π ρ n ξ ) ξ d ξ
The P-matrix in Equation (11) only depends on the squared magnitude of the prior, which implies that only modulations of the magnitude can be used as prior information.
If the PDFT is used to construct super-oscillating signals, the sampling points ρ n need to be separated by less than the diffraction limit. This generally results in an ill-conditioned P-matrix, which may render the solution of the system sensitive to signal noise, both with respect to the numerical calculation, as well as for the experimental implementation as DOEs. For signal recovery applications of the PDFT, a simple but effective regularization can be implemented by multiplying the matrix elements along the diagonal with a factor 1 + ϵ , with ϵ < < 1 . This Tikhonov-type regularization method can be carried over to the PDFT design algorithm and provides a tuning parameter to balance the degree of super-resolution and the conditioning of the PDFT solution. We consider the option to regularize the solution as one of the pivotal innovations of the PDFT algorithm as compared to competing methods for constructing super-oscillating signals.
Finally, with the transmission function assembled, it is possible to calculate the super-oscillating signal u ( r ) in the output plane as the Fourier transform of T ( ξ ) . The signal, so constructed, automatically obeys the bandlimit imposed by the system aperture and matches the discrete samples u n .
For the case of a circular hard aperture of radius a,
P a ( ρ ) = c i r c ( ρ / a ) ,
the matrix elements of the P-matrix can be calculated explicitly with
P n , k = 4 π 2 0 a J 0 ( 2 π ρ k ξ ) J 0 ( 2 π ρ n ξ ) ξ d ξ ,
which can be evaluated and expressed in closed form [compare for instance [27], Equation (5.22)],
P n , k = 2 π a ρ n 2 ρ k 2 ρ n J 1 ( 2 π ρ n a ) J 0 ( 2 π ρ k a ) ρ k J 1 ( 2 π ρ k a ) J 0 ( 2 π ρ n a )

3. Examples of Super-Oscillating Filter Functions

To explore the capabilities of the PDFT algorithm, as well as its limitations, it is worthwhile to consider a small set of selected super-oscillating system response functions.

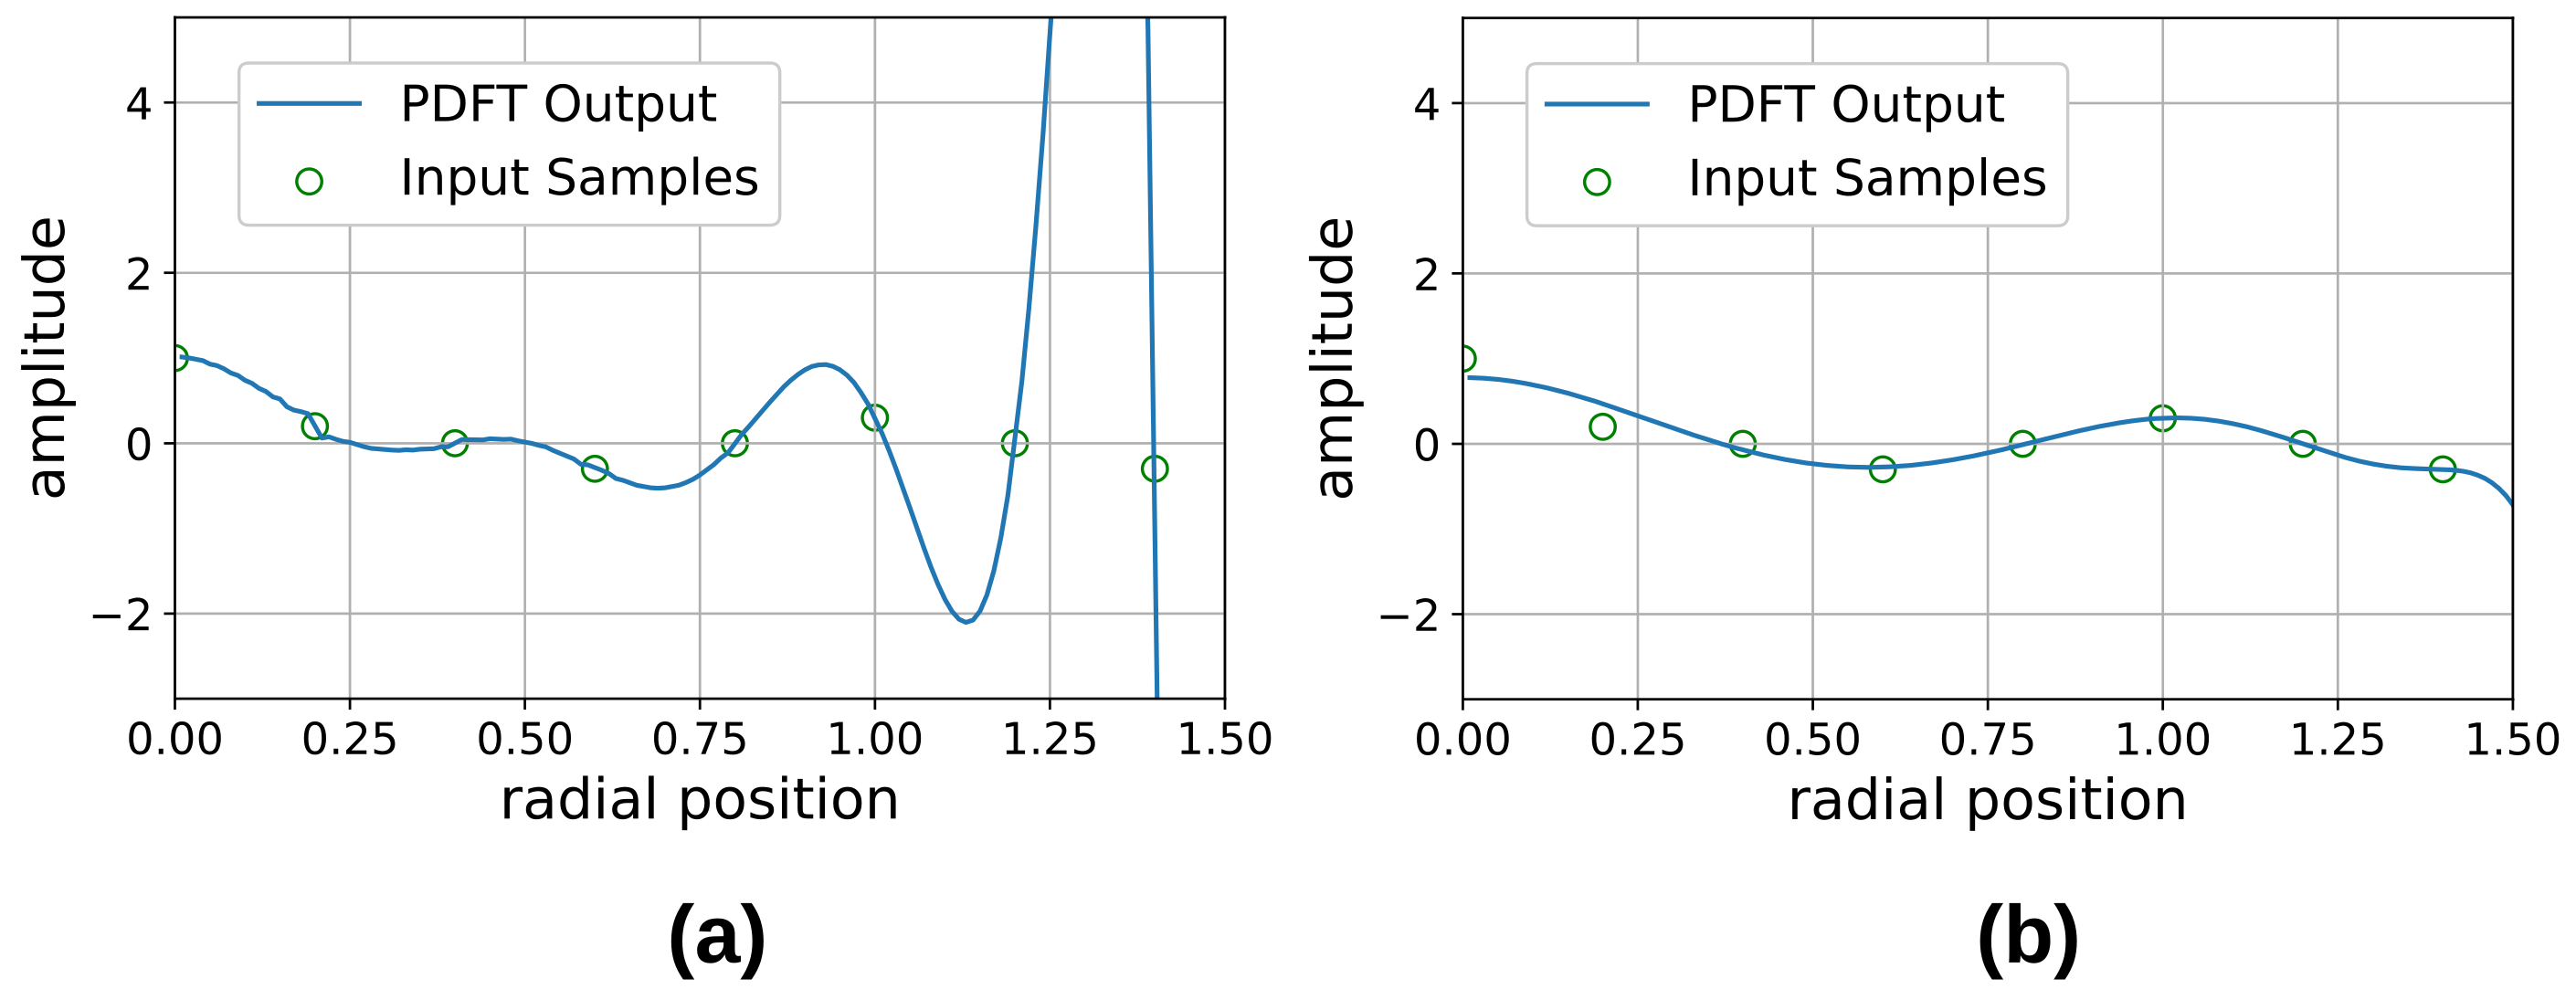
3.1. Regularized PDFT Design

Since the PDFT was first developed as a signal recovery method, it allows one to carry insights gained for super-resolution imaging to the domain of signal synthesis. This includes, in particular, the aforementioned regularization of the P-matrix to improve the condition number of the matrix.
The importance of a regularized design is highlighted by the example in Figure 2. A set of eight randomly selected discrete samples is used as input to the PDFT algorithm. The solid line in Figure 2a shows the bandlimited function that is the result of inverting the P-matrix of the problem. The continuous function is running through all discrete points as expected. The function, however, is not the intuitive interpolation of the discrete points. In particular, the last two points are connected by a trace that oscillates with a large amplitude in between the two samples. If the intention was to select a set of points that resemble the behavior of the continuous trace, the design clearly does not match expectations.
One may expect that the continuous trace of any function can be approximated with increasing accuracy, by adding additional samples. In practice, this is not the case, and instead the condition number of the P-matrix increases significantly with every additional input point.
The regularization offers an alternative to obtain a design that deviates only slightly from the input sample values, but provides a continuous function that matches the expectation formulated with the selection of the discrete samples.

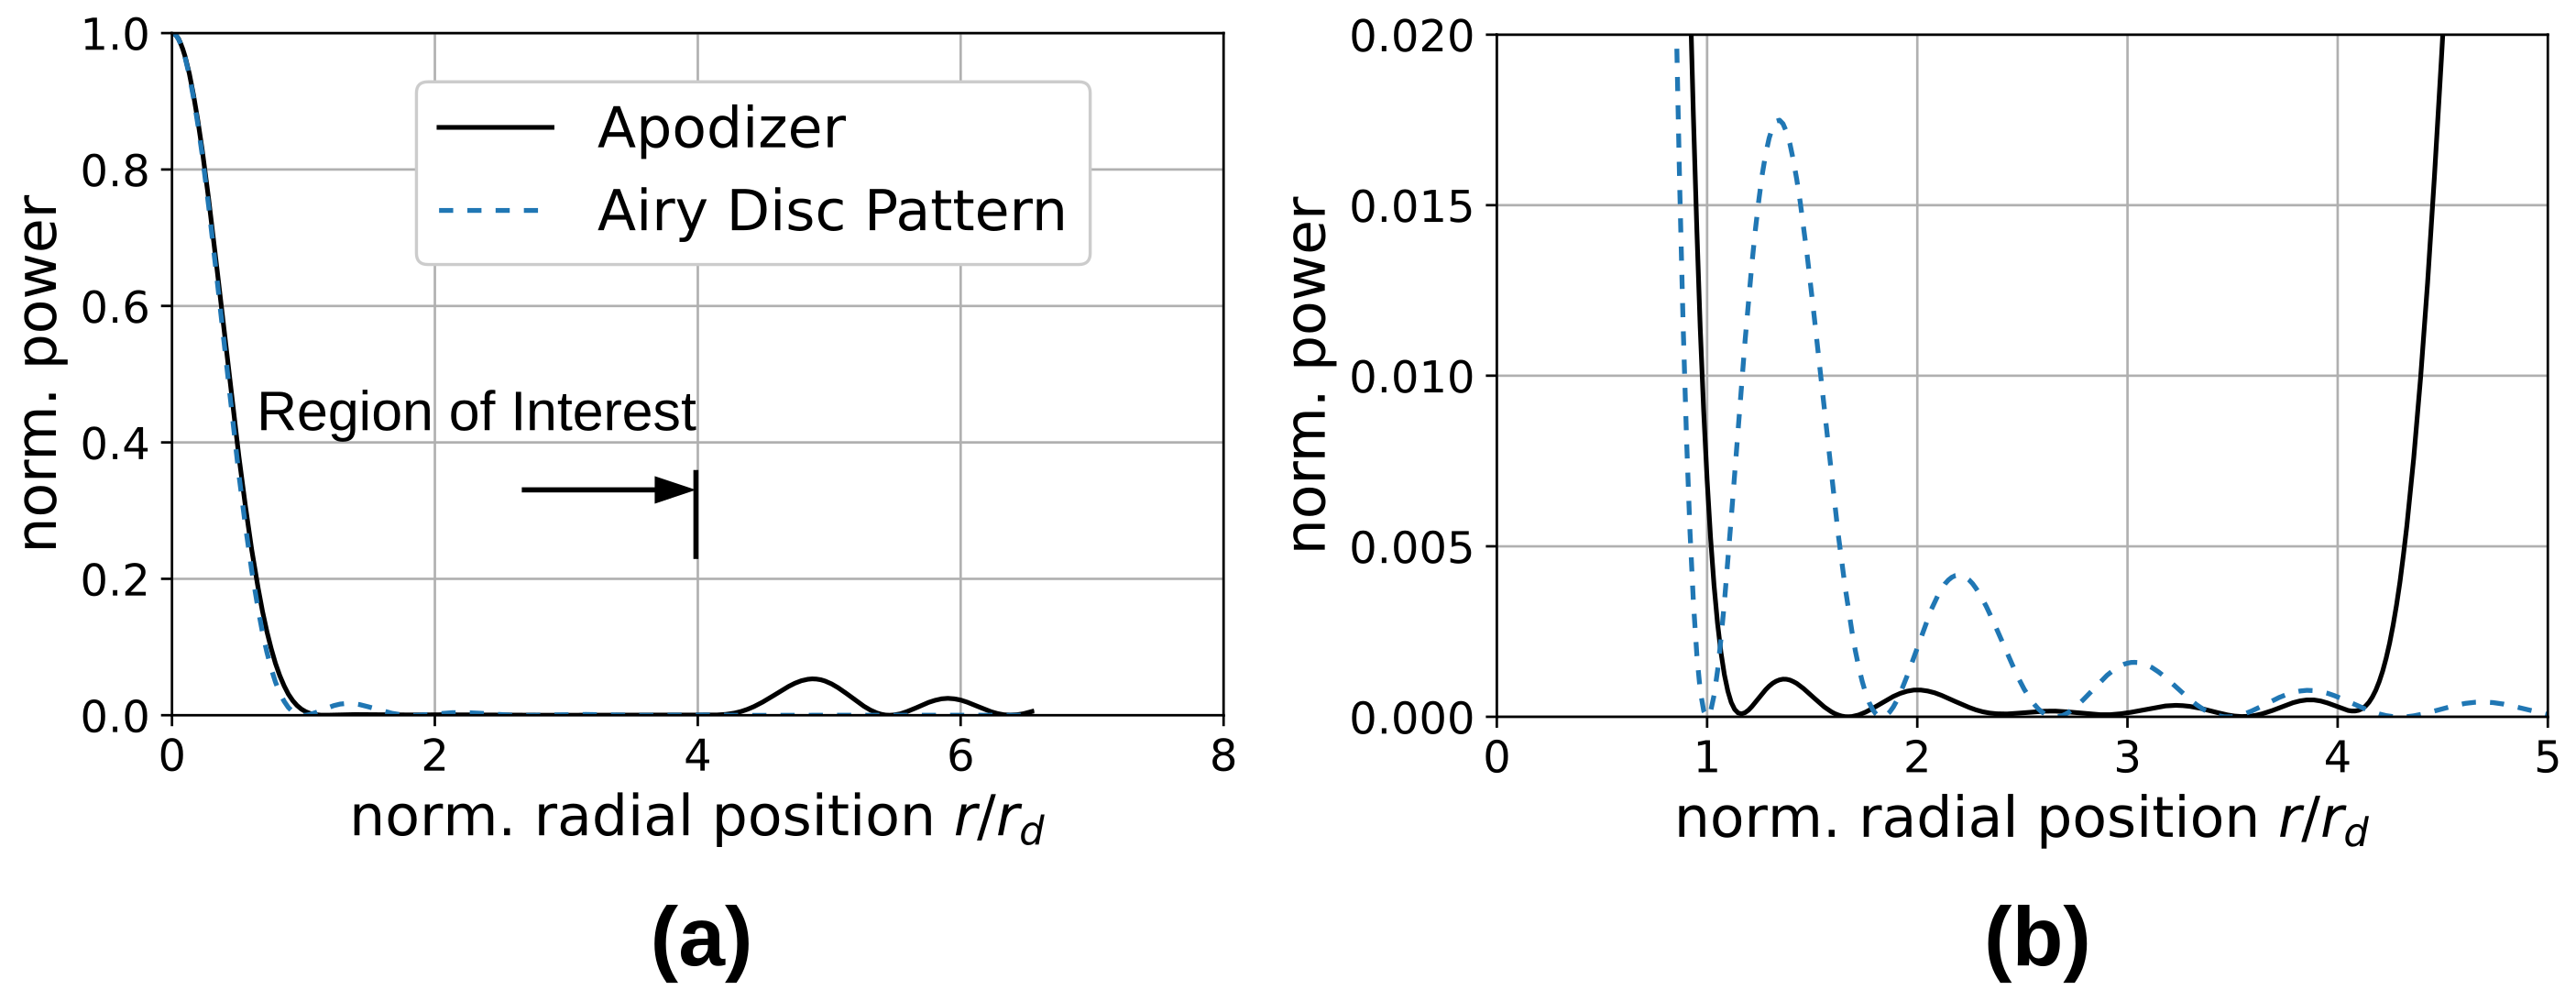
3.2. Side-Lobe Suppression

The example in Figure 3 shows the PDFT design of an apodizer. The radius of the center lobe is slightly larger than the radius of the Airy disc. However, within a region of interest that extends to four times r d , 16 zero-crossings are defined as inputs to the PDFT to reduce the relative magnitude of the side-lobes compared to the diffraction pattern of the Airy disc. Changing the scale of the vertical axis in Figure 3b, it may be observed that the squared magnitude of the first side-lobe of the PDFT design is one order of magnitude smaller than that of the Airy disc. Within the entire region of interest, the power is consistently smaller for corresponding side-lobes.

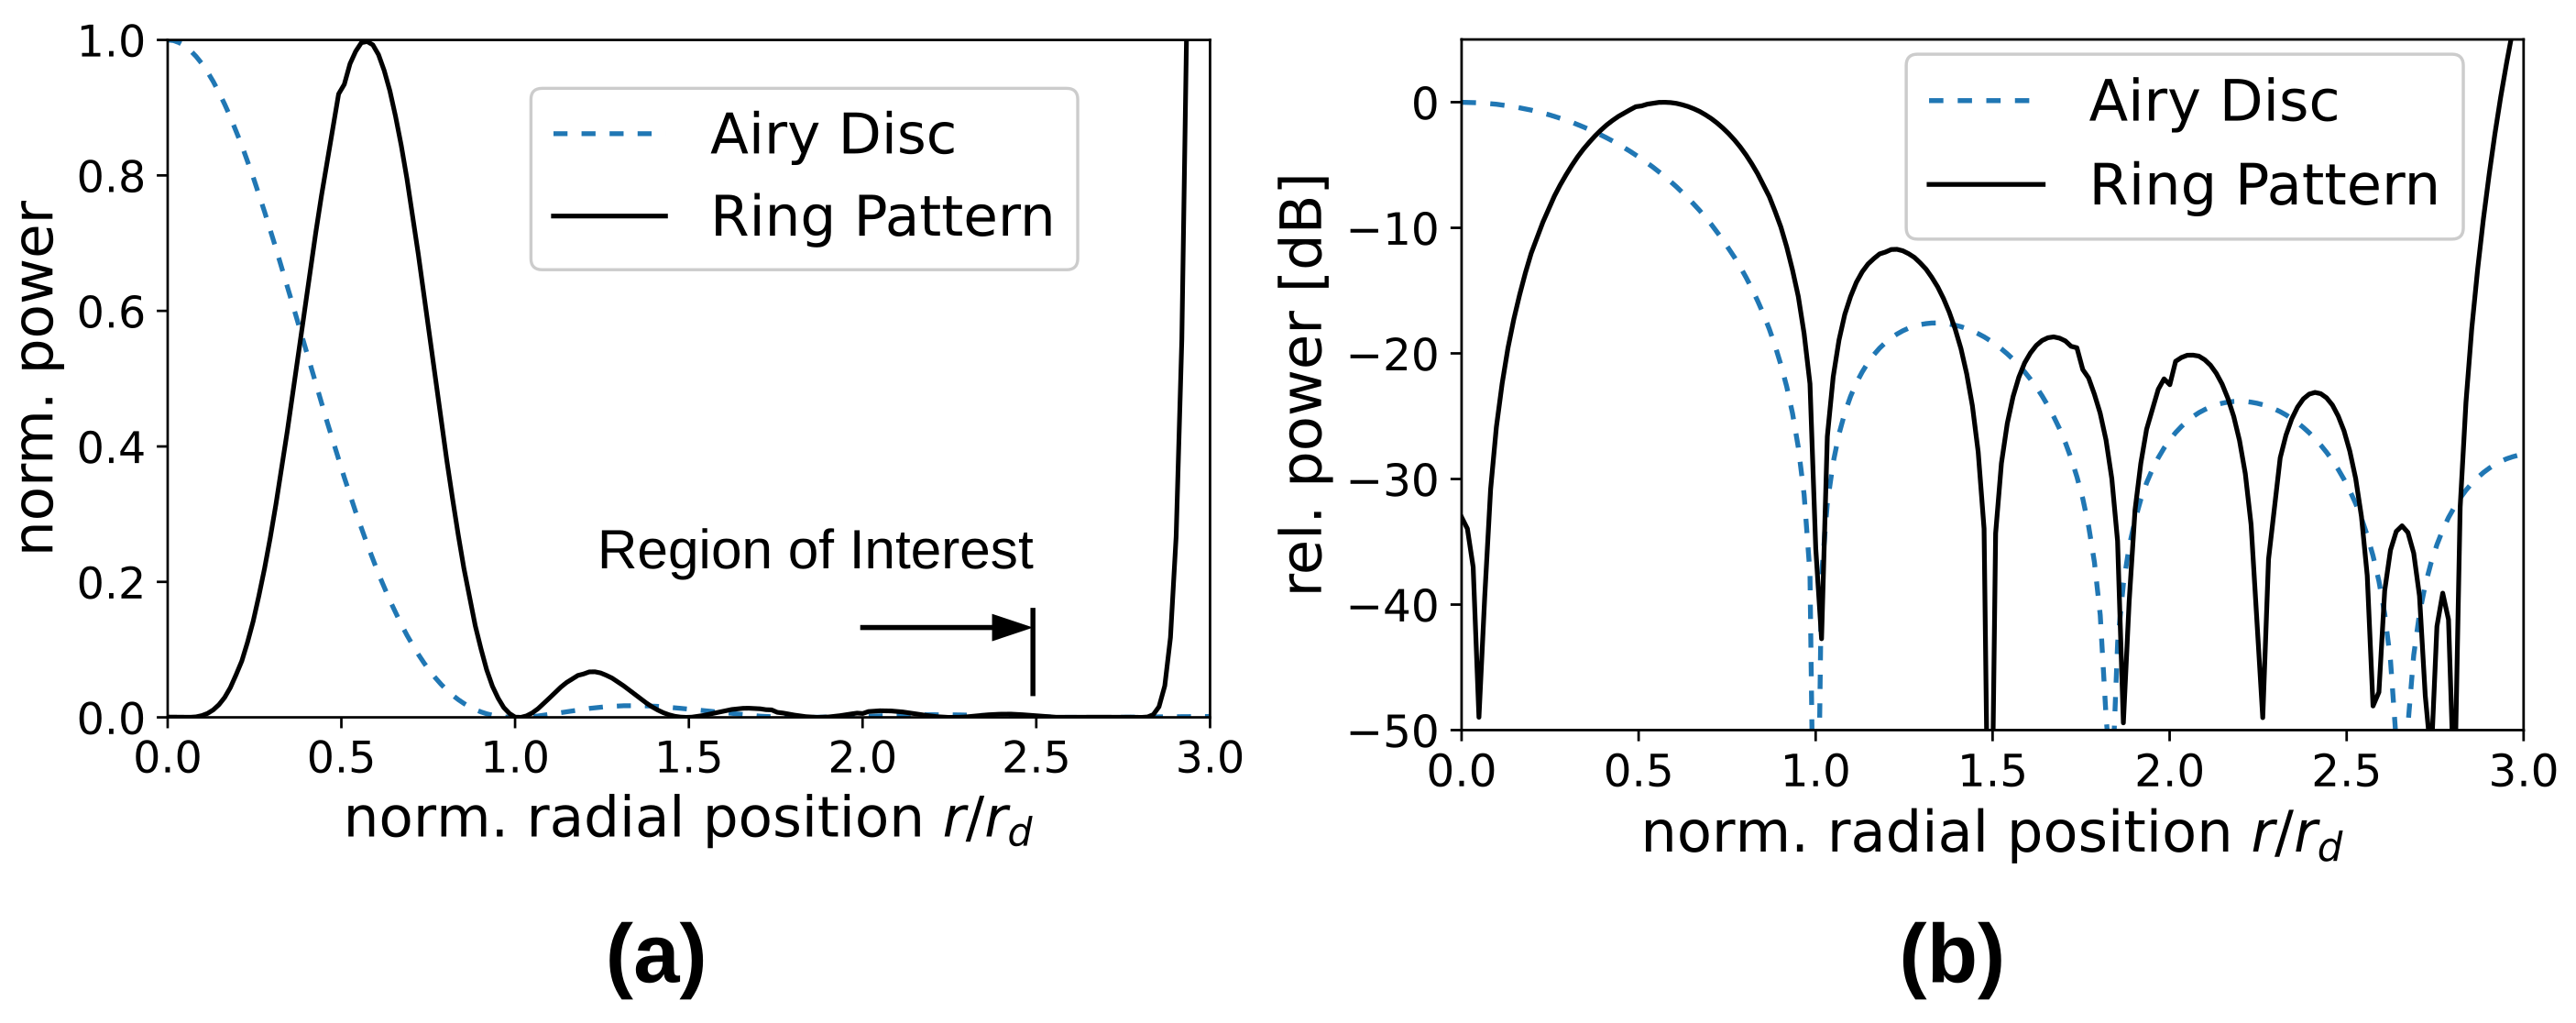
3.3. Superresolved Ring

Figure 4 presents the design of a super-resolved ring structure with an outer radius equal to the radius of the Airy disc that is embedded in a larger area of interest with significantly smaller side-lobe power. The design is based on 12 sampling points, placing the power maximum of the ring at r d / 2 .
The zero at the origin of the output plane is defined by three sample values at ( 0 , 0.2 , 0.5 ) r d with values ( 0 , 0.3 , 1.0 ) . This means that a dip into the negative is used to pull the signal amplitude at the origin to zero. Inspecting the design at a logarithmic power scale, shown in Figure 4, shows that the minimum does not appear at r = 0 , but slightly shifted. This should be interpreted as the consequence of an ill-conditioned P-matrix, which was regularized with ϵ = 10 12 .

4. Phase-Only Encoding of PDFT Designs

In general, the transmission function determined with the PDFT algorithm will not be phase-only, which is required to implement the filter with standard DOE fabrication techniques. Instead, the PDFT algorithm will require an additional phase-encoding step. A well-known approach is the combination of two or more phase-only pixels of the DOE into a “superpixel”, also known as “zero-order” encoding [28,29].
Within a certain (axial) region of interest, the super-pixels are encoding a complex amplitude equal to the sum of all phase-only pixel values assigned to the super-pixel. Larger diffraction angles exhibit a phase error due to the path-length difference between individual pixels within each super-pixel, which is proportional to, and essentially bounded by, the pixel size of the DOE. The number of complex amplitude values that can be encoded depends on the number of pixels per super-pixel and the number of possible phase values which can be assumed by each physical pixels.
The set of physical phase values corresponds to points along the unit circle in the complex plane (Figure 5a). Combining L phase-only pixels into one super-pixel then allows one to approximate the complex amplitudes of the filter function A ( ξ ) inside a circle of radius L. Since passive filters exhibit a magnitude of the transmission function smaller than one, the super-pixel value is normalized by N to represent only complex amplitude values within the unit circle.
If the sample values in the observation plane, which serve as input to the PDFT algorithm, are all specified as real-valued, then the rotational symmetry implies a strictly real-valued transmission function, which can be represented by super-pixels consisting of pixels with only two phase values 0 and π . Figure 5b illustrates that L + 1 values along the real axis can be represented with L pixels per super-pixel.
We note that increasing the set of possible phase values for each physical pixel does not directly translate into a better performance of the DOE in terms of power efficiency or accuracy of the response function. For instance, representing values along the real axis with four equally distributed phase values requires the pairing of pixels with opposite imaginary parts. While both the numerical and the experimental characterization of PDFT designs suggest a minor improvement of the DOE performance with an increasing number of discrete phase values, this has to be weighted against the increased complexity of the fabrication process.

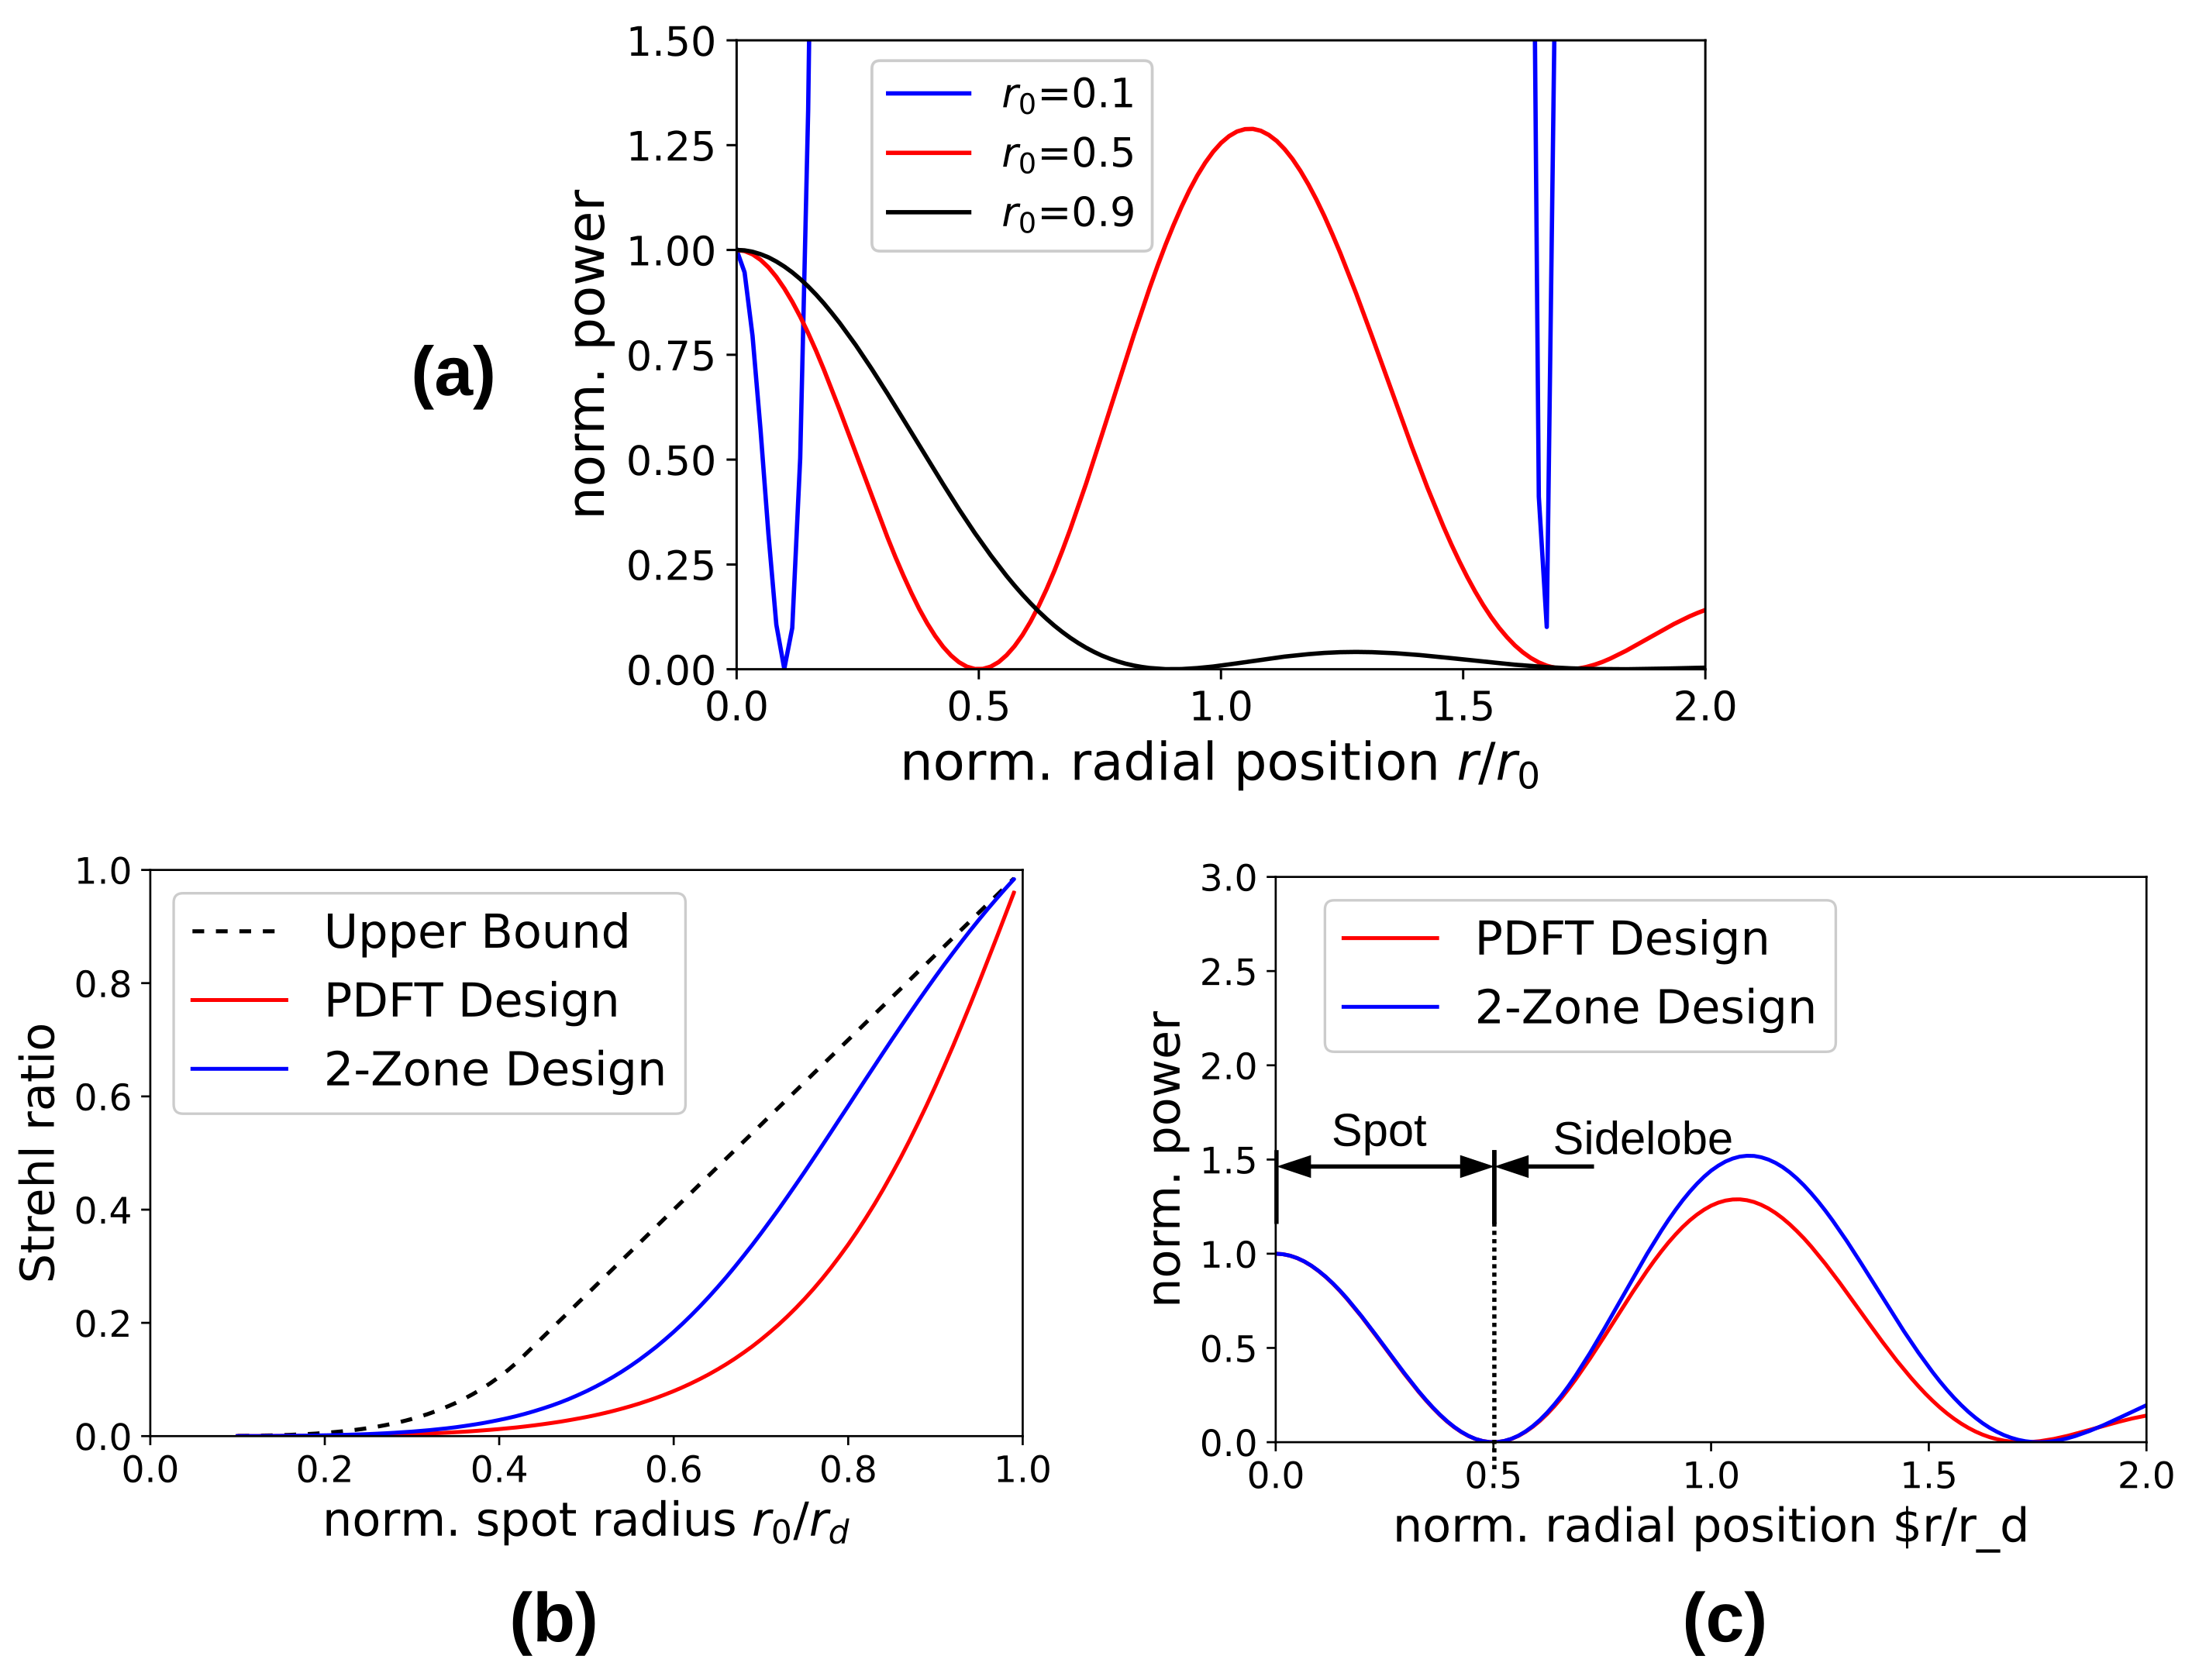
5. Super-Resolving Spot-Generators

Spot generators with a radius of the center lobe smaller than the diffraction limit are an important example of super-oscillating functions. They also represent an important test case to investigate the properties of the PDFT as a design algorithm for DOEs.

5.1. Spot Generator DOE Design

For the design of spot generators, we use two design constraints only. The PSF should have a center lobe with a local maximum at the origin, u ( 0 ) = u 0 , and the first zero (equivalent to the spot radius) located at r 0 = λ g ρ 0 , with u ( ρ 0 ) = 0 . As before, the circular aperture of the DOE has radius a.

5.1.1. PDFT Design

The PDFT algorithm outlined above can be used with a circular flattop as a prior and the resulting 2 × 2 P-matrix can be used to obtain the design as described in Section 2.2. We observe that u 0 needs to be determined to obtain a transmission function with a magnitude covering the ranges [ 0 , 1 ] . To find a passive DOE with maximum power efficiency, the PDFT will in essence determine one unknown coefficient β , which describes the real valued transmission function
T ( ξ ) = 1 + β J 0 ( 2 π ρ 0 ξ ) c i r c ( ξ / a )

5.1.2. Non-Linear Design

For a better understanding of the performance of the PDFT-based design, we also implemented a non-linear optimization algorithm [2] to obtain a phase-only design directly. To this end, the circular aperture is divided into two zones with phase values 0 and π , respectively. The radius ξ s , which marks the transition from one to the other phase value, is used as optimization variable. In the observation plane, the condition to find a zero circle at radius ρ 0 then reads,
0 = 2 A i r y ( ξ s , ρ 0 ) A i r y ( a , ρ )
with the Airy disc function,
A i r y ( γ , ρ ) = γ J 1 ( 2 π γ ρ ) ρ
The choice of the non-linear numerical optimization algorithm to find ξ s [ 0 , a ] is not critical for this application.
For the discussion that follows, we note that the same two-zone design can be obtained with the PDFT algorithm as well. This can be performed by using a prior function that consists of two narrow rings,
P ( ξ ) = δ ( ξ a / 2 ) + δ ( ξ 3 a / 2 )
The PDFT process assigns real-valued weights to both rings, which need to be phase-encoded. Dividing the clear aperture into two zones with an area ratio equal to the ratio of the two PDFT coefficients with assigned phase values 0 and π results in a two-zone phase-only DOE design that approximates the non-linear design very closely. That is, the difference between the non-linear design and the generic PDFT design based on a clear aperture as a prior can also be characterized as the difference of two PDFT designs with different prior functions, combined with a suitable phase-encoding step. This highlights the fact that the need for an explicit phase-encoding step generalizes the use of the prior function beyond a representation of the physical aperture only.

5.2. Numerical Characterization of Spot Generator Designs

Both methods were used to investigate systematically super-resolving spot generator designs. For the generic PDFT design, the response of the DOE with and without phase encoding can be made virtually identically by selecting a sufficient number of phase-only pixels well within the parameters standard DOE fabrication. Unless mentioned otherwise, we therefore do not distinguish between the plain PDFT output and the phase-encoded transmission function of the DOE.
Figure 6a shows the radial profile of three different PSFs. Apart from the diffraction limited spot r 0 / r d = 1 , the plot contains the profiles of spots with one half and 1/10th the radius of the Airy disc. The latter marks the practical limit for the numerical PDFT design without any regularization that compromises the resolution of the central spot. All profiles are normalized to unity at the origin and the exponential increase in power diffracted into the side-lobes can clearly be observed.
Normalizing the total power of all profiles to the power transmitted by the DOE allows us to extract the Strehl ratio of each design as the value of the PSF at the origin. For both the generic PDFT design as well as the two-zone design algorithm (non-linear optimization or PDFT with a modified prior), we compared the Strehl ratio as a function of spot size with the upper bound developed for super-resolving spot generators [10], in Figure 6b. It can be observed that the two-zone design performs significantly better than the generic PDFT design based on a clear aperture as a prior function. The former corresponds to values reported in the literature [2,10].
It is remarkable, however, that the Strehl ratio does not necessarily translate directly to the performance of the DOE. Closer inspection of the PSFs for both the generic PDFT and the two-zone design, in Figure 6c, reveals that the latter actually shows a larger maximum power in the first side-lobe relative to the magnitude at the origin. This means, for optimizing the contrast of the center lobe relative to the side-lobes, the Strehl ratio does not represent a reliable metric.

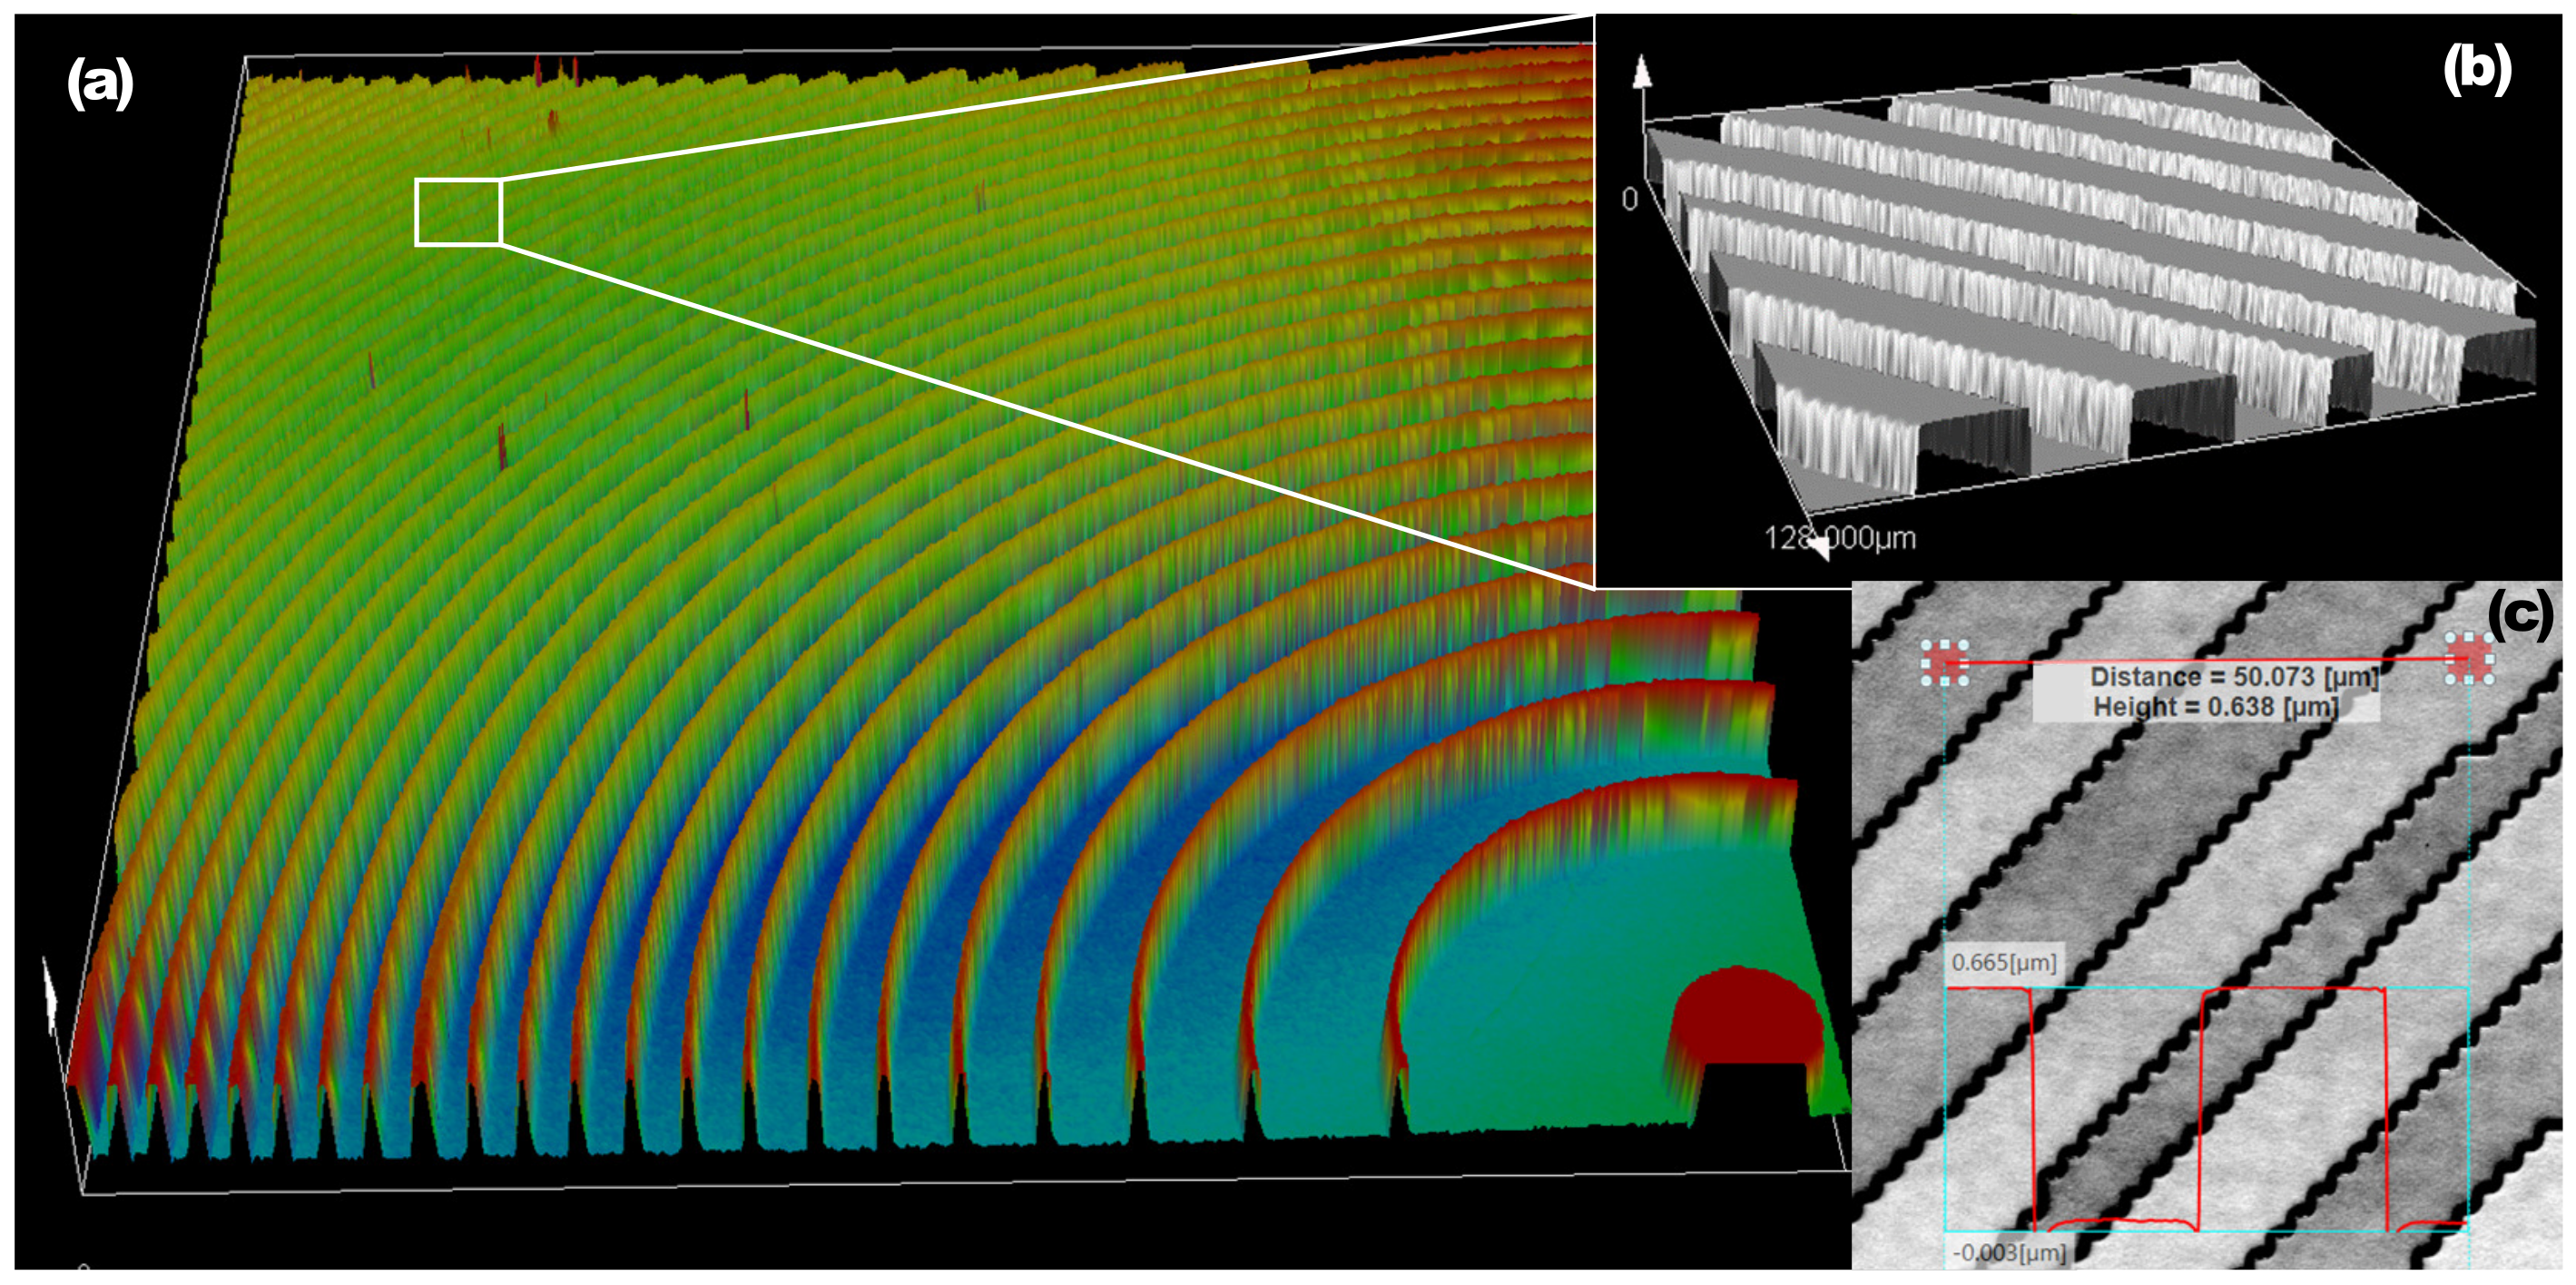
5.3. Fabrication of Diffractive Optical Spot Generators

The fabrication process used for the diffractive optical spot generators has been reported elsewhere [24,24]. We summarize it here for completeness.
Corning 7980 grade, fused silica (FS) wafers, diameter 100 mm and thickness 1mm, were used as substrates to fabricate the DOEs. The wafers were cleaned using immersion in a 2:1 by volume bath of sulfuric acid (H2SO4) and hydrogen peroxide (H2O2), followed by a de-ionized water rinse. The circular amplitude apertures were implemented first, followed by the the addition of the phase profile within the transparent silica aperture area.
A uniform 200 nm-thick pinhole-free layer of aluminum metal (Al) was deposited on the FS substrate surface, using an AJA International/ATC 1800F DC-magnetron tool. The metal was coated with 450 nm of photoresist (Shipley 1805) using a CEE spin-coater. A square, 9-by-9 array of circular 4.1mm diameter apertures was exposed using a 5× reduction GCA6300C g-line wafer stepper (GCA Corp., Burlington, MA, USA). The resulting layout was a 7 mm center-to-center grid of 81 apertures on each wafer. Lithographic layer-to-layer alignment marks were exposed around the apertures. The exposed wafers were developed with a 60 s immersion in MIF319 developer (Shipley Company, Marlborough, MA, USA),to define the aperture openings and the alignment marks. Following this step, the wafers were immersed in a standard aluminum-metal etchant (Transene Company Inc., Danvers, MA, USA), to form circular FS-apertures on the Al-coated silica surface. The same step etched the Al from the alignment mark areas as well, resulting in clear contrast Al/FS lithographic fiducials. The residual resist was removed by immersion in N-methylpyrrolidone (NMP).
The Al-apertured FS substrates were re-coated with photoresist (Shipley 1805), and the same resist exposure and development process was used to align and expose the binary-phase diffractive optical spot generator pattern, aligned on-center to the Al apertures. Since the design contained spatial features of varying ring dimensions, the minimum ring size of 2.0 μ m at the wafer-scale was selected and targeted for fidelity as the critical lithographic dimension. After a post-exposure hot-plate bake at 110 °C and development, the resist lithograph was etched using a PlasmaTherm RIE 7000 reactive-ion plasma etcher to transfer the diffractive pattern profile into the FS substrate. The plasma mixture consisted of methyl-trifluoride (CHF3) and oxygen (O2) gases, at a partial pressure of 15 mT, and an RF-power of 1000 W. The FS:photoresist etch selectivity under these process conditions was better than 2:1. The etch process target depth was calculated as 660 nm, which results in a π -phase difference between the etched and un-etched areas for a test wavelength of 604 nm. Measurements of the height profile were performed with a Ultraviolet confocal microscope (Figure 7). For the point measured in Figure 7c, the actual etch depth was 638 nm. The average etch depth sampled across the entire DOE was determined to be 656 ± 33 nm, with less than 2% relative deviation from the target value. For the spot generator with a center lob of 0.45 times the diffraction limit, we also fabricated a version of the PDFT design quantized into four phase levels, ( 0 , π / 2 , π , 3 π / 2 ) , by repeating the last lithographic step.

6. Experimental Characterization of the DOE Response

The experimental characterization of the spot generator DOEs was performed with the optical system schematically depicted in Figure 1. A HeNe-laser operating at 604 nm was used as a light source, followed by a beam expander to overfill a single-apertured element on the test wafer. The DOE was placed into the converging beam of a plano-convex FS lens focused on a CCD array detector (BC106N-VIS by ThorLabs Inc., Newton, NJ, USA). The distance between the DOE and the focal plane was determined as g = 75.3 cm ± 1 mm.
Figure 8 shows the measured PSFs for three representative DOEs we fabricated. Each element was spatially quantized into 2048 pixels across the 4.1 mm diameter of the clear circular aperture. The circular PDFT design was spatially quantized over a Cartesian grid of super-pixels before replacing the complex amplitude with the phase-only pixel pattern of the super-pixel encoding. For the results presented, we used 64 physical pixels per super-pixel.
Figure 8a,b shows the PSFs for binary-phase DOEs fabricated on the same wafer. The first DOE is located at one corner of the 9 × 9 array of DOEs, while the second represents the response of the DOE at the center of the array. The measurements are overlaid with the simulated response based on the quantized DOE phase-only mask. Both measurements are in good agreement with the simulated response. The results are proof that binary-phase elements are sufficient to implement super-resolving spot generators. Deviations between measurements and simulations are explained with small deviations of the etch depth from the target values, as well as minor alignment errors of the optical system. The desired spot radius of 0.45 r d is verified to the limit of the measurement system.
We also implemented the same spot generator as a four-phase-level element. The response for one of the DOEs is shown in Figure 8c. The measurements correspond to the simulated profile with an accuracy similar to the two-level element. This is consistent across the entire wafer.
Overall, the well-defined nulls of the spot pattern are remarkable. To illustrate this point, we plotted the data of the element in Figure 8c with a logarithmic vertical axis, which shows a measured power ratio between the origin and the location of the first zero crossing of more than 20 dB.
We note that a similar performance of the PDFT design was experimentally observed for spot radii as small as r d / 5 [24], which we determined as a practical lower bound for implementing super-resolving spot generators with the approach reported here.

7. Discussion and Summary

We introduced the PDFT as a design algorithm for DOEs with rotational symmetry and a super-oscillating response function. Typical for super-oscillating design procedures, but distinct from standard DOE design, the PDFT algorithm specifies complex amplitude samples in the observation plane rather than the squared magnitude of the signal. In essence, the PDF determines the bandlimited function for a given aperture function that interpolates the input samples.
The PDFT design algorithm inherits some of its distinct features from the application of the PDFT as a signal-recovery algorithm. Insights gained in the context of imaging applications can be applied directly to the synthesis problem. This includes, in particular, the regularization of the otherwise ill-conditioned inverse design problem. While this procedure is commonly applied for signal recovery from noisy data, it is uncommon for design problems. The regularization of the P-matrix can be used to obtain a compromise between useful interpolation and an interpolation faithful to the discrete sampling values which serve as input. The importance of the regularization is related to the fact that super-oscillating signals are constructed as the subtractive interplay of bandlimited signals, which inevitably results in a delicate balance of all signal atoms involved.
The implementation and experimental characterization of spot generators validates standard fabrication techniques for DOEs as suitable for super-oscillating elements as well.
Within the scope of our investigation, both the shape of the prior, i.e., the aperture function, as well as the location of the input samples were pre-determined and not subject to design. Our results indicate, however, that both may be determined—at least in part—as the result of an iterative design process, which incorporates the PDFT as its central component.

Author Contributions

Formal analysis, M.E.T.; methodology, M.E.T. and M.K.P.; validation, P.G., P.B. and M.K.P.; resources, M.K.P.; writing—original draft preparation, M.E.T.; writing—review and editing, M.K.P.; project administration, P.B.; funding acquisition, P.B. All authors have read and agreed to the published version of the manuscript.

Funding

Financial support for part of this work was provided by a DARPA/SBIR Phase II grant (140D6319C0001).

Institutional Review Board Statement

Not applicable.

Informed Consent Statement

Not applicable.

Data Availability Statement

Dataset available on request from the authors.

Acknowledgments

The authors would like to acknowledge facilities support from the Center for Optics at UNC Charlotte. All fabrication and testing for this work was performed at UNC Charlotte.

Conflicts of Interest

Paolo Batoni was employed by NuSpot Technologies LLC. Other authors declare no conflicts of interest.

Abbreviations

The following abbreviations are used in this manuscript:
DOEDiffractive optical element
PDFTPrior discrete Fourier transform
PSFPoint spread function
FSFused silica
AlAluminum metal

References

  1. di Francia, T. Super-gain antennas and optical resolving power. Nuovo Cimento Suppl. 1952, 9, 426–438. [Google Scholar] [CrossRef]
  2. Sales, T.R.M.; Morris, G.M. Diffractive superresolution elements. J. Opt. Soc. Am. A 1997, 14, 1637–1646. [Google Scholar] [CrossRef]
  3. Reza, N.; Hazra, L. Toraldo filters with concentric unequal annuli of fixed phase by evolutionary programming. J. Opt. Soc. Am. A 2013, 30, 189–195. [Google Scholar] [CrossRef] [PubMed]
  4. Katzav, E.; Schwartz, M. Yield-optimized superoscillations. IEEE Trans. Signal Process. 2013, 61, 3113–3118. [Google Scholar] [CrossRef]
  5. Wong, A.M.H.; Eleftheriades, G.V. An optical super-microscope for far-field, real-time imaging beyond the diffraction limit. Sci. Rep. 2013, 3, 1715. [Google Scholar] [CrossRef]
  6. Rogers, E.T.F.; Savo, S.; Lindberg, J.; Roy, T.; Dennis, M.R.; Zheludev, N.I. Super-oscillatory optical needle. Appl. Phys. Lett. 2013, 102, 031108. [Google Scholar] [CrossRef]
  7. Chen, G.; Wen, Z.Q.; Qiu, C.W. Superoscillation: From physics to optical applications. Light Sci. Appl. 2019, 8, 56. [Google Scholar] [CrossRef]
  8. Yang, H.; Lin, E.Y.H.; Kutulakos, K.N.; Eleftheriades, G.V. Computational nonscanning incoherent superoscillatory imaging. ACS Photonics 2022, 9, 290–295. [Google Scholar] [CrossRef]
  9. Zheludev, N.I.; Yuan, G. Optical superoscillation technologies beyond the diffraction limit. Nat. Rev. Phys. 2022, 4, 16–32. [Google Scholar] [CrossRef]
  10. Sales, T.R.M.; Morris, G.M. Fundamental limits of optical superresolution. Opt. Lett. 1997, 22, 582–584. [Google Scholar] [CrossRef]
  11. Kempf, A. Black holes, bandwidths and Beethoven. J. Math. Phys. 2000, 41, 2360–2374. [Google Scholar] [CrossRef]
  12. Ferreira, P.J.S.G.; Kempf, A. The energy expense of superoscillations. In Proceedings of the 2002 11th European Signal Processing Conference, Toulouse, France, 3–6 September 2002; pp. 1–4. [Google Scholar]
  13. Byrne, C.L.; Fitzgerald, R.M. Reconstruction from partial information with applications to tomography. Siam J. Appl. Math. 1982, 42, 933–940. [Google Scholar] [CrossRef]
  14. Byrne, C.L.; Fitzgerald, R.M.; Fiddy, M.A.; Hall, T.J.; Darling, A.M. Image restoration and resolution enhancement. J. Opt. Soc. Am. 1983, 73, 1481–1487. [Google Scholar] [CrossRef]
  15. Byrne, C.L.; Fiddy, M.A. Estimation of continuous object distributions from limited Fourier magnitude measurements. J. Opt. Soc. Am. A 1987, 4, 112–117. [Google Scholar] [CrossRef]
  16. Byrne, C.L.; Fiddy, M.A. Images as power spectra; reconstruction as a Wiener filter approximation. Inverse Probl. 1988, 4, 399–409. [Google Scholar] [CrossRef]
  17. Testorf, M.; Fiddy, M. Imaging from real scattered field data using a linear spectral estimation technique. Inverse Probl. 2001, 17, 1645–1658. [Google Scholar] [CrossRef]
  18. Byrne, C.L. Signal Processing—A Mathematical Approach; A K Peters: Wellesley, MA, USA, 2005; Chapter 23; pp. 129–134. [Google Scholar]
  19. Shieh, H.M.; Byrne, C.L.; Fiddy, M.A. Image reconstruction: A unifying model for resolution enhancement and data extrapolation. Tutorial. J. Opt. Soc. Am. A 2006, 23, 258–266. [Google Scholar] [CrossRef] [PubMed]
  20. Testorf, M.E. Performance limits and trade-offs of superresolution imaging systems. In Proceedings of the Unconventional and Indirect Imaging, Image Reconstruction, and Wavefront Sensing 2018, San Diego, CA, USA, 19–23 August 2018; Dolne, J.J., Bones, P.J., Eds.; International Society for Optics and Photonics. SPIE: Bellingham, WA, USA, 2018; Volume 10772, p. 107720G. [Google Scholar] [CrossRef]
  21. Dong, X.H.; Wong, A.M.H.; Kim, M.; Eleftheriades, G.V. Superresolution far-field imaging of complex objects using reduced superoscillating ripples. Optica 2017, 4, 1126–1133. [Google Scholar] [CrossRef]
  22. Feirreira, P.J.S.; Kempf, A. Superoscillations: Faster than the Nyquist rate. IEEE Trans. Signal Process. 2006, 54, 3732–3740. [Google Scholar] [CrossRef]
  23. Lee, D.G.; Ferreira, P.J.S.G. Direct construction of superoscillations. IEEE Trans. Signal Process. 2014, 62, 3125–3134. [Google Scholar] [CrossRef]
  24. Gadamsetti, P.; Testorf, M.; Gonzalez, D.A.; Batoni, P.; Poutous, M.K. Implementation of a superresolution far-field spot-generator with 1/5 the diffraction limit. Results Opt. 2021, 3, 100067. [Google Scholar] [CrossRef]
  25. Gadamsetti, P.; Testorf, M.E.; Batoni, P.; Poutous, M.K. Optical super-resolving phase filters with random anti-reflection subwavelength surface structures. In Proceedings of the Optical Components and Materials XVIII, Online, 6–12 March 2021; Jiang, S., Digonnet, M.J.F., Eds.; International Society for Optics and Photonics. SPIE: Bellingham, WA, USA, 2021; Volume 11682, p. 1168214. [Google Scholar] [CrossRef]
  26. Iizuka, K. Engineering Optics, 2nd ed.; Springer: New York, NY, USA, 1986; Chapter 2.8; pp. 46–54. [Google Scholar]
  27. Papoulis, A. Systems and Transforms with Applications to Optics; McGraw-Hill: New York, NY, USA, 1968; Chapter 5; pp. 140–175. [Google Scholar]
  28. Mendlovic, D.; Shabtay, G.; Levi, U.; Zalevsky, Z.; Marom, E. Encoding technique for design of zero-order (on-axis) Fraunhofer computer-generated holograms. Appl. Opt. 1997, 36, 8427–8434. [Google Scholar] [CrossRef] [PubMed]
  29. Ren, Y.X.; Lu, R.D.; Gong, L. Tailoring light with a digital micromirror device. Ann. Phys. 2015, 527, 447–470. [Google Scholar] [CrossRef]
Figure 1. Optical system assumed for designing super-oscillating DOEs.
Photonics 11 00790 g001
Figure 2. Regularization of PDFT design: super-oscillating signal designed (a) without and (b) with regularized P-matrix ( ϵ = 10 12 ).
Photonics 11 00790 g002
Figure 3. PDFT design of an apodizer. (a,b) show the same signal with a different scales for the vertical axis.
Photonics 11 00790 g003
Figure 4. PDFT design of a ring pattern with an outer radius of r r d and followed by a region of interest with smaller side-lobe power. Figures (a,b) show the PSF at a linear and a logarithmic scale, respectively.
Photonics 11 00790 g004
Figure 5. Super-pixel encoding of complex amplitudes. (a) The phase-only values of physical DOE pixels can be combined to represent a larger set of complex amplitudes for a small range of diffraction angles. (b) Representation of real values with a binary ( 0 , π ) DOE implementation.
Photonics 11 00790 g005
Figure 6. Design of super-resolving spot generators. (a) PSF profiles of spots with different radii. (b) Strehl ratio vs. spot radius for both design methods compared to the theoretical upper bound [10]. (c) PSFs for both design methods and spot radius r 0 = r d / 2 ) .
Photonics 11 00790 g006
Figure 7. Ultraviolet confocal microscope image of the surface profile of the (0, π ) phase only DOE. (a) Color-coded height profile (red—high, blue—low) of the quadrant measured (10× magnification). (b) Height profile expansion of the 128 × 128 μ m2 area detail shown in (a). (c) Top–down view of the profile in (b), with the cross-sectional measurements along the 50.1 μ m path shown in red.
Photonics 11 00790 g007
Figure 8. Measured PSFs for spot generators with a spot radius of r 0 = 0.45 r d . (a) PSF of ( 0 , π ) binary-phase element located at one corner of a 9 × 9 array of DOEs. The diffraction limited spot radius is indicated as a vertical dashed line. (b) Response for a second DOE on the same wafer as (a), but at the center of the 9 × 9 array. (c) PSF of DOE fabricated with four phase levels. (d) PSF in (c) with a logarithmic vertical axis (dB scale).
Photonics 11 00790 g008
Disclaimer/Publisher’s Note: The statements, opinions and data contained in all publications are solely those of the individual author(s) and contributor(s) and not of MDPI and/or the editor(s). MDPI and/or the editor(s) disclaim responsibility for any injury to people or property resulting from any ideas, methods, instructions or products referred to in the content.

