Abstract
SU-8 is an emerging polymer material for integrated optical circuits that has demonstrated good structural properties in a cryogenic environment. In this article, we investigate the thermo-optical properties of SU-8 for a wavelength , from room temperature to cryogenic temperature down to 14 K. To measure the material properties, we designed and fabricated SU-8 racetrack resonators via electron beam lithography. While cooling the device in a closed-cycle cryostat, we measured the resonance spectrum as a function of the temperature from which we determined the temperature-induced variations of the group and effective indices of the waveguide. With the aid of waveguide eigenmode simulations, we used these data to derive the temperature dependence of the SU-8 refractive index . At room temperature (T~295 K), the thermo-optic coefficient . At low temperature (T~14 K), . Our research shows the potential of SU-8 photonics in a cryogenic environment, suitable for the integration with quantum light sources emitting in the near infrared (NIR).
1. Introduction
Waveguides are the basic elements of photonic integrated circuits (PICs) as they are necessary for guiding, coupling, splitting, and multiplexing/demultiplexing optical signals [1]. Polymer waveguides are gaining attention due to their low cost, processing versatility, mechanical flexibility, substrate independence, and refractive indices that allow efficient mode coupling to single-mode silica fibers [2,3]. In addition to this, polymer waveguides exhibit propagation losses that can be below 1 dB/cm for both near-infrared and telecommunication wavelengths [4]. These attractive attributes can be combined to those of inorganic optical materials such as silicon, silicon nitride, and III-V materials, etc., making polymer waveguide an excellent resource for heterogeneous material PICs [5,6]. The commercially available negative-tone SU-8 resists have become popular to planarize wafers, as adhesive, structural materials, and as masking layers for microfabrication [7,8,9]. SU-8 can be patterned by different lithographic methods such as deep UV lithography, electron beam lithography (EBL), and micro-imprint [10,11,12]. Importantly, the refractive index contrast between SiO2 and SU-8 ( = 1.45 and ≈ 1.58 at = 850 nm) makes optical wave-guiding possible for this polymer [13,14].
In certain applications such as aerospace and quantum technologies, PICs must operate in cryogenic environments [15,16]. Many polymeric materials become brittle at low temperatures, with the adverse effects of thermal stress becoming significantly pronounced [17]. Nonetheless, a few polymer-based composites such as SU-8 can maintain their characteristics when exposed to cryogenic temperatures: high specific strength, excellent corrosion resistance, and design versatility [18]. SU-8 has been used to perform material processing in cryogenic environments with techniques such as two-photon polymerization and cryogenic dry etching. In these experiments, the polymer showed minimal volumetric shrinkage and absences of cracking [7,19].
To optimize the use of a material for cryogenic photonic applications, it is important to characterize its thermo-optical response at low temperature [13,20,21,22,23,24]. Accurate measurements of this coefficient are frequently carried out by measuring the wavelength shift of optical resonators, but they can also be achieved by other means such as refractometry [23,24]. Among the photonic resonators, circular micro-ring resonators (MRRs) are highly appealing since they can exhibit high quality factors (Q-factors) in a small footprint while retaining high sensitivity to temperature fluctuations [25,26].
To date, SU-8 MRRs have been demonstrated at telecom wavelengths around 1550 nm [27,28,29], by using gaps of around 1 µm between the waveguide and the rings. These fabrication parameters are compatible with the standard UV lithographic process. However, for shorter wavelengths (such as 850–870 nm or visible, which are, for example, of interest for quantum technologies), a 1 µm gap is too large to allow MRR-waveguide coupling, so EBL becomes a promising alternative fabrication solution. Indeed, MRRs have been fabricated using this polymer, with gaps as small as 250 nm by EBL techniques [30]. Small MRRs for operation at wavelengths around 780 nm have been shown to be useful in photoacoustic detection, with Q-factors of the order of Q~1.0 × 10⁴ on quartz substrates, and gaps as small as 150 nm [31]. However, the paper demonstrating such results pointed out how the small dielectric gap caused a rather limited yield in the device fabrication. An alternative approach to avoid the small coupling gap of a circular MMR is to adopt a racetrack geometry that uses a longer evanescent coupling section between the input waveguide and the looped waveguide constituting the resonator (see Figure 1a). This approach has been used, for example, for wavelength filters and optical switches [32,33,34].
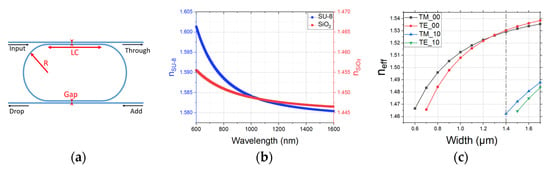
Figure 1.
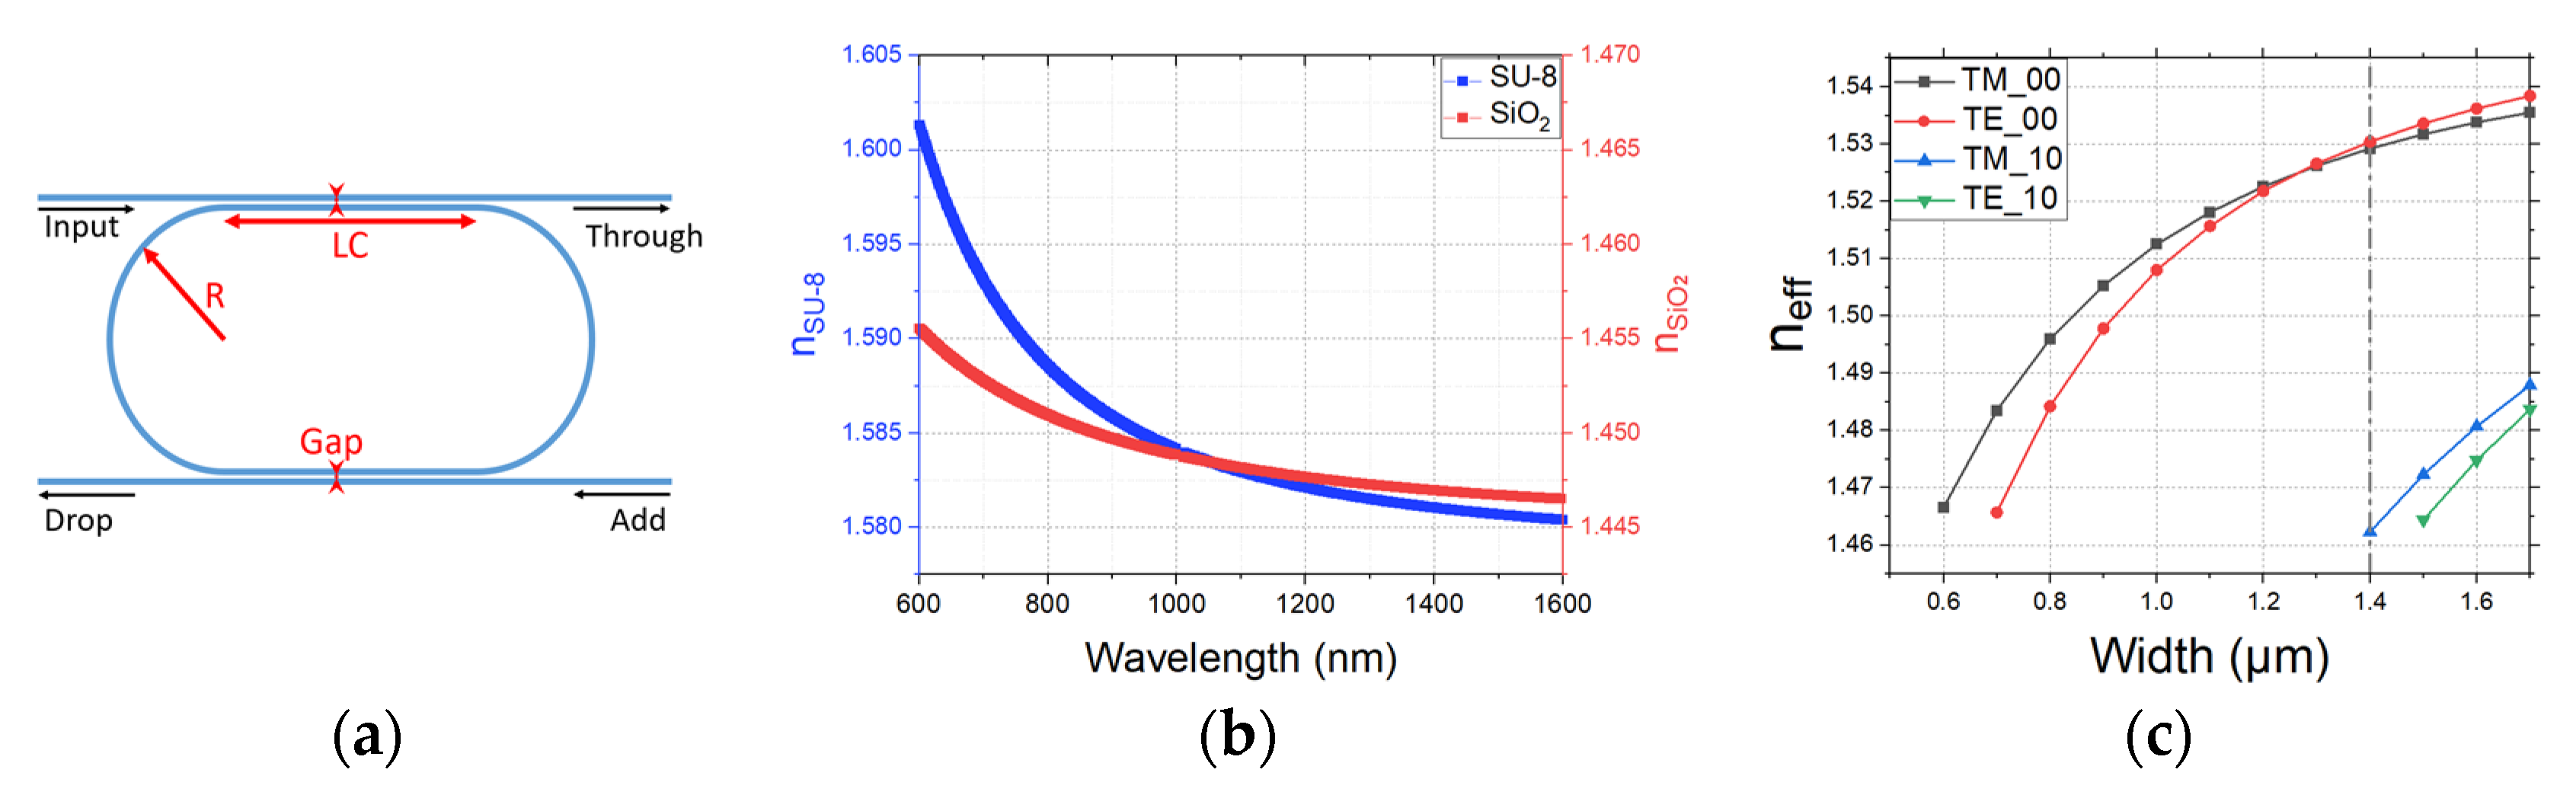
(a) Schematic of the double-bus racetrack resonator. R is the radius of curvature, and LC is the length of the coupling section. (b) Ellipsometry data of SU-8 2 (blue) and SiO2 (red) at room temperature. (c) Simulation of the effective index as a function of waveguide width. Dashed line shows the transition to multi-mode behavior.
Recently, Chakraborty et al. measured the change in SU-8 refractive index at = 1.55 µm in the temperature range from room temperature (RT) to 3 K, using an MRR [35]. Over the whole temperature interval, the refractive index changed by and the thermo-optic coefficient (TOC, dn/dT) reduced by one order of magnitude. This constitutes an important step in the comprehensive characterization of polymer waveguides under these extreme temperature conditions. Here, we extend this study by measuring the TOC of SU-8 at cryogenic temperatures (295 K to 14 K) in the near-infrared range (~850 nm).
2. Materials and Methods
2.1. Racetrack Design and Modelling
We chose to operate with a rectangular SU-8 ridge waveguide sitting on a SiO2 bottom cladding and with air/vacuum as the top cladding. Device simulations are based on the refractive index of hard-cured SU-8 2 (MicroChem®) and thermally grown SiO2 measured in-house at RT with an ellipsometer (see Figure 1b). The extinction coefficient, k, is below the sensitivity of the instrument (k < ) for every wavelength λ > 570 nm and, therefore, not shown in Figure 1b. Our primary objective was to design a waveguide that supports a single TM optical mode. We performed simulations using a commercial eigenmode electromagnetic solver (Ansys® Lumerical 2022 R2 MODE) by varying the waveguide width (w) and thickness (h) to identify the optimal dimensions for single-mode operation, within the fabrication constraint (i.e., h > 900 nm). As shown in Figure 1c, for w < h, the fundamental mode supported by the waveguide is TM. To avoid multi-mode operation when h = 1 µm, we require w < 1.4 µm; see Figure 1c. A waveguide cross section with h = 1 µm and w = 0.8 µm was chosen to ensure good device yield, low bending loss, and evanescent coupler gap for the resonator within fabrication capability.
For the MRR, we chose to adopt a double-bus racetrack geometry with a coupling length a coupling gap of 600 nm, and a bending radius , leading to an overall length of the resonator . With the chosen LC and gap, we predict 7% power transfer from the input waveguide to the drop in a single passage through the evanescent coupler. The free spectral range (FSR) as a function of temperature is given by:
where T is the temperature, is the wavelength, and is the group index of the waveguide. We consider L(T) as the temperature-dependent length of the resonator due to the contraction of the Si substrate upon cooling [36]. Based on the obtained from simulations with the ellipsometry data, we predicted . If we indicate with the temperature-dependent effective index of the waveguide as a function of the temperature and wavelength, the resonance condition is given by [35]:
with m a positive integer representing the order of the resonance and the resonance wavelength of the m-th order. Therefore, the variation of with temperatures indicates changes of effective index.
The expected behavior of with respect to is predicted by taking as reference the results observed in Chakraborty et al. and Leviton et al. for SU-8 and SiO2, respectively [12,31], and extrapolating their data to our desired . We performed simulations around different temperatures to study the expected variation of . In Table 1, we show the values of waveguide and resonator parameters if such approximations were exact for T = 14 K, the base temperature reachable in the measurement setup. As we see, we expect a slight decrease in the FSR at low temperature: .

Table 1.
Simulation results for reference values at RT and 14 K.
2.2. Racetrack Fabrication and Characterization Setup
The fabrication process commenced with the creation of a 2 µm thick SiO2 layer on a silicon wafer by means of thermal oxidation. To enhance polymer adhesion, the sample underwent cleaning via an O2 plasma treatment, followed by a heating step at 95 °C for 300 s to facilitate water desorption. Subsequently, a 1 µm layer of SU-8 2 was spin-coated at 4250 rpm and subjected to a soft bake at 95 °C for 300 s. Waveguide patterns were defined via EBL with a 50 pA current at 100 kV and an area dose of 7 µC/cm2. The coupling region between the two waveguides spanned 135 µm in length with a 600 nm gap. Following exposure, the sample underwent a post-exposure bake at 95 °C for 400 s. Then, the sample was immersed in an EC-solvent for 1 min, dried, and subjected to a last hard-bake at 200 °C for 2 h.
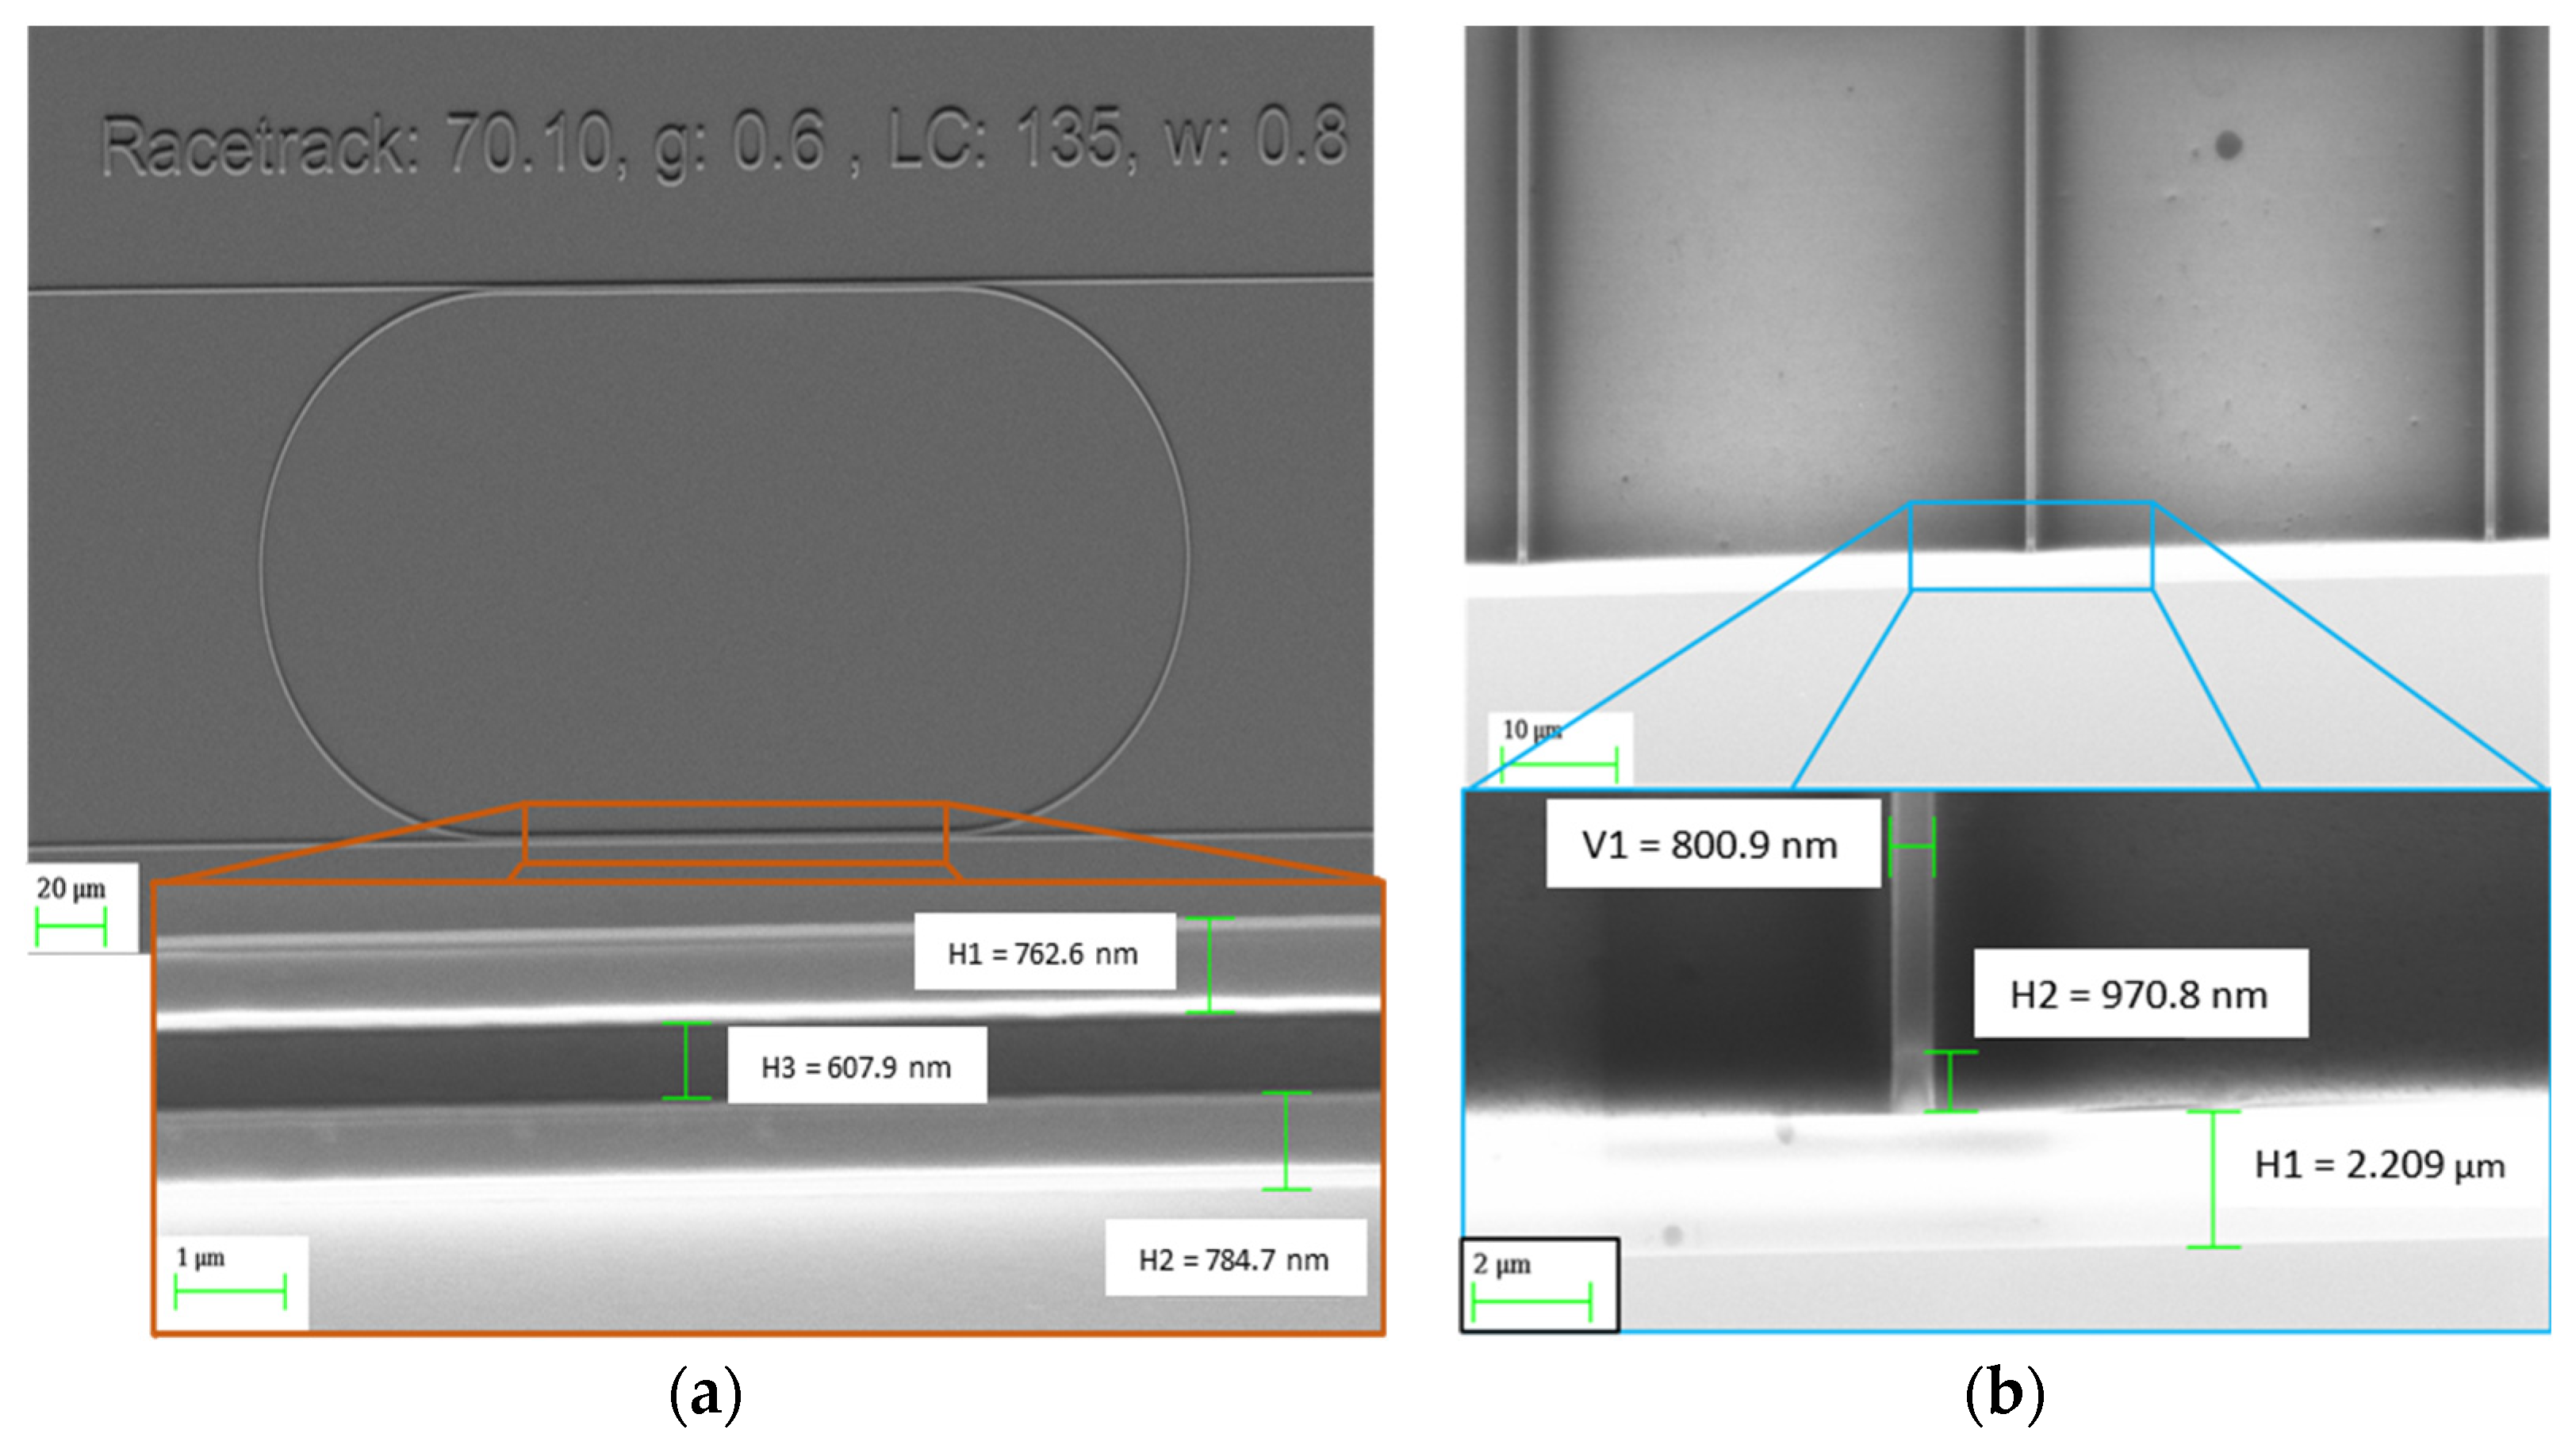
In Figure 2, we show the scanning electron microscopy (SEM) images of the device, highlighting the dimensions of the individual waveguides and of the coupling gap. The measured waveguide dimensions included widths from 760 nm to 800 nm, a gap from 580 to 610 nm, and a thickness of approximately 970 nm. Finally, the facet of the sample was cleaved orthogonally to the waveguide direction to allow edge coupling. Preliminary tests of the MRR were performed at room temperature by injecting and collecting light at opposite facets of the chip connected by one of the two bus waveguides of the resonator.
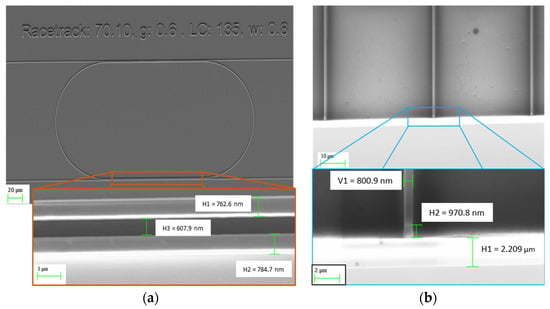
Figure 2.
SEM of (a) the fabricated device; inset shows the coupling area with a coupling gap of around 0.6 µm. (b) The facets of the waveguides; inset shows a single waveguide with dimensions: thickness, 0.97 µm; width, 0.8 µm; and a SiO2 thickness of 2.2 µm.
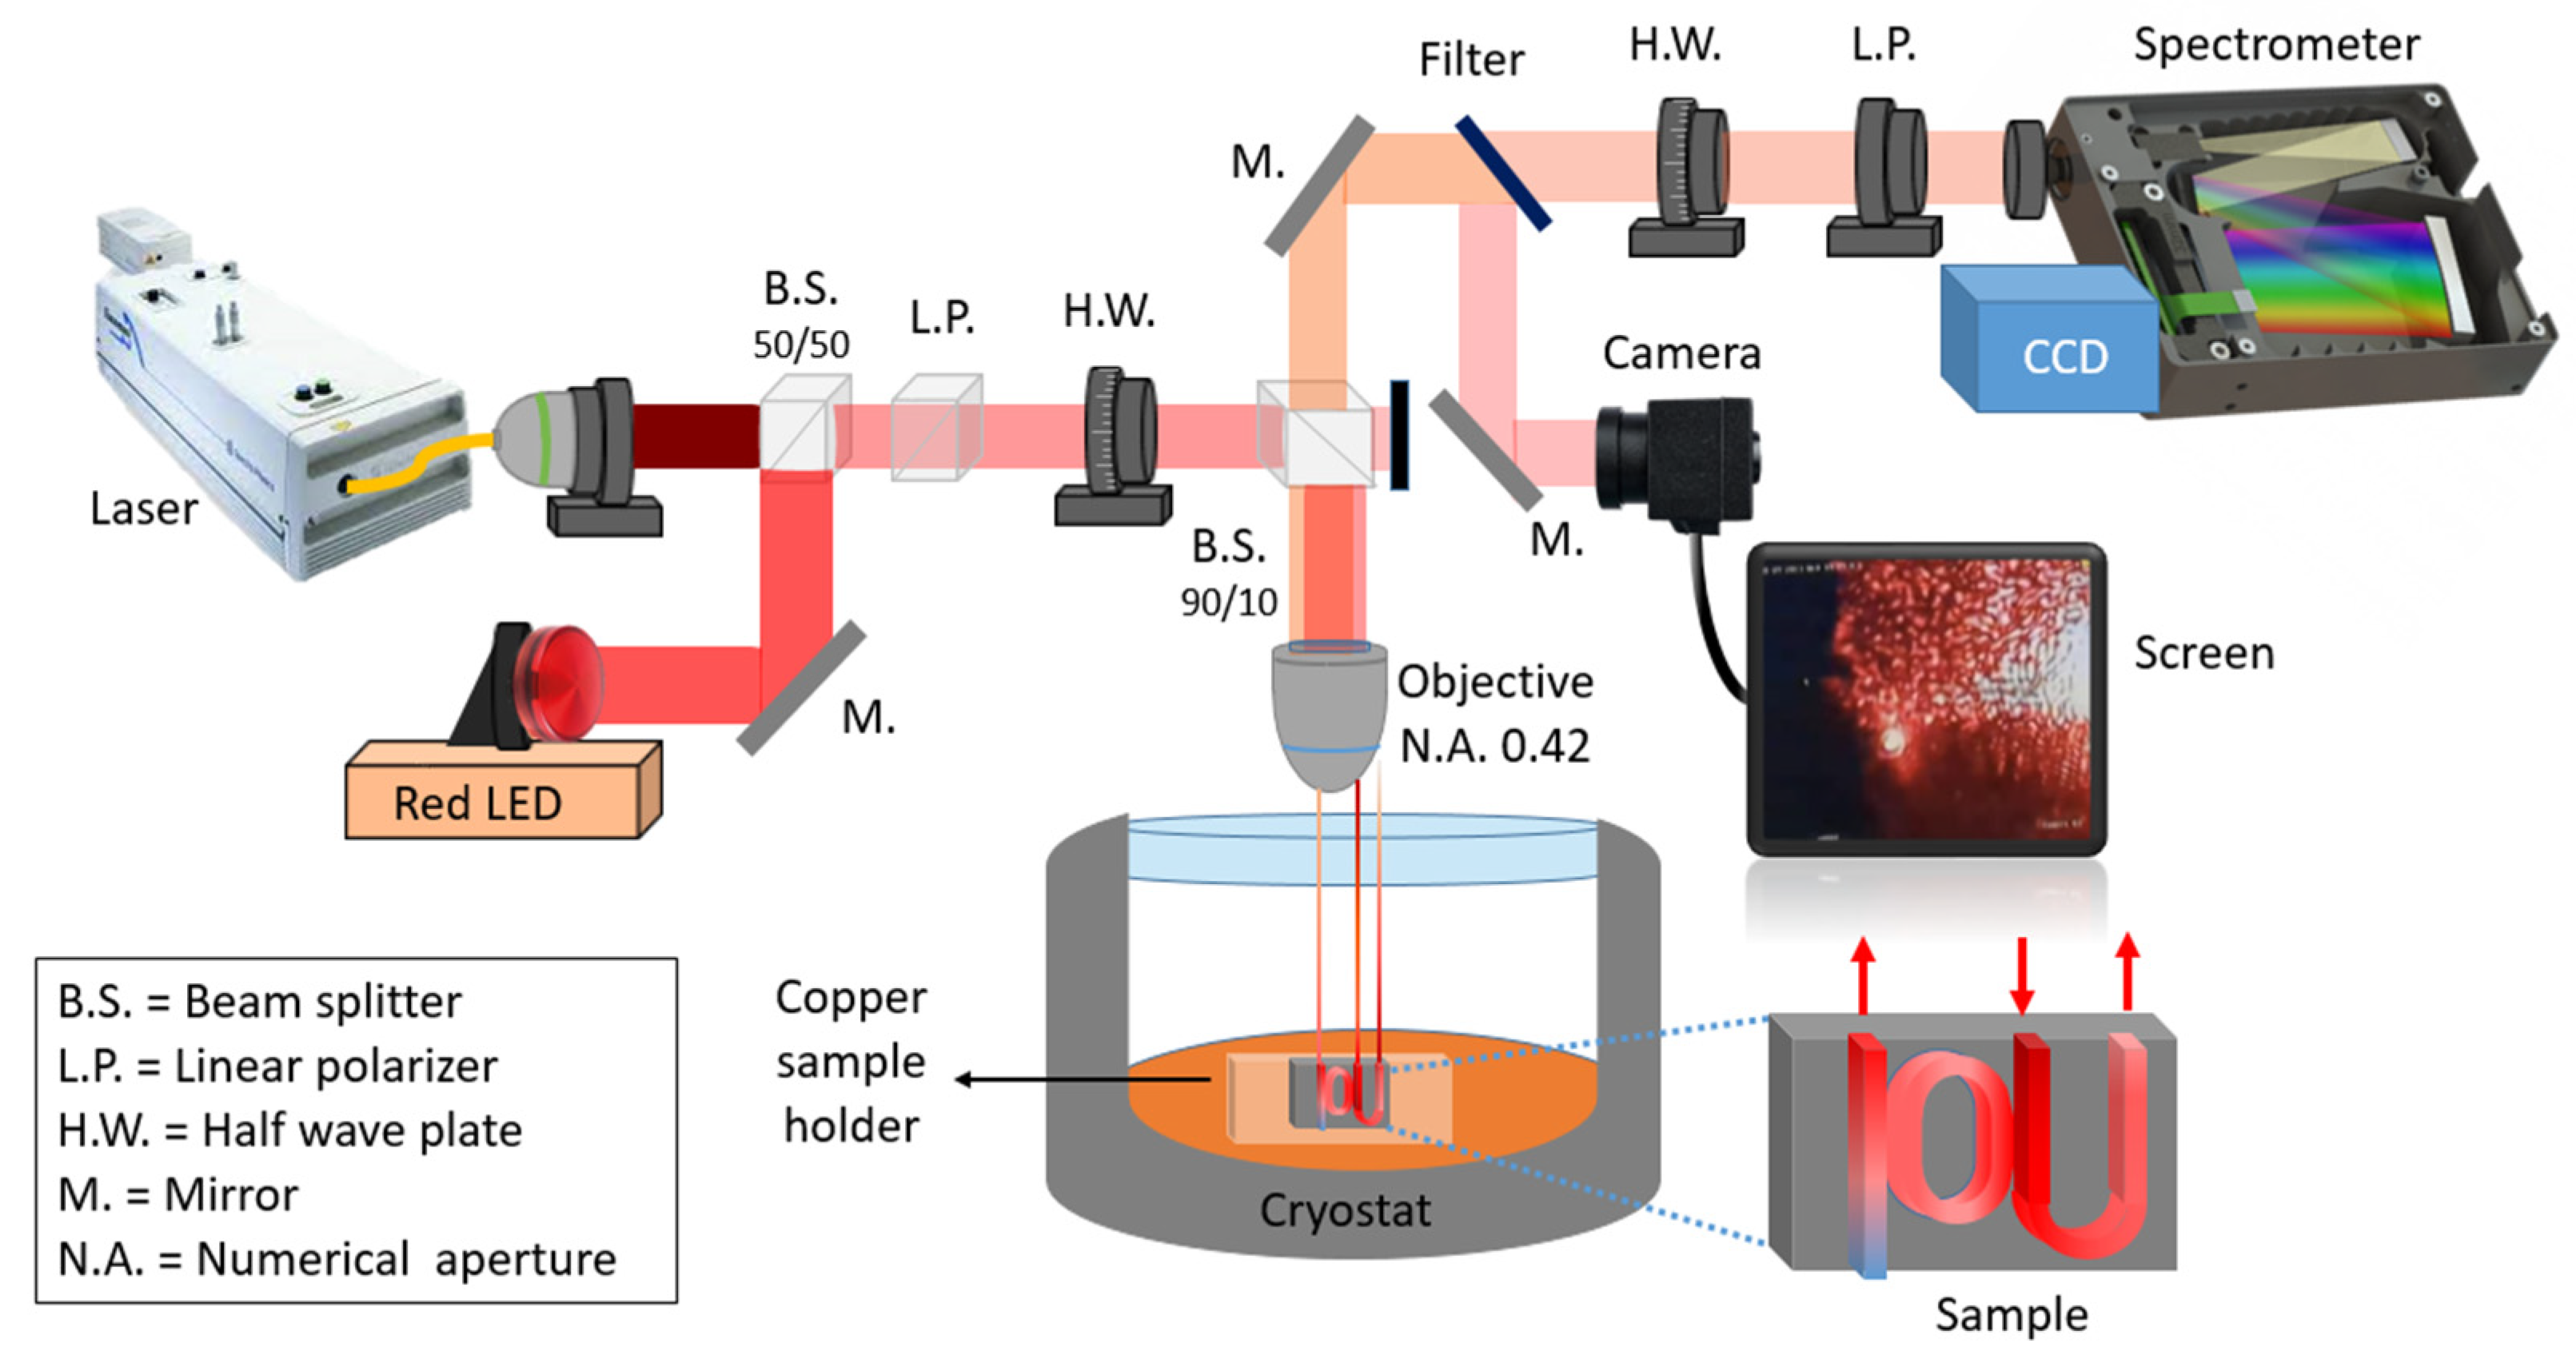
For optical characterization and to facilitate measurements in the cryostat, the sample was affixed to a copper mount with thermally conductive silver paint. Initial measurements were conducted under vacuum at RT through the cryostat window. As depicted in Figure 3, we tuned the pulsed Ti:Sapphire laser to the central wavelength, , letting light propagate through a polarizer cube to ensure the selection of TM polarization. Then a non-polarizing beam splitter (90:10) directed the light through the chamber window into the edge of the sample. Light was focused onto the waveguide facets via an objective with numerical aperture NA = 0.42, giving a laser spot of approximately 2 µm in diameter. The coupling was optimized by adjusting the position of both the objective and the sample using piezo-actuators, and by monitoring the output signal on the CCD. From the same sample edge, we recovered the light propagating in the through port of the resonator. This was achieved with a U-shaped optical shunt resulting in a 20 µm distance between input and output waveguide facets. Light was collected by the same objective used for the input and passed through a second polarizer before being analyzed by the spectrometer, consisting of a 950 lines/mm grating and CCD. No damage or change in the device was observed after cryogenic measurement.
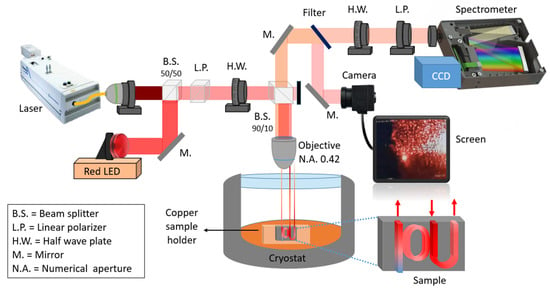
Figure 3.
Schematic of the setup for resonator measurements.
3. Results
3.1. Q-Factor and Tracking of neff for Multiple Resonance: Fringe Tracking
After collecting the input laser spectrum as reference, we recorded the transmission spectra from the through port of the racetrack resonator for 51 temperature values across the temperature sweep. In the wavelength interval 840–860 nm, we divided each measured spectra by the reference laser spectrum. Then, by applying a sequence of Lorentzian function fits, we extracted the resonance centers and the full-width half-maximum from which the Q-factors can be defined as . The multiple Lorentzian fits of each normalized spectrum allow for a common baseline offset of the peaks to accommodate the sum of the multiple overlapping resonance tails.
Near we obtained (RT) ≈ 5375 and (14 K) ≈ 3765. It is important to note from Equation (2) that the mode order at different temperatures is different, with and being the closest to . The observed Q-factors demonstrate that the resonator maintains a good quality upon the cooling process. When comparing the same , the (846.90, RT) ≈ 4610 and (855.10, 14 K) ≈ 3220, giving a reduction of 1390.
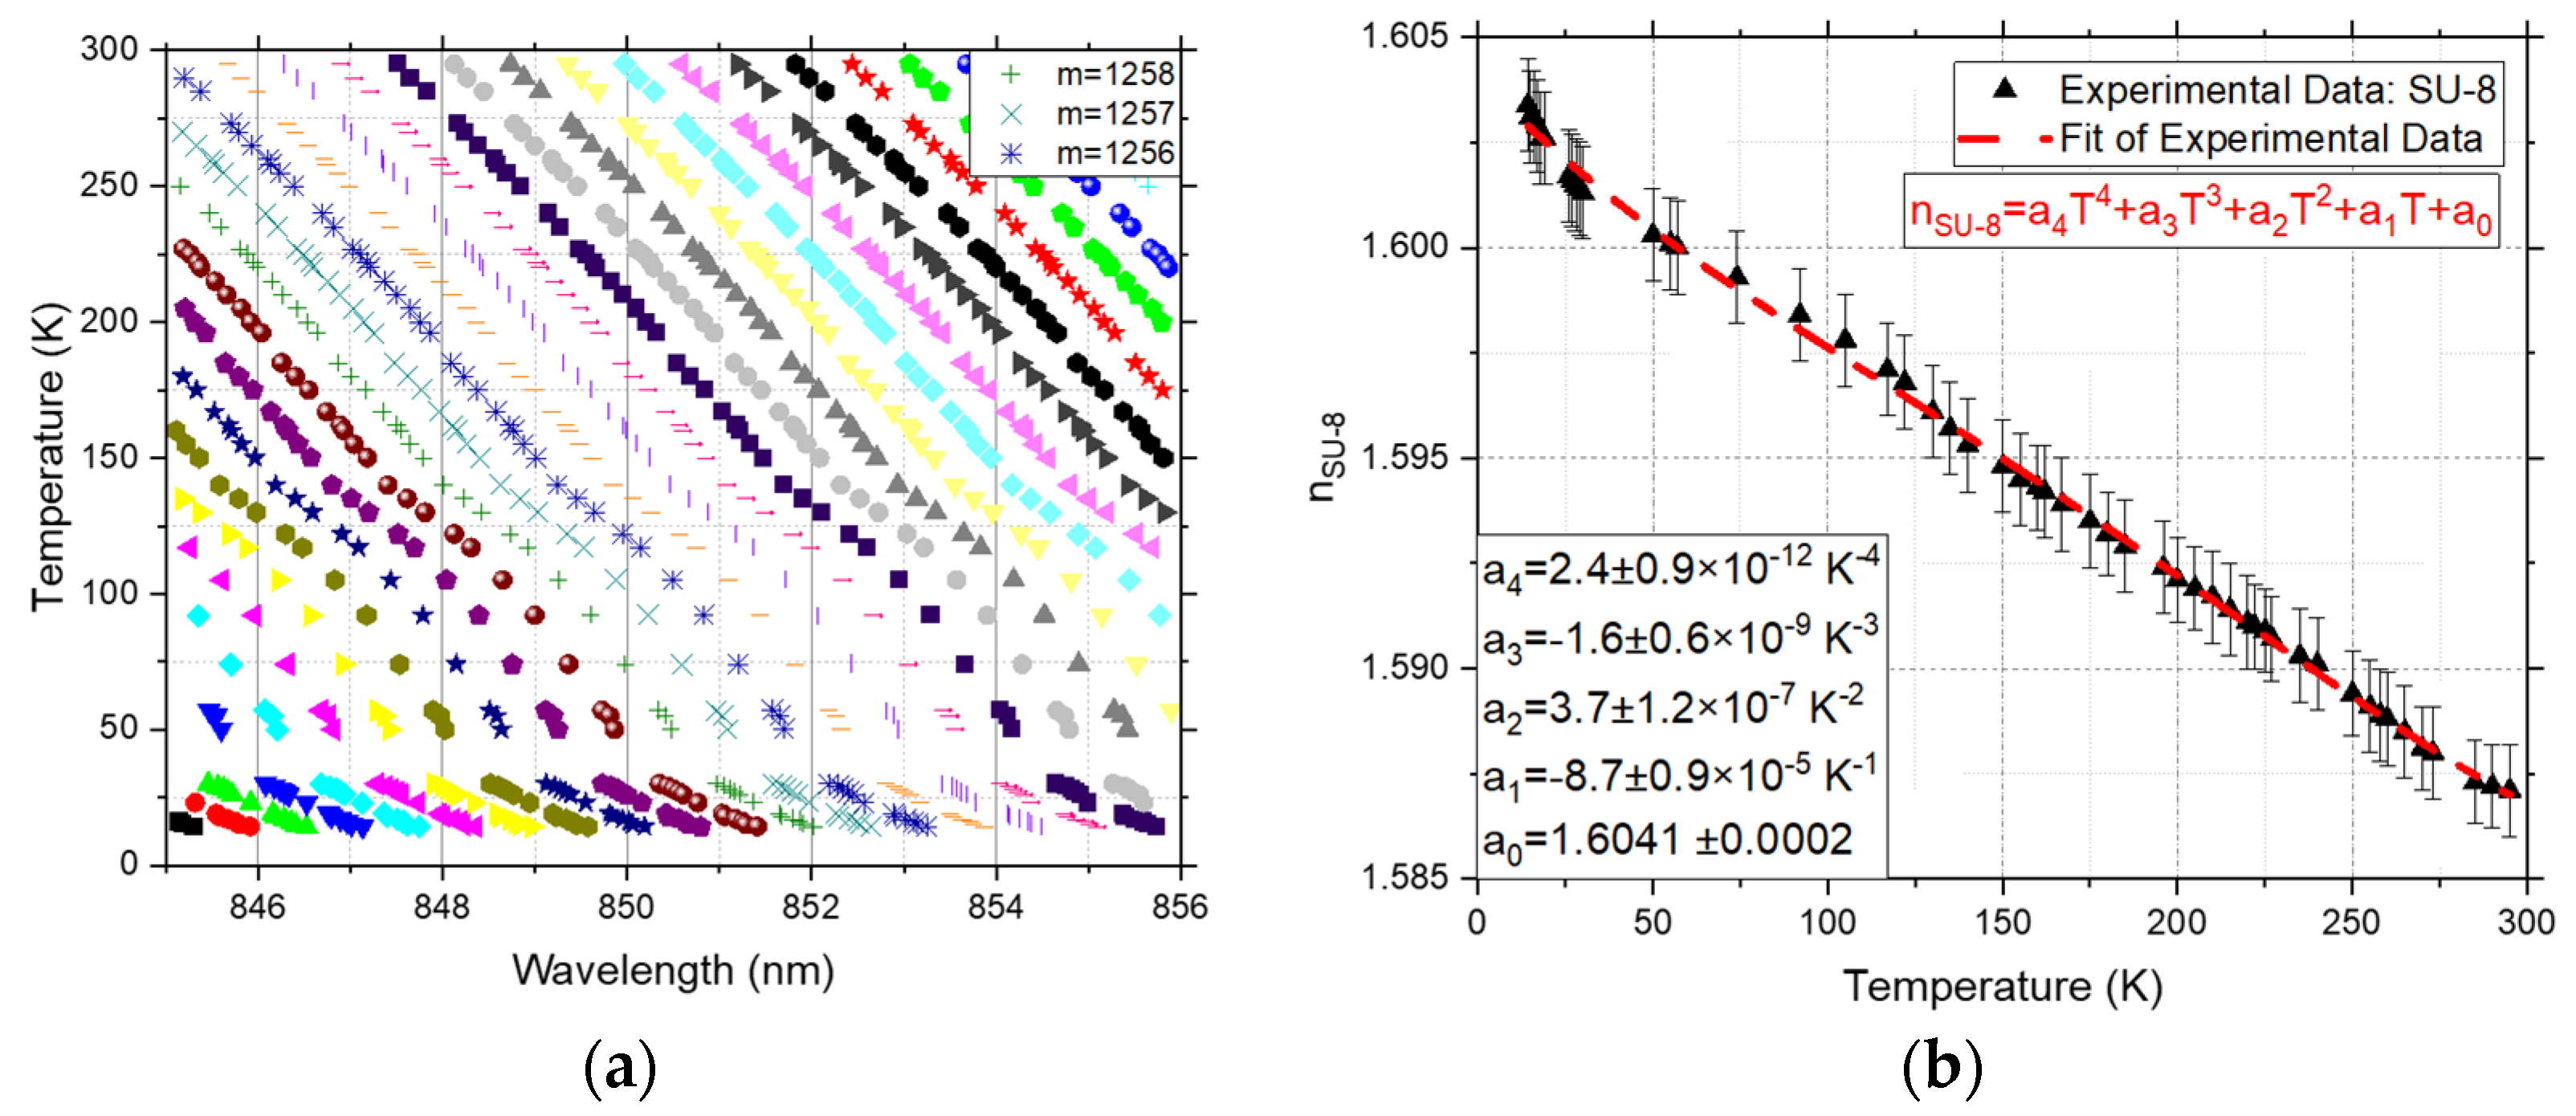
To determine , we began by estimating via software simulation of the waveguide eigenmode by inserting the measured refractive index of the materials obtained via ellipsometry (at , and ). Then, we used and obtained from the fit to determine the order of the resonance closest to , obtaining . Here, the uncertainty reflects the fractional result obtained when inserting in Equation (2), even though m is defined as an integer number. By knowing we used the resonance peak fit data summarized in Figure 4a to count the resonance order at lower temperature. By replacing and in Equation (2) for , we obtained for our waveguide geometry. To calculate the temperature variation of we performed the eigenmode simulations for our waveguide geometry with increasing values of until the predicted matched with the experimental value of our waveguide, effectively converting to . Finally, similar to Chakraborty et al., we fit the sequence with the fourth-order polynomial [35]:
as shown in Figure 4b. The coefficients obtained are:
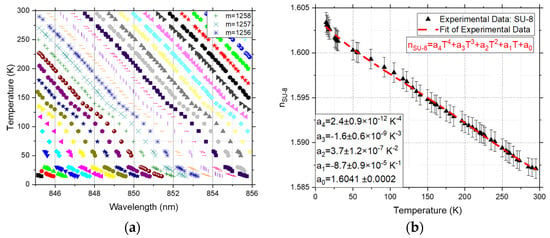
Figure 4.
(a) Resonances position at different temperatures; same markers and color are used to denote the same m value. (b) obtained from the experimental data and resulting 4th-order polynomial fit, the gradient of which gives the TOC.
When evaluated at RT and 14 K, the fit provides: and respectively.
The simulation of for different values of also provided the expected value of for our waveguide geometry, to compare it later against the FSR method. The and gave a .
3.2. Measurement of
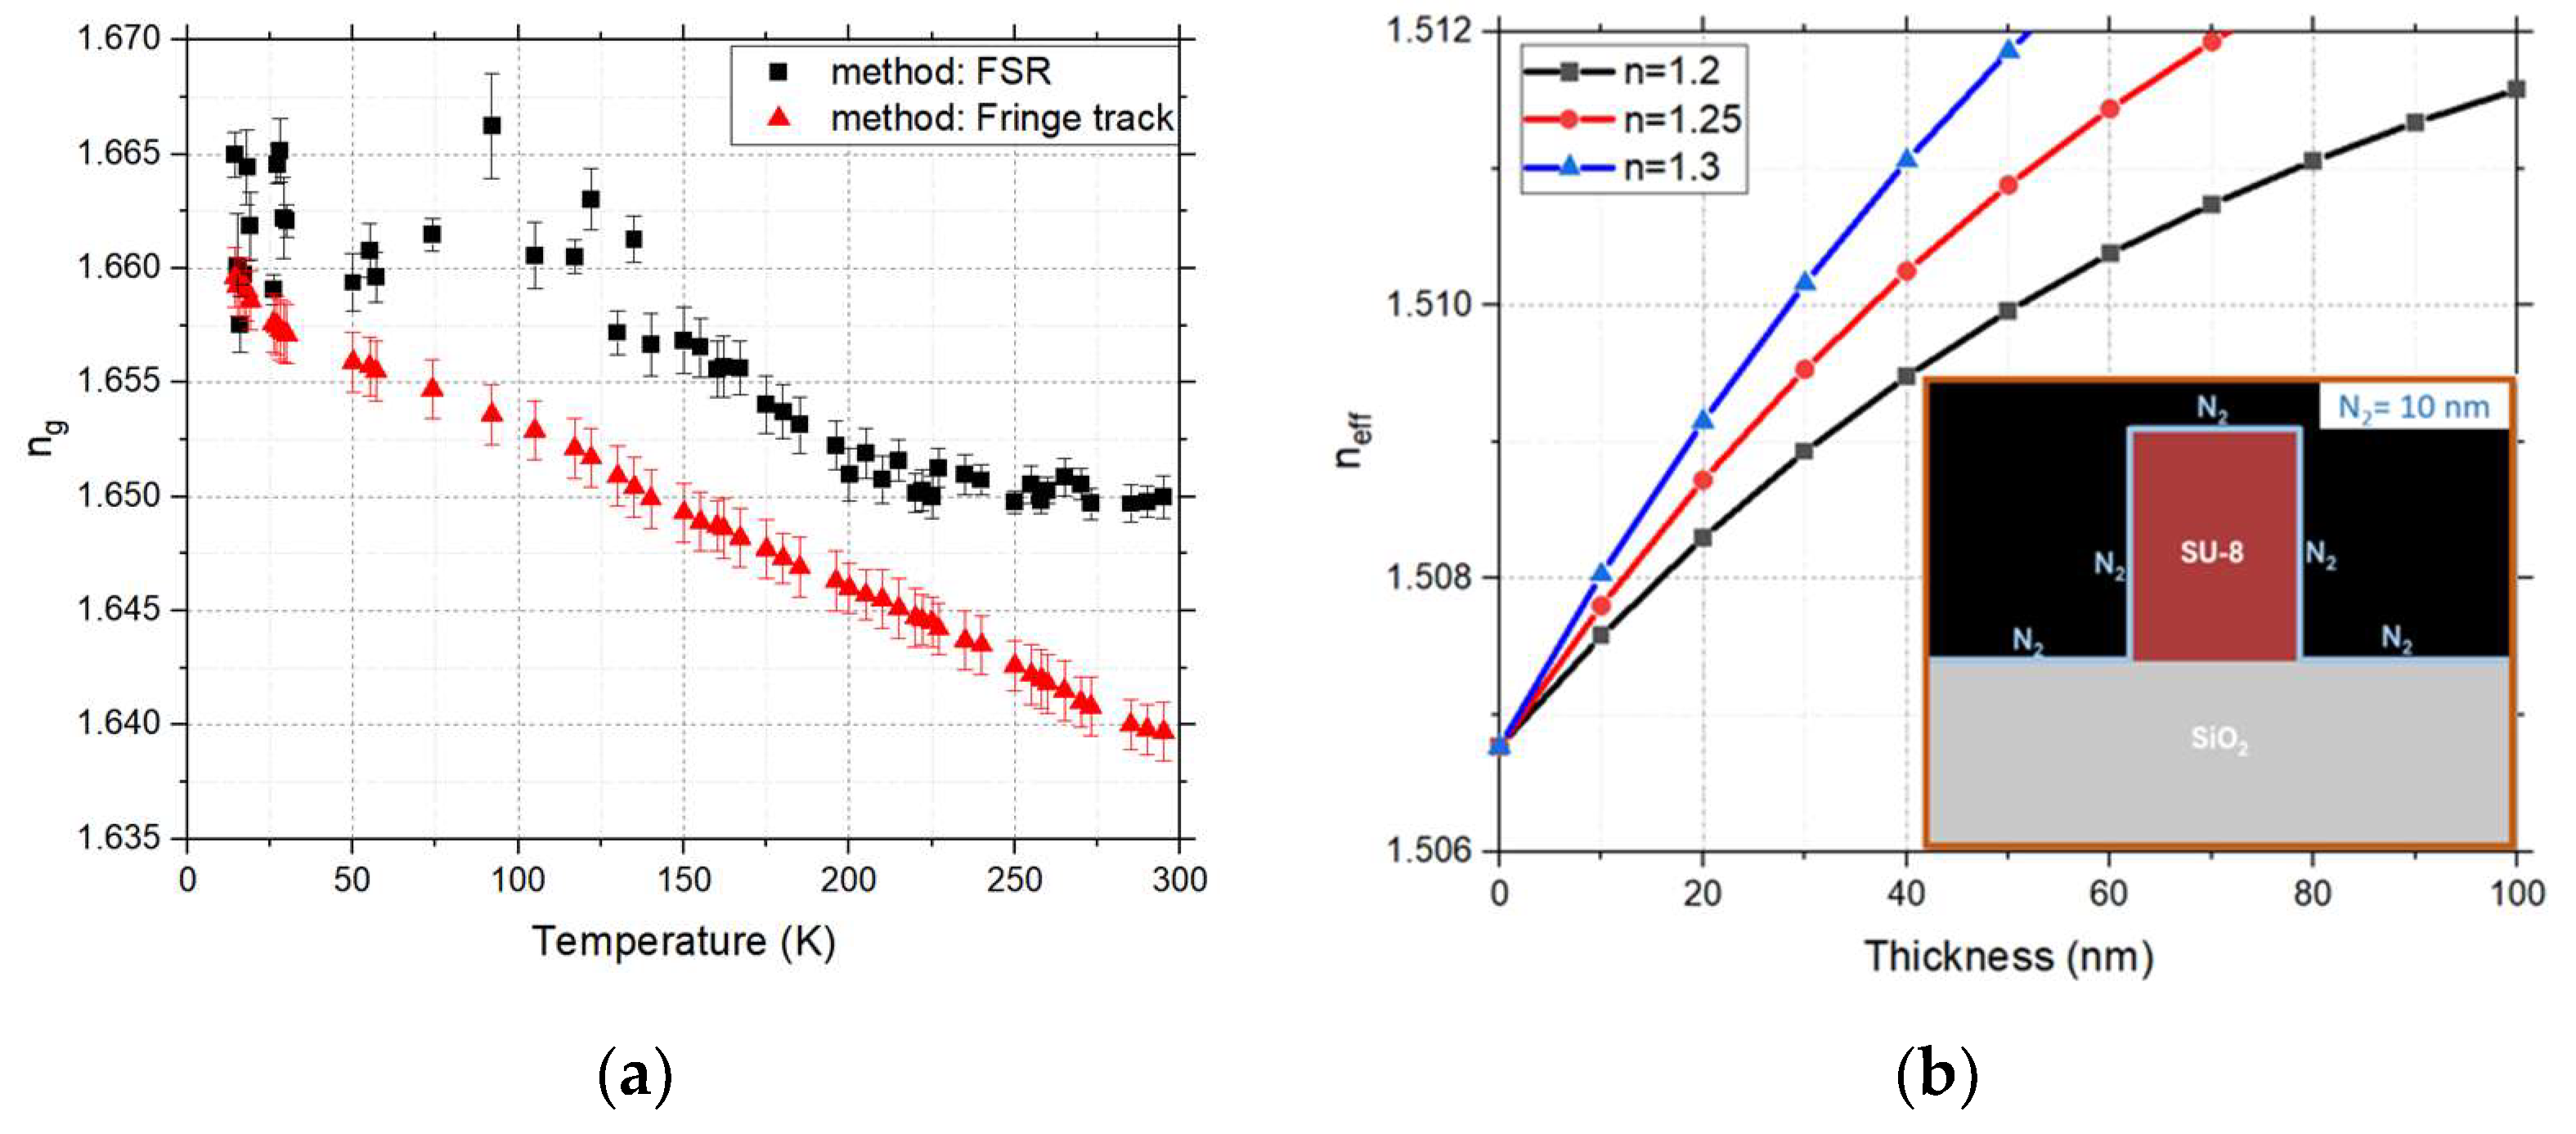
To determine more precisely we estimate for each by fitting the linear regression of the resonance wavelengths against the resonances order m in a 4 nm interval around 850 nm. For our resonator, this wavelength interval corresponds to a linear regression of 7 resonances. The analysis resulted in nm and nm, which give us nm. By inverting Equation (1), we obtained the values and which gives us a . In Figure 5a, we display the experimental results for , showing an increase in the group index at low temperatures having as well an increase in the error.
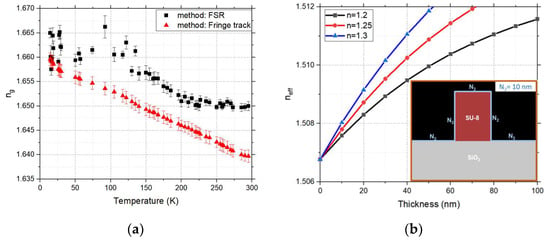
Figure 5.
(a) Comparison of obtained by two methods: from the FSR in black and from the fringe tracking in red. (b) The changes in related to a thin deposition of 3 materials with refractive indices of and 1.3. Note that around 50 nm of , the . The inset shows the geometry of the cladded waveguide, where grey is SiO2, red is SU-8, and blue is a cladding emulating N2 deposition. The thickness of the cladding was varied between 10 nm and 100 nm.
4. Discussion
We used two methods to work out the group index of the SU-8 waveguide from the measured spectra, namely from the free spectral range, and by fringe tracking. The methods differ by a value of approx. 0.01 in group refractive index (see Figure 5a). The FSR method extracts the group refractive index directly. The fringe tracking method determines the effective refractive index which is converted to the group refractive index by the eigenmode solver. This latter step assumes a perfect waveguide (e.g., with vertical sidewalls) in the simulations, which we believe imposes a bias and therefore the disagreement of the starting point, at RT. We predict the SU-8 to be affected by thermal contraction more than the Si substrate. For this reason, we expect stress to build up in the polymer and a small modification of the waveguide profile. Even so, both methods show that the increases at lower temperatures.
The behavior observed in the literature at telecom wavelengths shows a reduction in the absolute value of the TOC at lower temperatures. In comparison, our data show an increase below 50 K. We speculate that the potential source of this discrepant behavior between the literature TOC and ours can be the condensation on the waveguide of residual gases in the chamber we are measuring, primarily N2 [37,38]. Based on the measured residual pressure in the cryostat at lower temperatures, ~107 mbar, we expect N2 to deposit at ~35 K [39]. For this reason, we present simulations with a thin over-cladding covering the waveguide, as shown in the inset of Figure 5b. The refractive index used for the cladding goes from to to reflect the values of solid N2 [40]. For these simulations, we used values extrapolated from measurements plus the cladding thickness varying until 100 nm, and Figure 5b shows that the more nitrogen that is deposited, the higher the that will be observed. As the measured , our hypothesis suggests a possible deposition of 30 to 50 nm thickness. Improvements to the vacuum chamber would assist in reducing the quantity and effect of the N2.
We note that our analysis only assumes in-plane changes—i.e., length—for the waveguide as a function of temperature, while we do not model the changing thickness of the SU-8. If we took into account a reduction in the waveguide cross section, it would result in a higher value associated with a given . Our characterization of SU-8 optical properties will be most relevant for photonic circuits of comparable thickness and waveguide dimensions. The characterization loses accuracy when adopted for photonic platforms with a different SU-8 thickness and material stress. These changes from the ideal waveguide can cause the initial discrepancy of Figure 5a and its subsequent behavior at low temperature.
5. Conclusions
Our investigation studied the resonances of an SU-8 racetrack MRR in order to characterize the TOC of this material at . For our waveguide geometry, we observed a change in the group index from RT to 14 K of . By comparing the measured effective index as a function of temperature, against the electromagnetic simulations, we inferred . It behaves similarly to that present in the literature for λ=1550 nm but with a deviation observed below 50 K, possibly affected by N2 deposition or changes in the waveguide geometry. Our study gives a cryogenic at T = 14 K. The cooled device showed a reduction in the Q-factor for the same of , although the Q-factor remained higher than . These results support the use of SU-8 waveguides in PICs designed for the near infrared at low temperatures and enable more trustworthy simulations at these temperatures.
Author Contributions
S.A.M.-R. performed the numerical simulations; S.A.M.-R. and N.M. performed the data analysis and drafted the paper; S.A.M.-R. and A.S.V. performed the fabrication; S.A.M.-R. and J.O. performed the measurements; all the authors commented on, edited, and reviewed the manuscript. S.I., E.P. and L.O. supervised the work. All authors have read and agreed to the published version of the manuscript.
Funding
This research was founded by SFI 12/RC/2276_P2, 18/EPSRC-CDT/3585, 15/IA/2864, 22/FFP-A/10930, and by Enterprise Ireland through grant DT 2019 0090A.
Institutional Review Board Statement
Not applicable.
Informed Consent Statement
Not applicable.
Data Availability Statement
The data provided in this study are available upon request from the corresponding author.
Acknowledgments
Thanks to Samira Jastan for performing the ellipsometer measurements of the SU-8 2 and SiO2.
Conflicts of Interest
The authors declare no conflicts of interest. The funders had no role in the design of the study; in the collection, analyses, or interpretation of data; in the writing of the manuscript; or in the decision to publish the results.
References
- Osgood, R., Jr.; Meng, X. Chapter 1 Integrated Optics: An Overview. In Principles of Photonic Integrated Circuits—Materials, Device Physics, Guided Wave Design, 1st ed.; Springer Nature: Berlin, Germany, 2021; pp. 1–9. [Google Scholar]
- Xin, Y.; Pandraud, G.; Zhang, Y.; French, P. Single-mode tapered vertical SU-8waveguide fabricated by E-beam lithography for analyte sensing. Sensors 2019, 19, 3383. [Google Scholar] [CrossRef]
- Hwang, Y.; Phillips, N.; Otten, D.E.; Riesen, N.; Lancaster, D.G. Efficient coupling between single mode fibers and glass chip waveguides via graded refractive index fiber tips. Opt. Express 2022, 30, 12294–12307. [Google Scholar] [CrossRef] [PubMed]
- Zuo, H.; Yu, S.; Gu, T.; Hu, J. Low loss, flexible single-mode polymer photonics. Opt. Express 2019, 27, 11152. [Google Scholar] [CrossRef] [PubMed]
- Zhang, J.; Xu, H.; Zhang, G.; Chen, Y.; Wang, H.; Tan, K.H.; Wicaksono, S.; Sun, C.; Kong, Q.; Wang, C.; et al. Hybrid and heterogeneous photonic integrated near-infrared InGaAs/InAlAs single-photon avalanche diode. Quantum Sci. Technol. 2023, 8, 025009. [Google Scholar] [CrossRef]
- Pelucchi, E.; Fagas, G.; Aharonovich, I.; Englund, D.; Figueroa, E.; Gong, Q.; Hannes, H.; Liu, J.; Lu, C.Y.; Matsuda, N.; et al. The potential and global outlook of integrated photonics for quantum technologies. Nat. Rev. Phys. 2022, 4, 194–208. [Google Scholar] [CrossRef]
- Baranov, A.I.; Kudyashov, D.A.; Morozov, I.A.; Shugurov, K.Y.; Uvarov, A.V.; Maximova, A.A.; Vyacheslavova, E.A.; Gudovskikh, A.S. The SU-8 spin-coating on silicon nanowires formed by cryogenic dry etching. J. Phys. Conf. Ser. 2021, 2086, 012078. [Google Scholar] [CrossRef]
- Kim, Y.K.; Yi, S.H.; Kim, S.W.; Ju, B.K. A novel low-temperature microcap packaging using SU-8 bonding. In Proceedings of the TRANSDUCERS 2007–2007 International Solid-State Sensors, Actuators and Microsystems Conference, Lyon, France, 10–14 June 2007; pp. 2107–2110. [Google Scholar]
- Lima, R.S.; Leão, P.A.; Piazzetta, M.H.; Monteiro, A.M.; Shiroma, L.Y.; Gobbi, A.L.; Carrilho, E. Sacrificial adhesive bonding: A powerful method for fabrication of glass microchips. Sci. Rep. 2015, 5, 13276. [Google Scholar] [CrossRef] [PubMed]
- Gangnaik, A.S.; Georgiev, Y.M.; Holmes, J.D. New Generation Electron Beam Resists: A Review. Chem. Mater. 2017, 29, 1898–1917. [Google Scholar] [CrossRef]
- Tu, X.; Chen, S.L.; Song, C.; Huang, T.; Guo, L.J. Ultrahigh Q Polymer Microring Resonators for Biosensing Applications. IEEE Photonics J. 2019, 11, 4200110. [Google Scholar] [CrossRef]
- Ng, K.B.; Chong, W.Y.; Lim, C.S.; Ahmad, H. Single-mode SU-8 waveguide fabricated using ultrafast direct laser writing. Optik 2022, 270, 170068. [Google Scholar] [CrossRef]
- Leviton, D.B.; Frey, B.J. Temperature-dependent absolute refractive index measurements of synthetic fused silica. In Optomechanical Technologies for Astronomy; SPIE: Bellingham, WA, USA, 2006; p. 62732K. [Google Scholar] [CrossRef]
- Borreman, A.; Musa, S.; Kok, A.A.M.; Diemeer, M.; Driessen, A. Fabrication of polymeric multimode waveguides and devices in SU-8 photoresist using selective polymerization. In Proceedings of the 7th IEEE/LEOS Benelux Chapter Annual Symposium, Amsterdam, The Netherlands, 9 December 2002; Vrije Universiteit: Amsterdam, Netherlands, 2002. [Google Scholar]
- Schimpf, C.; Manna, S.; da Silva, S.F.C.; Aigner, M.; Rastelli, A. Entanglement-based quantum key distribution with a blinking-free quantum dot operated at a temperature up to 20 K. Adv. Photonics 2021, 3, 065001. [Google Scholar] [CrossRef]
- Liao, S.K.; Cai, W.Q.; Liu, W.Y.; Zhang, L.; Li, Y.; Ren, J.G.; Yin, J.; Shen, Q.; Cao, Y.; Li, Z.P.; et al. Satellite-to-ground quantum key distribution. Nature 2017, 549, 43–47. [Google Scholar] [CrossRef] [PubMed]
- Yano, O.; Yamaokat, H. Cryogenic properties of polymers. Prog. Polym. Sci. 1995, 20, 585–613. [Google Scholar] [CrossRef]
- Chen, D.; Li, J.; Yuan, Y.; Gao, C.; Cui, Y.; Li, S.; Liu, X.; Wang, H.; Peng, C.; Wu, Z. A review of the polymer for cryogenic application: Methods, mechanisms and perspectives. Polymers 2021, 13, 320. [Google Scholar] [CrossRef]
- Lee, K.H.; Green, A.M.; Taylor, R.A.; Sharp, D.N.; Turberfield, A.J.; Brossard, F.S.; Williams, D.A.; Briggs, G.A.D. Cryogenic two-photon laser photolithography with SU-8. Appl. Phys. Lett. 2006, 88, 6–9. [Google Scholar] [CrossRef]
- Rego, G. Temperature Dependence of the Thermo-Optic Coefficient of SiO2 Glass. Sensors 2023, 23, 6023. [Google Scholar] [CrossRef]
- Elshaari, A.W.; Zadeh, I.E.; Jöns, K.D.; Zwiller, V. Thermo-Optic Characterization of Silicon Nitride Resonators for Cryogenic Photonic Circuits. IEEE Photonics J. 2016, 8, 2701009. [Google Scholar] [CrossRef]
- Cariou, J.M.; Dugas, J.; Martin, L.; Michel, P. Refractive-index variations with temperature of PMMA and polycarbonate. Appl. Opt. 1986, 25, 334. [Google Scholar] [CrossRef]
- Leviton, D.B.; Frey, B.J. Cryogenic High-Accuracy Refraction Measuring System (CHARMS): A new facility for cryogenic infrared through far-ultraviolet refractive index measurements. Opt. Fabr. Metrol. Mater. Adv. Telesc. 2004, 5494, 492. [Google Scholar] [CrossRef]
- Liao, S.; Ni, L.; Ren, Q.F. Design of a cryogenic absolute prism refractometer for infrared optical materials. In Seventh International Symposium on Precision Engineering Measurements and Instrumentation; SPIE: Bellingham, WA, USA, 2011; Volume 8321. [Google Scholar] [CrossRef]
- Mendoza-Castro, J.H.; Vorobev, A.S.; Iadanza, S.; Lendl, B.; Grande, M.; O’Faolain, L. Enhanced Fano resonances in a Silicon Nitride Photonic Crystal Nanobeam-assisted Micro Ring Resonator for dual telecom band operation. In Proceedings of the 2023 Conference on Lasers and Electro-Optics Europe and European Quantum Electronics Conference, CLEO/Europe-EQEC 2023, Munich, Germany, 26–30 June 2023; Institute of Electrical and Electronics Engineers Inc.: Piscataway, NJ, USA, 2023. [Google Scholar] [CrossRef]
- Yang, L.; Dai, D.; He, J.J.; He, S. Observation of the thermal nonlinear optical effect in a microring resonator based on a small SU-8 polymer ridge optical waveguide. In Proceedings of the 2009 Asia Communications and Photonics Conference and Exhibition, ACP 2009, Shanghai, China, 2–6 December 2009. [Google Scholar] [CrossRef]
- Dai, D.; Yang, B.; Yang, L.; Sheng, Z. Design and fabrication of SU-8 polymer-based micro-racetrack resonators. Passiv. Compon. Fiber-Based Devices V 2008, 7134, 713414. [Google Scholar] [CrossRef]
- Samanta, S.; Dey, P.K.; Banerji, P.; Ganguly, P. Development of micro-ring resonator-based optical bandpass filter using SU-8 polymer and optical lithography. Opt. Mater. 2018, 77, 122–126. [Google Scholar] [CrossRef]
- Ariannejad, M.M.; Amiri, I.S.; Azzuhri, S.R.B.; Zakaria, R.; Yupapin, P. Polarization dependence of SU-8 micro ring resonator. Results Phys. 2018, 11, 515–522. [Google Scholar] [CrossRef]
- Huang, Y.; Paloczi, G.T.; Yariv, A.; Zhang, C.; Dalton, L.R. Fabrication and replication of polymer integrated optical devices using electron-beam lithography and soft lithography. J. Phys. Chem. B 2004, 108, 8606–8613. [Google Scholar] [CrossRef]
- Lee, Y.; Zhang, H.F.; Sun, C. Highly sensitive ultrasound detection using nanofabricated polymer micro-ring resonators. Nano Converg. 2023, 10, 30. [Google Scholar] [CrossRef] [PubMed]
- Finardi, C.A.; Carvalho, W., Jr.; Zoldan, V.C.; Panepucci, R.R.; Malheiros-Silveira, G.N. Foundry produced SU-8 inverted-rib waveguide-based components. In Optical Manufacturing and Testing XIII; SPIE: Bellingham, WA, USA, 2020; Volume 11487. [Google Scholar]
- Malheiros-Silveira, G.N.; Finardi, C.A.; Bürger, T.S.; Van Etten, E.A.; Da Silva, R.C.; Coelho, A.V.; Daltrini, A.M.; Panepucci, R.R. High-resolution notch filters and diplexers based on SU-8 inverted rib waveguides. Appl. Opt. 2019, 58, 7331–7335. [Google Scholar] [CrossRef] [PubMed]
- Yin, Y.; Li, Y.; Yao, M.; Lv, X.; Liang, J.; Wu, Y.; Zhang, D. Low power consumption polymer/silica hybrid thermo-optic switch based on racetrack resonator. IEEE Photonics J. 2022, 14, 6634006. [Google Scholar] [CrossRef]
- Chakraborty, T.; Gordillo, O.A.J.; Barrow, M.; Lipson, M.; Murphy, T.E.; Grutter, K.E. Thermo-Optic Characterization of SU-8 at Cryogenic Temperature. Opt. Mater. Express 2024, 14, 435–444. [Google Scholar] [CrossRef]
- Material Properties: Silicon. Available online: https://trc.nist.gov/cryogenics/materials/Silicon/Silicon.htm (accessed on 14 August 2024).
- Carrasco, E.; Castillo, J.M.; Escribano, R.; Herrero, V.J.; Moreno, M.A.; Rodrıguez, J. A cryostat for low-temperature spectroscopy of condensable species. Rev. Sci. Instrum. 2002, 73, 3469–3473. [Google Scholar] [CrossRef]
- Öberg, K.I.; van Dishoeck, E.F.; Linnartz, H. Photodesorption of ices I: CO2 and N2. Astron. Astrophys. 2009, 496, 281–293. [Google Scholar] [CrossRef]
- Fray, N.; Schmitt, B. Sublimation of ices of astrophysical interest: A bibliographic review. Planet. Space Sci. 2009, 57, 2053–2080. [Google Scholar] [CrossRef]
- Rocha, W.R.M.; Pilling, S.; Domaracka, A.; Rothard, H.; Boduch, P. Infrared complex refractive index of N-containing astrophysical ices free of water processed by cosmic-ray simulated in laboratory. Spectrochim. Acta Part A Mol. Biomol. Spectrosc. 2020, 228, 117826. [Google Scholar] [CrossRef] [PubMed]
Disclaimer/Publisher’s Note: The statements, opinions and data contained in all publications are solely those of the individual author(s) and contributor(s) and not of MDPI and/or the editor(s). MDPI and/or the editor(s) disclaim responsibility for any injury to people or property resulting from any ideas, methods, instructions or products referred to in the content. |
© 2024 by the authors. Licensee MDPI, Basel, Switzerland. This article is an open access article distributed under the terms and conditions of the Creative Commons Attribution (CC BY) license (https://creativecommons.org/licenses/by/4.0/).