Abstract
Partial discharge is a fault that occurs at the site of insulation defects within a transformer. Dual instances of partial discharge origination discharging simultaneously embody a more intricate form of discharge, where the interaction between the discharge sources leads to more intricate and unpredictable insulation damage. Conventional piezoelectric transducers are magnetically affixed to the exterior metal tank of transformers. The ultrasonic signals emanating from partial discharge undergo deflection and reverberation upon traversing the windings, insulation paperboards, and the outer shell, resulting in signal attenuation and thus making it difficult to detect such faults. Furthermore, it is challenging to distinguish between simultaneous discharges from dual partial discharge sources and continuous discharges from a single source, often leading to missed detection and repairs of fault points, which increase the maintenance difficulty and cost of power equipment. With the advancement of MEMS (Micro-Electro-Mechanical System) technology, fiber-optic ultrasonic sensors have surfaced as an innovative technique for optically detecting partial discharges. These sensors are distinguished by their minute dimensions, heightened sensitivity, and robust immunity to electromagnetic disturbances. and excellent insulation properties, allowing for internal installation within power equipment for partial discharge monitoring. In this study, we developed an EFPI (Extrinsic Fabry Perot Interferometer) optical fiber ultrasonic sensor that can be installed inside transformers. Based on this sensor array, we also created a partial discharge ultrasonic detection system that estimates the directional information of single and dual partial discharge sources using the received signals from the sensor array. By utilizing the DOA (Direction of Arrival) as a feature recognition parameter, our system can effectively detect both simultaneous discharges from dual partial discharge sources and continuous discharges from a single source within transformer oil tanks, meeting practical application requirements. The detection methodology presented in this paper introduces an original strategy and resolution for pinpointing the types of partial discharges occurring under intricate conditions within power apparatus, effectively distinguishing between discharges from single and dual partial discharge sources.
1. Introduction
In the field of high-voltage power equipment, partial discharge (PD) is often regarded as a precursor or warning signal of declining insulation performance and impending failure. This phenomenon indicates that the insulating material or structure inside the equipment may have been damaged, leading to uneven distribution of electric fields and triggering charge release in localized areas. Partial discharge can not only accelerate the aging process of insulating materials, but also further deteriorate the operating condition of the equipment, ultimately leading to equipment failure or even invalidation. Therefore, timely and accurate monitoring and examination of PD within high-voltage power equipment is of paramount importance for preventing equipment failures and ensuring the reliable functioning of the power system [1]. Partial discharge frequently arises at imperfections such as fissures, voids, and metallic contaminants embedded within the insulating material. Partial discharge not only produces a multitude of gaseous elements and chemical compounds, but also causes adverse effects such as localized temperature rise and insulation corrosion. These phenomena exacerbate the degradation of insulation flaws, potentially perpetuating a vicious cycle that can severely compromise the integrity of the entire power equipment and system [2]. Dual PD sources in power equipment represent a more complex scenario of partial discharge faults. It is often difficult to distinguish simultaneous discharge from two points from continuous discharge from a single source, which may lead to missed inspections and ineffective maintenance during fault diagnosis [3]. Repeated inspections can increase equipment maintenance costs. Accurate judgment of the number of fault points and timely maintenance can avoid major accidents. Therefore, the multiple points of measurement and classification of PD within power equipment hold paramount importance for ensuring safe operation and facilitating optimized maintenance strategies within the power system [4]. Article [5] utilizes an F-P sensor to communicate through optical signal transmission. The F-P sensor is installed inside the transformer oil tank, and optical fibers are used to connect the sensor probe inside the transformer to the external detection equipment. Optical signals do not interfere with the internal electric field of the transformer. The built-in sensor probe can more directly capture the partial discharge signals inside the transformer with higher sensitivity, so it can capture the discharge signals from dual partial discharge sources. However, it does not distinguish between simultaneous discharge from dual partial discharge sources and continuous discharge from a single partial discharge source.
To overcome the aforementioned issues, this paper presents a design for an extrinsic Fabry Perot interferometer (EFPI) ultrasonic sensor that can be installed inside transformer oil tanks and adapt to changes in insulating oil pressure and temperature [6]. Through simulation and comparative studies, this sensor is configured as a 4-element regular tetrahedron array. The sensor array is utilized to estimate the Direction of Arrival (DOA) of partial discharge ultrasonic signals, and the method of measuring the DOA of ultrasonic signals from PD sources is employed to identify the discharge types of single and dual PD sources [7]. Finally, experiments with single and dual PD sources are conducted within the transformer’s insulating fluid. Based on the waveforms collected by the detection system and the estimated DOA results of the ultrasonic signals, the effectiveness of the detection system in distinguishing between single-point continuous discharge and simultaneous discharge from dual partial discharge sources is verified.
2. Fiber-Optic Ultrasonic Sensor Array
2.1. The Fundamental Principle of Membrane-Type EFPI Fiber-Optic Sensor
The EFPI sensor probe is comprised of a single-mode fiber (SMF), a sillica tube, and a sillica diaphragm coated with a Ta2O5 and SiO2 composite. The sillica tube is perforated to allow transformer liquid insulation oil to enter, maintaining the pressure balance inside and outside the sillica diaphragm. The terminal surface of the optical fiber and the sillica diaphragm comprises the two reflective planes of the Fabry–Perot interferometer [8]. A schematic diagram of the EFPI fiber-optic ultrasonic sensor structure is visualized in Figure 1.
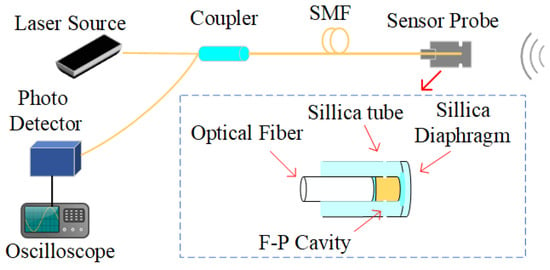
Figure 1.
Configuration of the EFPI sensor.
The light source used in this paper is the ASE light source produced by Tianjin Junfeng Technology Co., Ltd. (Tianjin, China), which can provide laser light source with wavelength band of 1510–1590 nm and central wavelength of 1550 nm. The light signal generated by the light source arrives at the sensor probe via the optical path. At the interface between air and glass situated at the termination of the fiber’s end surface, a tiny amount of the light is reflected backwards and enters the SMF initially, while the preponderance of the remaining light traverses the Fabry–Perot cavity, it undergoes a second reflection off the inner side of the silica membrane [9]. Through coating technology, the reflectivity of the diaphragm is adjusted to allow most light to be mirrored back towards the SMF again. The two reflected light signals travel within the same fiber, leading to the phenomenon of interference. The mathematical expression for the intensity of the light after interference is:
In the equation, I0(λ) denotes the intensity level of the incident light; λ is the wavelength characteristic of the light emitter in the detection system; R1 is the reflection coefficient of the SMF terminal surface; R2 is the reflectivity of the inner surface of the sillica diaphragm; φ is the shift in phase angle existing between the two reflective interfaces, where φ = 4πΔl/λ; Δl indicates the path difference of the two interfering light beams reflected by the termination of the fiber and the interior boundary of the silica membrane [10]. As demonstrated by Equation (1), the strength of the light that is redirected back into the SMF after interference is solely determined by changes in the cavity length [11,12,13]. The ultrasonic waves emanating from PD induce the sillica membrane of the sensing probe to vibrate and deform, subsequently affecting the Fabry–Perot cavity length, resulting in a pattern of interference fringes. By quantifying the intensity of the light interference, translating it into an electrical impulse, and enhancing it with a photodetector, the ultrasonic signal is transformed into a series of electrical pulses. The laser serves as the intermediary for the exchange of these two signals, ensuring that the detection system does not produce electromagnetic interference to the power equipment under test. Additionally, the diminutive dimensions of the sensing probe allow for flexible placement inside the transformer.
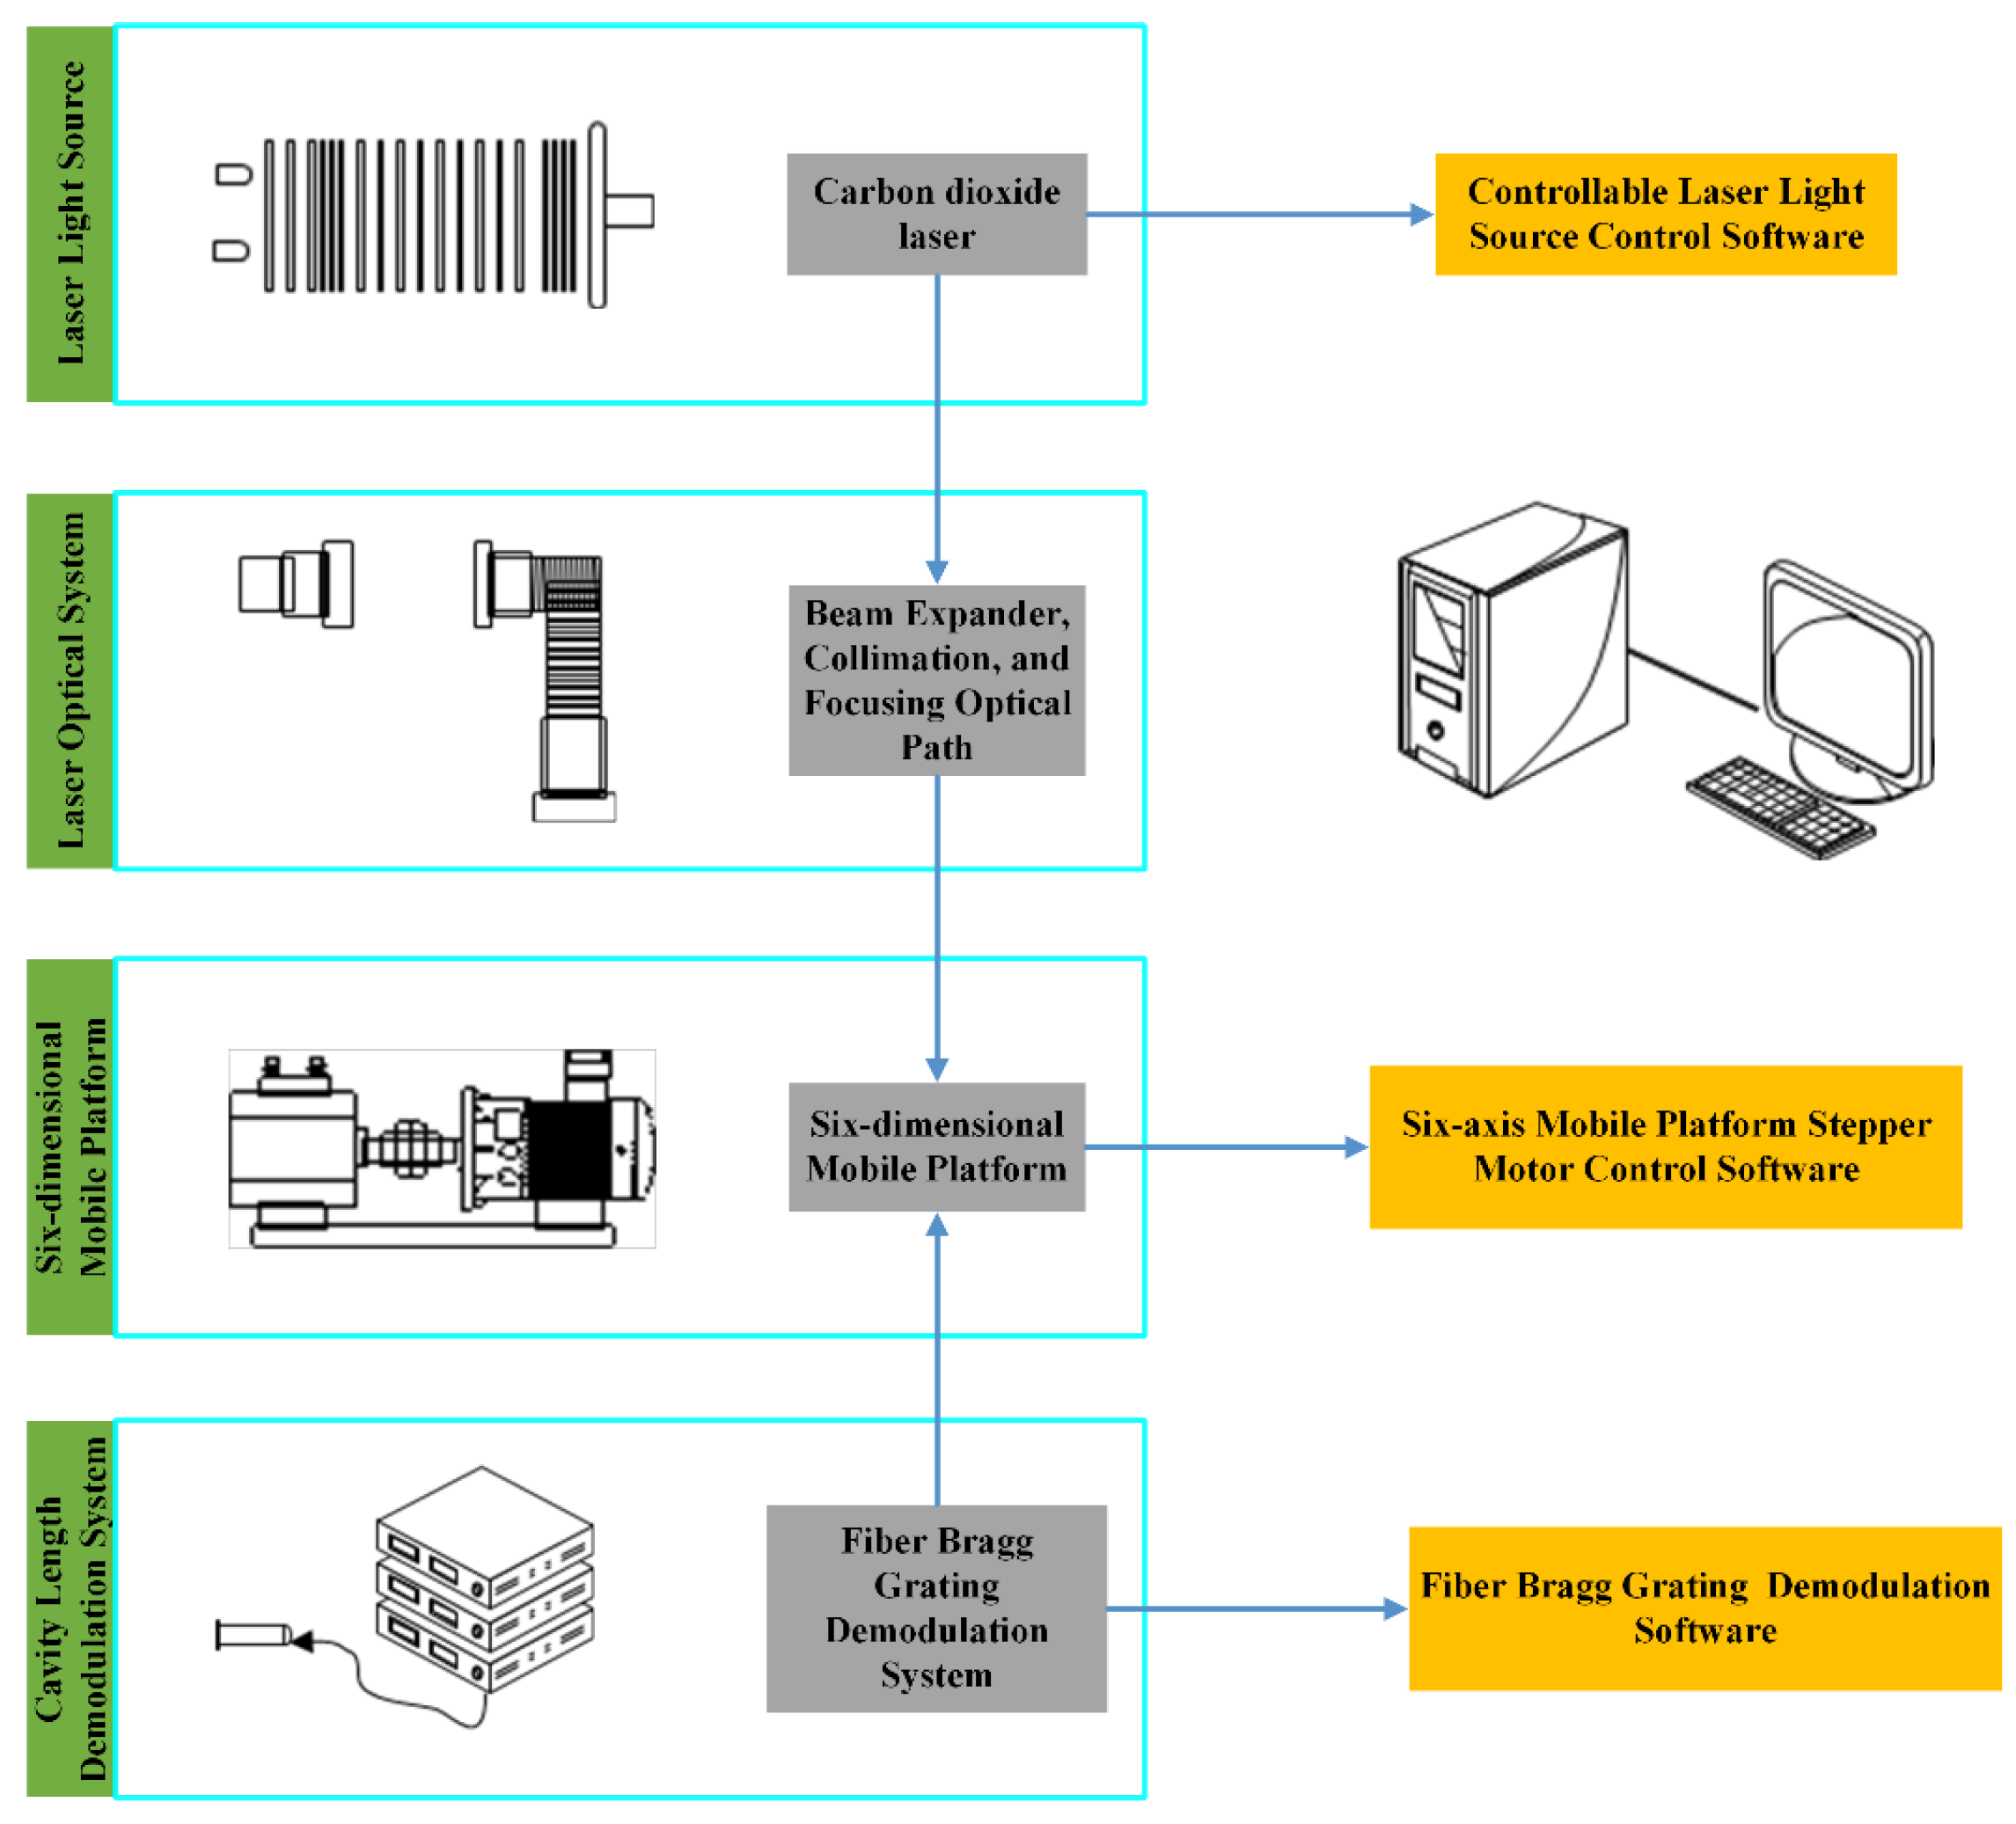
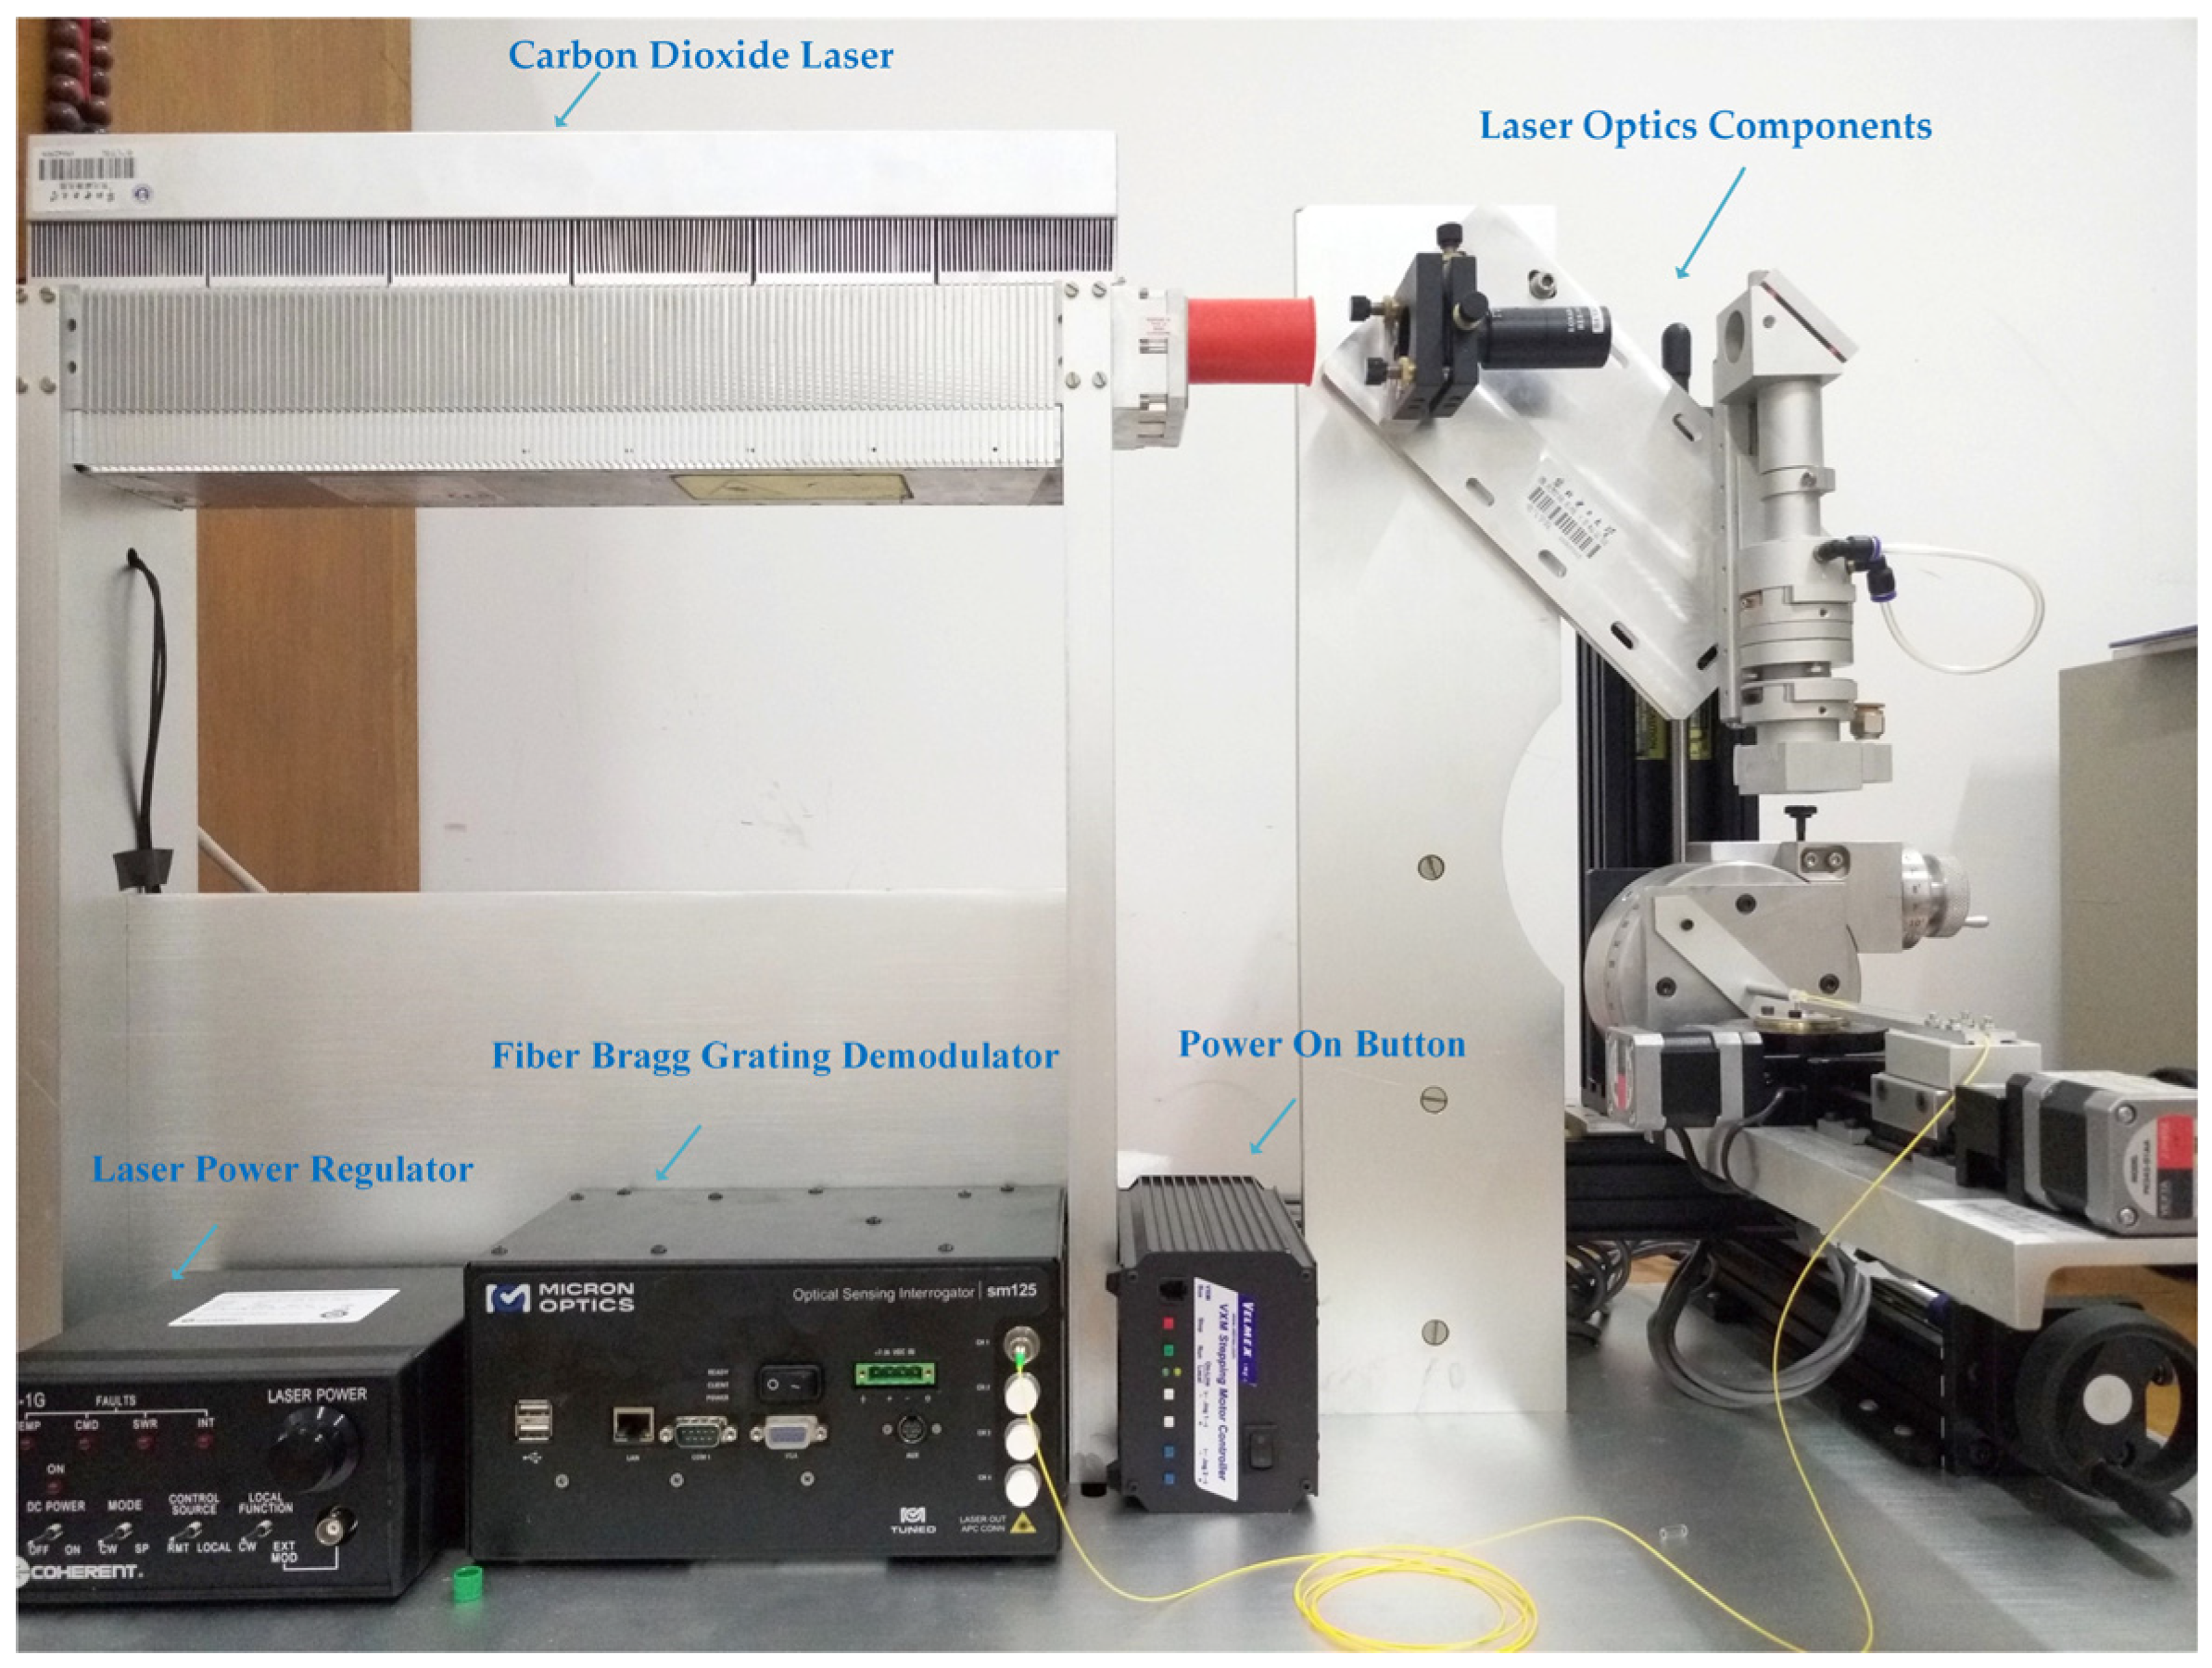
Affected by factors such as heat dissipation of power equipment, changes in day–night power load, and changes in working environment temperature, the temperature of transformer oil tanks varies within a range of 40° to 70°. To avoid the impact of changing oil temperature on the initial working point of the EFPI sensor and strengthen the steadfastness of the detection apparatus, this article adopts a COHERENT DIAMONDC-70A carbon dioxide laser, a customized beam expansion, collimation, and focusing optical path from Nanjing Wavelength Photonics Technology Company (Nanjing, China), a six-dimensional mobile platform, and a MICRON OPTICS sm125 fiber Bragg grating demodulator to form an EFPI sensor manufacturing platform [14]. The structural diagram is shown in Figure 2, and the physical hardware platform is shown in Figure 3. Laser welding is used to join the SMF and sillica capillary, replacing the traditional method of fixation using epoxy resin, thereby minimizing the effect of temperature variations on the sensor cavity length due to glue. However, the fiber core and sillica capillary will still expand and contract due to temperature changes, affecting the F-P cavity length. Therefore, further improvements to the materials and manufacturing processes of EFPI fiber-optic ultrasonic sensors suitable for power transformer operating environments are needed [15].

Figure 2.
Structure of EFPI fiber-optic ultrasonic sensor manufacturing system.

Figure 3.
Physical diagram of the hardware platform.
2.2. Design of Internal Type Ultrasonic Detection System for Partial Discharge
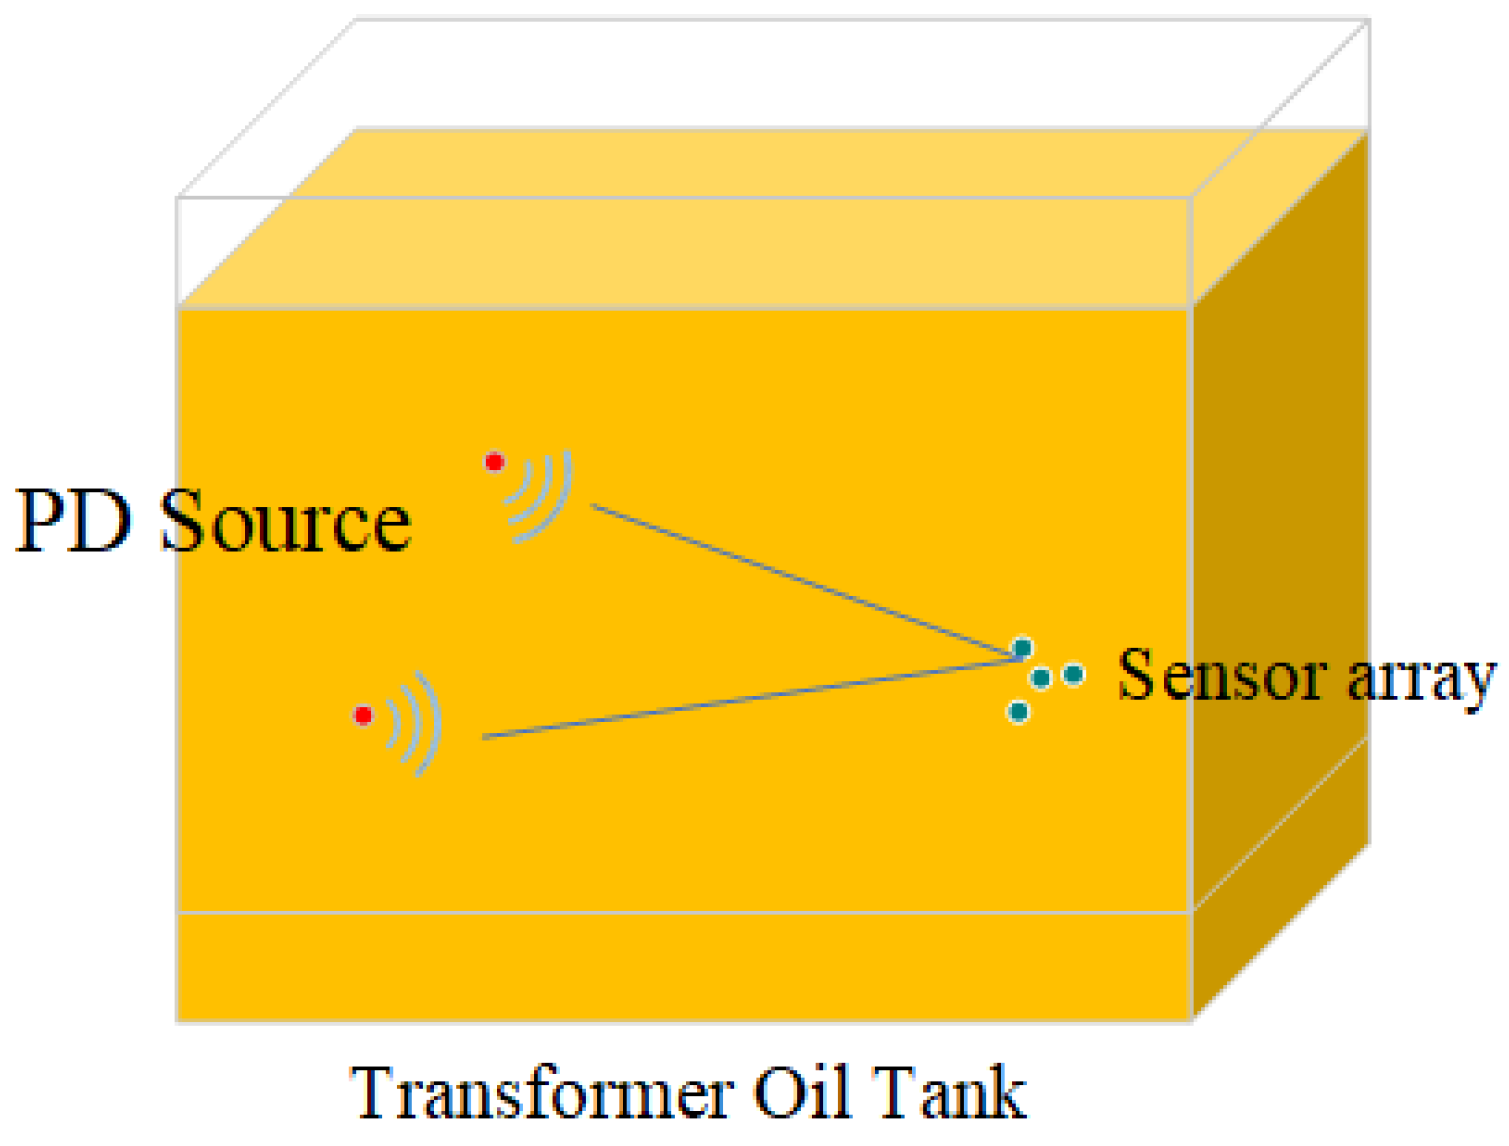
Typically, the ultrasonic signals emanating from partial discharges in transformers span a frequency spectrum ranging from 20 kHz to 2 MHz. By investigating the influence of the EFPI fiber-optic ultrasonic sensor’s probe diaphragm’s thickness and diameter on its central frequency response, we meticulously crafted a sensor probe that operates at a central frequency of 30 kHz, ensuring optimal signal clarity amidst background noise. When tasked with capturing concurrent discharge signals originating from dual partial discharge sources utilizing a solitary sensor probe, the resulting output waveform, as captured by the photodetector, is depicted in Figure 4.
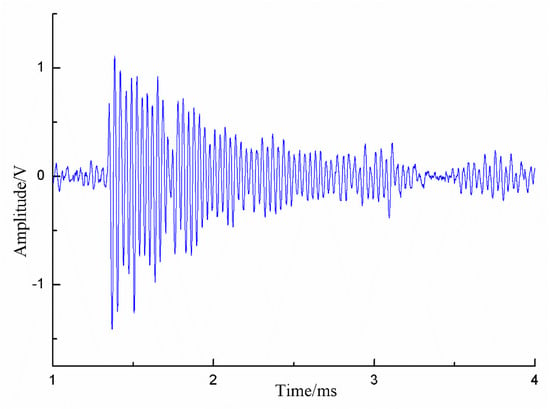
Figure 4.
Dual PD signals measured by fiber-optic ultrasonic sensor.
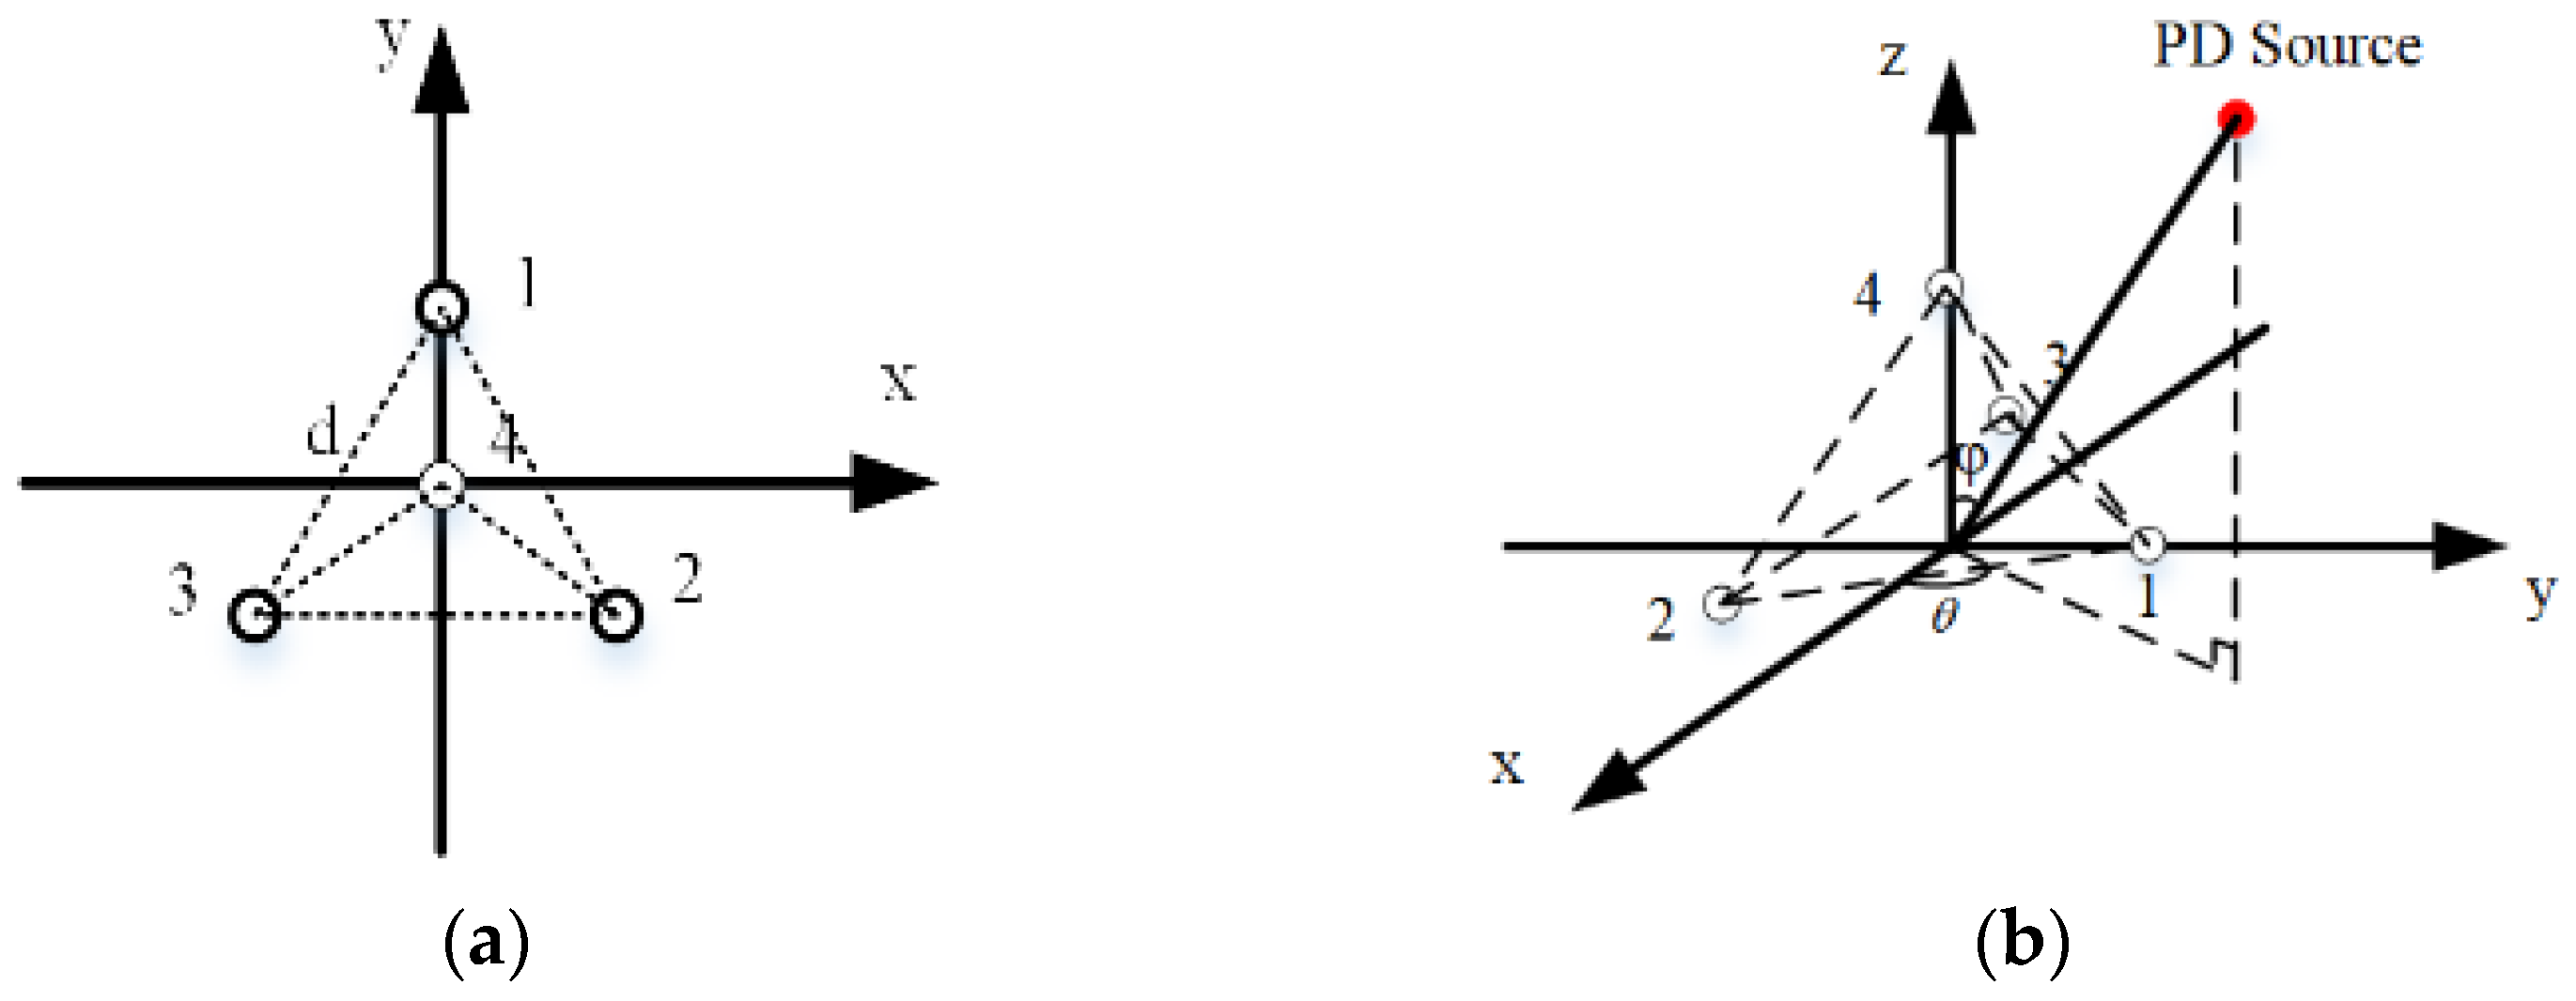
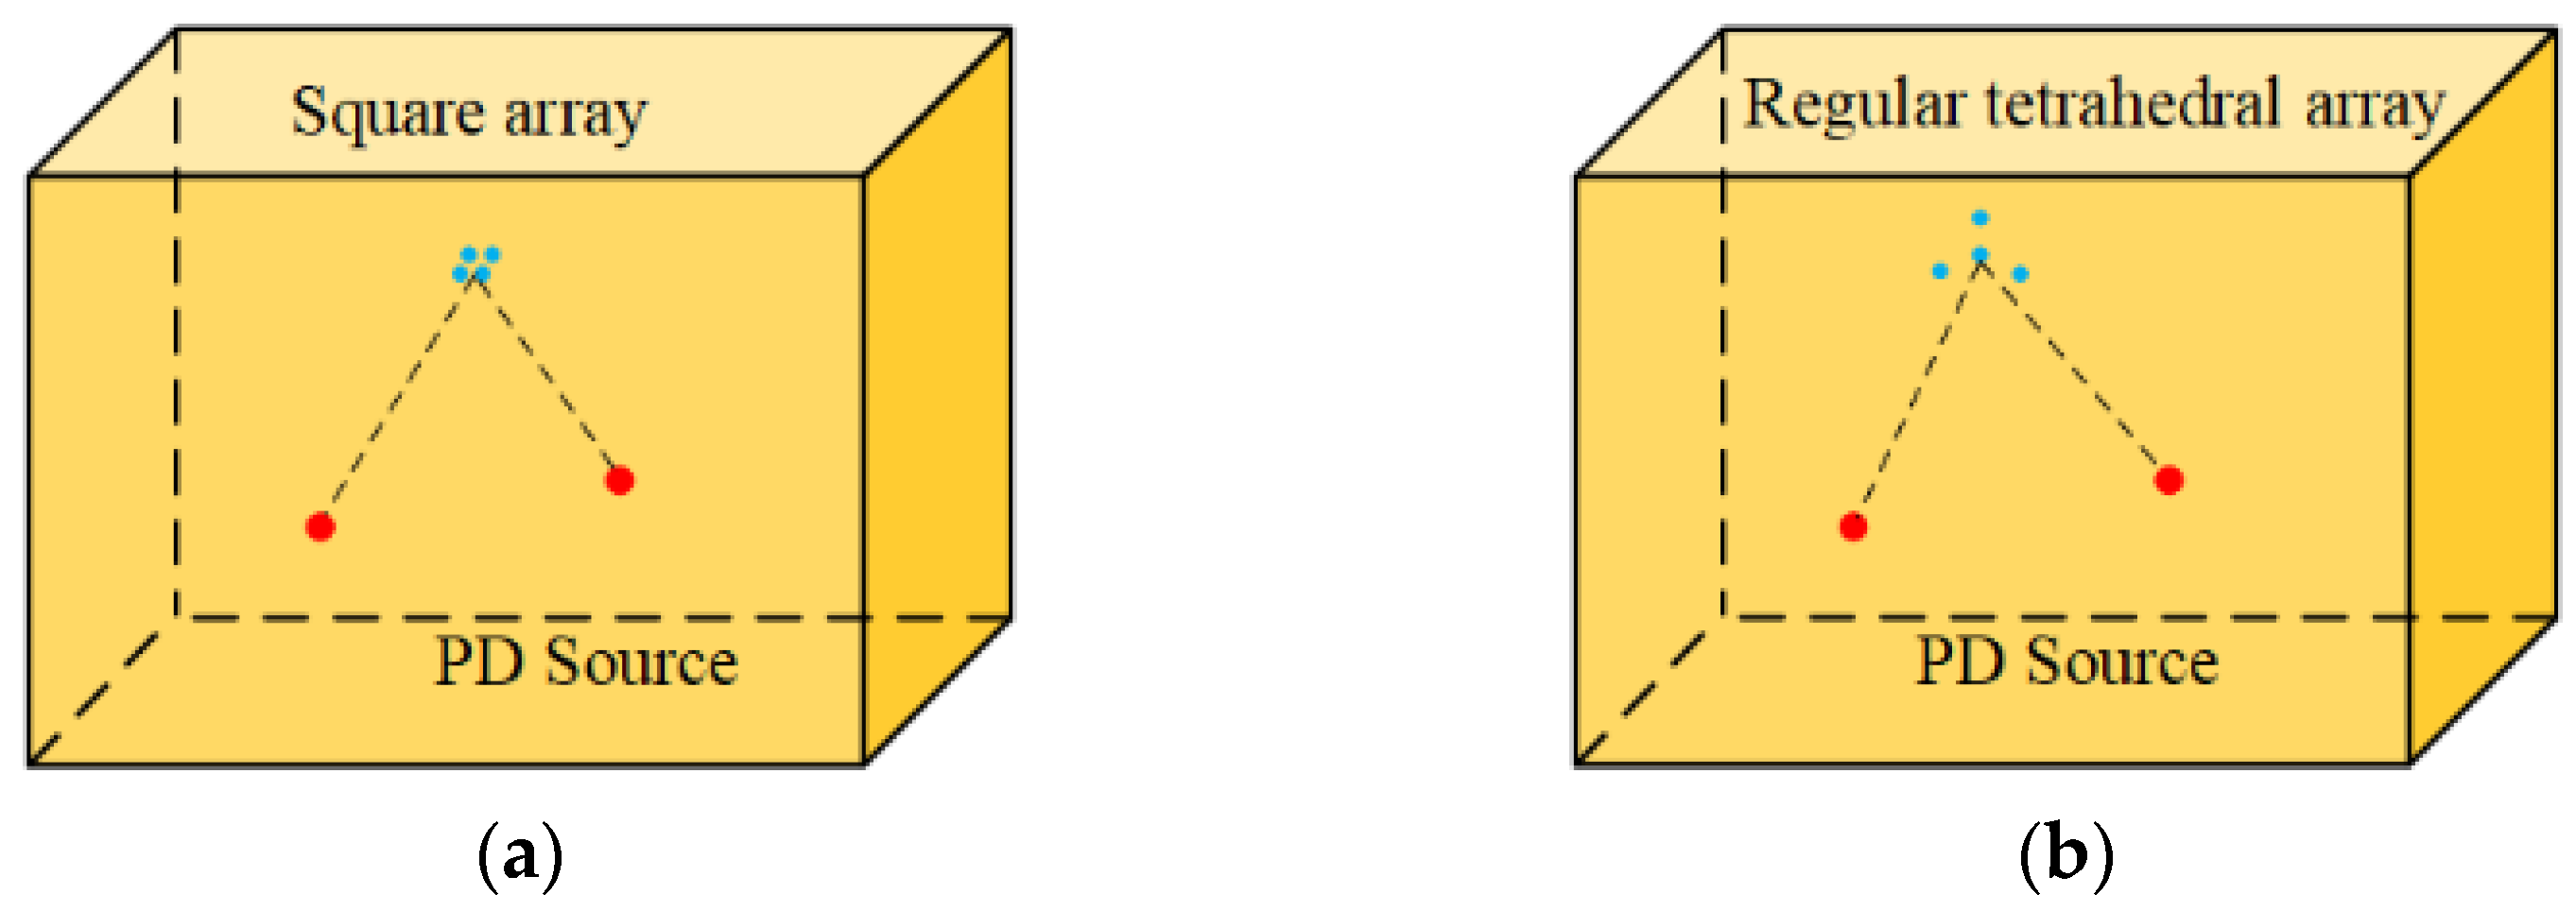
Evidently showcased by the waveform diagram, our custom-designed sensor effectively discerns concurrent discharge patterns emanating from dual PD sources. Beyond validating the single EFPI sensor’s prowess, this paper advocates a sensor array strategy aimed at pinpointing both single and dual partial discharge origins. Adhering to phased array principles, we determined that maintaining element spacing at or below half the wavelength of the targeted signal curtails energy capture by spurious lobes and boosts the array’s overall signal reception capacity. Furthermore, to attain a substantial receptive area and enhance the array’s directional precision, we opted for half-wavelength spacing. Considering the experimental scenario, where ultrasonic waves traverse transformer insulating oil at 1400 m/s with a central frequency of 30 kHz, we computed a wavelength approximating 47 mm. To balance between an ample receptive area and signal coherence across elements, thereby mitigating directional deviations stemming from inconsistent responses, we refined the element spacing to 20 mm, as documented in [16]. To delve into the influence of array geometry on partial discharge source localization accuracy, we formulated two distinct array configurations: a square array and a regular tetrahedral array. The layouts of these arrays, complete with illustrations of their plan views and spatial arrangements (Figure 5 and Figure 6), introduce θ and φ as placeholders for the azimuthal and polar angles, respectively, characterizing the ultrasonic signal’s origin from the partial discharge source. Moreover, the introduction of a three-dimensional rectangular coordinate system tailored for the sensor array facilitates subsequent discourse and calculations pertinent to pinpointing partial discharge sources in this paper.
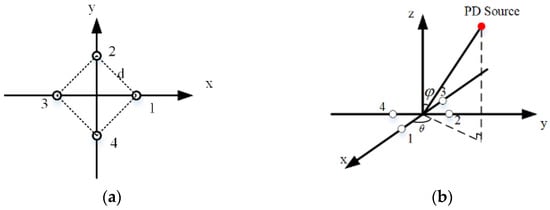
Figure 5.
The diagrammatic depiction of the square array element structure (a) Plan view; (b) Space arrangement diagram.
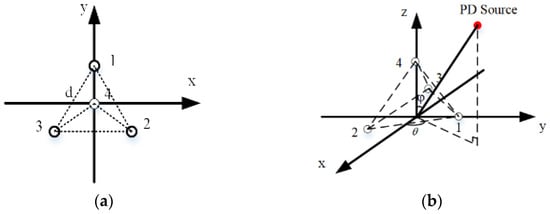
Figure 6.
The diagrammatic depiction of the regular tetrahedron array element structure (a) Plan view; (b) Space arrangement diagram.
3. Identification Method for Discharge Types of Single and Dual PD Sources
Direction of Arrival (DOA) estimation involves processing received echo signals to obtain directional information of signal sources, providing fundamental data support for subsequent applications such as localization, tracking, etc. It is a crucial technology for determining the direction of signal sources in research fields like electronics, communications, radar, sonar, etc. The principle of DOA estimation is primarily based on array signal processing technology, utilizing arrays composed of multiple receiving antennas to receive signals from different directions. The MUSIC algorithm constitutes an advanced spectral estimation technique for signal processing and array analysis. Relying on the orthogonality between the subspaces of signals and noise, it ascertains the orientation of signals by locating peaks across the spatial spectrum. For estimating parameters of multiple signal sources amidst noise, it is especially well-suited. However, employing the MUSIC algorithm for ultrasonic detection of PD encounters challenges. Primarily, the ultrasonic signal emanating from PD is a wideband phenomenon, comprising a spectrum of frequencies spanning a defined range. Furthermore, conventional ultrasonic sensors utilized for partial discharge detection, notably piezoelectric transducers, possess a frequency response range of 30–150 kHz, aligning with the broadband nature of the captured ultrasonic signals, which similarly encompass a wide spectrum of frequencies. Considering the application of the MUSIC algorithmic framework, the signal subspace at different frequencies for broadband signals is different, so the MUSIC algorithm is not suitable for direct application with traditional piezoelectric transducers. In contrast, the EFPI fiber-optic ultrasonic sensor designed in this study has an approximate primary frequency of 30 kHz with peak responsiveness, measuring narrowband signals. It can directly cooperate with the MUSIC algorithm for direction finding of PD sources. In conclusion, the designed EFPI fiber-optic ultrasonic sensor has certain advantages in terms of design structure and principle compared to traditional piezoelectric transducers for direction finding.
3.1. Sensor Array Reception Model for Partial Discharge Ultrasonic Signals
Based on the statistical model of array signals, assuming that K partial discharge ultrasonic signals arrive at a sensor array composed of M array elements, the total signal received by the array sensor can be formulated as:
In the expression, X(t) represents the ultrasonic signals from M array elements captured by the oscilloscope:
S(t) is the signal vector:
N(t) is the interference noise vector:
The matrix A(θ, φ) represents the signal’s steering matrix, encompassing the DOA of the sound source, where θ indicates the azimuth angle of the PD source, and φ represents its pitch angle [17].
3.2. The Principle of DOA Estimation for PD Ultrasonic Signals
To compute the covariance matrix for the array-received signal X(t):
where R embodies the covariance matrix of the array’s received signals, RS and RN represent the signal’s covariance matrix and the noise’s covariance matrix, individually. The eigenvalue analysis of the array signal’s covariance matrix R can generate:
In the equation, US embodies the domain of significant signals, UN signifies the noise subspace, and ΣS and ΣN are their corresponding diagonal arrays. Utilizing the inherent characteristics of the signal’s dimensional space, it can be concluded that the signal direction vector A(θ, φ) is orthogonal to the noise subspace UN, i.e.,
Since the dimensionality of the arrayed signal is finite, the likelihood-based optimization for parameter estimation is typically used for the covariance matrix R:
where L is the sampled duration of the arrayed signal, represents the likelihood-optimized estimate of the covariance matrix R, and n represents the acquisition points of the array signal. Utilizing the spectral factorization of , the noise-dominated component is extracted. Given the ubiquitous presence of ambient noise, the signal direction vector A(θ, φ) and the noise subspace are not completely orthogonal. For practical applications, the DOA estimation relies on optimizing a minimization criterion, i.e.,
This is a formula for finding a minimum value, which can be transformed into a problem of finding a maximum value function through an inverse relationship, i.e.,
SDOA, standing for Spatial Spectrum Density of Arrival, is an energetic computation rule. The ultrasonic energy at partial discharge locations significantly exceeds that at non-discharge points, where only reflected and refracted acoustic waves are present When it comes to a single PD source, after the algorithm searches through all spatial spectrum values, it will locate the maximum energy peak [18]. The φ and θ values associated with this peak signify the partial discharge source’s directional information, including azimuth and pitch angles This serves as the foundation for DOA estimation [19]. Regardless of continuous discharge from a single point, the spatial spectrum’s energy extreme point remains fixed, with a single peak indicating the partial discharge source’s direction. In the case of two partial discharge sources, the spatial spectrum function displays two energy peaks. By scanning the directional information of both extreme points, we can obtain the direction information of both partial discharge sources. Figure 7 provides a schematic diagram of the DOA estimation process. Through this method, it is possible to effectively distinguish between the fault types of continuous discharge from a single partial discharge source and simultaneous discharge from two partial discharge sources.

Figure 7.
DOA Estimation Diagram.
4. Experimental Validation and Comprehensive Data Analysis
4.1. Simulation Study on the Impact of Sensor Array Structure on DOA Estimation
In a finite element simulation software, the discharge of dual PD sources in a transformer oil tank is simulated. The dimensions of the transformer oil tank are 180 cm in length, 100 cm in width, and 100 cm in height, filled with No. 25 transformer oil. The tank material is selected as structural steel with a density of 7850 kg/m3, and the propagation speed of ultrasonic waves in structural steel is set to 5100 m/s. The density of transformer oil is set to 890 kg/m3, and the velocity at which ultrasonic waves traverse oil is 1400 m/s [20]. Since the ultrasonic signals mainly propagate in the transformer oil, during the mesh generation, the maximum mesh size is set to one-fifth of the wavelength of the ultrasonic wave in the oil, and the minimum size is set to one-tenth [21].
Based on the generation principle of PD ultrasonic signals, ignoring the oscillation process of a single partial discharge, a single-exponential decay oscillation is adopted to establish a time-domain simulation model for the sound source. The bubble vibration that generates the ultrasonic wave is an underdamped vibration, and its functional model is:
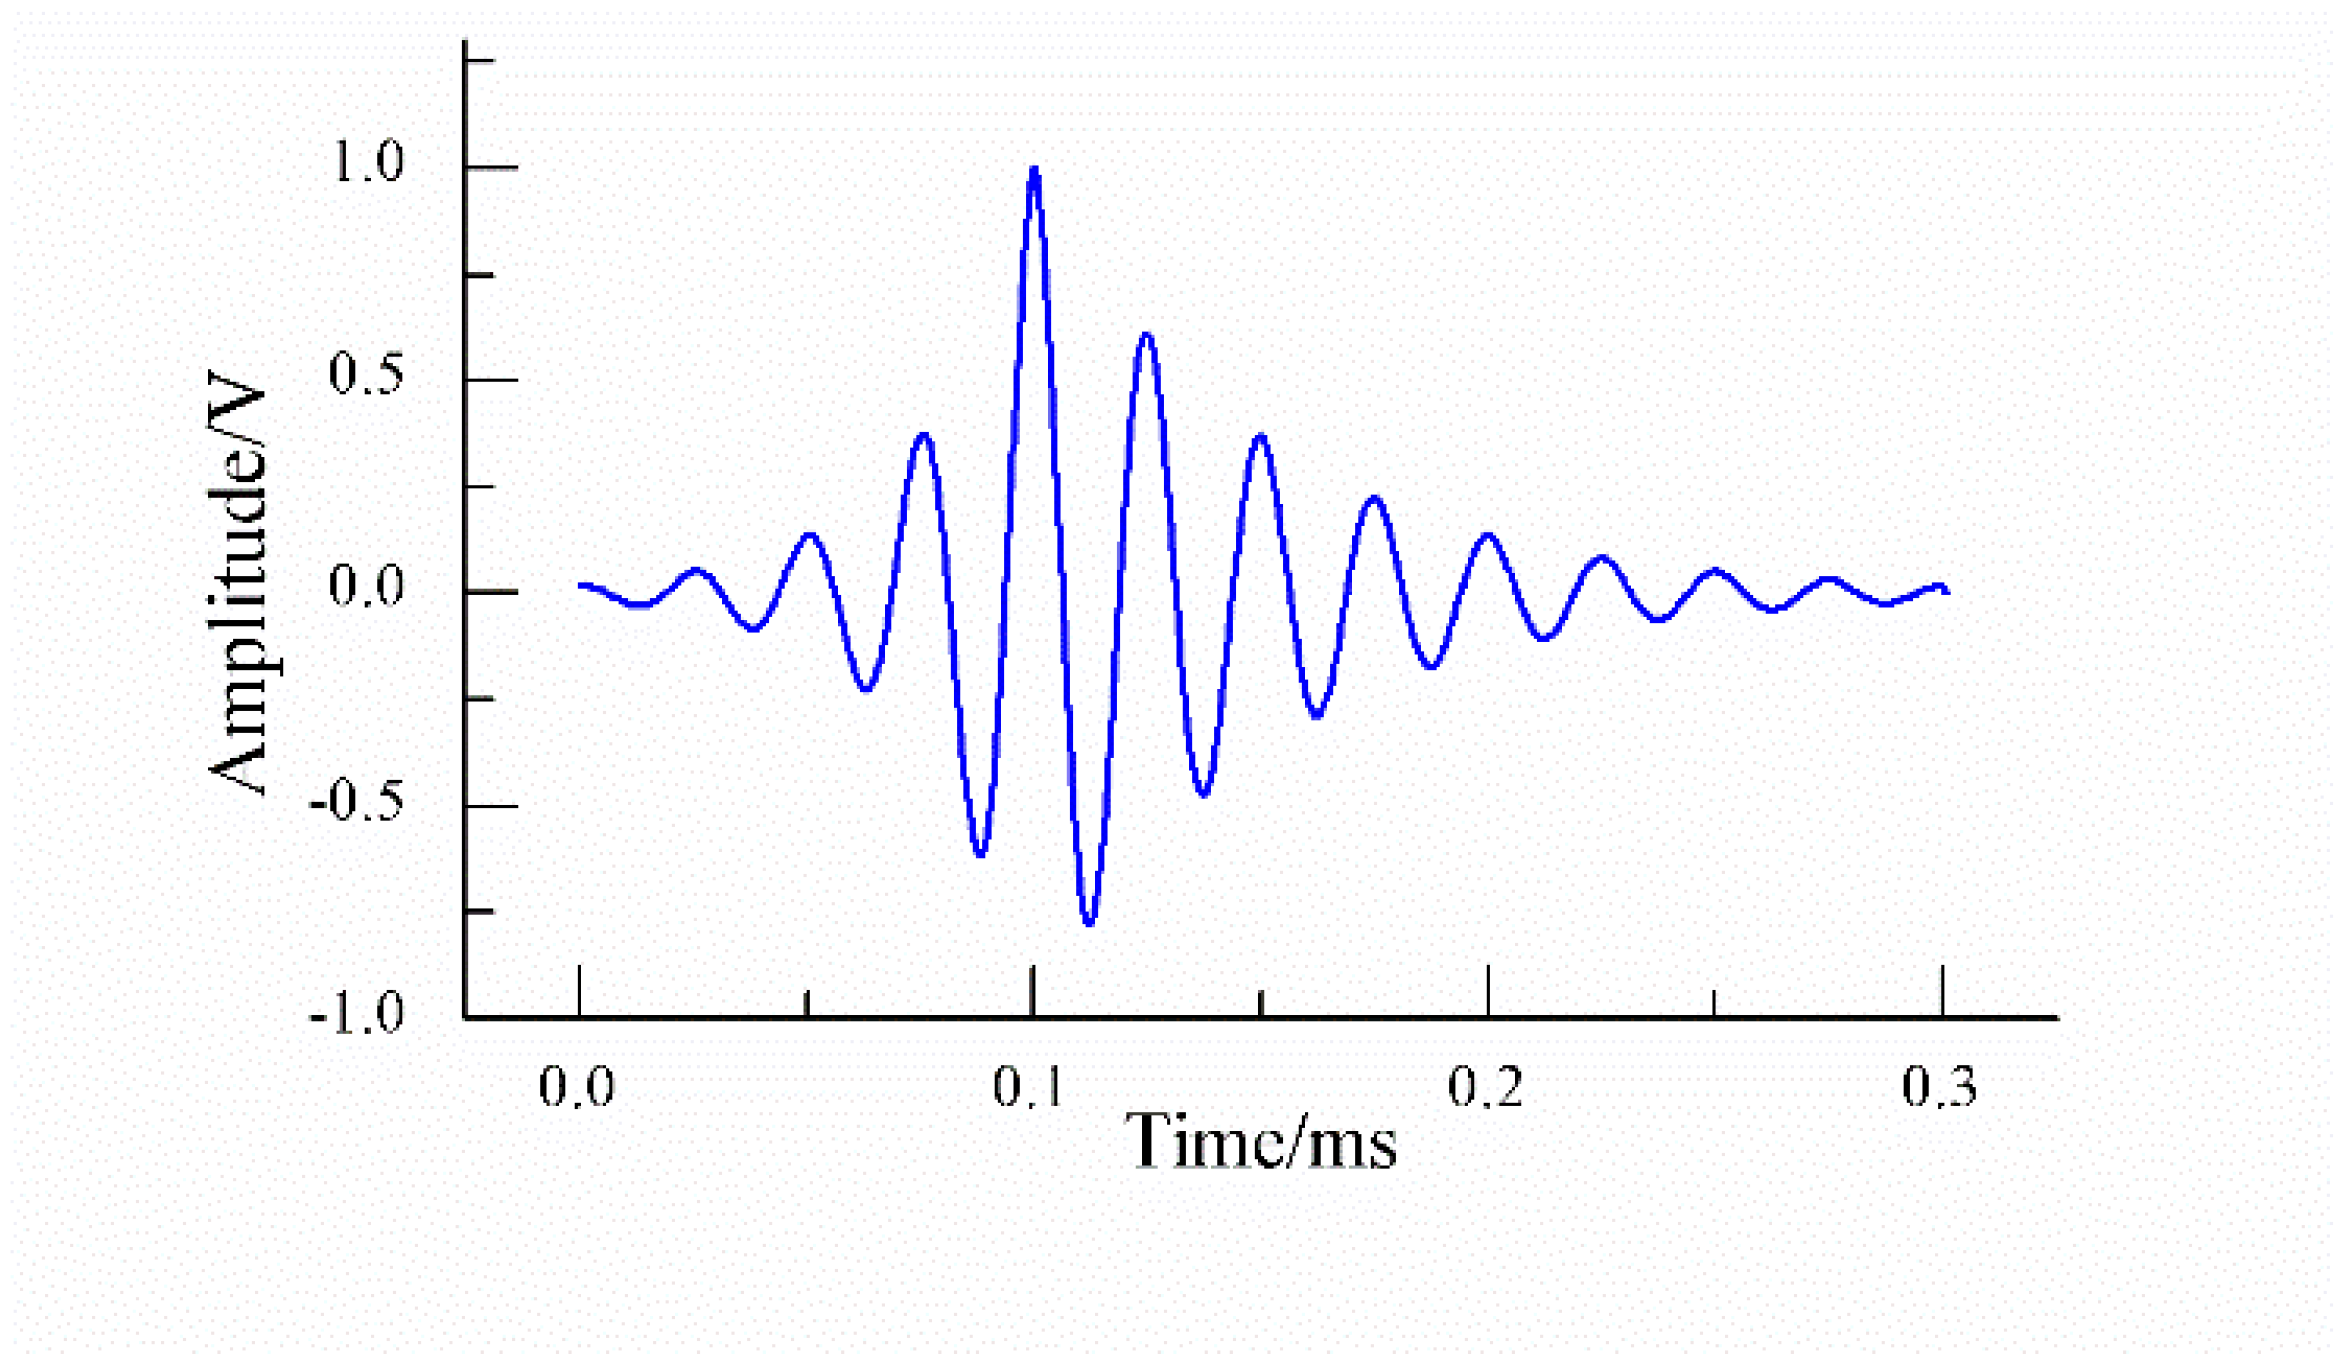
A represents the pulse amplitude of the ultrasonic signal, τ is the decay characteristic time, and f is the frequency of signal fluctuations. Based on previous practical testing experience, this paper selects an ultrasonic function model with an amplitude A of 1 V, a central oscillation frequency f of 30 kHz, and a time constant τ of 1/(36,000). The waveform of the single PD source function is exhibited in Figure 8.
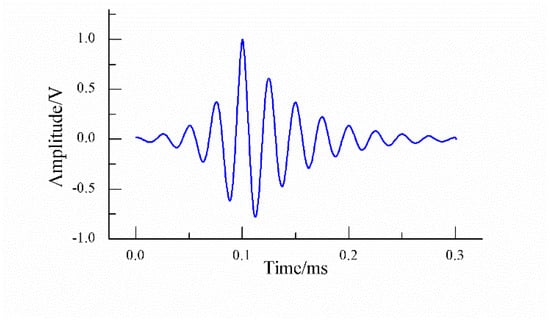
Figure 8.
Simulation waveform of partial discharge.
Two partial discharge points are set inside the oil tank, and the EFPI fiber-optic ultrasonic sensor arrays adopt a square structure and a regular tetrahedron structure respectively, as shown in Figure 9.
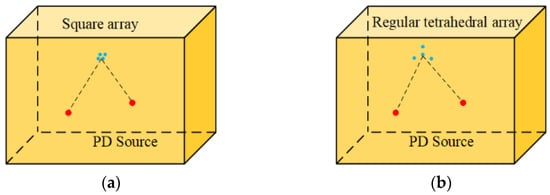
Figure 9.
Directional measurement layout diagrams of different array models (a) Square array; (b) Regular tetrahedral array.
The DOA estimation results are shown in Table 1. Experiment 1 represents the direction-finding results of the square array for the dual partial discharge sources, while Experiment 2 represents the direction-finding results of the regular tetrahedral array. As can be seen from the direction-finding angle errors, the regular tetrahedral array is slightly better than the square array. This is because the four sensors of the regular tetrahedral array are more evenly distributed in space, and the signal-receiving area is larger than the square array, resulting in a more balanced coverage area. This uniformity helps reduce the direction-finding error caused by uneven sensor layout. Additionally, due to the differences in relative positions and angles between the sensors in the regular tetrahedral array, the array can more precisely distinguish signals from different directions, leading to higher angular resolution and improved direction-finding accuracy [22].

Table 1.
Simulation results of DOA estimation for square array and regular tetrahedral array.
After determining the spatial structure of the sensor array through simulation experiments, the next step will be to further investigate the actual effectiveness of the detection system in determining the direction of dual PD sources in transformer oil.
4.2. Simultaneous Discharge Directional Measurement Experiment of Dual PD Sources
Based on the simulation analysis results from the previous section, an EFPI sensor array with a regular tetrahedral structure was fabricated. Combining with the existing conditions in the laboratory, a directional measurement study was conducted on the simultaneous discharge of dual PD sources within a transformer oil tank. The experimental equipment included an oil tank filled with No. 25 insulating oil, with a length dimension of 200 cm, a width of 100 cm, and a height of 150 cm, an EFPI fiber-optic ultrasonic sensor array, a Marx high-voltage generator, and needle-plate electrodes that generate partial discharges. According to past experience, when the Marx generator produces a high-voltage pulse of 20 kV, it can cause two series-connected needle-plate electrodes to simultaneously break down and discharge. The experimental setup is shown in Figure 10.
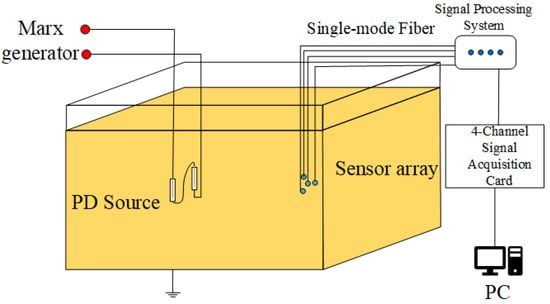
Figure 10.
Test setup of direction finding experiment for dual PD sources.
Taking the lower left corner of the oil tank as the origin of the coordinate system, a spatial Cartesian coordinate system was established. During the initial experiment, the two partial discharge sources were positioned at (14 cm, 11 cm, 17 cm) and (25 cm, 20 cm, 30 cm), with spatial angles of (27.8°, 46.3°) and (38.7°, 46.9°), respectively. After the two partial discharge sources discharged simultaneously, the sensor array captured the signals. Through the DOA estimation of the ultrasonic signals, the estimated spatial angles were (32.6°, 43.5°) and (33.5°, 42.5°), with angle errors of 5.6° and 6.8°, respectively. Subsequently, after completing the initial experiment, the dual partial discharge sources were repositioned at three varying locations within the oil tank, with the objective of assessing the consistency of DOA estimation across these placements. The experimental results are shown in Table 2 (Data Groups 2–4). As can be seen from the data in the table, the partial discharge source monitoring apparatus based on the EFPI fiber-optic ultrasonic sensor array proposed in this paper has high accuracy, with a maximum angle error of 10°. Considering that only four sensor elements were used in the experiment, if more sensors are used to form a larger array with a larger receiving area, the direction-finding accuracy will be further improved.
Table 2.
Experimental results of DOA for dual partial discharge sources in transformer oil.
4.3. Directional Measurement Experiment of Continuous Discharge from a Single PD Source
After verifying the effectiveness of the PD monitoring apparatus in identifying the discharge types from dual PD sources, we further conducted an experiment for continuous discharge detection using a single PD source: a discharge tube was connected to a Marx generator. By controlling the switch on the low voltage terminal of the Marx generator, and through multiple experimental trials and summing up experience, we achieved continuous double discharges in the oil by observing the flash and listening to the sound of the discharge tube. The arrangement of the experiment is illustrated in Figure 11. Similar to the experiment with dual partial discharge sources, four different locations were also selected to verify the overall stability of the EFPI fiber-optic ultrasonic array sensor in direction finding.
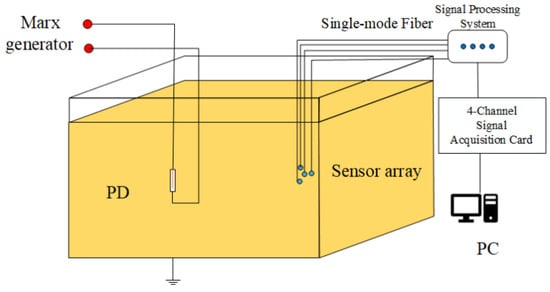
Figure 11.
Test setup of direction finding experiment for continuous discharge of single PD source.
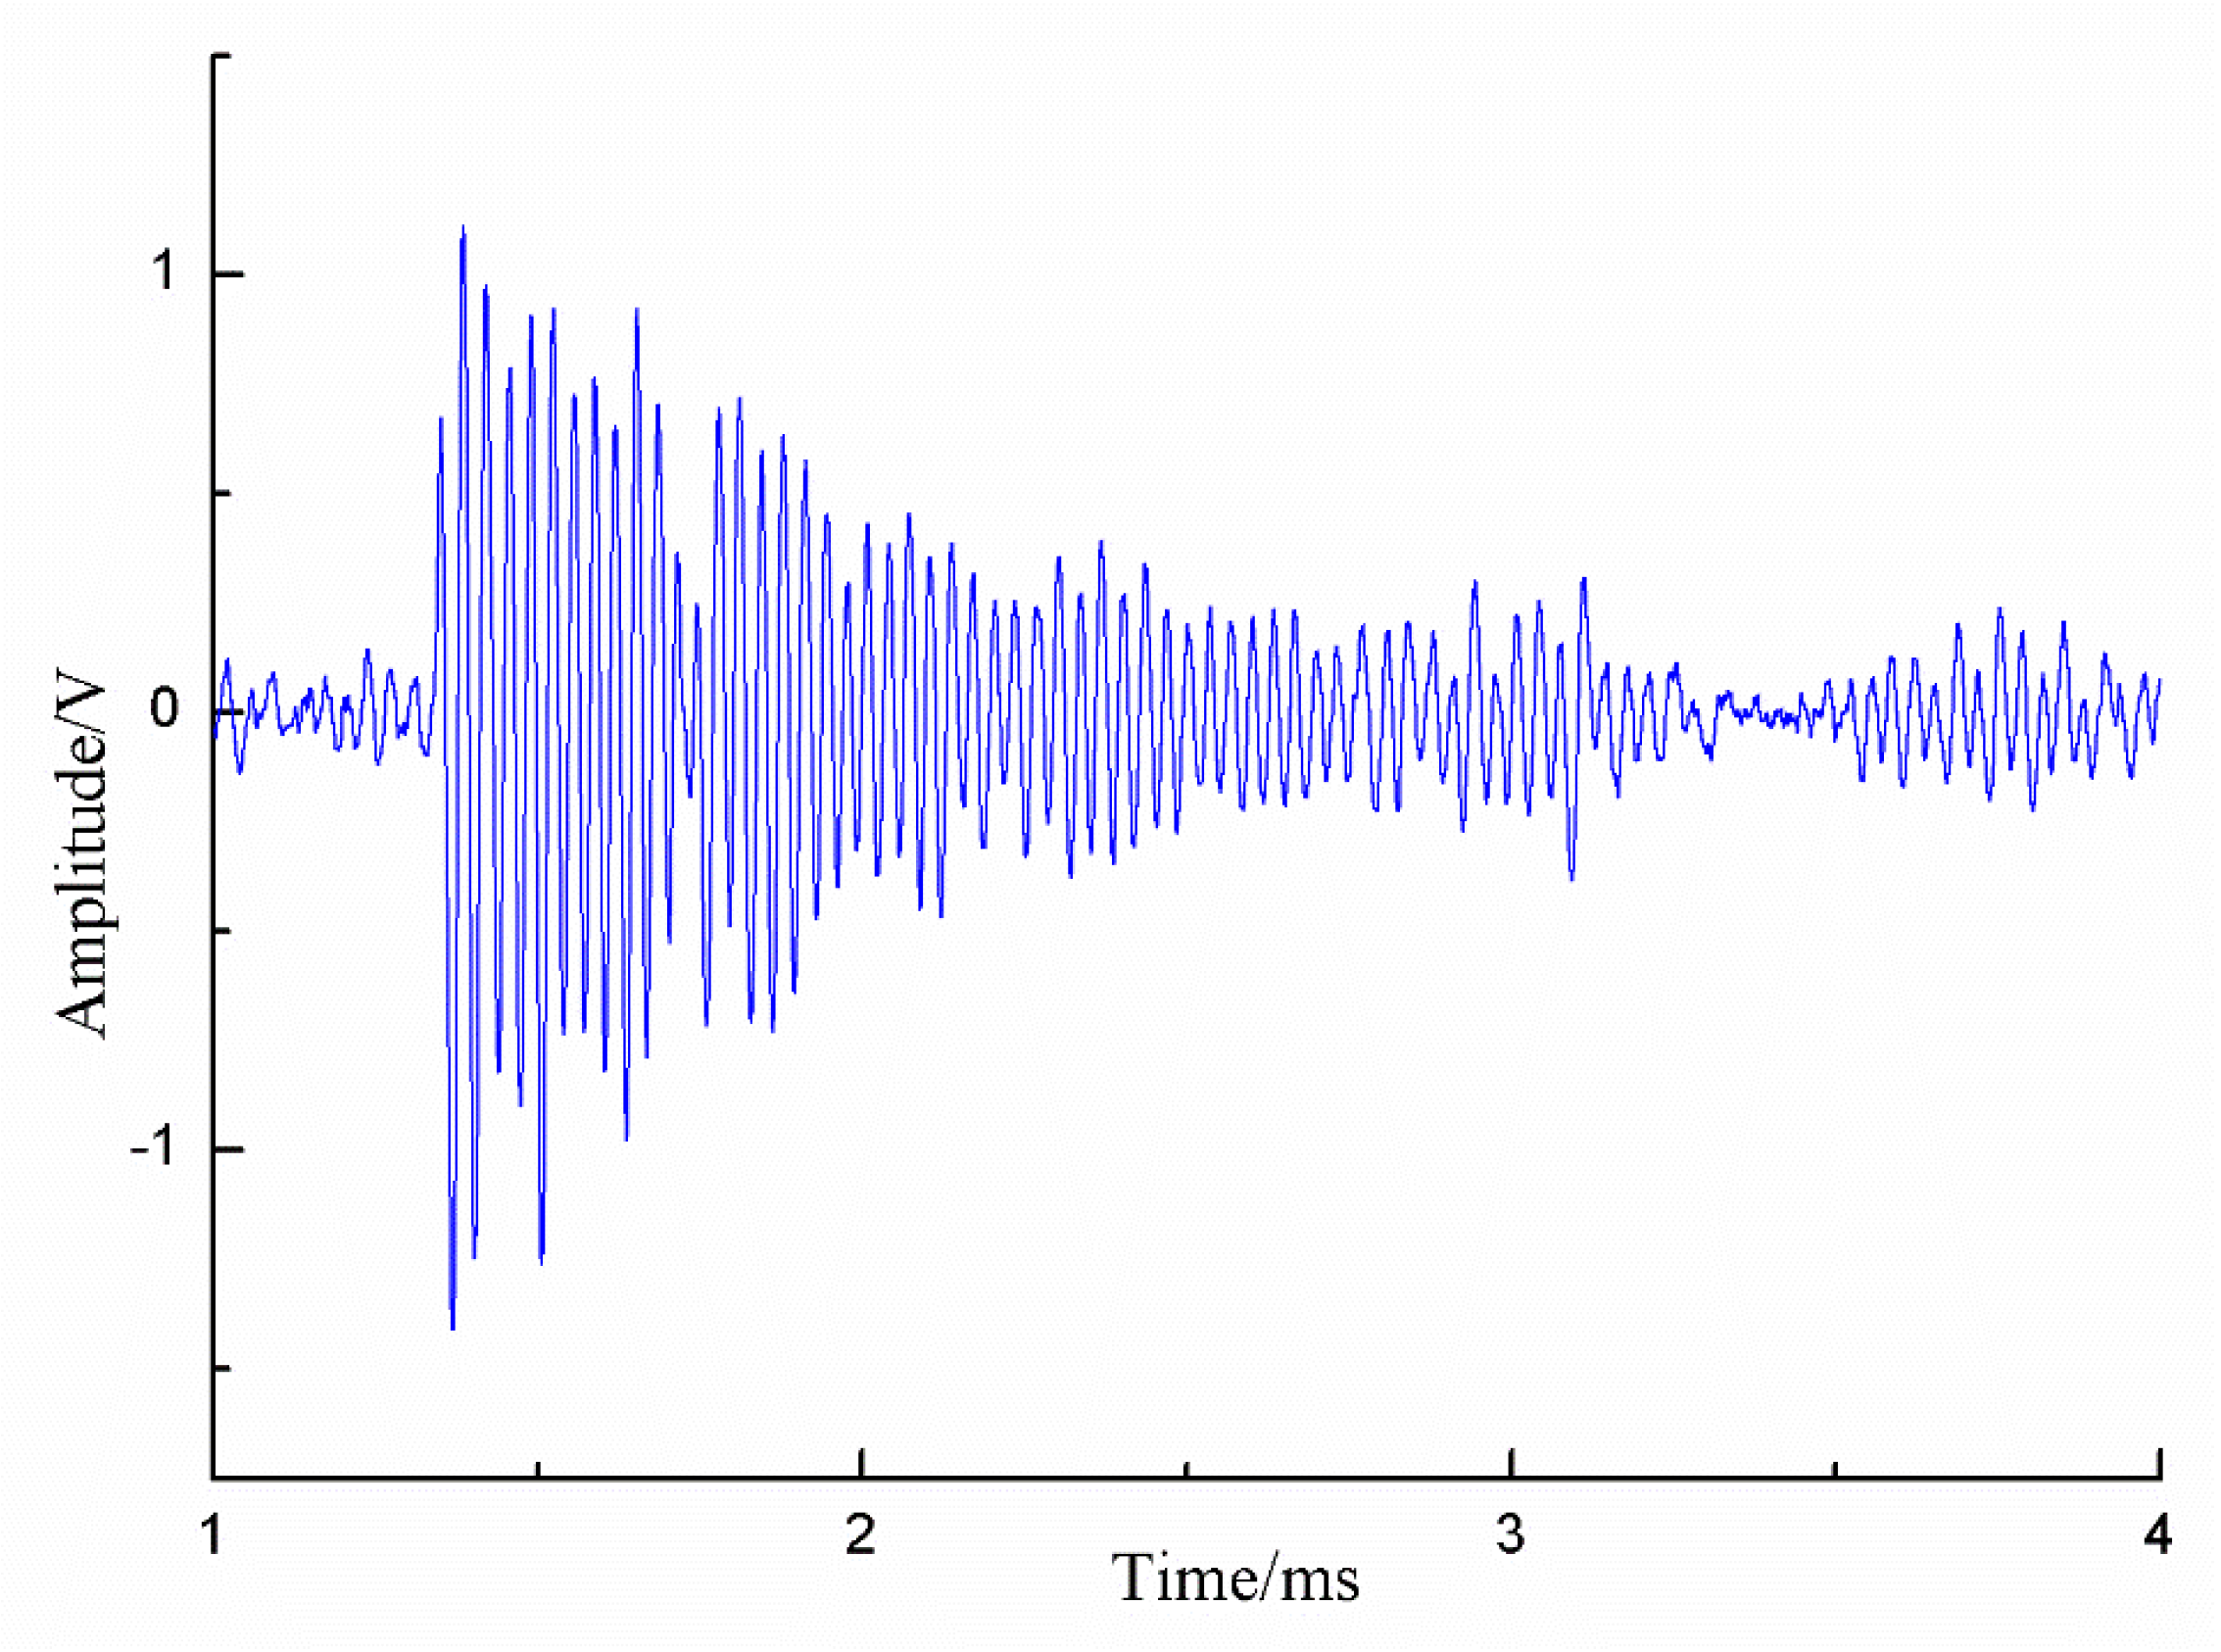
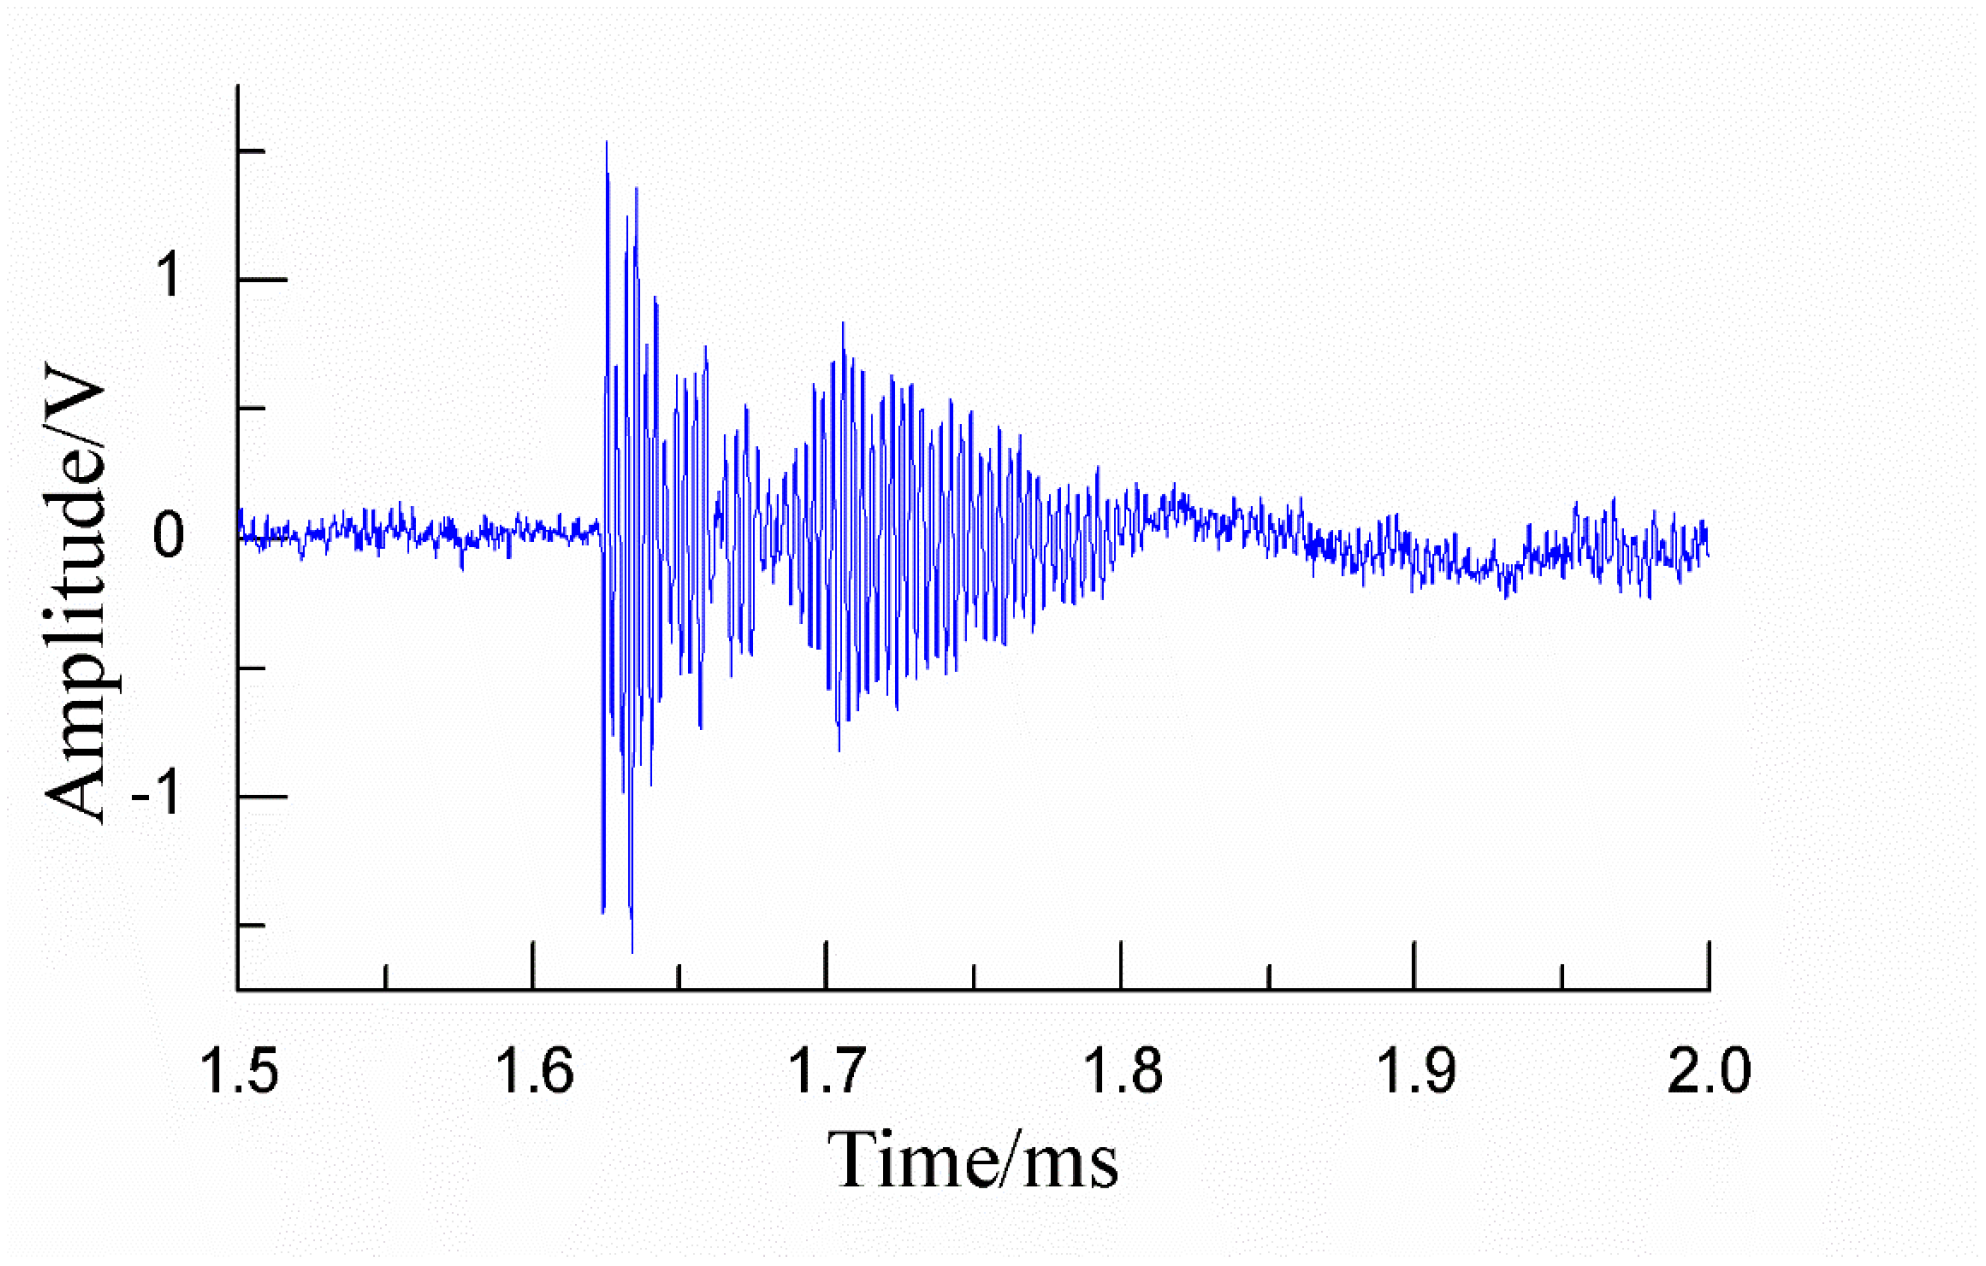
The sensor’s captured waveform is illustrated in Figure 12. Evidently, the EFPI fiber-optic ultrasonic sensor has high detection sensitivity, and there is no significant overlapping region between the two waveforms before and after the continuous discharge from a single partial discharge source. The second waveform is affected by the first discharge waveform, resulting in a mixed echo region. However, it is still possible to identify the continuous discharge from a single point by simply examining the detected waveforms. The results of continuous discharge of single PD source direction finding test are shown in Table 3.

Figure 12.
The Signal of two consecutive discharges from a single PD source captured by sensor.
Table 3.
Experimental results of DOA for continuous discharge of single PD Source.
Upon reviewing the experimental data, it is evident that for the discharge source at the same location, the DOA angles are similar. This is due to the fact that the sensor array used in the experiment was manually assembled, and due to the limitations of laboratory conditions, there may be certain errors. In addition, when estimating the DOA by searching for the extreme value point in the spatial spectrum, there may also be cases where the peak is flat, which can lead to certain errors. Overall, for the continuous discharge type from a single point, the first and second extreme values of the search spatial spectrum have similar DOA estimation results, close to the same direction. Based on this feature, it is possible to distinguish between the dual PD source discharge and the continuous discharge type from a single partial discharge source occurring inside electrical equipment.
5. Conclusions
This paper designs an EFPI fiber-optic sensor array with a regular tetrahedron structure and develops a partial discharge detection system capable of distinguishing between single and dual partial discharge sources inside transformers. Compared with traditional piezoelectric transducers, the EFPI fiber-optic ultrasonic sensor has a compact structure, high insulation level, and strong resistance to electromagnetic interference in the field. It can be flexibly arranged inside power transformers, thus having higher sensitivity and detection accuracy. The array can capture simultaneous discharge phenomena from dual partial discharge sources, which is a discharge type difficult to detect with traditional piezoelectric transducers. Combining the DOA estimation results, the system can accurately distinguish between single and dual partial discharge sources, meeting the needs of engineering applications. This detection system allows equipment maintenance personnel to arrange precise maintenance plans, avoiding potential safety hazards caused by missed inspections and repairs. Power equipment manufacturers can also utilize this maintenance information to optimize product design. In summary, the detection system and discharge type identification method proposed in this paper provide a novel approach for online monitoring of PD activity in transformer systems, especially for the effective identification of simultaneous discharge faults from dual partial discharge sources that are difficult to detect inside transformers. This method offers a new solution for detecting partial discharge types under complex conditions.
Author Contributions
Conceptualization, W.W.; methodology, W.W. and F.L.; validation, F.L., Y.S. and S.Z.; data curation, Y.S. and S.Z.; writing—original draft preparation, F.L.; writing—review and editing, W.W. and F.L.; funding acquisition, W.W. All authors have read and agreed to the published version of the manuscript.
Funding
This research was funded by National Natural Science Foundation of China, grant number 51577063.
Institutional Review Board Statement
Not applicable.
Data Availability Statement
The data that support the findings of this study are available from the corresponding author upon reasonable request.
Conflicts of Interest
The authors declare no conflicts of interest.
References
- Monzón-Verona, J.M.; González-Domínguez, P.; García-Alonso, S. Characterization of Partial Discharges in Dielectric Oils Using High-Resolution CMOS Image Sensor and Convolutional Neural Networks. Sensors 2024, 24, 1317. [Google Scholar] [CrossRef] [PubMed]
- Raymond, W.J.K.; Illias, H.A.; Abu Bakar, A.H.; Mokhlis, H. Partial discharge classifications: Review of recent progress. Measurement 2015, 68, 164–181. [Google Scholar] [CrossRef]
- Jia, J.; Dou, X.; Yang, J.; Zhao, H.; Wang, B. Multi-Source Partial Discharge Signal Separation and recognition Method Based on manifold Learning in Oil-pressboard Insulation System. In Proceedings of the IEEE 4th Conference on Energy Internet and Energy System Integration (EI2), Wuhan, China, 30 October–1 November 2020; pp. 890–895. [Google Scholar]
- Yan, X.; Bai, Y.; Zhang, W.; Cheng, C.; Liu, J. Partial Discharge Pattern-Recognition Method Based on Embedded Artificial Intelligence. Appl. Sci. 2023, 13, 10370. [Google Scholar] [CrossRef]
- Liu, F.; Shi, Y.; Zhang, S.; Wang, W. Localization for Dual Partial Discharge Sources in Transformer Oil Using Pressure-Balanced Fiber-Optic Ultrasonic Sensor Array. Sensors 2024, 24, 4450. [Google Scholar] [CrossRef] [PubMed]
- Zheng, S.; Rao, W.; Cai, X.; Wu, M.; Xie, T.; Wang, H.; Fu, H. Temperature-Insensitive Fiber-Optic Refractive Index Sensing System With High Sensitivity by Using EFPI-Based Microwave Photonic Filter. IEEE Sens. J. 2024, 24, 2799–2806. [Google Scholar] [CrossRef]
- Han, X.; Zhang, X. Enhanced Coprime Array Structure and DOA Estimation Algorithm for Coherent Sources. Sensors 2024, 24, 260. [Google Scholar] [CrossRef] [PubMed]
- Zuo, Q.; Wang, Y.; Li, D.; Chen, S.; Guo, Y.; Qiao, H.; Wang, H.; Tu, R.; Tu, X.; Luo, W. Stability-enhanced low-frequency fiber optic hydrophone based on an extrinsic Fabry-Perot interferometer. Opt. Express 2024, 32, 13408–13418. [Google Scholar] [CrossRef] [PubMed]
- Yang, S.; Wang, H.; Meng, L.; Chen, Y.; Dong, B.; Yuan, T.; Zhang, X.; Yuan, L. Dual-FBG and F-P Cavity Compound Optical Fiber Sensor for Simultaneous Measurement of Bending. Temp. Strain J. Light. Technol. 2023, 41, 1582–1588. [Google Scholar] [CrossRef]
- Zhang, F.; Zhao, N.; Lin, Q.; Wu, Z.; Tian, B.; Shi, P.; Yang, P.; Jiang, Z. The influence of key characteristic parameters on performance of optical fiber Fabry–Perot temperature sensor. AIP Adv. 2020, 10, 085118. [Google Scholar] [CrossRef]
- Xiong, W.; Shu, Q.; Lu, P.; Zhang, W.; Qu, Z.; Liu, D.; Zhang, J. Sensitivity enhanced fiber optic hydrophone based on an extrinsic Fabry-Perot interferometer for low-frequency underwater acoustic sensing. Opt. Express 2022, 30, 9307–9320. [Google Scholar] [CrossRef] [PubMed]
- Wang, L.; Zhou, R.; Li, M.; Li, M.-Y.; Wen, X.; Lu, H. Asymmetric reflection spectrum of Fabry-Perot interferometer and the application in pressure sensing. J. Light. Technol. 2022, 40, 4011–4019. [Google Scholar] [CrossRef]
- Qiao, J.; Zhang, W.; Wang, Y.; Zhao, H. Improved demodulation method for fiber optic sensors applied in transformer partial discharge detection. High Volt. 2023, 8, 445–454. [Google Scholar] [CrossRef]
- Zhao, Y.; Wang, D.; Lv, R. A Novel Optical Fiber Temperature Sensor Based on Fabry-Perot Cavity. Microw. Opt. Technol. Lett. 2013, 55, 2487–2490. [Google Scholar] [CrossRef]
- Listewnik, P.; Bechelany, M.; Szczerska, M. Microsphere structure application for supercapacitor in situ temperature monitoring. Smart Mater. Struct. 2021, 30, 10LT01. [Google Scholar] [CrossRef]
- Qian, G.; Chen, W.; Wu, K.; Liu, H.; Wang, J.; Zhang, Z. Research on Transformer Omnidirectional Partial Discharge Ultrasound Sensing Method Combining F-P Cavity and FBG. Sensors 2023, 23, 9642. [Google Scholar] [CrossRef] [PubMed]
- Dai, X.; Zhang, X.; Wang, Y. Extended DOA-Matrix Method for DOA Estimation via Two Parallel Linear Arrays. IEEE Commun. Lett. 2019, 23, 1981–1984. [Google Scholar] [CrossRef]
- Tan, Z.; Eldar, Y.C.; Nehorai, A. Direction of Arrival Estimation Using Co-Prime Arrays: A Super Resolution Viewpoint. IEEE Trans. Signal Process. 2014, 62, 5565–5576. [Google Scholar] [CrossRef]
- Merkofer, J.P.; Revach, G.; Shlezinger, N.; Routtenberg, T.; van Sloun, R.J.G. DA-MUSIC: Data-Driven DoA Estimation via Deep Augmented MUSIC Algorithm. IEEE Trans. Veh. Technol. 2024, 73, 2771–2785. [Google Scholar] [CrossRef]
- Gao, S.; Wang, C.; Li, F. Online Monitoring and Fault Diagnosis of Power Equipment, 1st ed.; Tsinghua University Press: Beijing, China, 2018; p. 172. [Google Scholar]
- Guo, J.; Campbell, T.; Boggs, S.A. Partial-Discharge Magnitude Estimation With Three-Dimensional Finite-Element Methods. IEEE Trans. Power Deliv. 2012, 27, 491–496. [Google Scholar] [CrossRef]
- Saravanakumar, N.; Sathiyasekar, K. Circular Array of Ultrasonic Sensor based DOA estimation: Location of multiple Partial Discharge in Transformer oil. J. Electromagn. Waves Appl. 2018, 32, 1569–1585. [Google Scholar] [CrossRef]


Disclaimer/Publisher’s Note: The statements, opinions and data contained in all publications are solely those of the individual author(s) and contributor(s) and not of MDPI and/or the editor(s). MDPI and/or the editor(s) disclaim responsibility for any injury to people or property resulting from any ideas, methods, instructions or products referred to in the content. |
© 2024 by the authors. Licensee MDPI, Basel, Switzerland. This article is an open access article distributed under the terms and conditions of the Creative Commons Attribution (CC BY) license (https://creativecommons.org/licenses/by/4.0/).