Article

Research on Reflective High-Speed Multi-Point Confocal Microscopy System

1
Ningbo Innovation Center, Zhejiang University, Ningbo 315100, China
2
College of Optical Science and Engineering, Zhejiang University, Hangzhou 310027, China
3
Ningbo Yongxin Optics Co., Ltd., Ningbo 315048, China
*
Authors to whom correspondence should be addressed.
Photonics 2025, 12(1), 22; https://doi.org/10.3390/photonics12010022
Submission received: 22 November 2024 / Revised: 17 December 2024 / Accepted: 26 December 2024 / Published: 30 December 2024

Abstract

:
Reflective confocal imaging systems often face challenges in achieving high resolution, imaging speed, and uniformity, particularly for reflective sample imaging. This study introduces a reflective multi-point confocal imaging system designed to improve imaging speed, expand the field of view, and optimize performance for reflective sample imaging using incoherent, telecentric light-emitting diode (LED) illumination. By integrating uniform illumination with microlens arrays and optimizing instantaneous structured illumination microscopy optical components, the system achieves a resolution of 1116 lp/mm (20×, 0.42), 100 fps imaging, and a 500 µm × 500 µm field of view while improving contrast. A comparative analysis of laser- and LED-based scanning demonstrates that incoherent illumination provides superior uniformity and reduces intensity variance in reflective imaging. Validation through photon-reassignment experiments, resolution target imaging, and 100 nm metal particle visualization confirmed the system’s enhanced resolution. Furthermore, ex vivo corneal imaging revealed cellular-level details, suggesting its potential for noncontact corneal diagnostics.

1. Introduction

Confocal microscopy [1] has been widely applied in microscopic imaging since its development in the 1950s. Its advantages, including a high signal-to-noise ratio [2], high resolution [3], low phototoxicity [4,5], and relatively simple system architecture, make it an essential tool in life sciences, materials science, and related fields.
Based on the interaction between light and tissue, confocal microscopy can be categorized into reflective confocal microscopy (RCM) [6] and fluorescence confocal microscopy. Fluorescence confocal microscopy uses lasers of different wavelengths to excite spontaneous fluorescence within cells and employs detectors to capture fluorescent signals [7,8,9], enabling sample imaging. By contrast, RCM utilizes reflected light for imaging, enabling high-resolution observation of opaque and reflective samples with minimal aberration.
Reflective confocal microscopy demonstrates significant potential for visualizing complex structures within reflective or partially transparent biological samples [10], such as calcified tissues, corneal layers [11,12], and engineered biomaterials. Advances in near-infrared reflection imaging have extended its application to live biological samples, reduced phototoxicity, and enabled noninvasive analysis. Similarly, label-free imaging techniques play a critical role in studying living cell dynamics. Techniques such as interferometric scattering microscopy (iSCAT) [13,14,15], which leverages the interference of scattered light, provide high-contrast imaging of cell surfaces and small structures. However, iSCAT’s use is often limited by the need for longer acquisition times and higher sensitivity to experimental noise. Another technique, rotating coherent scattering (ROCS) microscopy [16,17,18], combines coherent light scattering with total internal reflection to achieve super-resolution imaging through rotating laser illumination. However, despite its capabilities, its real-time dynamic imaging potential is restricted by the complexity of data processing. In contrast, RCM integrates high-speed imaging with excellent resolution and contrast, offering a robust label-free alternative for real-time studies of living cells. Additionally, RCM is invaluable in metrology for measuring nanoscale surface roughness, microstructure, and layer thickness, making it crucial for semiconductor manufacturing, optical quality control, and precision engineering.
Common confocal imaging techniques include single-point scanning, line scanning [19,20], and multi-point scanning. Multi-point scanning confocal microscopy offers significant advantages in resolution and imaging speed. This technique adjusts the illumination beam into a specific array distribution using miniaturized devices while incorporating the corresponding array structure of the signal-receiving sensors.
The multi-point scanning confocal microscope, based on the Nipkow disk and proposed by Petráň et al. [21], utilizes a Nipkow disk with pinhole apertures arranged in an Archimedean spiral to cover the entire scanning area. The laser light source scanned various regions of the sample by rotating the disk, enabling comprehensive imaging of the sample. This approach significantly enhances imaging speed and reduces phototoxicity, making it suitable for long-term imaging of live cells. York et al. introduced a multi-point illumination method for microscopy (MSIM) based on digital micromirror devices (DMD) [22]. In this approach, the DMD generates a sparse point array with varying positions, capturing images from different locations. By combining digital pinholes and photon reassignment technology, they achieved an imaging speed of one 2D image per second with a lateral resolution of 145 nm and an axial resolution of 400 nm. York et al. further developed an instantaneous structured illumination microscopy (iSIM) system [23] using a microlens array (MLA) to generate multi-point illumination. They incorporated micropore and photon reassignment MLAs in the detection path, achieving imaging speeds of up to 100 fps and enabling real-time super-resolution imaging. Curd et al. improved both the hardware and software of the iSIM system [24], achieving a lateral resolution of 145 nm and an axial resolution of 320 nm at a magnification of 1.49 numerical aperture (NA) and an excitation wavelength of 488 nm, enabling the rapid acquisition of fluorescence images at speeds exceeding 100 fps. Mahecic et al. proposed the multi-focus wide-field illumination imaging (mfFIFI) scheme [25], which further extended the effective field of view of iSIM to over 100 × 100 µm2, enabling super-resolution imaging of dozens of live cells through image stitching. As multi-point confocal technology continues to evolve, various photon reorganization techniques have emerged. For instance, the digital pinhole processing method [22], combined with a DMD, identifies effective information lattices within an image while reducing the size of light spots on these lattices. Similarly, the iSIM technique [23] enhances resolution by optimizing the configuration of illumination and photon reorganization microlens arrays. Additionally, pixel reorganization techniques [26] based on detector arrays offer innovative solutions for improving resolution and concentrating light energy.
Despite significant advances in multi-point confocal microscopy, including improvements in resolution, imaging speed, and field-of-view expansion, the system architecture has become increasingly complex with the addition of functionalities. Most applications have focused primarily on laser illumination and fluorescence sample imaging. Therefore, this study presents a reflection confocal microscopy (RCM) system based on incoherent multi-point illumination with a fully telecentric optical structure.

2. Materials and Methods

2.1. Principle

The system utilizes an incoherent telecentric light-emitting diode (LED) light source for uniform illumination, achieving consistent dot-array illumination over a large field of view and effectively mitigating light intensity variation caused by laser speckles. By integrating this LED module into the improved iSIM system and replacing the MLA used for dot-array illumination with a pinhole array, the system produces a more optimal dot-array light source shape in the reflection-based imaging mode. Furthermore, the hardware parameters are optimized without compromising system performance, while reducing the overall system size.
The proposed optical path design employs a fully telecentric configuration, where every optical element between any two real image planes forms a bi-telecentric system. Compared with conventional imaging systems, telecentric optical paths offer more stable magnification and superior tolerance to alignment errors. As shown in Figure 1a, traditional optical systems exhibit “near-large and far-small” imaging characteristics. For example, the object points A, B, and C are imaged as A’, B’, and C’ on the image plane at varying magnifications. This variation leads to a defocus at cross section B’, where A and C generate larger blur spots relative to B. Additionally, chief rays intersecting the cross section are spatially misaligned, resulting in sequential distribution from top to bottom, which compromises measurement accuracy. By contrast, the bi-telecentric system shown in Figure 1b resolves these issues. In a bi-telecentric configuration, the positions of the chief rays remain constant with changes in the object position. At cross-section B’, the centers of the blur spots for A,’ B’, and C’ coincide. Consequently, even under defocused conditions, size measurements of the objects remain unaffected. This design is particularly crucial for systems where deviations in the object-to-optical-system distance occur, significantly enhancing tolerance to distance errors and ensuring consistent image-plane dimensions. The system integrates multiple telecentric 4f relays to achieve a fully telecentric optical path, as shown in Figure 1c. Object point B is first relayed to an intermediate image plane B’ through a telecentric 4f system and subsequently relayed to the final image plane B’‘ via additional telecentric 4f relays. Even when distance errors exist between the 4f systems (e.g., the intermediate image plane B’ shifts along the direction indicated by the red arrow), the bi-telecentric property prevents changes in the chief ray angle. This feature significantly reduces alignment complexity while maintaining high imaging precision. Overall, the proposed optical path design successfully implemented a fully telecentric optical system, enhancing measurement accuracy and tolerance to installation and operational errors.
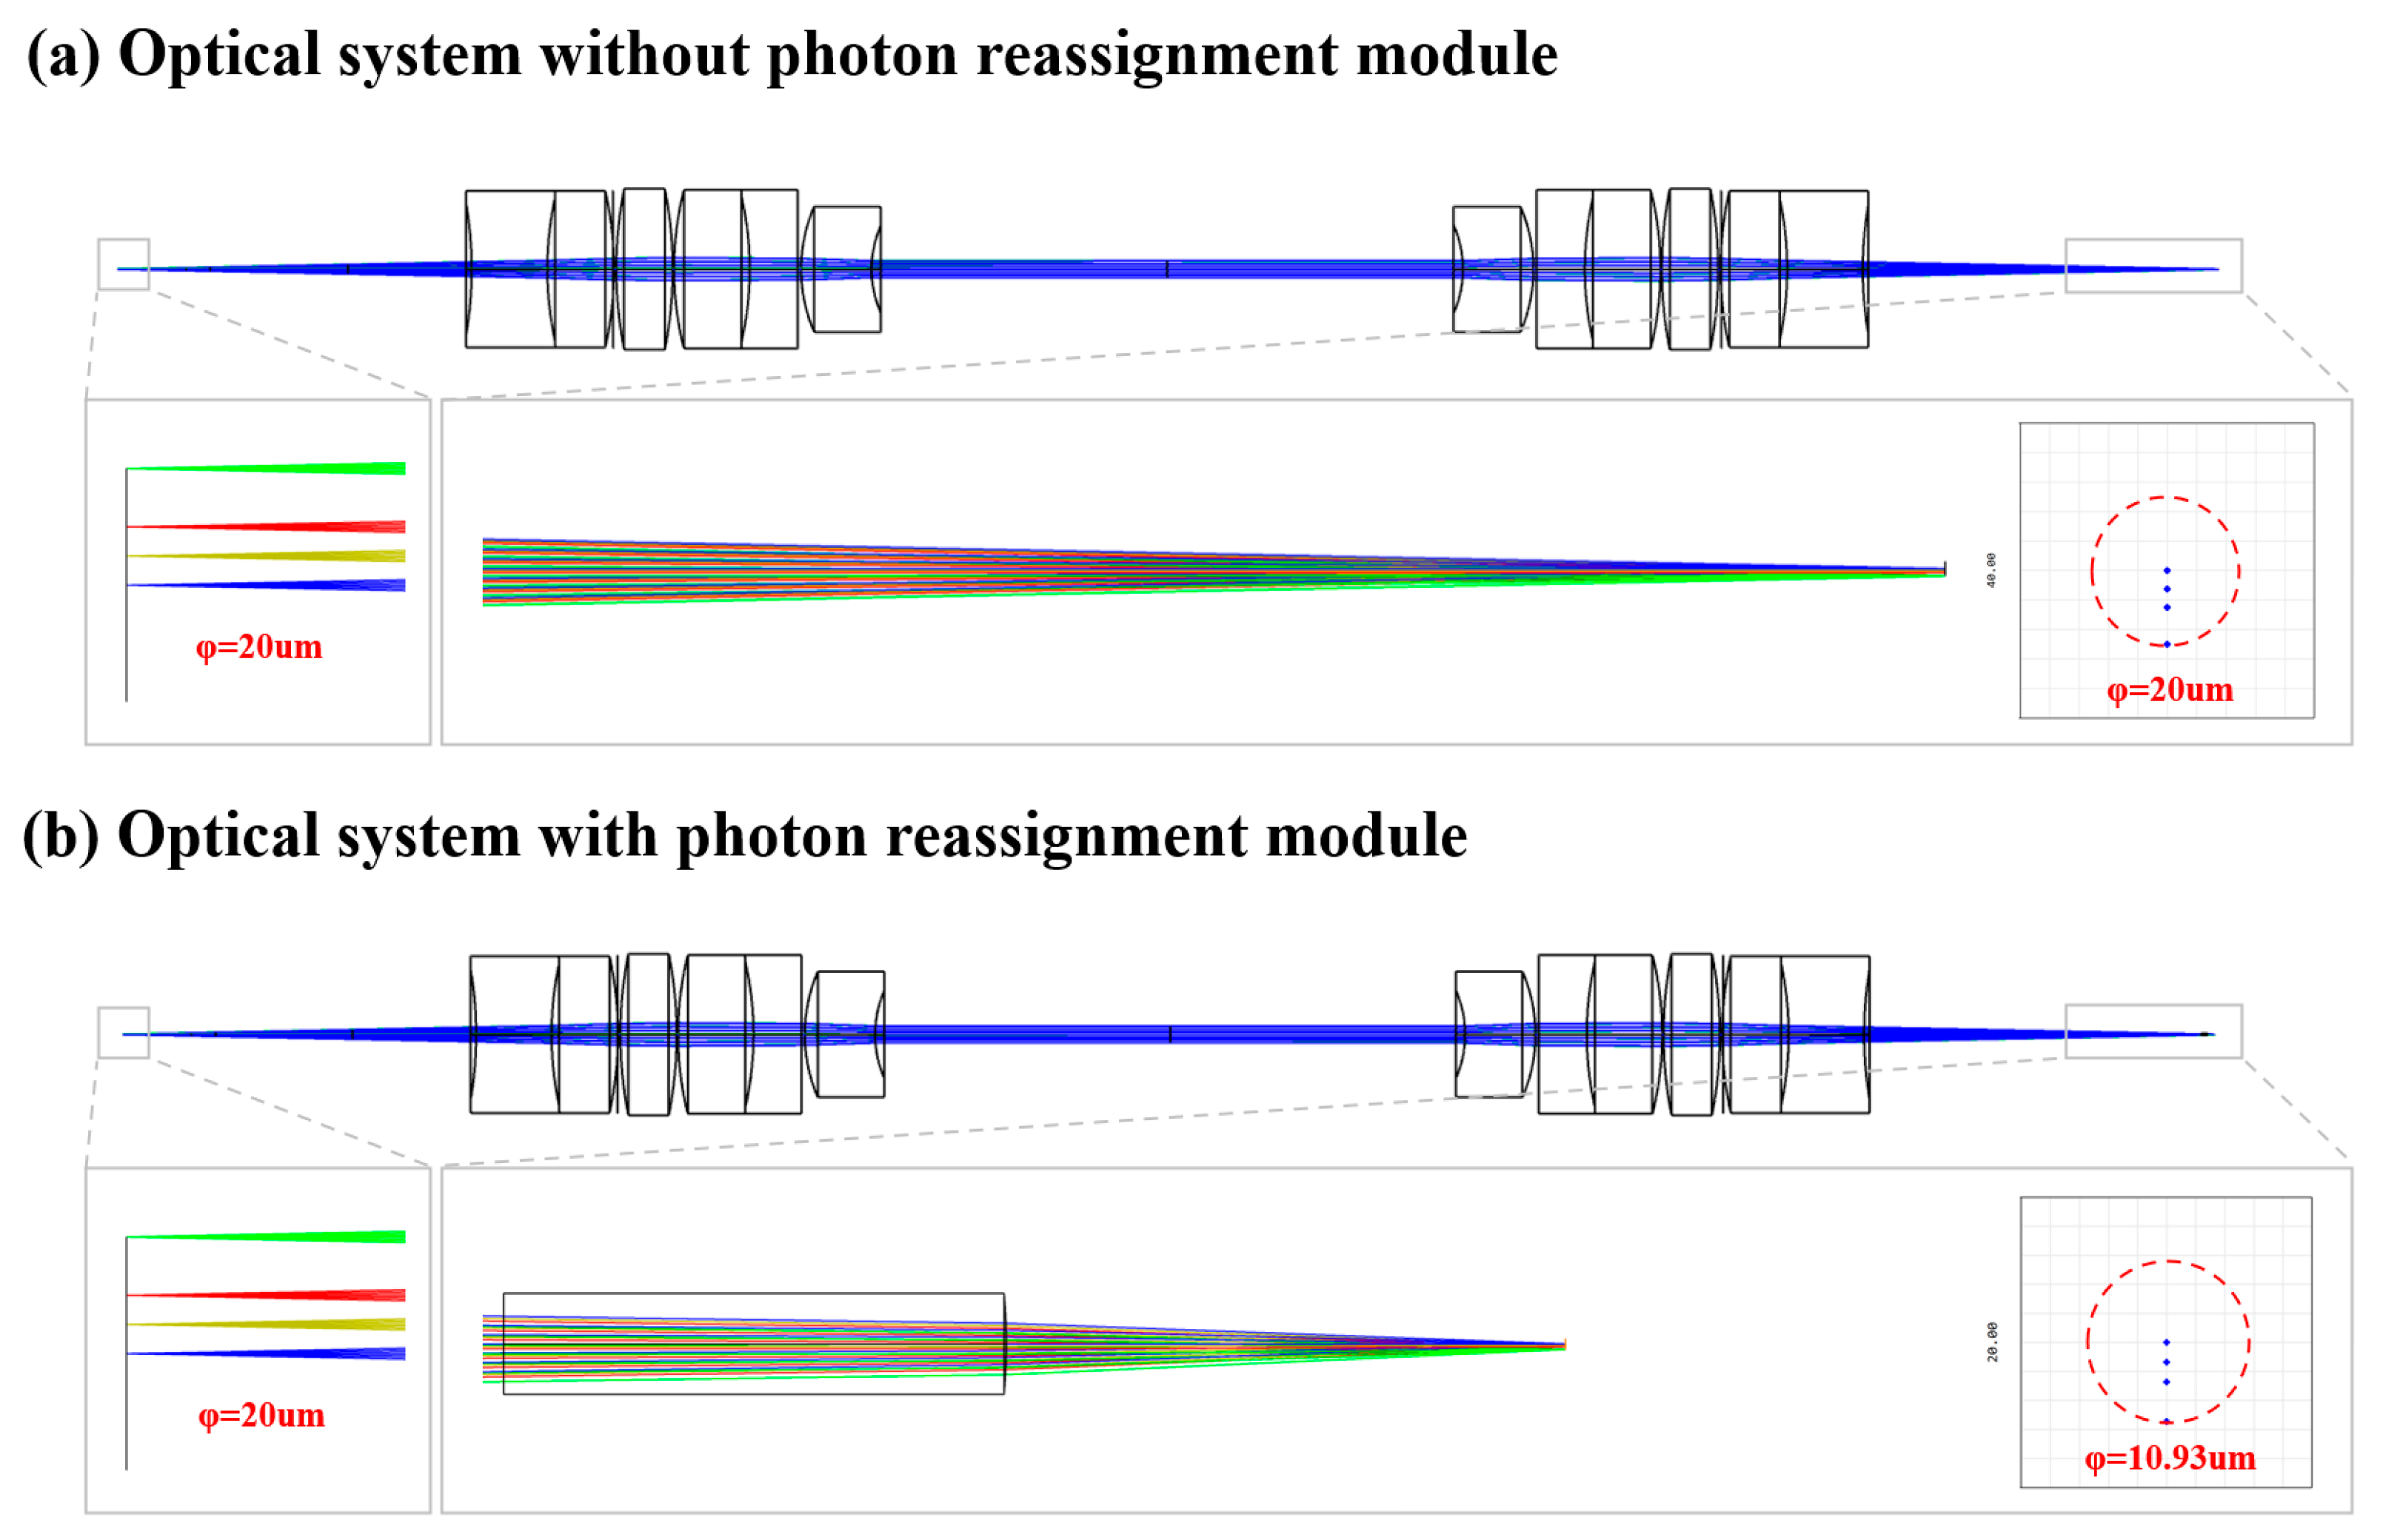
The system further incorporates a photon-reassignment MLA to enhance the resolution by modulating the NA of the focused beam array. The operational principle is illustrated in Figure 1d, where the black dashed lines represent the propagation path of the focused beams without the MLA, and the orange dashed lines depict the beam path after introducing the array. The MLA facilitates earlier convergence of the beams during propagation, effectively increasing the NA from NA1 to NA2 (where NA2 > NA1). Given that the NA is inversely proportional to magnification β, the diameter of the focal spots is correspondingly reduced, resulting in enhanced resolution.
In this study, a 20× metallurgical objective lens with an NA of 0.42 was employed. According to the theoretical calculations, the Airy disk radius at a wavelength of 640 nm was approximately 930 nm. Given a 20× demagnification ratio from the illumination array to the sample plane, the full width at half maximum (FWHM) of the illumination spot array must be less than 18.6 µm. During the experimental setup, an array of pinholes with a diameter of 18 µm per pinhole was illuminated using a telecentric LED light to generate an illumination spot array with an NA of approximately 0.02. To block stray light effectively, the aperture array used for this purpose required individual aperture diameters exceeding twice the FWHM, or 37.2 µm. To optimize the system’s signal-to-noise ratio, the aperture diameter was slightly increased beyond this theoretical value, with 50 µm selected as the optimal choice. To reduce the spot diameter by half, the NA of the photon-recombined illumination was increased to 0.04. Consequently, a set of MLA parameters was carefully designed, consisting of multiple plano-convex microlenses with a lens spacing of 200 µm, a convex surface curvature radius of 1.12 mm, and a theoretical focal length of 2.45 mm. These parameters correspond to an effective NA of approximately 0.04, which meets the system requirements for spot-size reduction.
To verify the effect of the MLA on reducing spot diameter, a simulation analysis was conducted using 2019 version of ZEMAX software. The object plane was configured with a telecentric spot array featuring an NA of 0.02 and a total field of 20 µm. After the light passed through a telecentric 4f scanning lens, changes in the total field on the image plane were observed. The simulation results are presented in Figure 2a,b. In Figure 2a, without the photon recombination MLA, the total field on the image plane remained 20 µm. As shown in Figure 2b, introducing the MLA reduced the total field to 10.93 µm. Considering the aberration effects in practical optical systems, the simulation results aligned with design expectations, demonstrating that the proposed optical path can significantly enhance the system resolution.

2.2. Optical Path Design

The overall structure of the system is divided into three modules:
  • Telecentric Illumination Module: The light emitted from the telecentric LED light source passes through an 18 µm diameter pinhole array 1, forming a uniformly illuminated dot-array pattern.
  • Illumination Optical Path Module: The telecentric dot-array light is reflected by a polarization beam splitter (PBS) and directed into a 4f system consisting of two scanning lenses. This system produces an image of a telecentric dot array behind scanning lens 2 (as depicted in Figure 3, as a virtual array). An X-axis scanning mirror is positioned at the minimum beam spot between the two scanning lenses. After passing through a quarter-wave plate, a tube lens, and an objective lens, a reduced dot array is formed that illuminates the sample.
  • Signal Detection Module: The reflected light returns along the original optical path to the PBS, where it forms a reflected dot array pattern matching the size of the illumination dot array. A 50 µm pinhole array filters out defocused light. The reflected light passes through a 4f system with a long working distance (relay lenses 1 and 2) and is conjugated to an MLA. The MLA converges to each beam in advance, achieving a resolution enhancement through the dot array. Finally, the light was imaged on a camera using a 4f system composed of a scanning lens and an X-axis scanning mirror located at the rear.
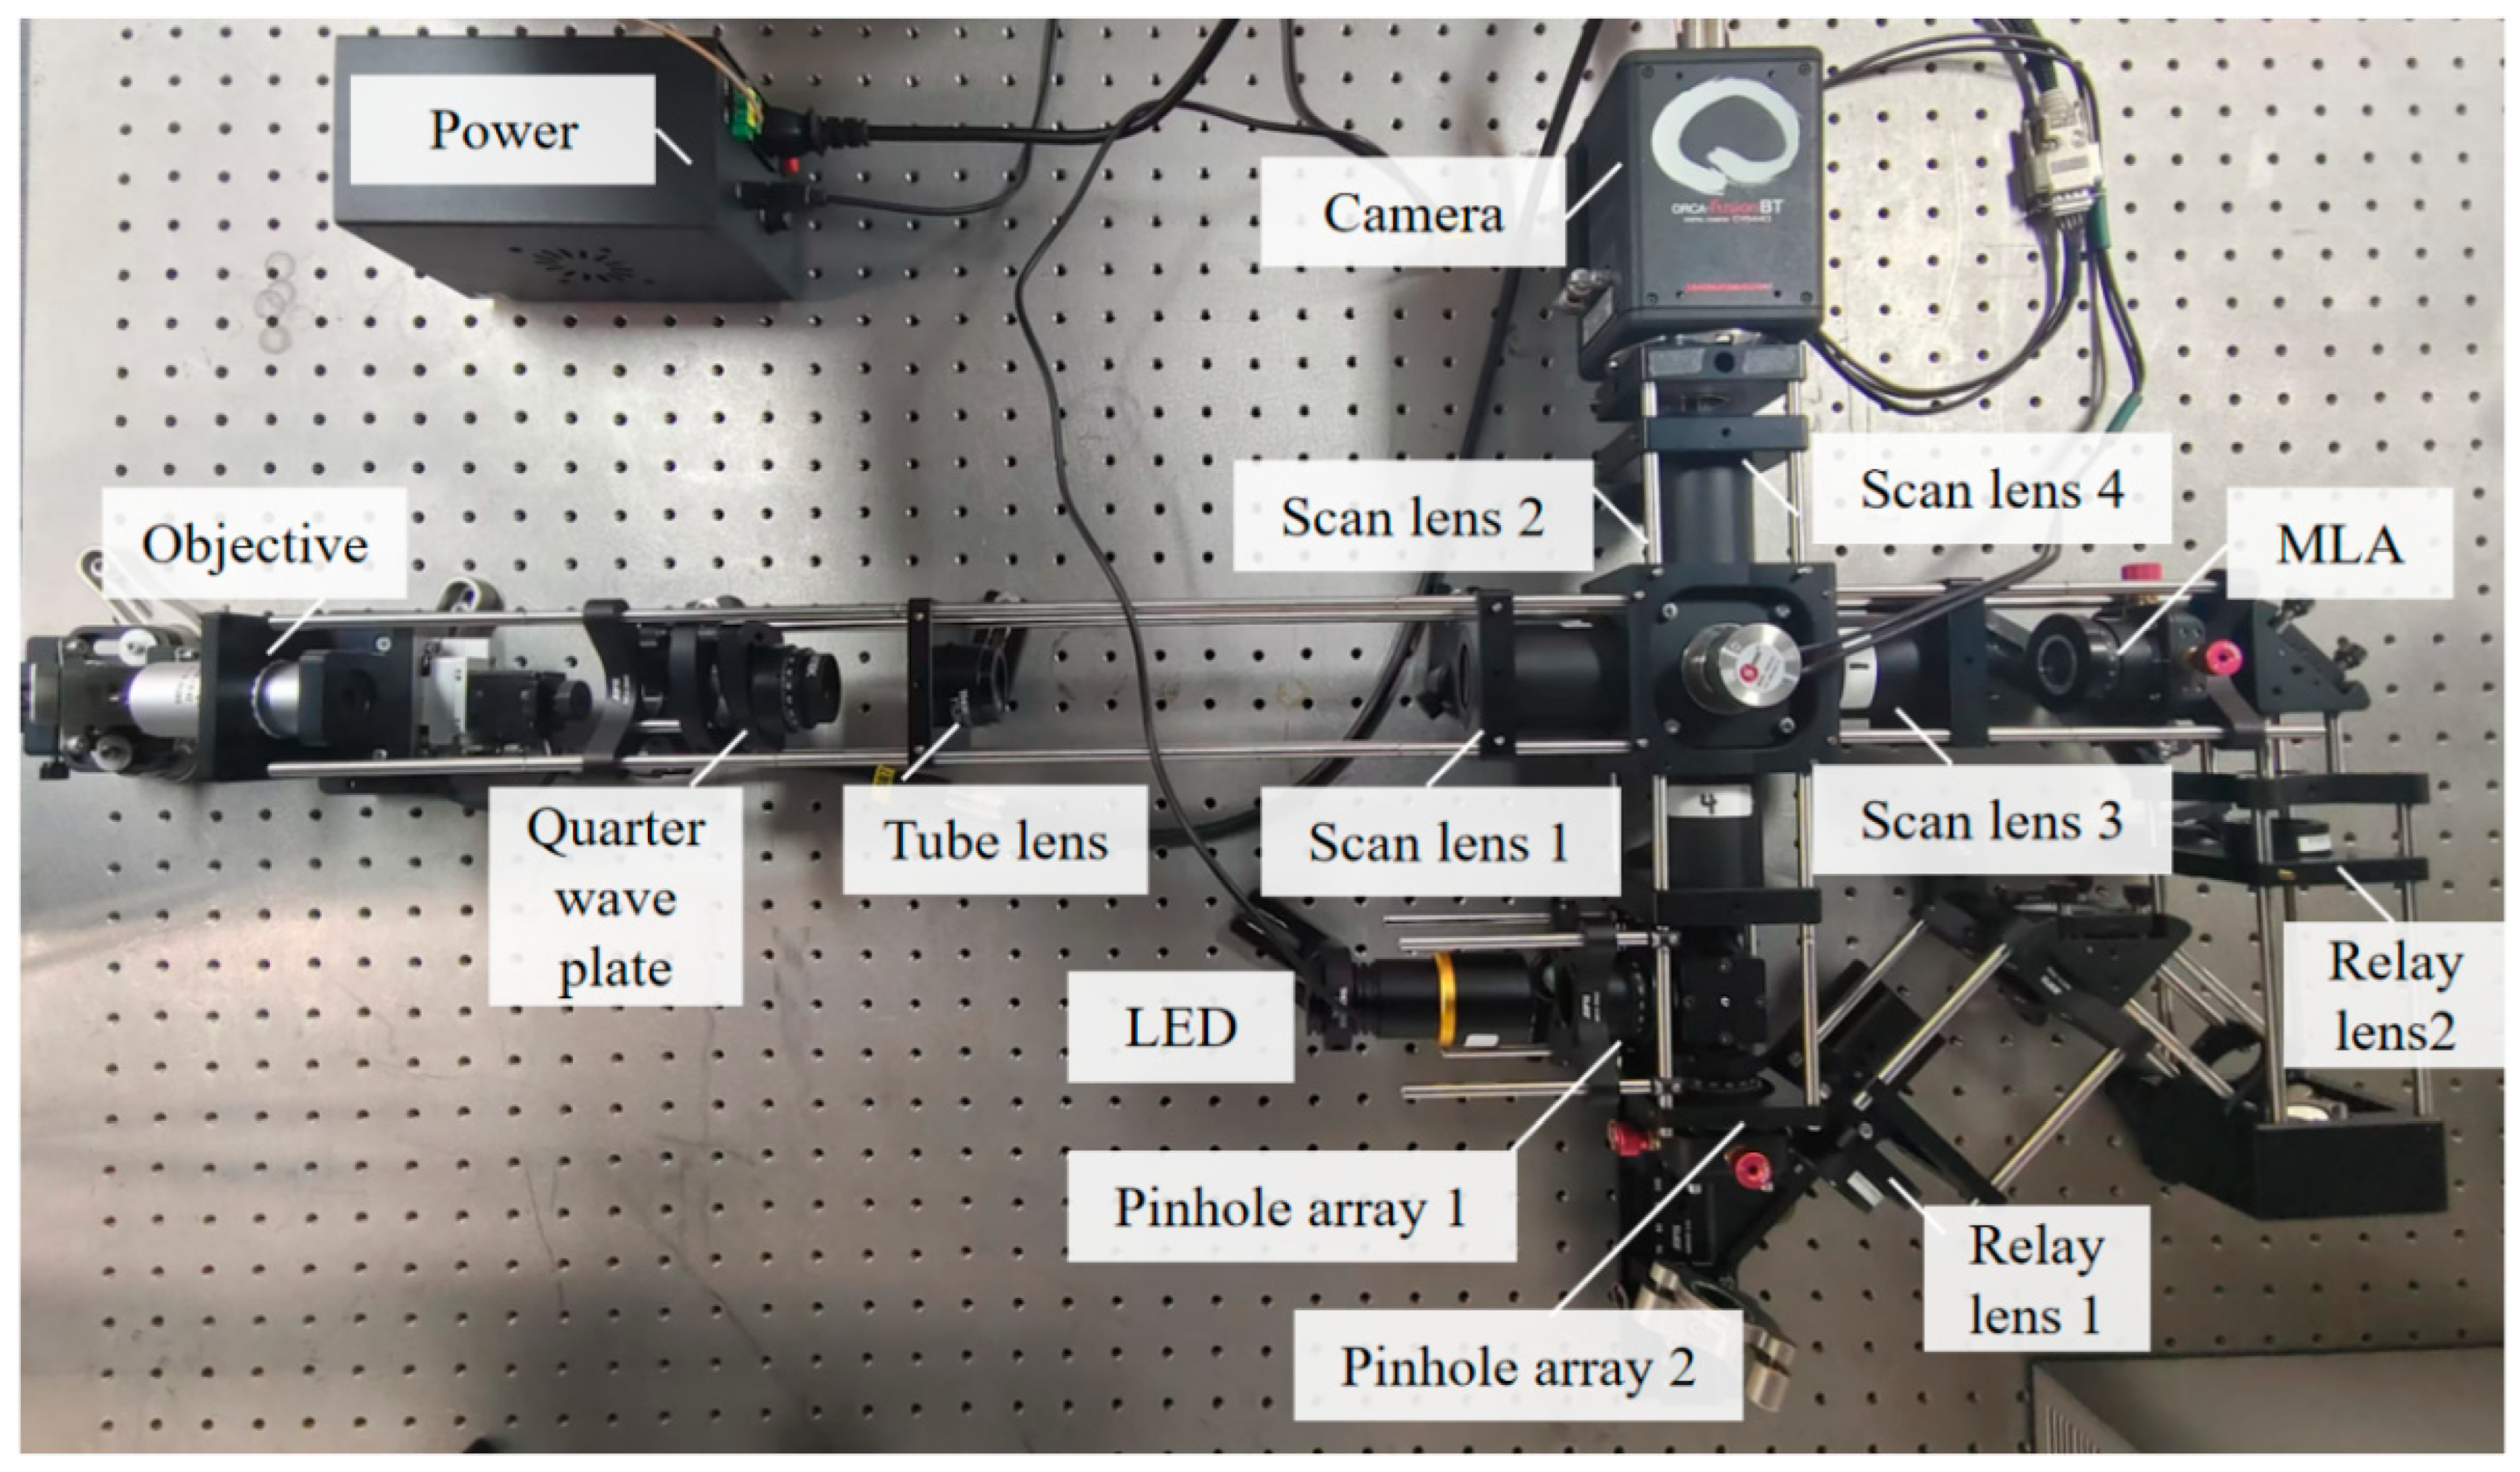
The physical optical setup constructed based on the above optical path design is shown in Figure 4.
To reduce stray light interference in the optical system, the following measures were implemented:
  • Combination of PBS and a quarter-wave plate: Owing to the multiple lenses in the scanning optics, some light may reflect off the lenses when passing through the first scanning lens, potentially generating stray light. The quarter-wave plate altered the polarization state of the reflected sample light, enabling effective separation of the signal from stray light and improving the signal-to-noise ratio of the system.
  • Tilt adjustment of the quarter-wave plate: The quarter-wave plate was tilted to reduce stray light from surface reflections. As a plane optical element, the surface of the waveplate near the tube lens reflected part of the illumination light, resulting in stray light with altered polarization. This stray light entered the detection module through the PBS. By adjusting the tilt angle of the waveplate, the stray light was directed away from the optical path, significantly reducing the background noise.
  • Addition of apertures around the scanning mirror: Apertures were added around the scanning mirror to block stray light generated from the mechanical walls, further reducing overall stray light interference.
In the experiment, we also designed and implemented a laser illumination scheme for comparison with the proposed incoherent light source scheme. The structure of the laser illumination system is illustrated in Figure 3. This system uses a 647 nm fiber laser, producing a 2 mm diameter collimated beam as the incident light source. After passing through a rotating scattering plate, the beam is directed onto microlens array 1 (MLA1), where it is split and focused using multiple microlenses in the array. The light then passes through microlens array 2 (MLA2) and a Fourier lens, forming a uniform light field with consistent intensity. Notably, to achieve optimal homogenization, the distance between MLA2 and the Fourier lens, as well as that from the Fourier lens to the uniform light field, were set as equal to the focal length of the Fourier lens. Additionally, the transmission rate and rotational speed of the rotating scattering plate significantly affected homogenization performance, ensuring stable light intensity uniformity. The relevant hardware parameters for the control group laser illumination scheme are listed in Table 1.

2.3. Design of High-Speed Imaging Control Logic

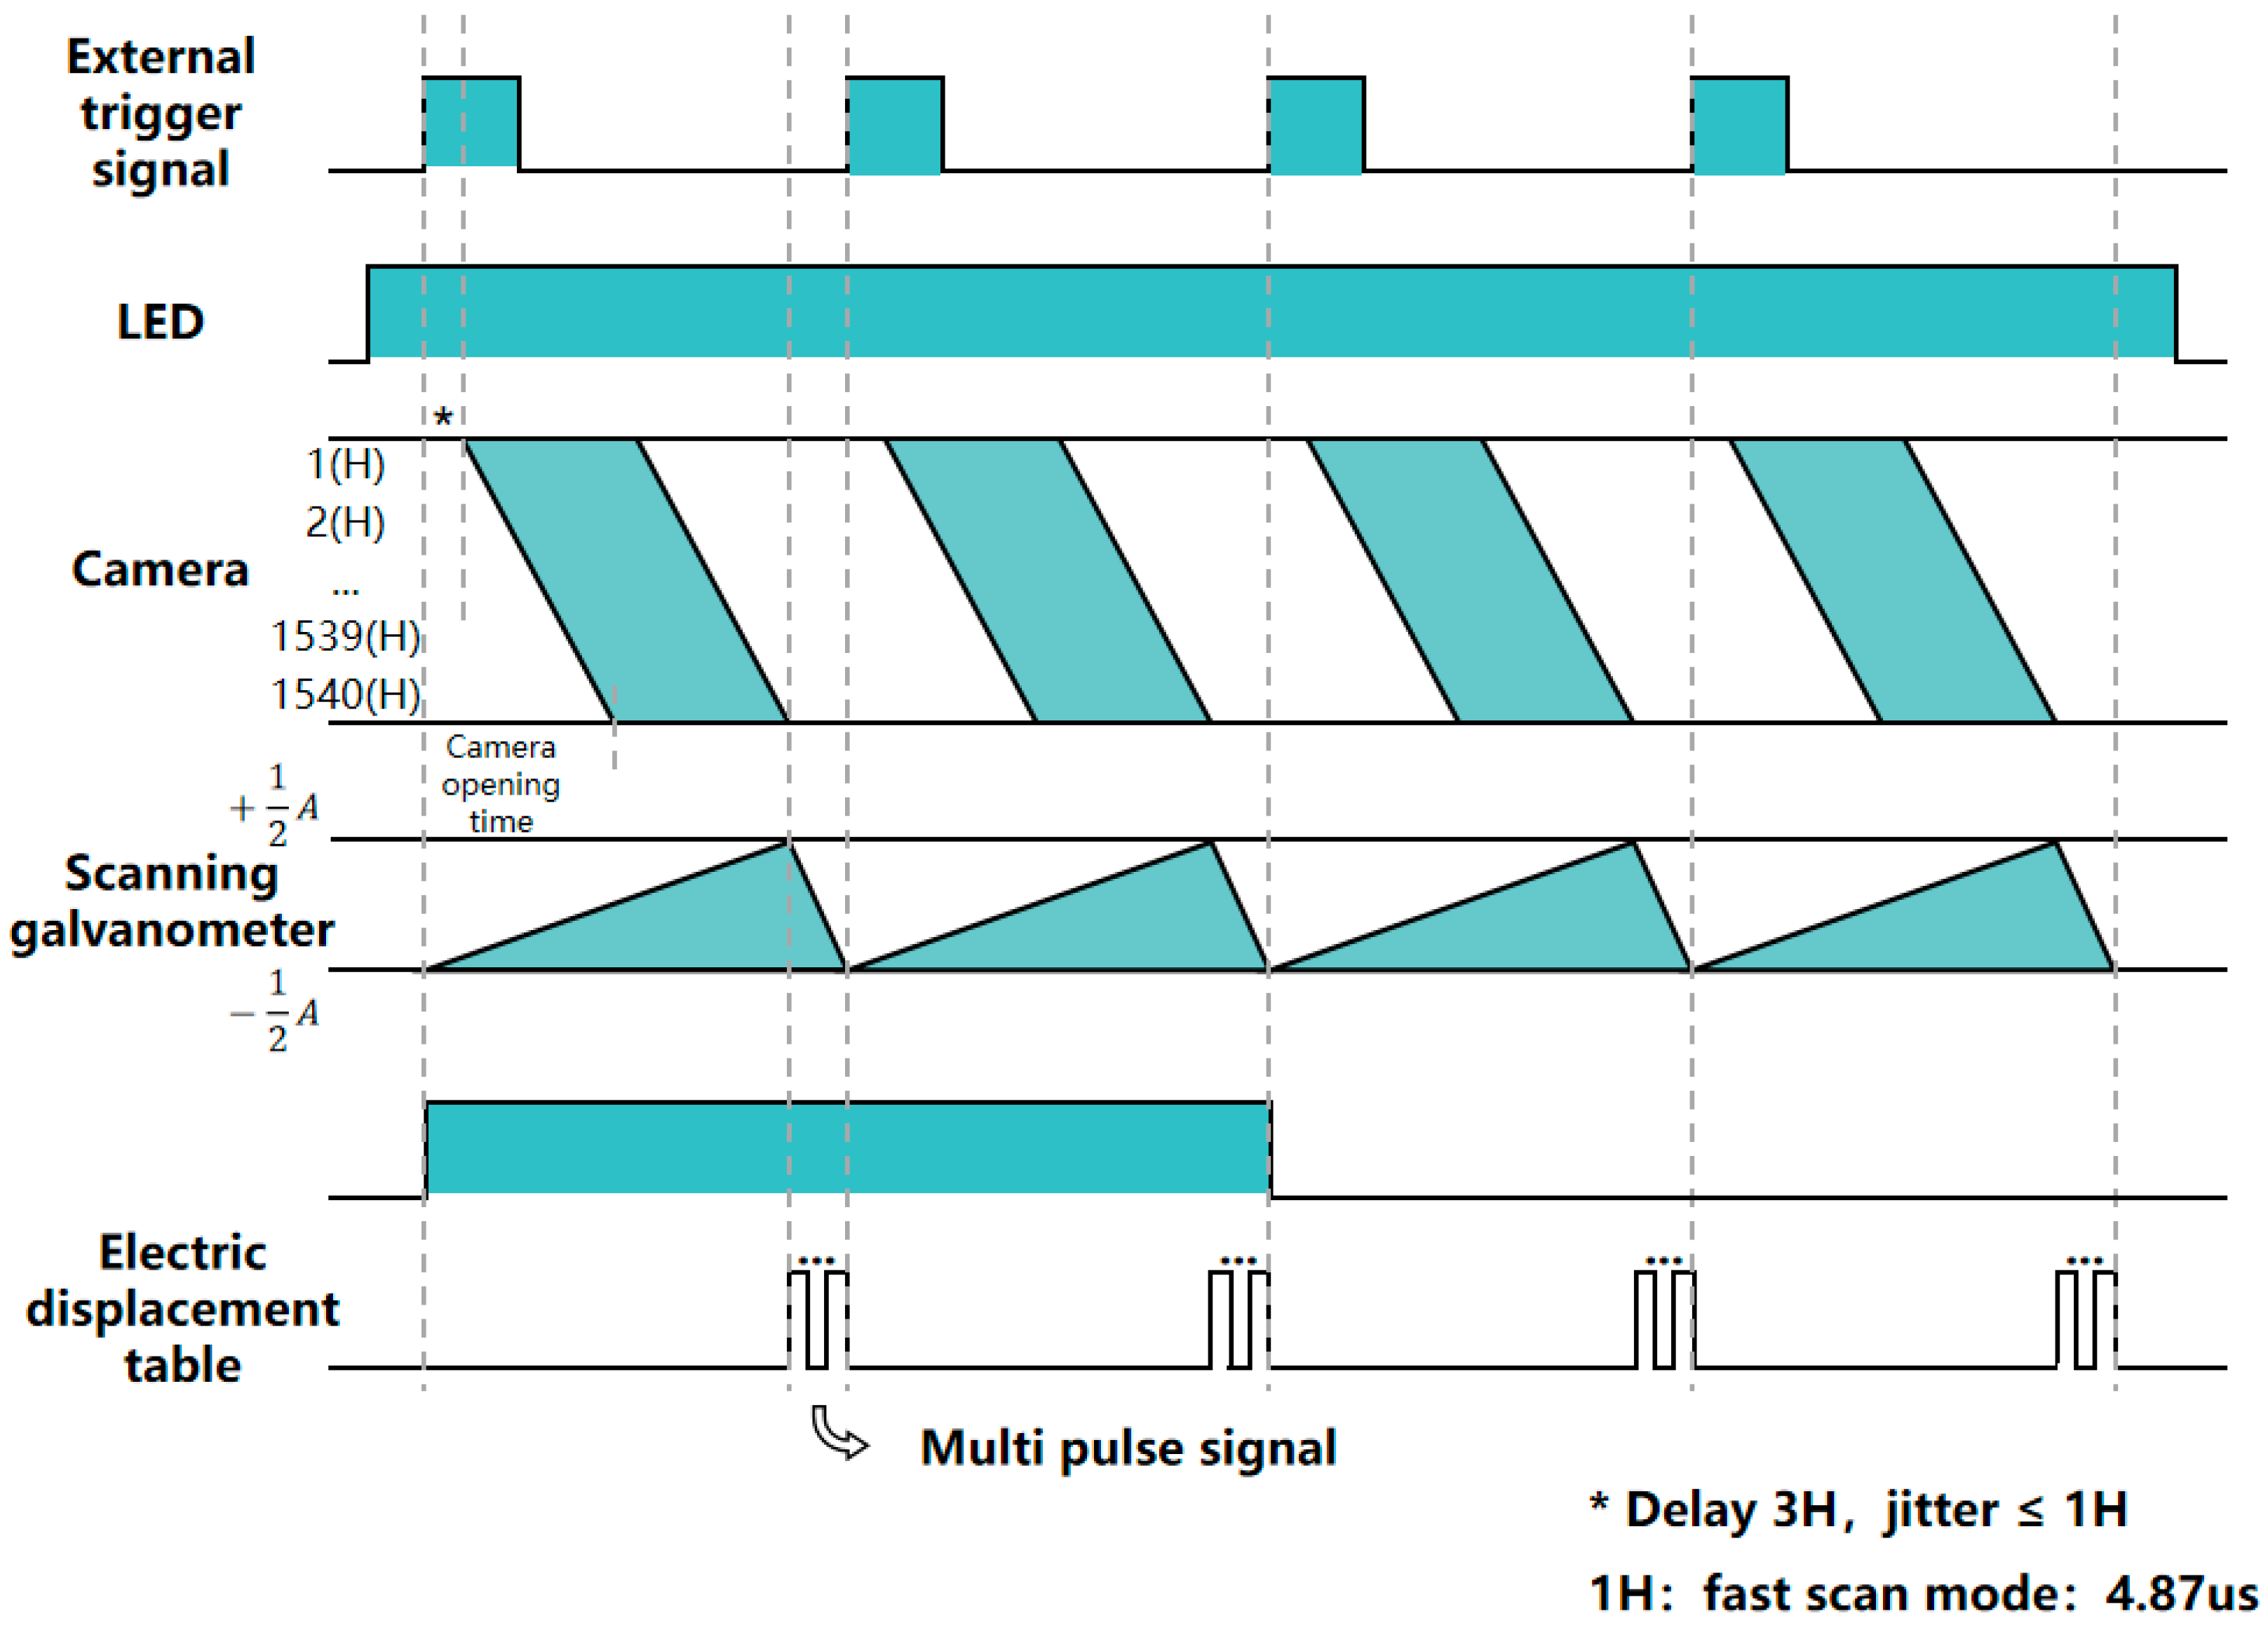
To achieve high-speed imaging, precise control logic was designed to synchronize the operation of all hardware components using a data acquisition card. In this system, analog signals generated by an NI data acquisition card are used to control the operating modes of multiple hardware devices, including a Hamamatsu camera, telecentric LED light source, high-speed X-axis galvanometer, and Z-axis motorized translation stage. The hardware control operates in two modes: independent and synchronized. Figure 5 illustrates the timing sequence for scanning imaging in the synchronized control mode.
In synchronized control mode, the data acquisition card issues commands to all output channels simultaneously, ensuring highly synchronized voltage signal outputs for the orderly operation of multiple hardware components. The system is designed with a corresponding timing sequence, enabling the camera to capture scanning images at a high frame rate of 100 fps.
For a 500 µm × 500 µm field of view, a sensor with a single pixel size of 6.5 µm generates an image resolution of 1540 × 1540 pixels. The acquisition time for a single image is 10 ms. The camera operates in a rolling shutter mode with a single-line exposure time of 4.87 µs. Following the rising edge of the trigger signal, there is a delay of 3H (three horizontal lines). Thus, the camera opening time can be calculated as:
(1540 + 3) × 4.87 μs = 7514.41 μs ≈ 7.5 ms
To achieve a 100 fps imaging rate at 1540 × 1540 resolution, the camera’s exposure time must be limited to 2.5 ms. This constraint ensures sufficient time for data acquisition and processing during each frame cycle.
In this system, a single parallel confocal scan image corresponds to a long-exposure-mode scan image, effectively representing the superposition of multiple spot images. Therefore, precise control of the camera’s exposure time and angular deflection of the galvanometer is crucial for achieving high-quality images. The timing design is based on the rising edge of the camera’s external trigger signal, which synchronizes the galvanometer’s deflection. The galvanometer‘s voltage range is set to A, with the corresponding deflection angle uniformly distributed at approximately 45°. The actual deflection voltage range varies from −A/2 to A/2, minimizing image distortion. When the exposure of the 1540th line of the camera ends, the galvanometer immediately reverses its deflection and adjusts the voltage to −A/2 before the next frame begins. During a single parallel-scan imaging process, the LED light source remains continuously illuminated to maintain stable light intensity for image acquisition. The camera’s exposure time is preset, ensuring consistent signal acquisition time for each pixel row. However, owing to the varying start and stop times, the signal reception times for each row differ. Therefore, the test object must remain stable during imaging. The control of the motorized translation stage is managed through two sets of acquisition card signals: one set controls the movement direction, and the other set outputs pulse signals. According to the timing sequence shown in Figure 5, during the acquisition of the first two images, the Z axis moves in the positive direction, whereas in the next two images, the Z axis moves in the negative direction. Displacement pulse signals are input during the reverse deflection of the galvanometer. The motorized translation stage, as a mechanical system, experiences a delay between receiving the signal and achieving stability. In continuous stepping mode, allocating a longer time cycle for image sequence acquisition is necessary to ensure imaging stability.

3. Results

3.1. Comparison Experiment Between Laser Illumination and LED Illumination

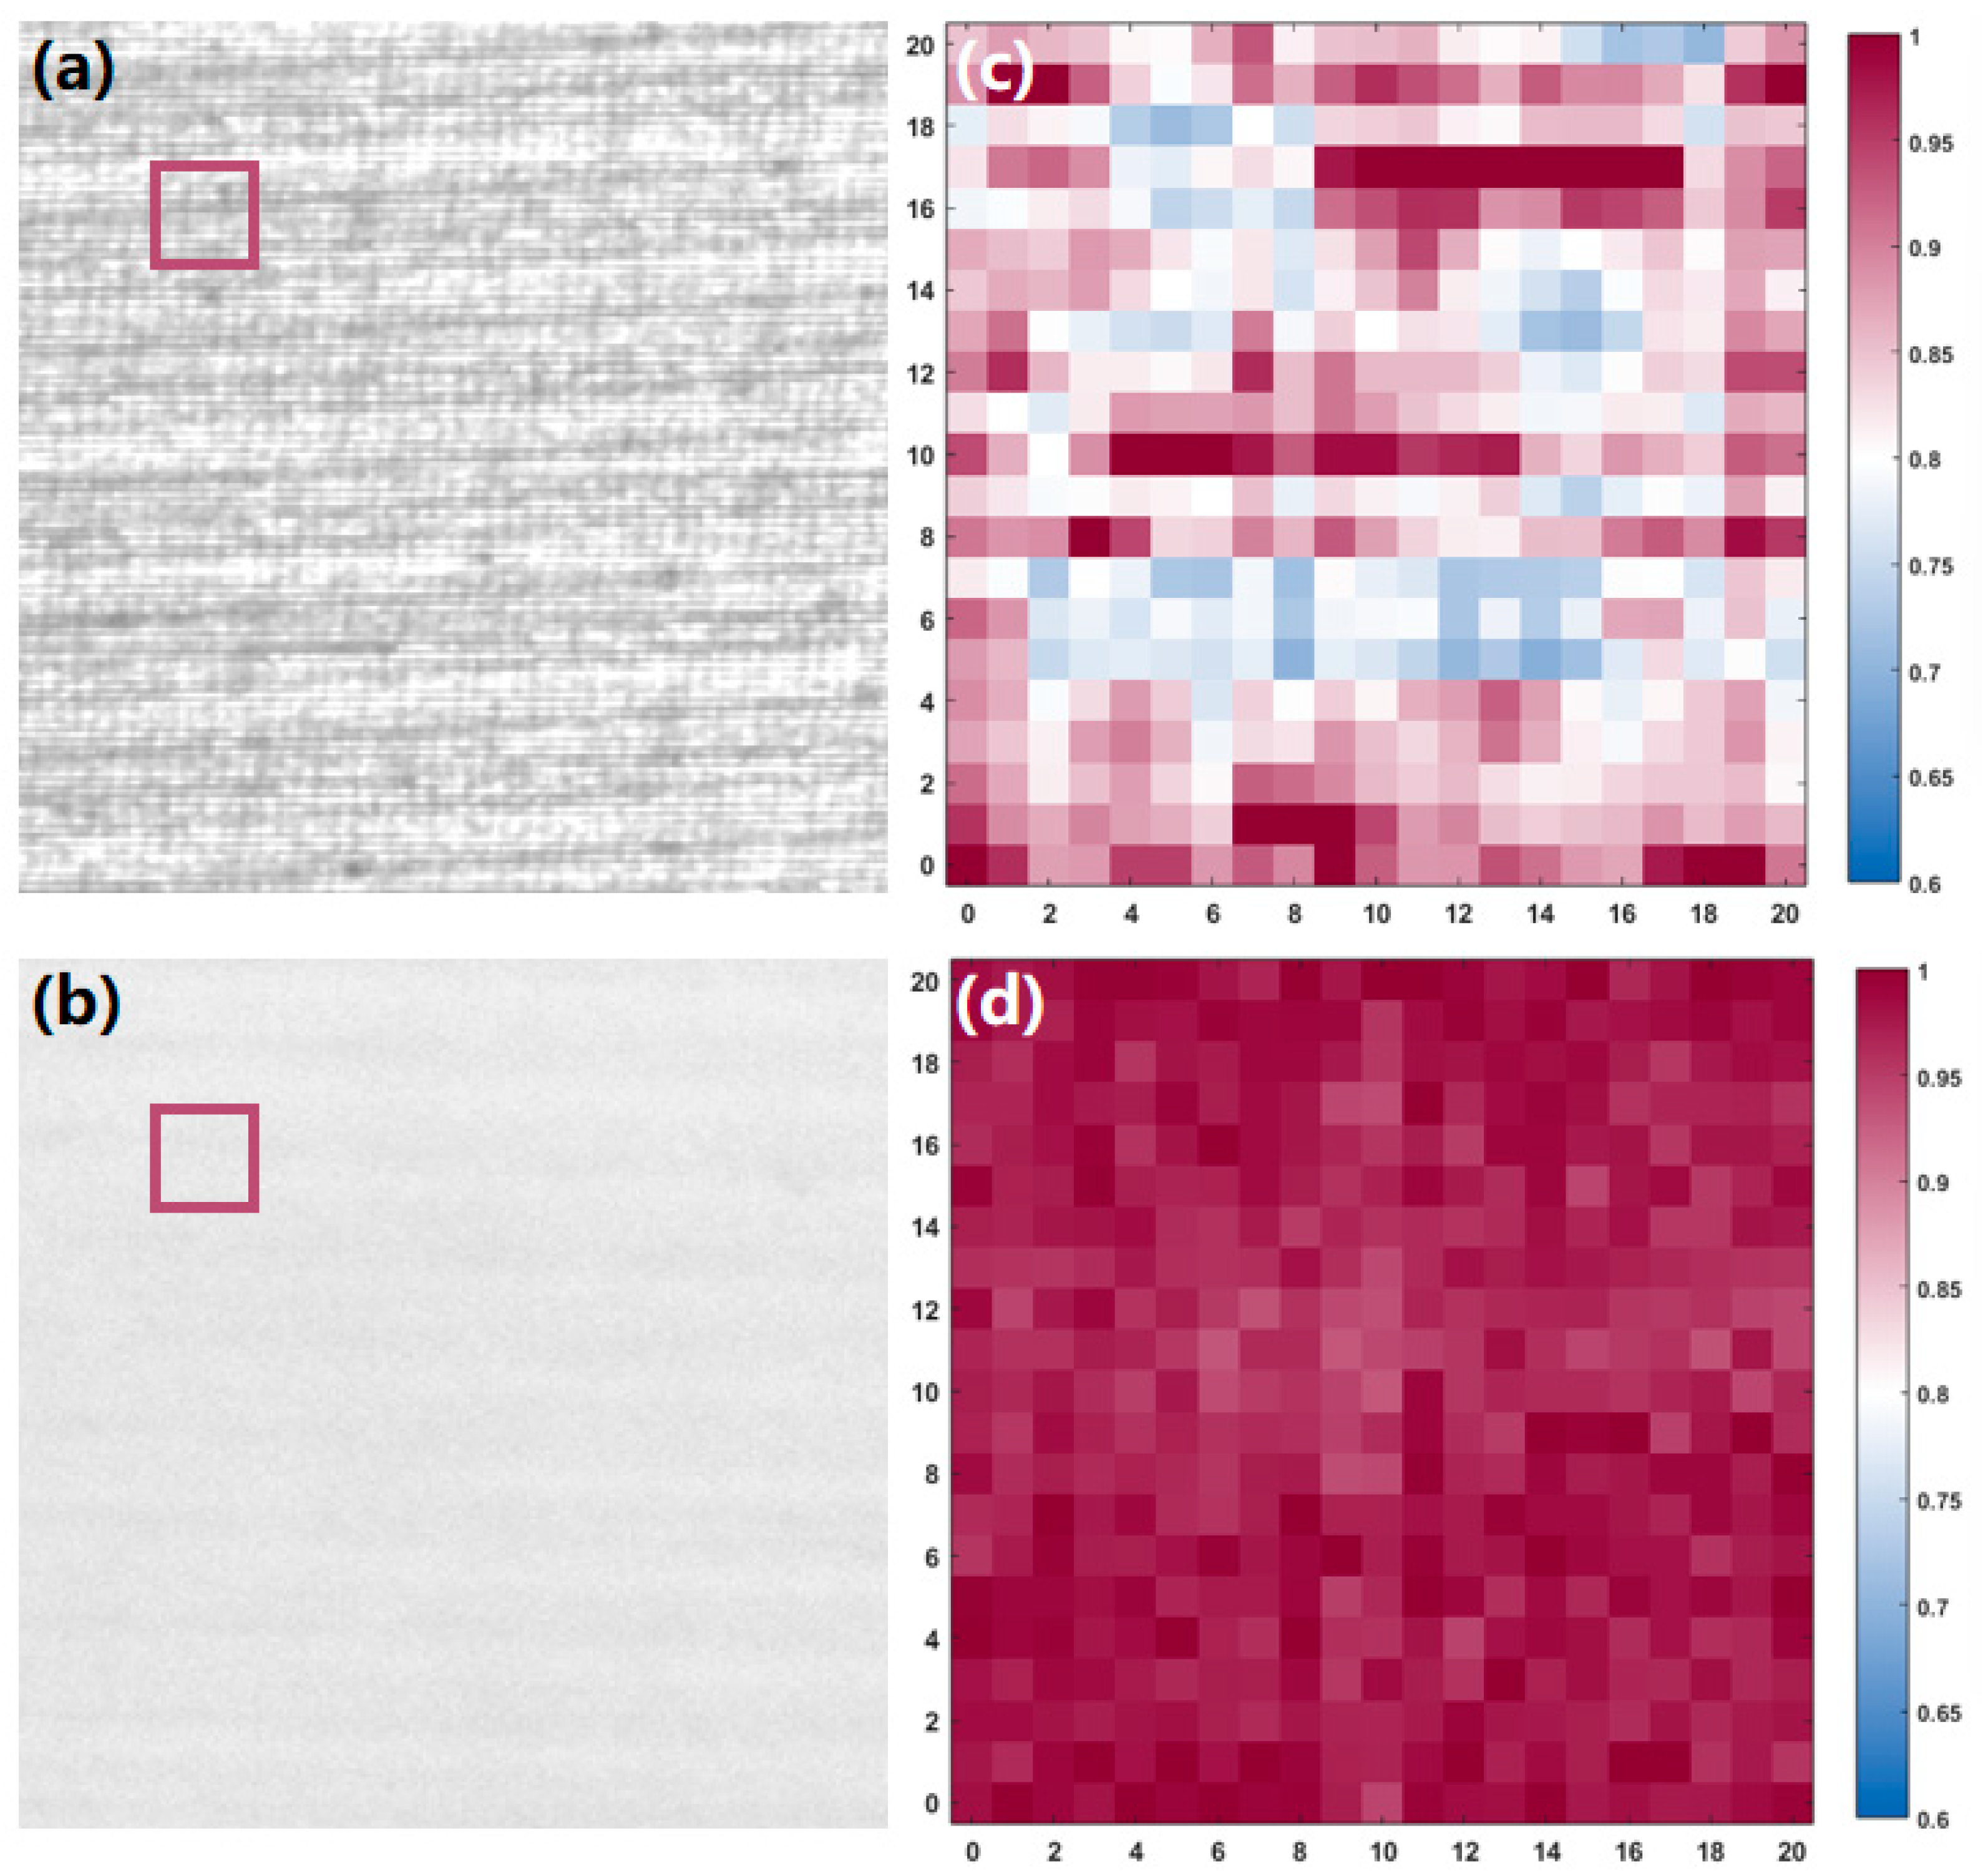
This study systematically compares the imaging uniformity of two illumination schemes: an incoherent light source scheme using a telecentric LED device and a laser scheme incorporating microlens arrays. Experimental results show that the incoherent light source significantly outperformed the laser scheme regarding imaging uniformity (Figure 6). Specifically, Figure 6a shows the imaging result under laser illumination, while Figure 6b shows the imaging result under LED illumination, both with a total exposure time of 20 ms. A 20 × 20 pixel region was extracted from both Figure 6a,b for comparative analysis using the same lookup table. The analysis results are illustrated in Figure 6c,d. The laser image exhibited a wider intensity distribution range, with distinct color variations from blue to red. In contrast, the LED image showed more stable intensity values, predominantly in red. The standard deviation of the image grayscale uniformity is calculated using Equations (1) and (2). The laser-illuminated image revealed a standard deviation of 2329.4, whereas the LED image showed a standard deviation of 679.4, indicating a significantly less uniform grayscale distribution in the laser image. This difference is primarily due to the high coherence of the laser light source which, in the absence of the rotating scattering plate, can easily form visible interference fringes on the uniform illumination surface.
G r a y   m e a n   l e v e l s = 1 N s u m ( G r a y   v a l u e )
S t a n d a r d   d e v i a t i o n = 1 N s u m ( G r a y   v a l u e G r a y   m e a n   l e v e l s ) 2
where N represents the total number of pixels within the computed image.
Although a high-speed rotating scattering plate was incorporated into the laser illumination scheme to enhance light field uniformity, its homogenization effect was weakened during point-scanning imaging, where the sample had a reflective structure and the camera used a long exposure. This resulted in a reduction in the light-field stability during fast scanning. A stable illumination field is crucial for high-quality imaging. Therefore, an incoherent light source offers a significant advantage in reflective, long-exposure scanning imaging systems.

3.2. Experimental Results of Resolution Improvement

3.2.1. Dot Array Imaging

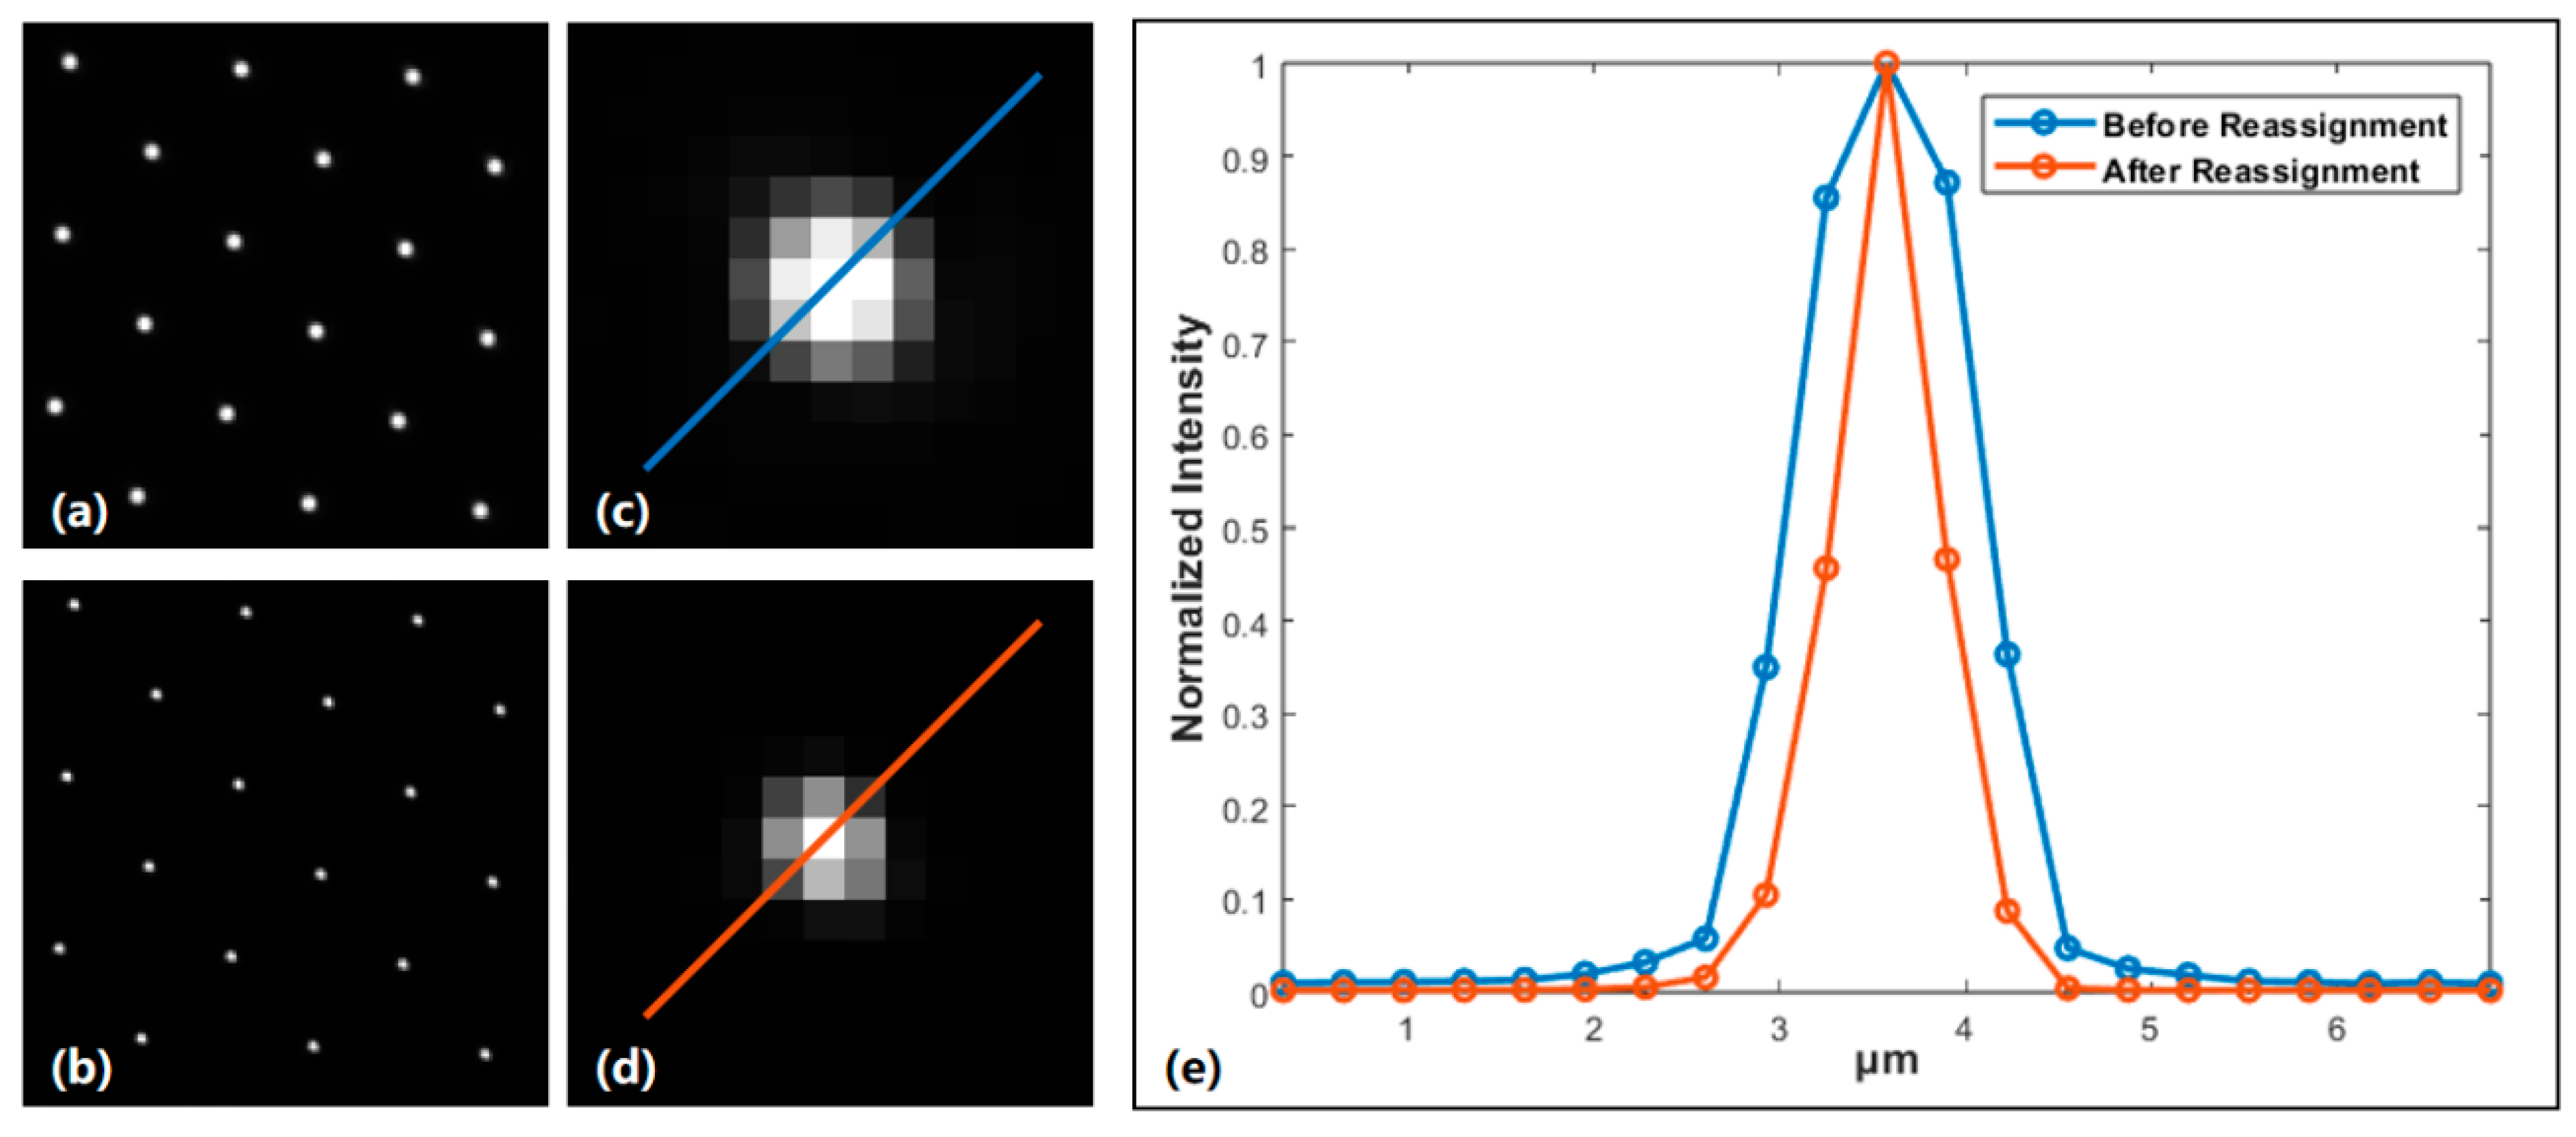
This study verifies the effectiveness of the photon-reassignment MLA in enhancing resolution. We systematically analyzed the signal dot array images obtained before and after installing the photon-reassignment module (MLA, Figure 3). The steps for obtaining the signal dot array images are as follows: First, a mirror was used to replace the sample for system calibration. When the galvanometer was stabilized at 45°, the reflected image was a signal dot array (Figure 7a,b). To quantify the improvement in resolution, we compared the diameters of the single-point images before and after photon reassignment. Figure 7e shows the intensity distribution curves along the color-marked lines in Figure 7c,d. The analysis shows that the FWHM of the intensity distribution was 1.105 μm before photon reassignment and 0.650 μm after, indicating resolution improvement by a factor of √2.

3.2.2. Resolution Board Imaging

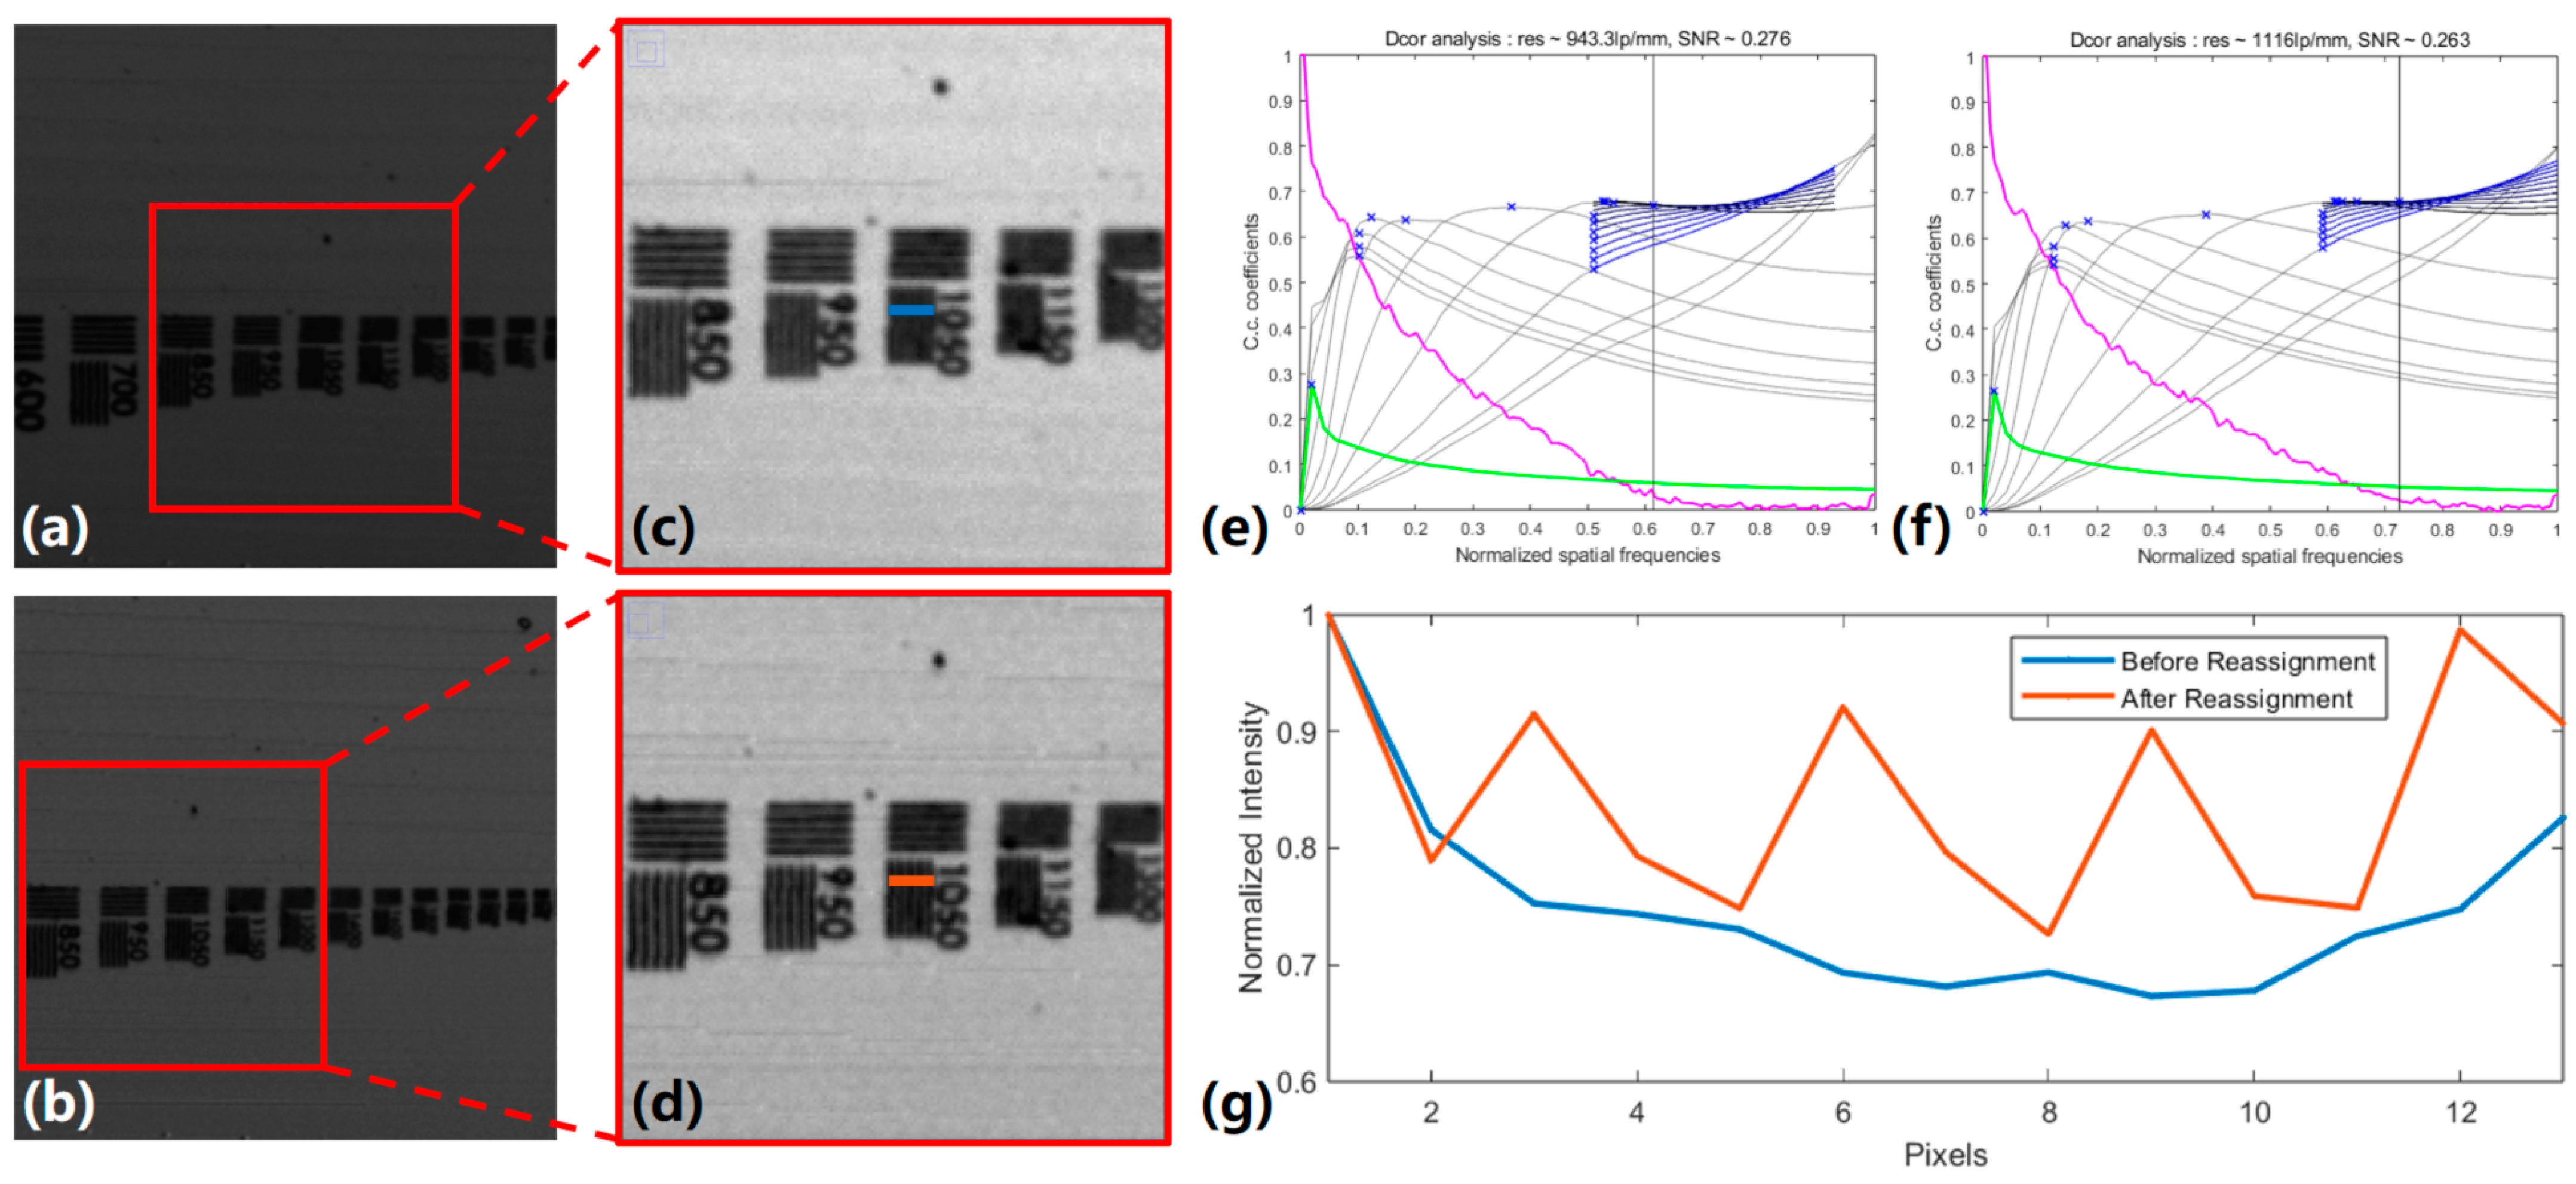
To further validate the imaging performance and improve the resolution of the system, we conducted imaging tests using a resolution panel. Figure 8 shows the imaging results of the resolution panel, with Figure 8c,d representing magnified views of the selected areas in Figure 8a and Figure 8b, respectively. The resolutions of the images in Figure 8a,b were accurately analyzed using an open-source program [27]. The results showed that the resolution before photon reassignment was 943.3 lp/mm, which improved to 1116 lp/mm after photon reassignment, representing a 1.183-fold increase. As shown in Figure 8g, the 1050 lp/mm stripes were unresolvable before photon reassignment but became clearly visible, with a distinct peak intensity after photon reassignment. This further confirms the effectiveness of the system in enhancing resolution.

3.2.3. 100 nm Metal Particles Imaging

This system was used to perform imaging tests on 100 nm metal particles. The experimental results show that the adjacent metal particles, which were indistinguishable before photon reassignment, were clearly separated after photon reassignment, as shown in Figure 9. The intensity curve exhibited two distinct peaks, with a more concentrated light energy distribution. Additionally, the light energy in the effective information region was significantly enhanced. The normalized intensity curve indicated that the light intensity on both sides of the peaks decreased, suggesting that the photon reassignment module improved the contrast of the system.

3.3. Fresh Pig Cornea Imaging

To evaluate the feasibility of the proposed RCM system for biological corneal imaging, experiments were conducted on fresh pig eye corneas. Fresh eyeballs were obtained from the eyes of pigs purchased from supermarkets, and corneal samples were prepared to suit the system’s planar imaging mode. As shown in Figure 10b, the corneal surface was cut with a scalpel and fixed onto a microscope slide to form a planar sample. Figure 10a shows the scanning imaging results, where the corneal epithelial cell structure is clearly observed, with the cell nuclei marked by blue arrows. Additionally, Figure 10c presents the intensity curve at the orange line position in Figure 10a, successfully distinguishing structures with an interline spacing smaller than 975 nm, confirming the resolution capability of the system in imaging micron-level details. Furthermore, to verify the large field-of-view imaging ability, an image with a field of view of 500 µm × 500 µm was captured using a 20× objective lens, as shown in Figure 10a. The scale bar in the lower-left corner was 100 µm, and the displayed field of view was consistent with the system’s large field-of-view design, demonstrating that the system can achieve imaging results with a 500 µm × 500 µm field of view and 1 µm resolution.

4. Discussion

This study successfully developed a comprehensive multi-point confocal scanning imaging system that achieves high efficiency by integrating precise hardware timing control and telecentric LED illumination. Experiments using resolution test charts and metal particles demonstrated a significant resolution enhancement through the use of photon reassignment MLA. Notably, this work represents the first application of multi-point confocal technology to corneal examination, offering an innovative, non-contact solution for corneal detection.
While the study demonstrated effective imaging results for partially reflective samples, several limitations remain unresolved. First, the scanning imaging process introduces stripe noise, which has not yet been fully suppressed. Second, the experiments conducted to date have been limited to static samples, leaving the long-term operational stability of the hardware and its performance in dynamic imaging scenarios open for examination.
Consequently, potential directions for future research include:
  • Image Post-Processing: Fringe filtering algorithms could be implemented to analyze and process the image spectrum, effectively removing high-frequency noise introduced during scanning. This approach would enhance image smoothness and overall quality.
  • Resolution Optimization: Incorporating Richardson–Lucy (RL) deconvolution algorithms could further enhance resolution. This method would improve the system’s ability to detect fine structures, pushing the spatial resolution limits.
  • Dynamic Imaging Capability: Optimizing hardware timing control to increase scanning speed and system responsiveness is essential for imaging dynamic corneal surfaces or other moving samples effectively.
  • Deep Learning for Accelerating 3D Imaging: Deep learning techniques, such as SRRF-Deep [28], could accelerate 3D imaging by leveraging neighboring pixels in z-scanning slices for reconstruction. This approach would enable the generation of high-quality imaging slices. while significantly reducing the number of images required.
Further resolution improvements could also be achieved by integrating an additional MLA array into the system. While the current microlens array in the detection optical path reduces spot size, expanding the annular optical path could yield better results. Specifically, introducing a set of 4F lenses to create an intermediate image plane, combined with a microlens array with a smaller radius of curvature at this plane, could further minimize spot size and enhance resolution. Additionally, reducing the curvature of existing microlens arrays to increase the numerical aperture (NA) of each small beam could provide further resolution enhancements.
The proposed multi-point confocal technology demonstrates significant potential for non-contact corneal examination. This method can provide high-resolution, low-interference data on corneal morphology while ensuring patient comfort, which could significantly improve the efficiency and accuracy of ophthalmic diagnostics. In the future, this technology could be incorporated into portable or automated clinical devices. Finally, multi-point confocal technology holds promise as a versatile solution for non-destructive imaging of complex samples in diverse applications, including microscopic imaging, biological sample analysis, and high-precision industrial inspection.

5. Conclusions

This study presents a multi-point confocal microscopy system using incoherent light sources. The system incorporates a telecentric LED light source and an array of apertures to achieve large field-of-view uniform illumination. This setup stabilizes light intensity while ensuring uniform and reliable illumination for reflective samples. The experimental results comparing the scanning imaging effects under identical exposure duration showed a 3.4-fold improvement in image uniformity. Moreover, the resolution of the system was significantly enhanced by incorporating a photon-reassignment microlens array. Imaging tests on resolution plates with line pairs and 100 nm metal particles showed that the photon reassignment module improved the resolution of the system by at least 1.183 times while effectively concentrating light energy. This improvement enabled clear separation of metal particles that were indistinguishable with conventional confocal imaging. The experiments also compared the spot diameters before and after photon recombination, with the FWHM of the smallest light spot reaching 0.650 µm, indicating a potential resolution improvement of √2 under appropriate sample conditions. The system achieved a wide field of view of 500 µm × 500 µm and high-resolution imaging at 1 µm. The precise light source design and photon reassignment microlens array provided uniform and stable illumination over a large field of view and significantly improved the confocal imaging resolution, demonstrating superior performance in reflective sample imaging.
Overall, this study developed a comprehensive reflective confocal microscopy system, verified its large field-of-view imaging capability and resolution enhancement effect through planar sample imaging, and confirmed its reliability through multiple repeated experiments. The system successfully imaged corneal cell layers in fresh pig eye corneas, demonstrating its feasibility for biological sample applications. Future research will focus on further improving the performance of the system for live corneal imaging and optimizing its fast imaging capabilities and image quality to advance its potential applications in clinical medicine.

Author Contributions

Conceptualization, Y.C. (Youhua Chen) and H.H.; Methodology, H.H., Y.C. (Youhua Chen) and K.D.; Validation, H.H., N.H. and Y.Z.; Resources, D.Z. and Y.M.; Data Curation, H.H. and J.M.; Writing—Original Draft Preparation, H.H.; Writing—Review and Editing, Y.C. (Youhua Chen), H.H. and N.H.; Visualization, H.H. and Y.C. (Yunbo Chen); Supervision, Y.C. (Youhua Chen) and C.K.; Project Administration, Y.C. (Youhua Chen); Funding Acquisition, Y.C. (Youhua Chen) and C.K. All authors have read and agreed to the published version of the manuscript.

Funding

This work was supported by the “Pioneer” and “Leading Goose” R&D Program of Zhejiang (2024C03067), Natural Science Foundation of Zhejiang Province (LY23F050010), National Key Research and Development Program of China (2021YFF0700302), National Science Fund for Distinguished Young Scholars (62125504), and the Ningbo Key Scientific and Technological Project (2024Z196).

Data Availability Statement

The data supporting the findings of this study are available from the corresponding author upon request.

Conflicts of Interest

The authors declare no competing interests. Author Youhua hen was employed by Ningbo Yongxin Optics Co., Ltd. There is no conflict of interest between any of the authors and the company.

References

  1. Zhelem, R. Specification of optical surface accuracy using the structure function. In Proceedings of the Modeling Aspects in Optical Metrology Iii, Munich, Germany, 23–24 May 2011; pp. 330–339. [Google Scholar] [CrossRef]
  2. Zhang, Y.; Hu, B.; Dai, Y.; Yang, H.; Huang, W.; Xue, X.; Li, F.; Zhang, X.; Jiang, C.; Gao, F.J.C.; et al. A new multichannel spectral imaging laser scanning confocal microscope. Comput. Math. Methods Med. 2013, 2013, 890203. [Google Scholar] [CrossRef] [PubMed]
  3. Liu, Y.-C.; Chiang, A.-S.J.M. High-resolution confocal imaging and three-dimensional rendering. Methods 2003, 30, 86–93. [Google Scholar] [CrossRef] [PubMed]
  4. Jennifer, C.J.B. Phototoxicity in Live Fluorescence Microscopy, and How to Avoid It. BioEssays 2017, 39, 1700003. [Google Scholar]
  5. Dobrucki, J.W.; Feret, D.; Noatynska, A.J.B.j. Scattering of exciting light by live cells in fluorescence confocal imaging: Phototoxic effects and relevance for FRAP studies. Biophys. J. 2007, 93, 1778–1786. [Google Scholar] [CrossRef]
  6. Toriumi, A.; Kawata, S.; Gu, M. Reflection confocal microscope readout system for three-dimensional photochromic optical data storage. Opt. Lett. 1998, 23, 1924–1926. [Google Scholar] [CrossRef]
  7. Lavrentovich, O.D. Confocal Fluorescence Microscopy; Wiley: Hoboken, NJ, USA, 2002; pp. 1–15. [Google Scholar]
  8. Bertero, M.; Boccacci, P.; Brakenhoff, G.J.; Malfanti, F.; Van der Voort, H.T.M. Three-dimensional image restoration and super-resolution in fluorescence confocal microscopy. J. Microsc. 1990, 157, 3–20. [Google Scholar] [CrossRef]
  9. Tomita, Y.; Kubis, N.; Calando, Y.; Dinh, A.T.; Méric, P.; Seylaz, J.; Pinard, E. Long-term in vivo investigation of mouse cerebral microcirculation by fluorescence confocal microscopy in the area of focal ischemia. J. Cereb. Blood Flow Metab. 2005, 25, 858–867. [Google Scholar] [CrossRef]
  10. Rajadhyaksha, M.; Anderson, R.R.; Webb, R.H. Video-rate confocal scanning laser microscope for imaging human tissues in vivo. Appl. Opt. 1999, 38, 2105–2115. [Google Scholar] [CrossRef]
  11. Böhnke, M.; Masters, B.R. Confocal microscopy of the cornea. Prog. Retin. Eye Res. 1999, 18, 553–628. [Google Scholar] [CrossRef] [PubMed]
  12. Guthoff, R.F.; Zhivov, A.; Stachs, O. In vivo confocal microscopy, an inner vision of the cornea—A major review. Clin. Exp. Ophthalmol. 2009, 37, 100–117. [Google Scholar] [CrossRef] [PubMed]
  13. Ortega-Arroyo, J.; Kukura, P. Interferometric scattering microscopy (iSCAT): New frontiers in ultrafast and ultrasensitive optical microscopy. Opt. Express 2012, 14, 15625–15636. [Google Scholar] [CrossRef] [PubMed]
  14. Taylor, R.W.; Sandoghdar, V. Interferometric scattering (iSCAT) microscopy and related techniques. In Label-Free Super-Resolution Microscopy; Springer: Cham, Switzerland, 2019; pp. 25–65. [Google Scholar] [CrossRef]
  15. Ortega Arroyo, J.; Cole, D.; Kukura, P. Interferometric scattering microscopy and its combination with single-molecule fluorescence imaging. Nat. Protoc. 2016, 11, 617–633. [Google Scholar] [CrossRef] [PubMed]
  16. Jünger, F.; Olshausen, P.V.; Rohrbach, A. Fast, label-free super-resolution live-cell imaging using rotating coherent scattering (ROCS) microscopy. Sci. Rep. 2016, 6, 30393. [Google Scholar] [CrossRef]
  17. Ruh, D.; Mutschler, J.; Michelbach, M.; Rohrbach, A. Superior contrast and resolution by image formation in rotating coherent scattering (ROCS) microscopy. Optica 2018, 5, 1371–1381. [Google Scholar] [CrossRef]
  18. Saguy, A.; Jünger, F.; Peleg, A.; Ferdman, B.; Nehme, E.; Rohrbach, A.; Shechtman, Y.J. Deep-ROCS: From speckle patterns to superior-resolved images by deep learning in rotating coherent scattering microscopy. Opt. Express 2021, 29, 23877–23887. [Google Scholar] [CrossRef] [PubMed]
  19. Im, K.-B.; Han, S.; Park, H.; Kim, D.; Kim, B.-M. Simple high-speed confocal line-scanning microscope. Opt. Express 2005, 13, 5151–5156. [Google Scholar] [CrossRef]
  20. Wolleschensky, R.; Zimmermann, B.; Kempe, M. High-speed confocal fluorescence imaging with a novel line scanning microscope. J. Biomed. Opt. 2006, 11, 064011. [Google Scholar] [CrossRef]
  21. Petráň, M.; Hadravský, M.; Egger, M.D.; Galambos, R. Tandem-scanning reflected-light microscope. J. Opt. Soc. Am. 1968, 58, 661–664. [Google Scholar] [CrossRef]
  22. York, A.G.; Parekh, S.H.; Dalle Nogare, D.D.; Fischer, R.S.; Temprine, K.; Mione, M.; Chitnis, A.B.; Combs, C.A.; Shroff, H. Resolution doubling in live, multicellular organisms via multifocal structured illumination microscopy. Nat. Methods 2012, 9, 749–754. [Google Scholar] [CrossRef] [PubMed]
  23. York, A.G.; Chandris, P.; Nogare, D.D.; Head, J.; Wawrzusin, P.; Fischer, R.S.; Chitnis, A.; Shroff, H. Instant super-resolution imaging in live cells and embryos via analog image processing. Nat. Methods 2013, 10, 1122–1126. [Google Scholar] [CrossRef]
  24. Curd, A.; Cleasby, A.; Makowska, K.; York, A.; Shroff, H.; Peckham, M. Construction of an instant structured illumination microscope. Methods 2015, 88, 37–47. [Google Scholar] [CrossRef] [PubMed]
  25. Mahecic, D.; Gambarotto, D.; Douglass, K.M.; Fortun, D.; Banterle, N.; Ibrahim, K.A.; Le Guennec, M.; Gönczy, P.; Hamel, V.; Guichard, P.; et al. Homogeneous multifocal excitation for high-throughput super-resolution imaging. Nat. Methods 2020, 17, 726–733. [Google Scholar] [CrossRef] [PubMed]
  26. Sheppard CJ, R.; Mehta, S.B.; Heintzmann, R. Superresolution by image scanning microscopy using pixel reassignment. Opt. Lett. 2013, 38, 2889–2892. [Google Scholar] [CrossRef] [PubMed]
  27. Descloux, A.; Grußmayer, K.S.; Radenovic, A. Parameter-free image resolution estimation based on decorrelation analysis. Nat. Methods 2019, 16, 918–924. [Google Scholar] [CrossRef] [PubMed]
  28. Bai, C.; Yu, X.; Peng, T.; Liu, C.; Min, J.; Dan, D.; Yao, B. 3D Imaging Restoration of Spinning-Disk Confocal Microscopy Via Deep Learning. IEEE Photonics Technol. Lett. 2020, 32, 1131–1134. [Google Scholar] [CrossRef]
Figure 1. Full telecentric optical system.
Photonics 12 00022 g001
Figure 2. Verification of improving resolution with photon reassignment module.
Photonics 12 00022 g002
Figure 3. Schematic diagram of multi-point confocal microscope.
Photonics 12 00022 g003
Figure 4. Multi-point confocal microscopy system.
Photonics 12 00022 g004
Figure 5. Schematic diagram of timing design.
Photonics 12 00022 g005
Figure 6. Scanning results obtained under (a) laser illumination and (b) telecentric LED illumination. (c,d) Color bar annotation of the ROIs highlighted in (a,b), respectively.
Photonics 12 00022 g006
Figure 7. Dot array imaging results: (a) Dot array image without photon reassignment module; (b) Dot array image with photon reassignment module; (c) Enlarged image of a single light spot without photon reassignment module; (d) Enlarged image of a single light spot with photon reassignment module; (e) Intensity curve corresponding to the colored line segments in (c,d).
Photonics 12 00022 g007
Figure 8. Resolution panel imaging results: (a) resolution panel image without photon reassignment module, (b) resolution panel image with photon reassignment module, (c) corresponding image (a) enlarged image with red box, (d) corresponding image (b) enlarged image with red box, (e) resolution calculation result without photon reassignment module, (f) resolution calculation result with photon reassignment module, (g) corresponding to the intensity curve of the colored line segments in (c,d).
Photonics 12 00022 g008
Figure 9. Imaging 100 nm metal particles (a) without and (b) with the photon reassignment module; (c) intensity curves corresponding to the colored line segments in (a,b).
Photonics 12 00022 g009
Figure 10. Imaging results of fresh pig cornea: (a) Scanning image of pig cornea with a frame size of 500 µm × 500 µm, scale bar: 100 µm. The region indicated by the blue arrow clearly shows the cell structure; (b) The process of making simple specimens; (c) The intensity curve corresponding to the colored line segment in (a).
Photonics 12 00022 g010
Table 1. Main optical components of multi-point confocal microscopy system.
No.Component SpecificationManufacturer
1Telecentric LED source, ESCL-PX20-5W-R, dominant wavelength 635 nmKunshan Jiji Visual Software Co., Ltd., Shenzhen, China
2galvanometer, SS-9310DSunny, Beijing, China
3polarization beam splitter, PBS642, anti-reflection coating 620–1000 nmLBTEK, Shenzhen, China
4quarter-wave plate, QWP25-633A-MLBTEK, Shenzhen, China
5F-theta lensesNOVEL, Ningbo, China
6Relay lens, E0351-180Domilight, Nanjing, China
7Pinhole array1, diameter of a single point 18 μmWiener (Shenzhen) Trading Co., Ltd., Shenzhen, China
8Pinhole array2, diameter of a single point 50 μm
9Micro lens array, APO-Q-P200-R2.23Advanced micro-optic systems GmbH, Saarbrücken, Germany
10Tube lens, TTL200Thorlabs, Newton, NJ, USA
11objective, MY-20X-804, 20×, NA0.42Mitutoyo, Kanagawa, Japan
12camera, C15440-20UP, 2304 × 2304 pixelsHAMAMATSU, Hamamatsu, Japan
13Ground Data Collection Card, PCIe-6738NI, Austin, TX, USA
14Laser, 647 nm, 100 mwCoherent, Saxonburg, PA, USA
15Rotating diffuser, ODDA101-1500JCOPTiX, Nanjing, China
16Micro lens array1 and 2, APO-Q-P300-R0.94Advanced micro-optic systems GmbH, Saarbrücken, Germany
17Fourier lens, OLD3270-T2M, f = 300 mmJCOPTiX, Nanjing, China
Disclaimer/Publisher’s Note: The statements, opinions and data contained in all publications are solely those of the individual author(s) and contributor(s) and not of MDPI and/or the editor(s). MDPI and/or the editor(s) disclaim responsibility for any injury to people or property resulting from any ideas, methods, instructions or products referred to in the content.