Abstract
Additive manufacturing (AM) technology has found extensive applications in aerospace, medical, and automotive fields. Defect detection technology remains a research focus in AM process monitoring. While machine learning and neural network algorithms have recently achieved significant advancements in innovative applications for AM defect detection, practical implementations still face challenges, including insufficient detection accuracy and poor system robustness. To address these limitations, this study proposes the YOLOv5-CAD defect detection model. Firstly, the convolutional block attention module (CBAM) is introduced into the core feature extraction module C3 of the backbone network to enhance attention to critical information and improve multi-scale defect target adaptability. Secondly, the original CIoU loss function is replaced with the Alpha-IoU loss function to accelerate network convergence and strengthen system robustness. Additionally, a fully decoupled detection head substitutes the original coupled head in the YOLOv5s model, separating the object classification and bounding box regression tasks to improve detection accuracy. Finally, a polarization technology-based visual monitoring system is developed to acquire defect images of laser AM workpieces, establishing the model’s training sample database. Compared with YOLOv5, the proposed model demonstrates a 2.5% improvement in precision (P), 2.2% enhancement in recall (R), 3.1% increase in mean average precision (mAP50), and 3.2% elevation in mAP50-95. These quantitative improvements confirm the model’s capability to provide robust and real-time technical solutions for industrial AM quality monitoring, effectively addressing current limitations in defect detection accuracy and system reliability.
1. Introduction
Additive manufacturing (AM), also referred to as “3D printing”, “solid freeform fabrication”, or “rapid prototyping”, is an advanced digital manufacturing technology developed over the past three decades [1]. It integrates digital modeling, electromechanical control systems, computer information technologies, and materials science, offering transformative advantages, such as high competitiveness, cost-effectiveness, and exceptional manufacturing flexibility. In 1984, Charles Hull secured the first patent for 3D printing technology and successfully commercialized it, marking a pivotal milestone in the evolution of AM. Unlike traditional “subtractive manufacturing” methods that typically adopt a “top-down” processing approach, additive manufacturing employs a “bottom-up” fabrication strategy. This approach eliminates the need for complex fixtures and multi-step processing procedures while significantly reducing raw material waste through layer-by-layer material deposition [2]. This technology is applicable to various specialty metals, non-metallic materials, and medical biomaterials, such as alloys, ceramics, silicone, hydrogels, and composite materials. The advantages of additive manufacturing lie in its capability to shorten processing time, enable localized control of material properties, rapidly fabricate complex components, integrate design and manufacturing processes, facilitate personalized customization, repair diverse mechanical parts, and process free-form components [3]. This approach thus ensures the manufacturability of multi-material and multi-scale topology-optimized configurations, serving as an effective implementation approach for transitioning from segmented design–manufacturing processes to digital design–manufacturing integration. This technology is widely applied in the aerospace, transportation, nuclear power, military, medical device, energy, and automotive manufacturing industries. Currently, additive manufacturing has garnered extensive attention and high priority from both industrial and academic communities, with governments globally formulating policy plans to provide strategic support. Under national strategic frameworks, such as “Made in China 2025”, the U.S. “National Strategic Plan for Advanced Manufacturing”, and Germany’s “Industry 4.0 Implementation Recommendations”, AM has been positioned as a key development area, giving rise to diverse manufacturing technologies. Among these, metal additive manufacturing technology—the most advanced and challenging frontier within the AM system—represents a critical direction for advanced manufacturing development. It holds significant potential to drive cross-generational advancements in high-end industrial equipment structures through its capability as a pivotal technological pathway. Current metal additive manufacturing technologies can be categorized into two classes based on their operational stages in metal component fabrication: direct metal AM and indirect metal AM. The former refers to technologies that directly fuse metal materials to form metallurgical bonds during the AM process, such as selective laser melting (SLM) and directed energy deposition (DED). The latter involves AM processes acting primarily during the forming stage, requiring subsequent metallurgical treatments, like casting, sintering, or diffusion bonding—examples include selective laser sintering (SLS) of casting patterns and metal jetting 3D printing technologies [4]. However, due to the unique manufacturing process of metal AM components, various defects inevitably arise in these structures, posing significant safety risks to high-precision industries. However, extreme conditions such as high temperature, strong light, and powder during manufacturing pose a huge challenge for defect detection [5]. Consequently, the detection and identification of defect types in metal AM components hold critical importance, as they not only enhance material utilization efficiency but also ensure the operational safety of industrial applications. Traditional non-destructive defect detection methods encompass radiographic testing, ultrasonic testing, liquid penetrant testing, magnetic particle testing, and eddy current testing [6]. However, these methods are costly, operationally complex, and slow in detection speed, or they impose specific limitations on the test objects, failing to balance detection accuracy with efficiency, thus limiting their applicability. Given the expanding and increasingly dynamic market demands, these traditional approaches may no longer adequately meet production requirements in certain scenarios. Therefore, developing a more efficient and cost-effective defect detection methodology is imperative.
In recent years, rapid advancements in deep learning technology, along with the application of diverse machine learning and deep learning techniques to the monitoring of additive manufacturing, have driven a gradual integration toward intelligent manufacturing, with substantial future potential. Yang et al. proposed a multi-class detection method for different defect types (cracks, protrusions, and pits) in metal AM components using laser-induced breakdown spectroscopy (LIBS) combined with an SVM algorithm, and experimentally validated its efficacy [7]. Xia et al. proposed the application of deep learning to visual monitoring for diagnosing various defects (e.g., humps, spatters, pores, and cracks) during wire arc additive manufacturing (WAAM). A visual monitoring system was employed to collect molten pool images of different defects for model training, and the classification performance of convolutional neural networks (ResNet, EfficientNet, VGG-16, and GoogLeNet) was compared, achieving classification accuracies of 97.62%, 97.45%, 97.15%, and 97.25%, respectively [8]. Zhang et al. developed a hybrid CNN architecture for online detection of four types of defects (overheating, normal, irregular, and balling) in PBF metal additive manufacturing processes, achieving a high detection accuracy of 99.7% [9,10]. Meng et al. improved the Mask R-CNN instance segmentation algorithm for surface defects in the current printing layer of wire arc additive manufacturing (WAAM). A channel attention module was embedded into the ResNet101 feature extraction network of Mask R-CNN, enhancing the network’s ability to extract defect-related features [11].
Although the aforementioned deep learning-based methods have achieved high detection accuracy, practical applications often require models to balance both detection speed and accuracy. In comparison, single-stage object detection networks, such as the YOLO series, demonstrate advantages in speed and real-time performance. Based on the YOLOv4 object detection algorithm, Li proposed a novel deep learning-based automated WAAM surface defect detection scheme, named YOLO-attention, by optimizing the model algorithm for the characteristics of the defects in WAAM. This approach achieves real-time, rapid, and accurate detection of defects such as porosity, undercut, and protrusion in welding beads during the WAAM production process.
In the field of image quality enhancement, researchers have made substantial efforts in polarization imaging and experimental methodologies. For instance, Lin et al. demonstrate the potential application value of polarization imaging technology in underwater imaging. By integrating Transformer and CNN models, they achieved efficient reconstruction of underwater targets. This method not only enhances imaging clarity but also demonstrates excellent generalization capabilities, significantly contributing to the advancement of the development of underwater imaging technology [12]. Li et al. demonstrate the potential application value of polarization imaging technology in depolarizing sample characterization. By integrating IPP and PRT spaces, they established a novel framework for characterizing depolarizing samples, enabling accurate inference of microscopic physical properties of materials. The proposed method exhibits generality and holds significant implications for diverse applications involving depolarizing sample analysis [13]. Fan et al. applied polarization imaging technology to scattering medium imaging. By integrating Swin Transformer and CNN models, they achieved efficient reconstruction of targets within scattering media, significantly contributing to the advancement of the development of scattering medium imaging technology [14]. Fan et al. demonstrated the potential application value of polarization imaging technology in all-weather road detection. By designing a lightweight multi-path collaborative 2D/3D convolutional network (LMPC2D3DCNet), they achieved efficient detection of road regions in long-wave infrared (LWIR) polarization images. This method integrates local and global polarization correlations, not only improving the accuracy of road detection but also maintaining the lightweight design of the model, significantly enhancing detection efficiency and surpassing existing state-of-the-art methods [15].
Aiming at the problem of surface defect detection of additive manufacturing components, combined with the research of the related literature, the problem of target detection in detection was studied to improve the defect detection performance of the existing model [16,17,18,19,20,21]. In this study, based on YOLOv5s, the following modifications are made to the YOLOv5 network structure to further improve detection accuracy in defect detection: (1) Introduction of the CBAM attention mechanism and proposal of the C3_CBAM module to enhance the backbone layer’s focus on critical information; (2) adoption of the AlphaIoU loss function to accelerate network convergence and improve the model’s robustness; and (3) decoupling of the detection head to enhance the accuracy of model detection. After proposing the YOLOv5-CAD method, this study subsequently trained the model using defect images of additively manufactured workpieces collected by a polarization imaging-based visual monitoring system.
The main contributions of this paper are as follows:
- By integrating the CBAM attention mechanism with the bottleneck structure and incorporating it into the C3 module of YOLOv5, the model can effectively fuse spatial and channel-wise information. This integration enhances the network’s ability to capture positional and detailed features of target regions while improving multi-scale target adaptation capabilities, ensuring high practical efficiency and helping to extract better features to identify defects more effectively and comprehensively.
- The detection head of the YOLOv5 model is decoupled. By allocating the classification, localization, and confidence losses to distinct channels within the same feature map, the classification branch can focus on object category information, while the regression branch specializes in bounding box localization, effectively reducing conflicts between the two tasks.
- To meet the precision and production efficiency requirements for defect detection in additive manufacturing workpieces, a novel defect detection network architecture named YOLOv5-CAD is proposed. Building upon the original YOLOv5 framework, this method incorporates the CBAM attention mechanism, decouples the detection head, and replaces the original CIoU loss with the more flexible Alpha IoU loss, significantly enhancing the network’s detection accuracy
The structure of this paper is organized as follows: Section 2 introduces the defect image acquisition system and the implementation methods for defect detection experiments; Section 3 primarily describes the YOLOv5s model, which integrates the CBAM attention mechanism, AlphaIoU loss function, and decoupled detection head to form the YOLOv5-CAD model; Section 4 presents the experiments for training the defect detection model and analyzes the results; and Section 5 summarizes the study, discusses its implications, and outlines future research directions.
2. Polarimetric Imaging and Defect Detection Method of Specular AM Surfaces
2.1. Image Acquisition System
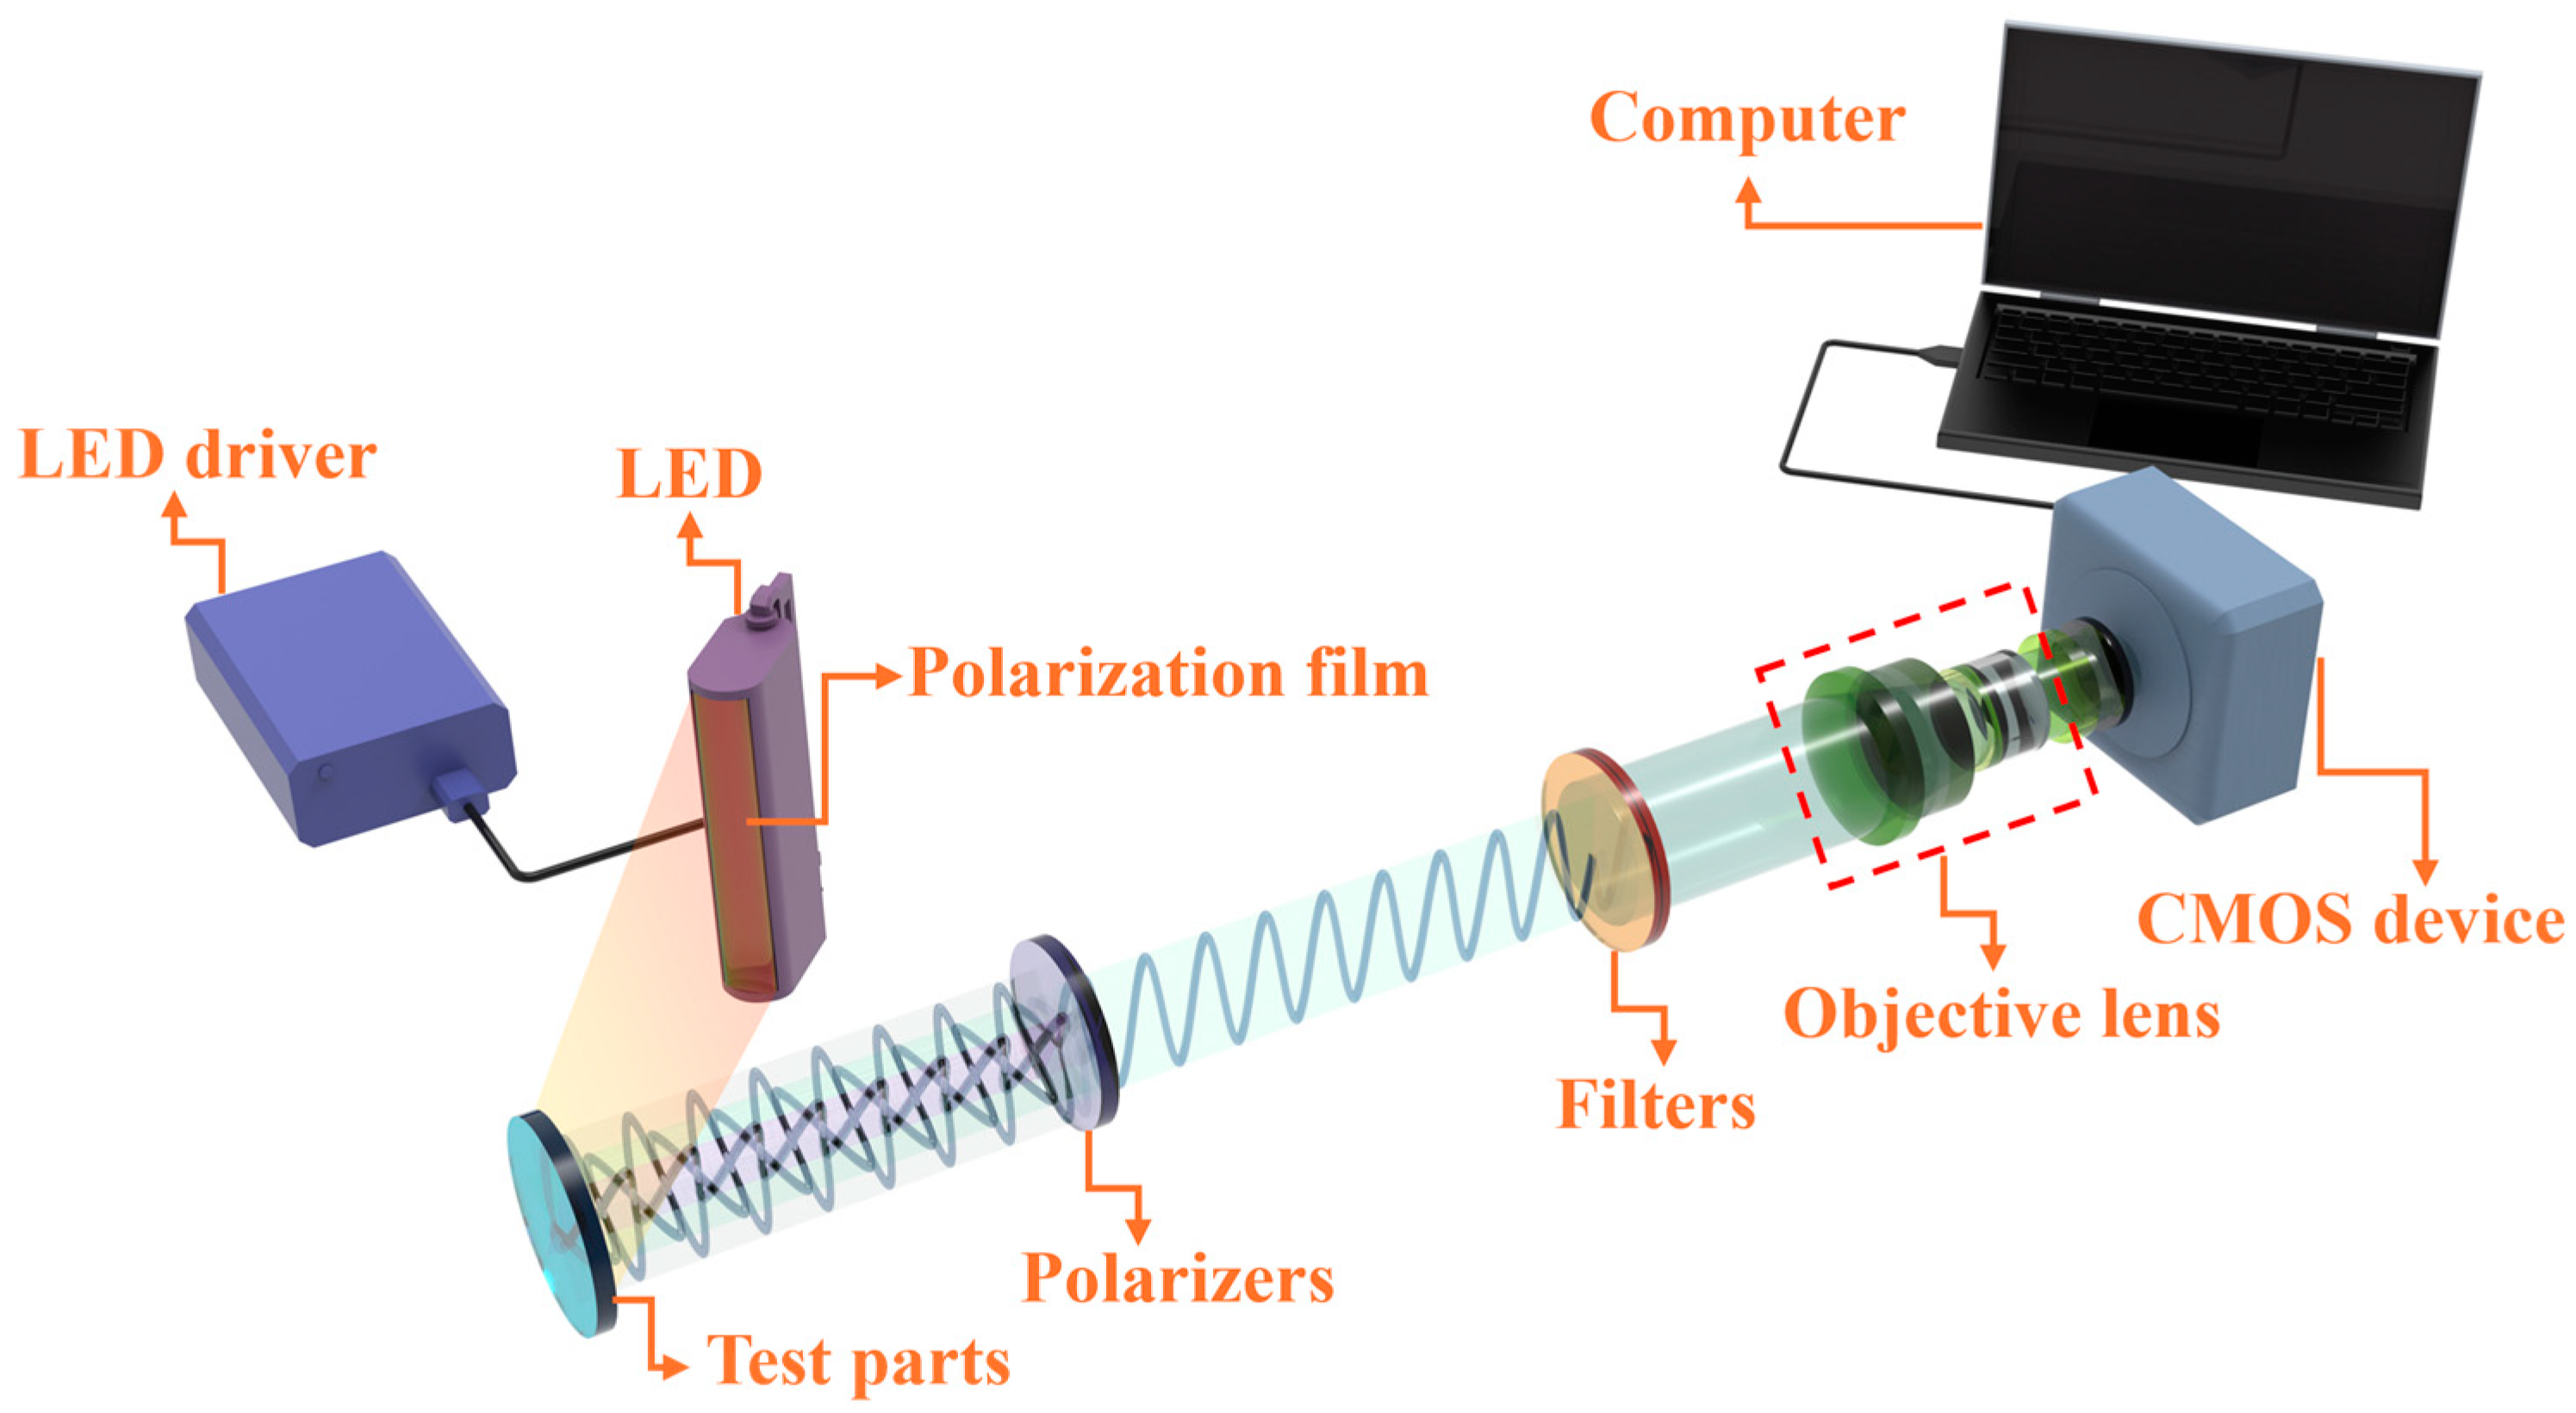
An image acquisition system typically includes illumination equipment, optics, sensors, and signal processing units. The choice of imaging method determines the efficiency and accuracy of defect detection. In this study, a visual monitoring system based on polarization technology was built to acquire images of defects in laser additive manufacturing workpieces, as shown in Figure 1. Metal components fabricated via AM often exhibit a pronounced reflectivity, leading to challenges in defect detection. Specifically, when employing reflective illumination-based inspection systems on such highly reflective surfaces, the intense reflected light frequently causes pixel saturation in image sensors. This phenomenon obscures crucial defect data, complicating efforts to isolate and analyze flawed regions. Consequently, mitigating the impact of strong reflective interference during the inspection of common metallic surface defects emerges as a significant area for research. In contrast to conventional optical inspection methodologies, polarization imaging presents distinct advantages. It facilitates the acquisition of comprehensive data encompassing spectral attributes, polarization characteristics, and spatial details of the examined objects. This multifaceted information-harvesting capability has fostered its widespread adoption across diverse fields, including industrial imaging, remote sensing, medical diagnostics, and defense applications. Leveraging polarization technology for defect detection proves instrumental in deciphering intricate details, like textural composition, material properties, and surface texture, from the polarization signatures of the target. Such enhanced insight substantially bolsters both the precision and dependability of defect identification processes.

Figure 1.
Visual detection system based on polarization technology.
The inspection system mainly includes the workpiece to be tested, LED light source, linear polarizer, motorized rotating stand, CMOS camera, and computer. The surface of the metal workpiece to be tested has a high reflection phenomenon; the computer-controlled rotating bracket is used to adjust the angle of the polarizer and the acquisition of four groups of defect detection images of different polarization angles; after the Stokes vector method processing, the workpiece defects are used to complete the acquisition of the image.
In this study, the images used for training and testing were acquired by the aforementioned acquisition system. The study primarily collected two common types of defect images: porosity and crack; the distribution of each category and the defect characteristics are shown in Table 1.

Table 1.
Porosity and crack defect images and their feature distribution.
2.2. Detection Process
Figure 2 illustrates the implementation methodology of the proposed YOLOv5-CAD in this study; it encompasses three main stages: dataset generation, model training, and performance evaluation. Firstly, a polarization technology-based visual monitoring system is constructed to collect defect images of laser additive manufacturing workpieces. The acquired images are then annotated with defect categories and positional information using LabelImg(1.8.6), and the annotations are saved in txt format for network training. During the training phase, Mosaic data augmentation is applied to fuse training images, enhancing the model’s robustness. Subsequently, to improve defect detection accuracy, the YOLOv5-CAD model is designed by integrating the CBAM attention mechanism, Alpha IoU loss function, and decoupled detection head. Technical details of these components are thoroughly discussed in Section 3. In the evaluation phase, images are cropped to match the training input dimensions, ensuring consistency between inference and training logic. A performance metric system is established, including accuracy, recall, and mean average precision. Comparative analyses with other deep learning-based defect detection algorithms are conducted to validate the superiority of the proposed method and its effectiveness in production line inspection.
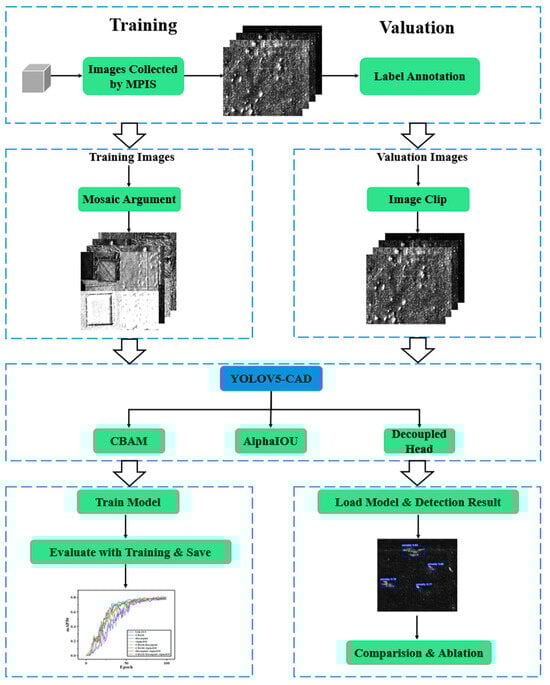
Figure 2.
The implementation of YOLOV5-CAD in this study.
3. Principle of the YOLOV5-CAD Defect Detection Model
3.1. YOLOV5 Model
The YOLOV5 is a single-stage object detection method that is used to localize and classify targets by directly regressing the relative positions of candidate frames. The structure of the YOLOV5 model consists of input, backbone, neck, and prediction. The input side adopts Mosaic data enhancement, adaptive anchor frame computation, and adaptive image scaling, which mainly solves the problems of the uneven distribution of datasets, optimal anchor frame computation, and removal of redundant information and improves the speed and accuracy of the model; the backbone layer mainly consists of CBS, C3, and SPPF [22]. The backbone layer is mainly composed of CBS, C3, and SPPF, which are used to extract the feature information of the input image to form a feature map. The neck network is composed of a feature pyramid and a path aggregation network, which is used to further process and fuse the features extracted from the backbone layer to enhance the diversity of the target feature information and strengthen the robustness of target prediction [23,24,25]. The prediction part consists of three detectors, which are used to output target frame coordinates, confidence level, and category information.
3.2. YOLOV5 Model Improvements
To improve the practical performance of YOLOV5 in the task of additive manufacturing defect detection, we made three-part improvements to YOLOV5 and established a detection model for additive manufacturing defects based on the improvements of YOLOV5: (1) Integration of the convolutional block attention module to strengthen the model’s focus on critical image information and adaptability to multi-scale targets; (2) replacement of the CIoU loss function with the AlphaIoU loss function to accelerate network convergence and improve robustness [26]; and (3) decoupling of the detection head to refine localization and classification tasks, thereby enhancing detection accuracy [27]. The YOLOV5-CAD network architecture is illustrated in Figure 3.
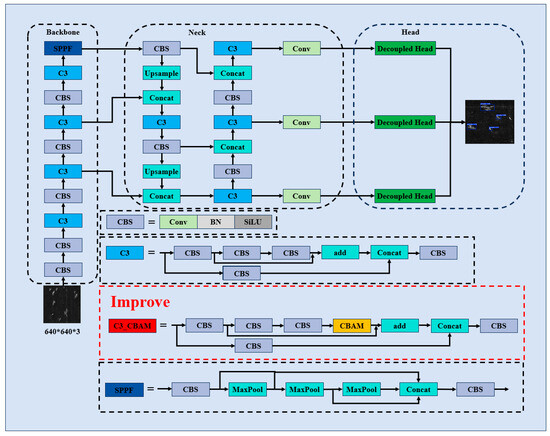
Figure 3.
Schematic diagram of YOLOv5-CAD model structure.
3.3. CBAM Attention Mechanism
Additive manufacturing surface defects occupy fewer pixels in the image, are small targets to detect, and are susceptible to background factors and other factors [28]. To address the above problems, this study introduces the CBAM attention mechanism in the backbone feature extraction module C3 to enhance the detection ability of the backbone layer for target features [29]. The CBAM attention mechanism is trained by applying weights on the channel dimension of the feature layer extracted by the backbone network [30], which enhances the network’s ability to pay attention to defective features, suppresses useless information in complex background environments, and mitigates the impact of complex backgrounds on defect detection tasks [31]. The schematic diagram of the CBAM attention mechanism is shown in Figure 4.
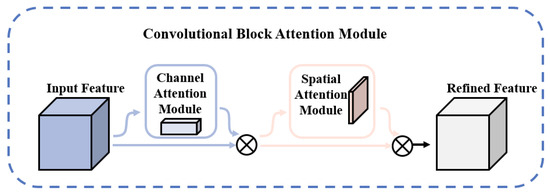
Figure 4.
Schematic diagram of the CBAM attention mechanism.
As can be seen in the above figure, CBAM contains two sub-modules, the CAM (channel attention module) and SAM (spatial attention module), which are the attention mechanisms acting on the channel and space, respectively [32].
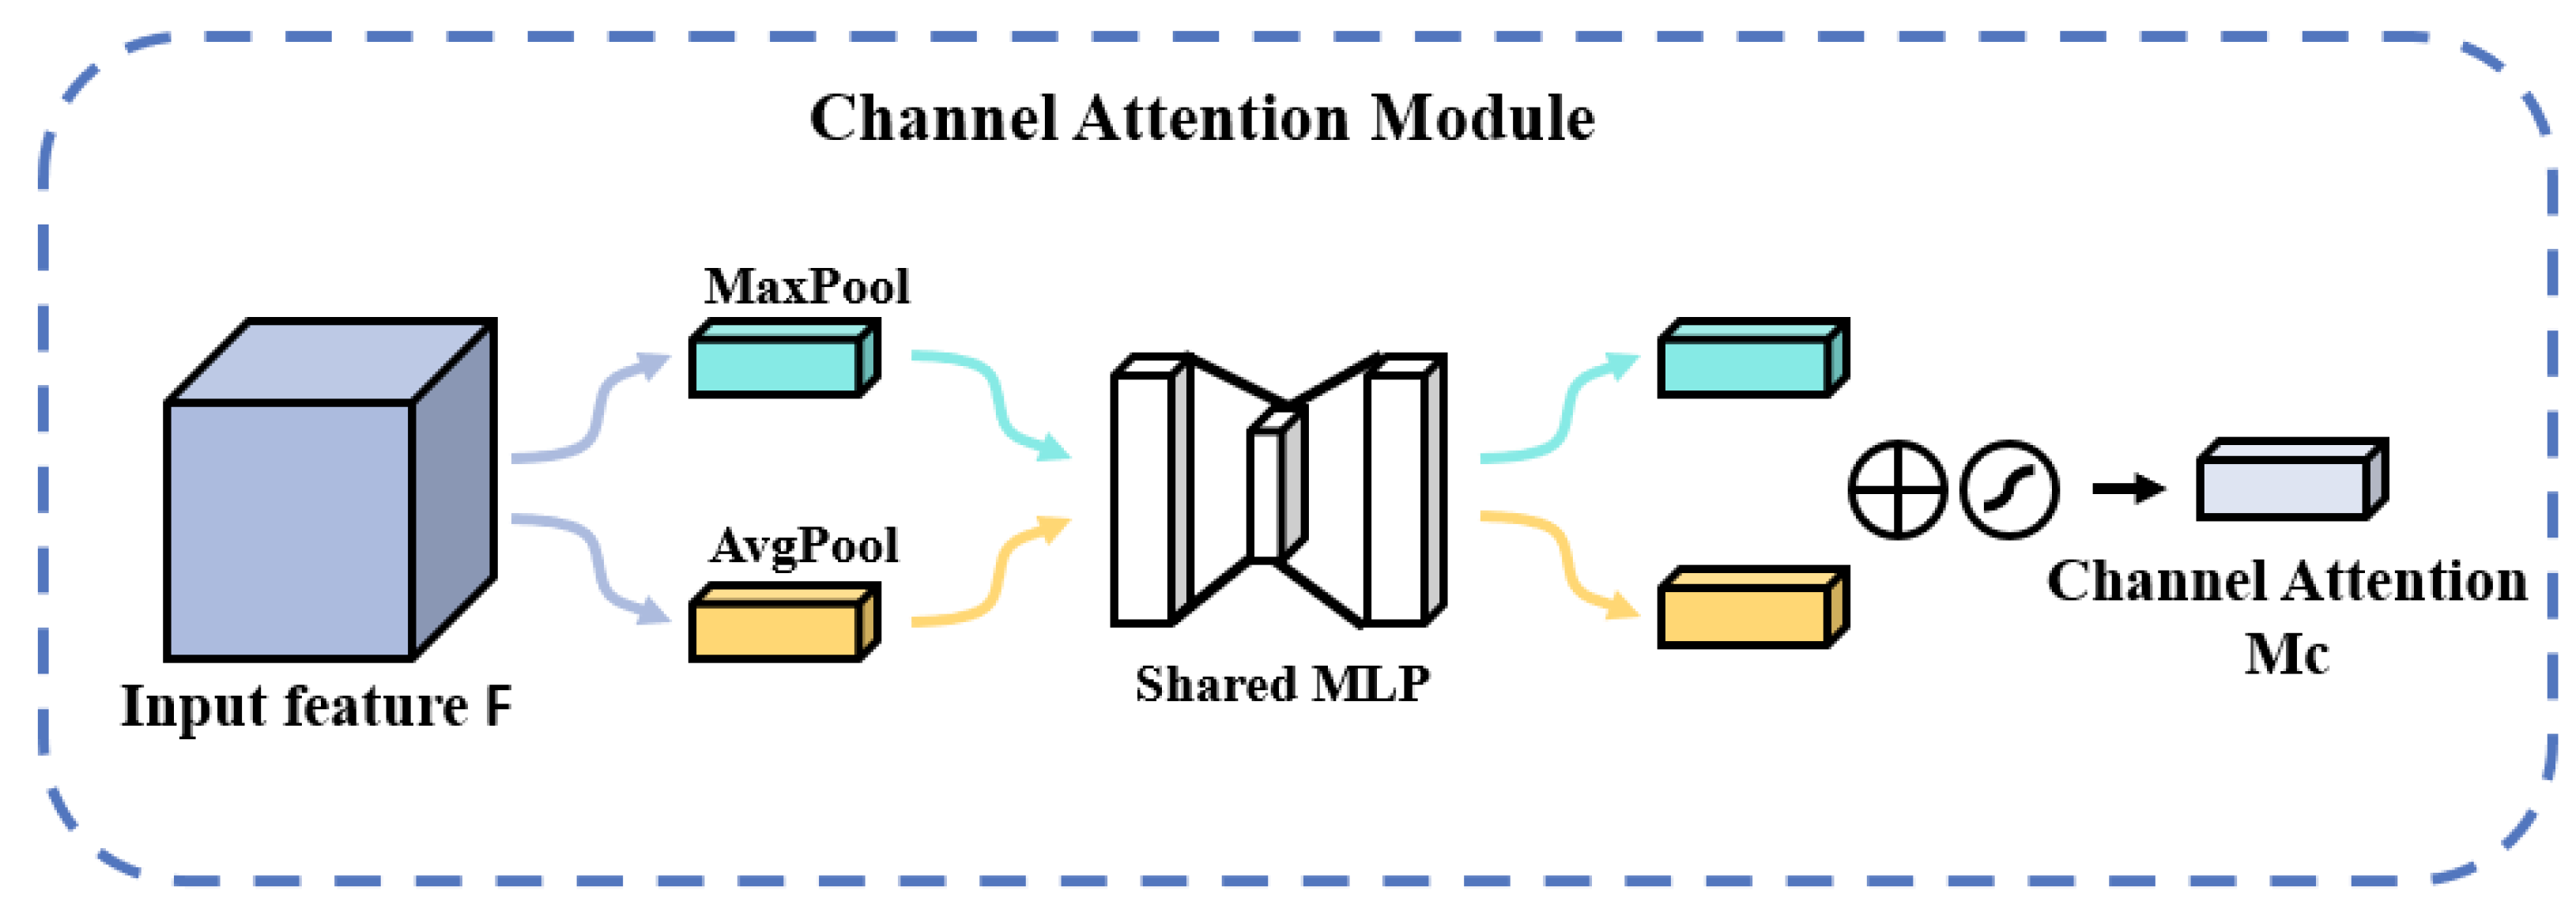
The CAM structure is shown in Figure 5. The input feature map F first passes through two parallel MaxPool and AvgPool layers to change the dimension of the feature map from C × H × W to C × 1 × 1, and then passes through the shared MLP module [33]. In this module, it first compresses the number of channels to 1/r times the original, then goes through the ReLU activation function, and then expands to the original number of channels. These two outputs are summed element by element and then passed through a sigmoid activation function to obtain the output of channel attention; then, this output is multiplied by the original map to change back to the size of C × H × W [34]. The formula for the above process is as follows:
where σ represents the sigmoid activation function; , , and the weights of MLP and are shared for the inputs; the ReLU activation function is located at after and before.
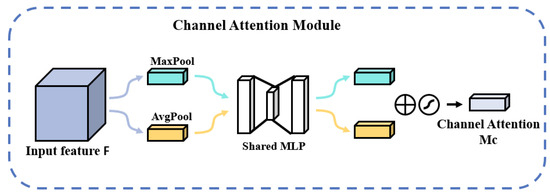
Figure 5.
Schematic diagram of the CAM structure.
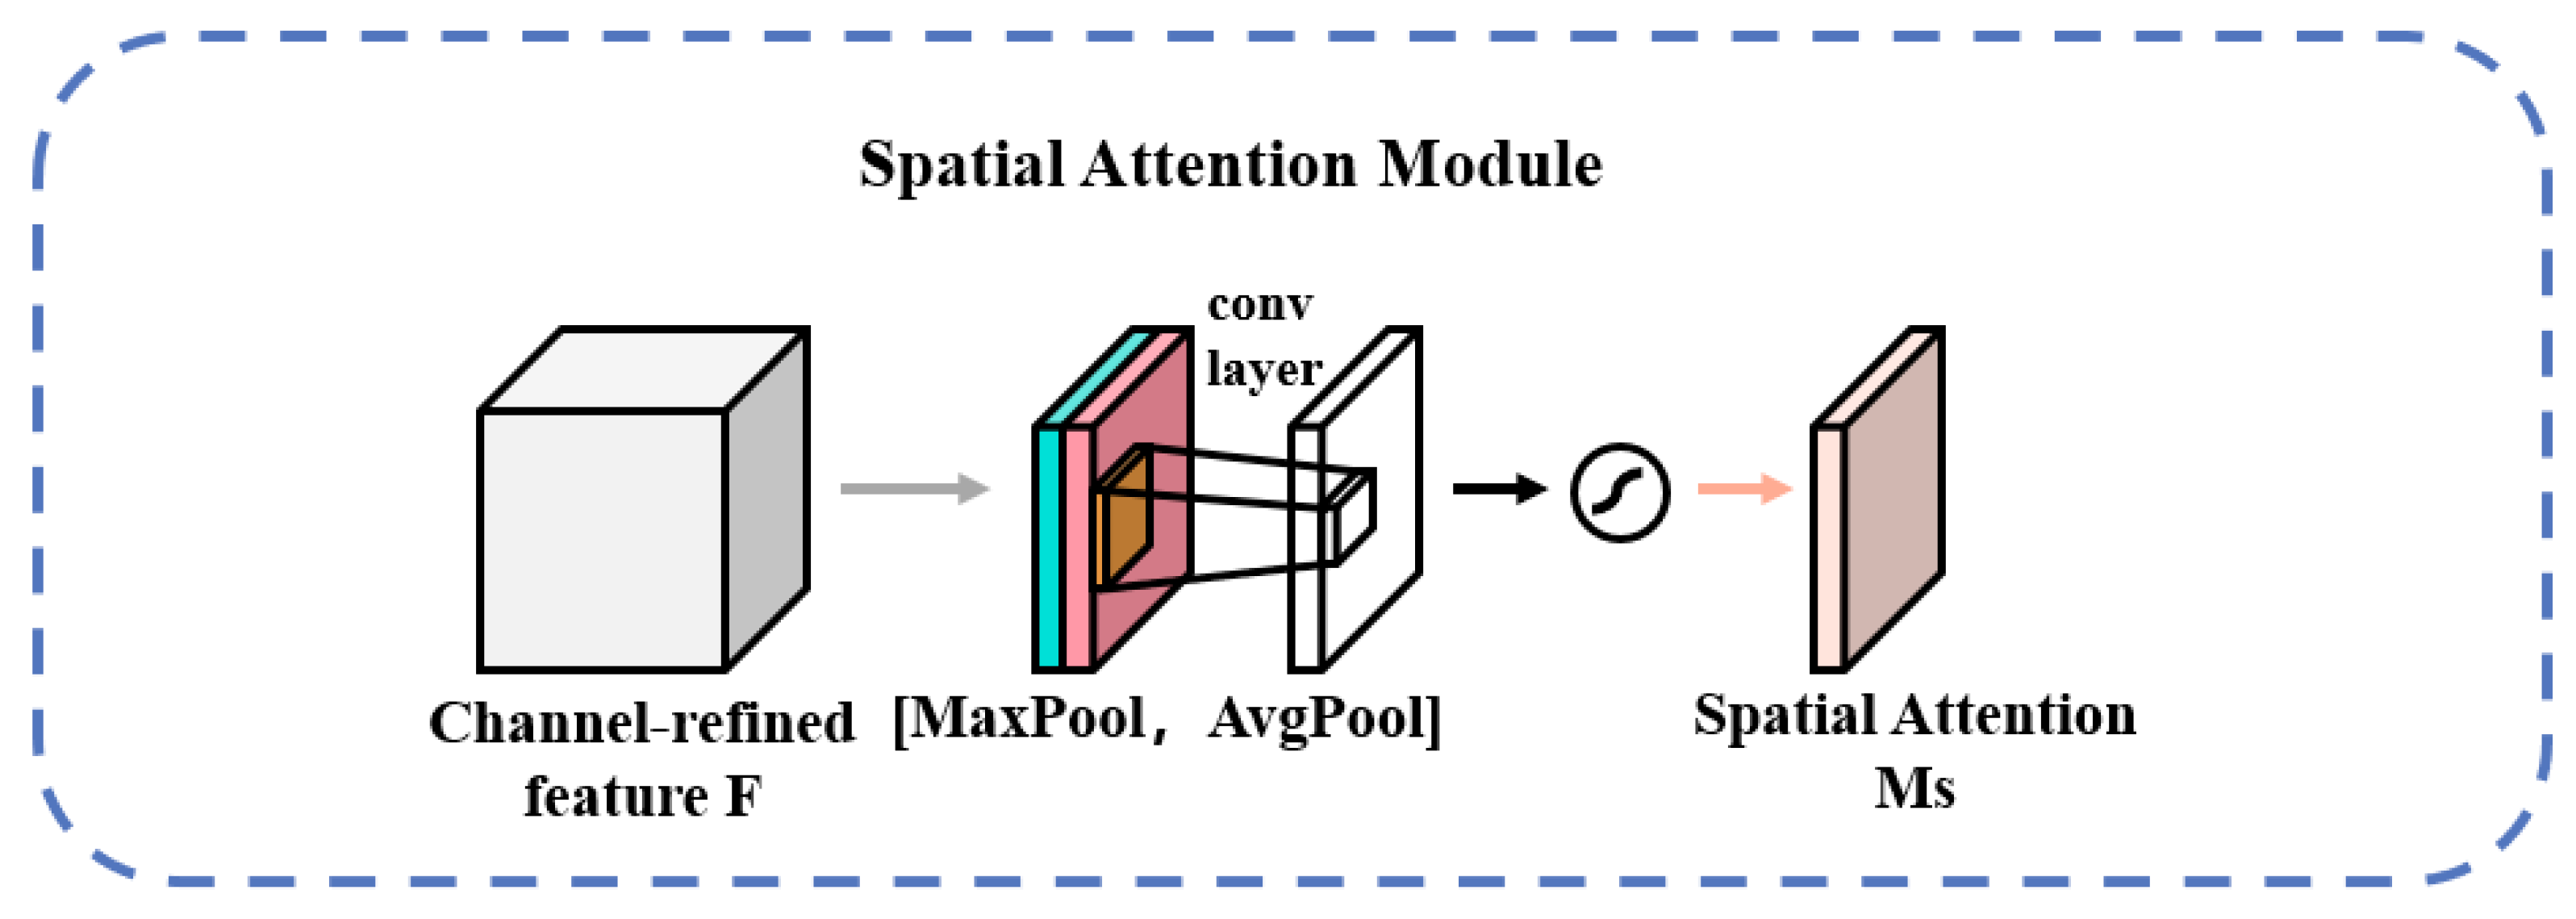
The SAM structure is shown in Figure 6. The output result of channel attention is obtained by maximum pooling and average pooling to obtain two 1 × H × W feature maps; then, the two feature maps are spliced by a Concat operation, and the number of channels of the feature maps is changed to 1 by 7 × 7 convolution; then, a sigmoid is used to obtain the feature map of spatial attention; finally, the output result is multiplied by the original input feature map and changed back to CHW size [35]. The formula for the above process is as follows:
where σ represents the sigmoid activation function, and represents the convolution kernel size of 7 × 7 in the convolution process.
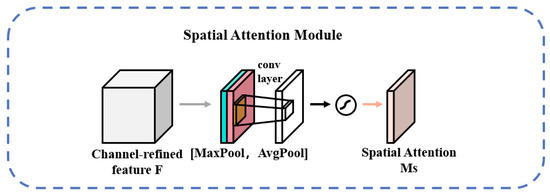
Figure 6.
Schematic diagram of the SAM structure.
In this study, the CBAM attention mechanism was introduced into the C3 module of the backbone network, which allowed the model to effectively integrate information in both spatial and channel dimensions [36]; this helps the network to obtain a large amount of location and detail information on the target region, which makes it highly efficient in practical applications and helps to improve the detection and classification ability of the overall model.
3.4. Improved Loss Function
Border regression is an important part of object detection; it is used to predict the box of the target object in order to localize the object to be detected in the image. The most commonly used method is IOULoss, which seeks the loss by the intersection and concurrency ratio of the real and predicted boxes; however, when the predicted box and the real box do not intersect, the IOULoss is 0, which cannot reflect the distance between the two boxes. The initial YOLO series algorithms used IoU to calculate the border loss, and in the subsequent versions of YOLO, GIoU (Generalized IoU), DIoU (Distance IoU), and CIoU (Complete IoU) were introduced one after another, which improved the model recognition effect accordingly [37]. GIOU solves the problem of IOULoss by introducing the minimum outer rectangle of the prediction frame and the real frame, but when the prediction frame and the real frame overlap, i.e., when they are in a containment relationship, GIOU degrades to IOU. To address the problem of GIOU, DIOU accelerates the convergence of the loss by minimizing the normalized distance of the centroid of the prediction frame and the real frame [38]. The DIOU accelerates loss convergence by minimizing the normalized distance between the prediction frame and the center of the true frame. Although DIOU accelerates the convergence by directly minimizing the distance between the centroids of the prediction frame and the rear frame, it neglects an important factor, the “aspect ratio”. CIOU improves the regression accuracy by adding an influence factor based on the penalty term of DIOU, which takes the aspect ratio of the prediction frame and the real frame into account. The CIOU is not a good choice for capturing different frames. However, CIOU performs poorly in capturing the boundary information of targets with different shapes and cannot dynamically adjust the weights of IoU, which leads to poor adaptability to different target shapes and scales.
To address the problems in the use of CIOU, the more flexible and adaptable AlphaIOU is chosen in this paper. AlphaIOU is an accelerated convergence improvement over all previous IOUs for exact bounding box regression. Convergence is accelerated by introducing an Alpha exponential term that uniformly exponentiates the existing IOU losses. Thus, adjusting the Alpha provides more flexibility to achieve different levels of accuracy in bounding box regression.
The AlphaIOU loss function is defined as shown in Equation (3).
The above loss function is extended to a general form by introducing a penalty term, as shown in Equation (4).
Based on the above general form of the loss function, the commonly used IOU loss function can be generalized, and in this paper, AlphaIOU is chosen, as shown in Equation (5).
The Euclidean distance between the predicted box and the ground truth box is denoted as , where represents the diagonal distance of the minimum enclosing region that simultaneously contains both boxes [39]. The parameter measures the consistency of aspect ratios, and serves as a balancing parameter for . The specific expressions are given in Equations (6) and (7).
where and are the aspect ratios of the real labeled and predicted boxes, respectively.
3.5. Decoupled Head
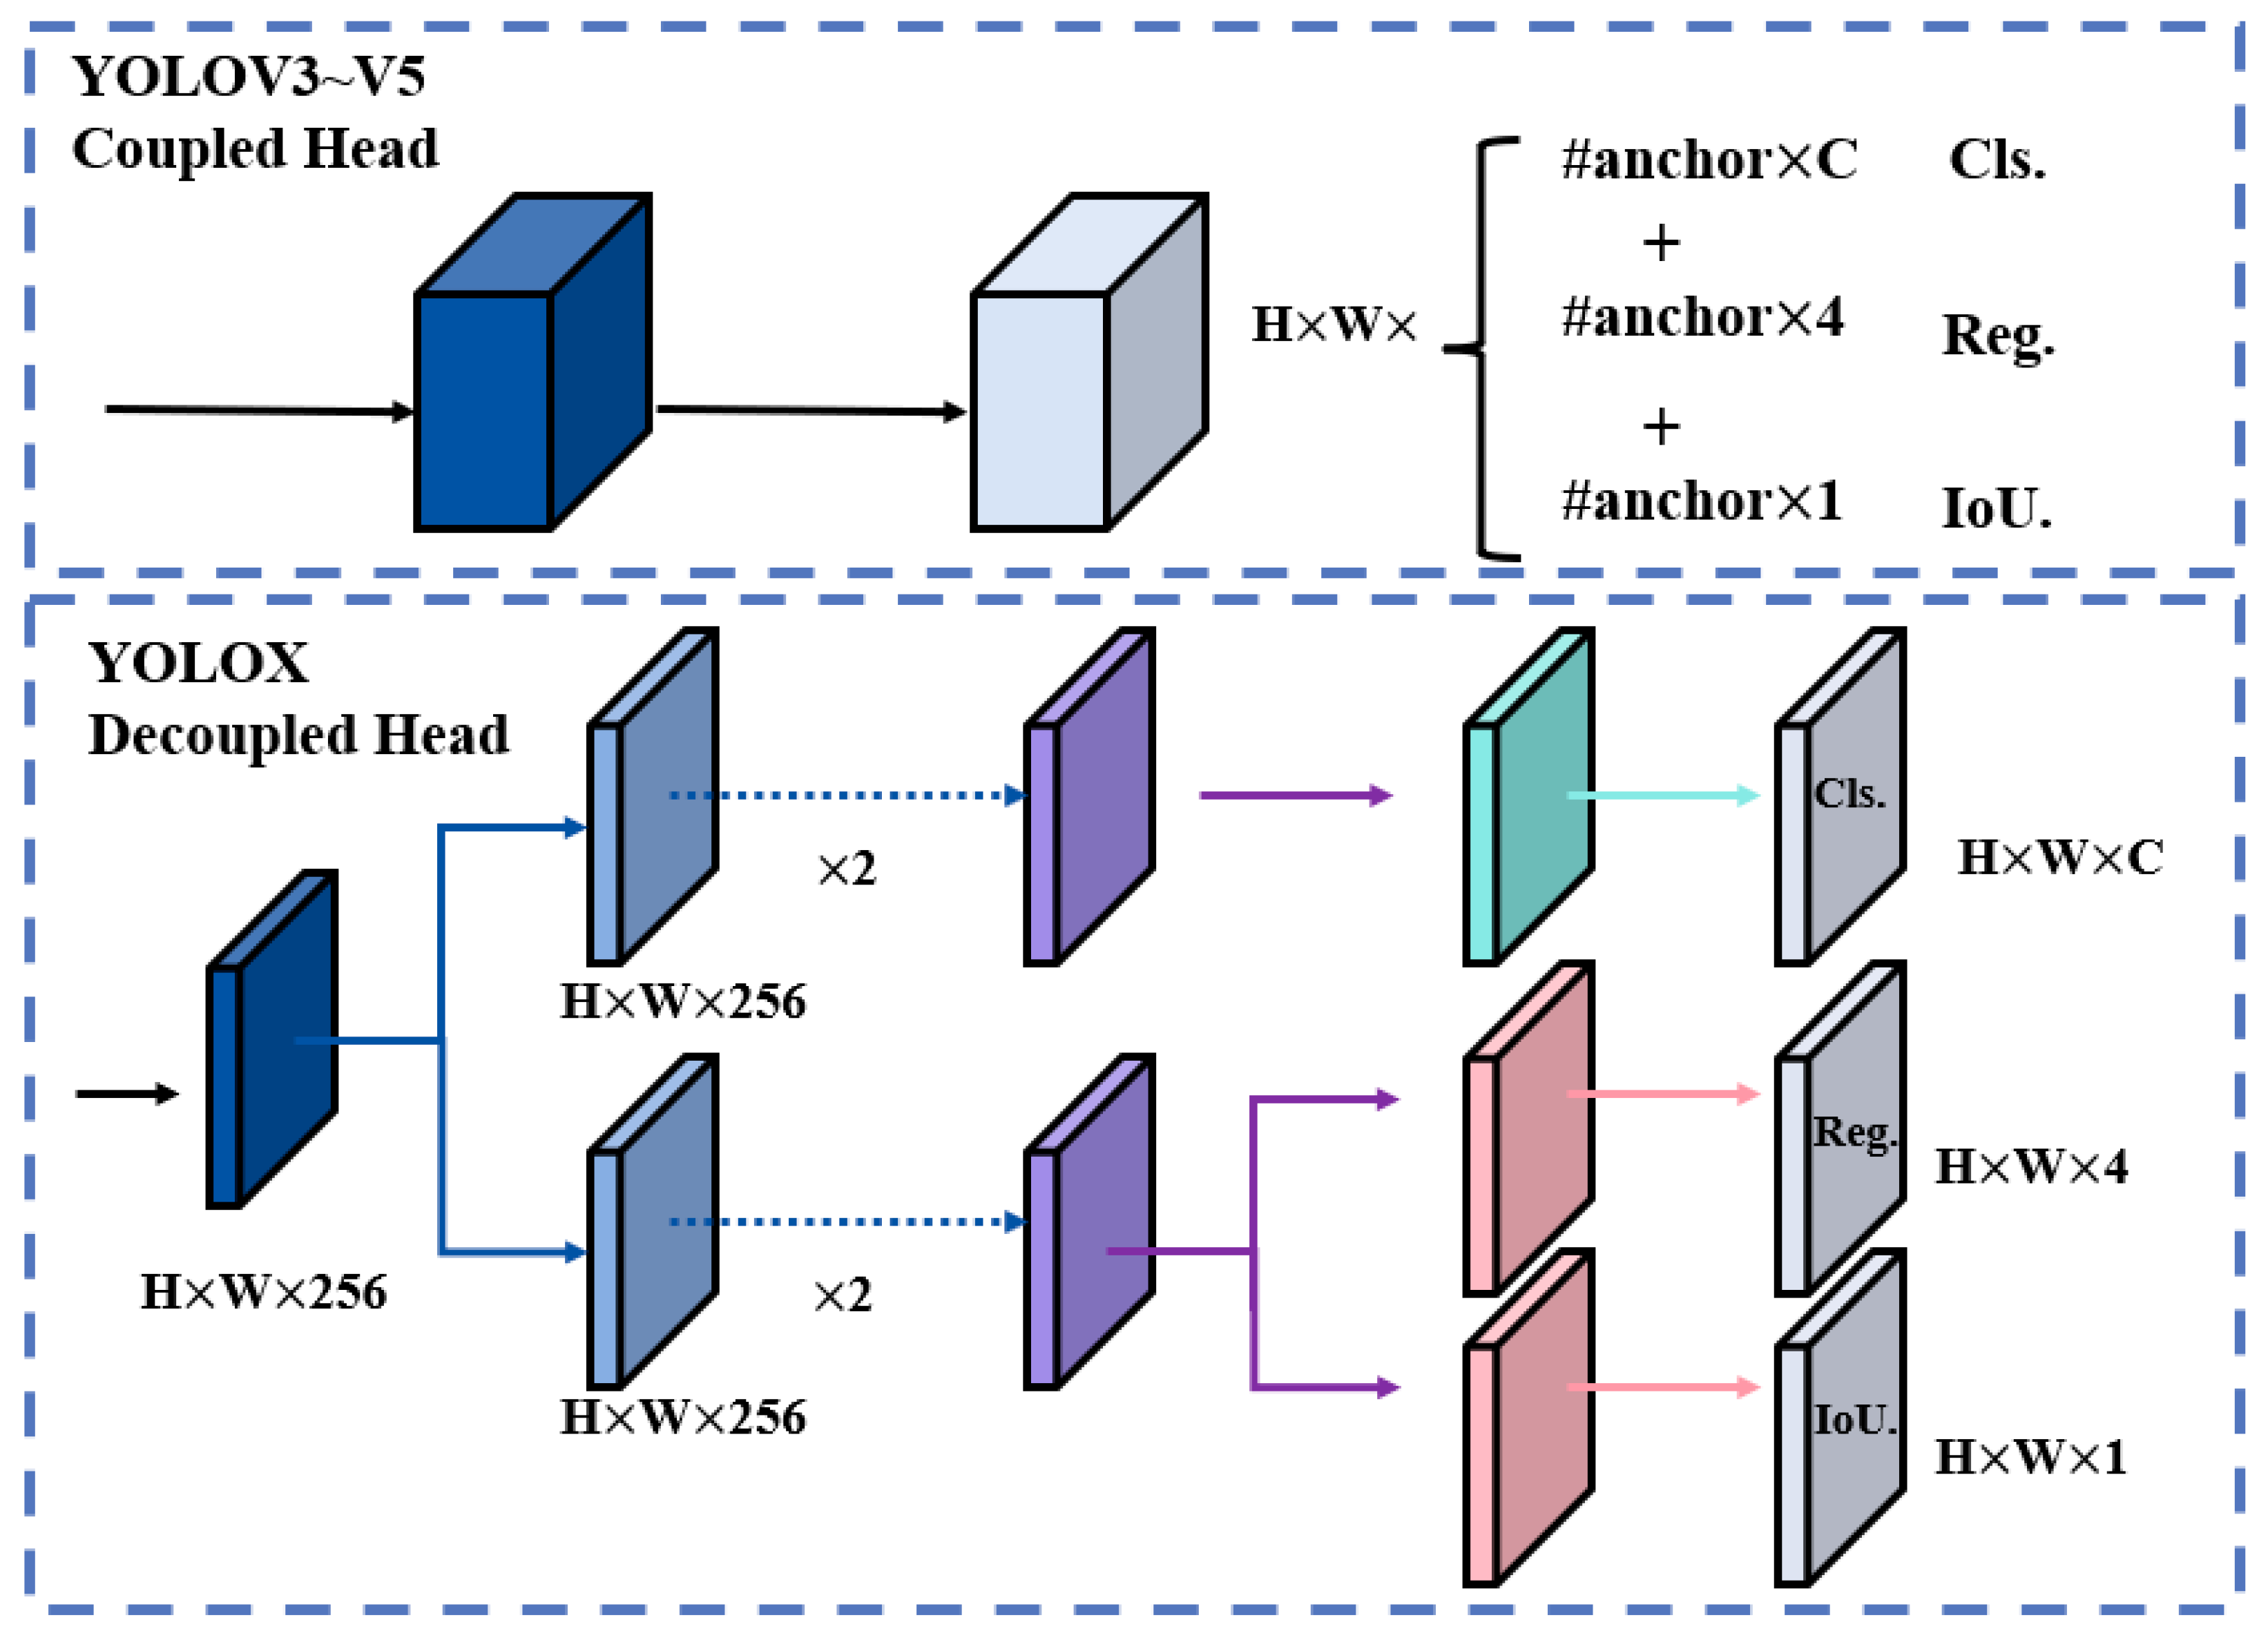
In object detection algorithms, traditional detection heads process classification and regression tasks jointly through a shared feature map, leading to task interference that degrades detection performance. Although the backbone and feature networks of the YOLO series have undergone continuous optimization, their detection heads remain coupled [40]. Unlike the YOLO architecture, which assigns classification, localization, and confidence losses to different channels of the same feature map, the decoupled approach separates classification and localization tasks into two independent branches for specialized processing. Figure 7 illustrates the structural differences between the YOLO-style coupled detection head and the decoupled detection head.
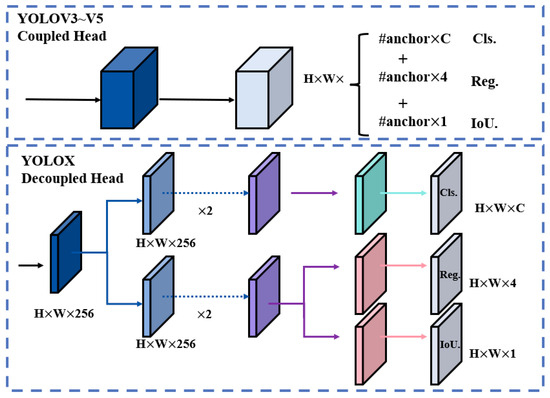
Figure 7.
Schematic diagram of the decoupled head structure.
In Figure 7, H, W, and C are the height, width, and channel of the input feature map, respectively [41]. The decoupling head is a new method to realize the effect of the decoupling head on the image. Specifically, the decoupling head first passes a 1 × 1 convolutional layer to reduce the dimensionality of the feature channels and then feeds these features into two independent branches, each containing two 3 × 3 convolutional layers for the classification task and the localization task, respectively. In this way, the classification branch can focus on the object category information, and the regression branch can focus on the bounding box localization of the object, thus effectively reducing the conflict between the two.
4. Experiments
4.1. Datasets
In this section, we train the detection model using surface defect images of additively manufactured components captured by a hardware system. The dataset comprises two defect categories: porosity (4986 instances) and crack (4084 instances). Each instance is annotated with precise bounding boxes that provide detailed information about the defect’s location, size, and category34. The dataset was randomly split into training and validation sets at an 8:2 ratio for model evaluation.
4.2. Experiment Settings
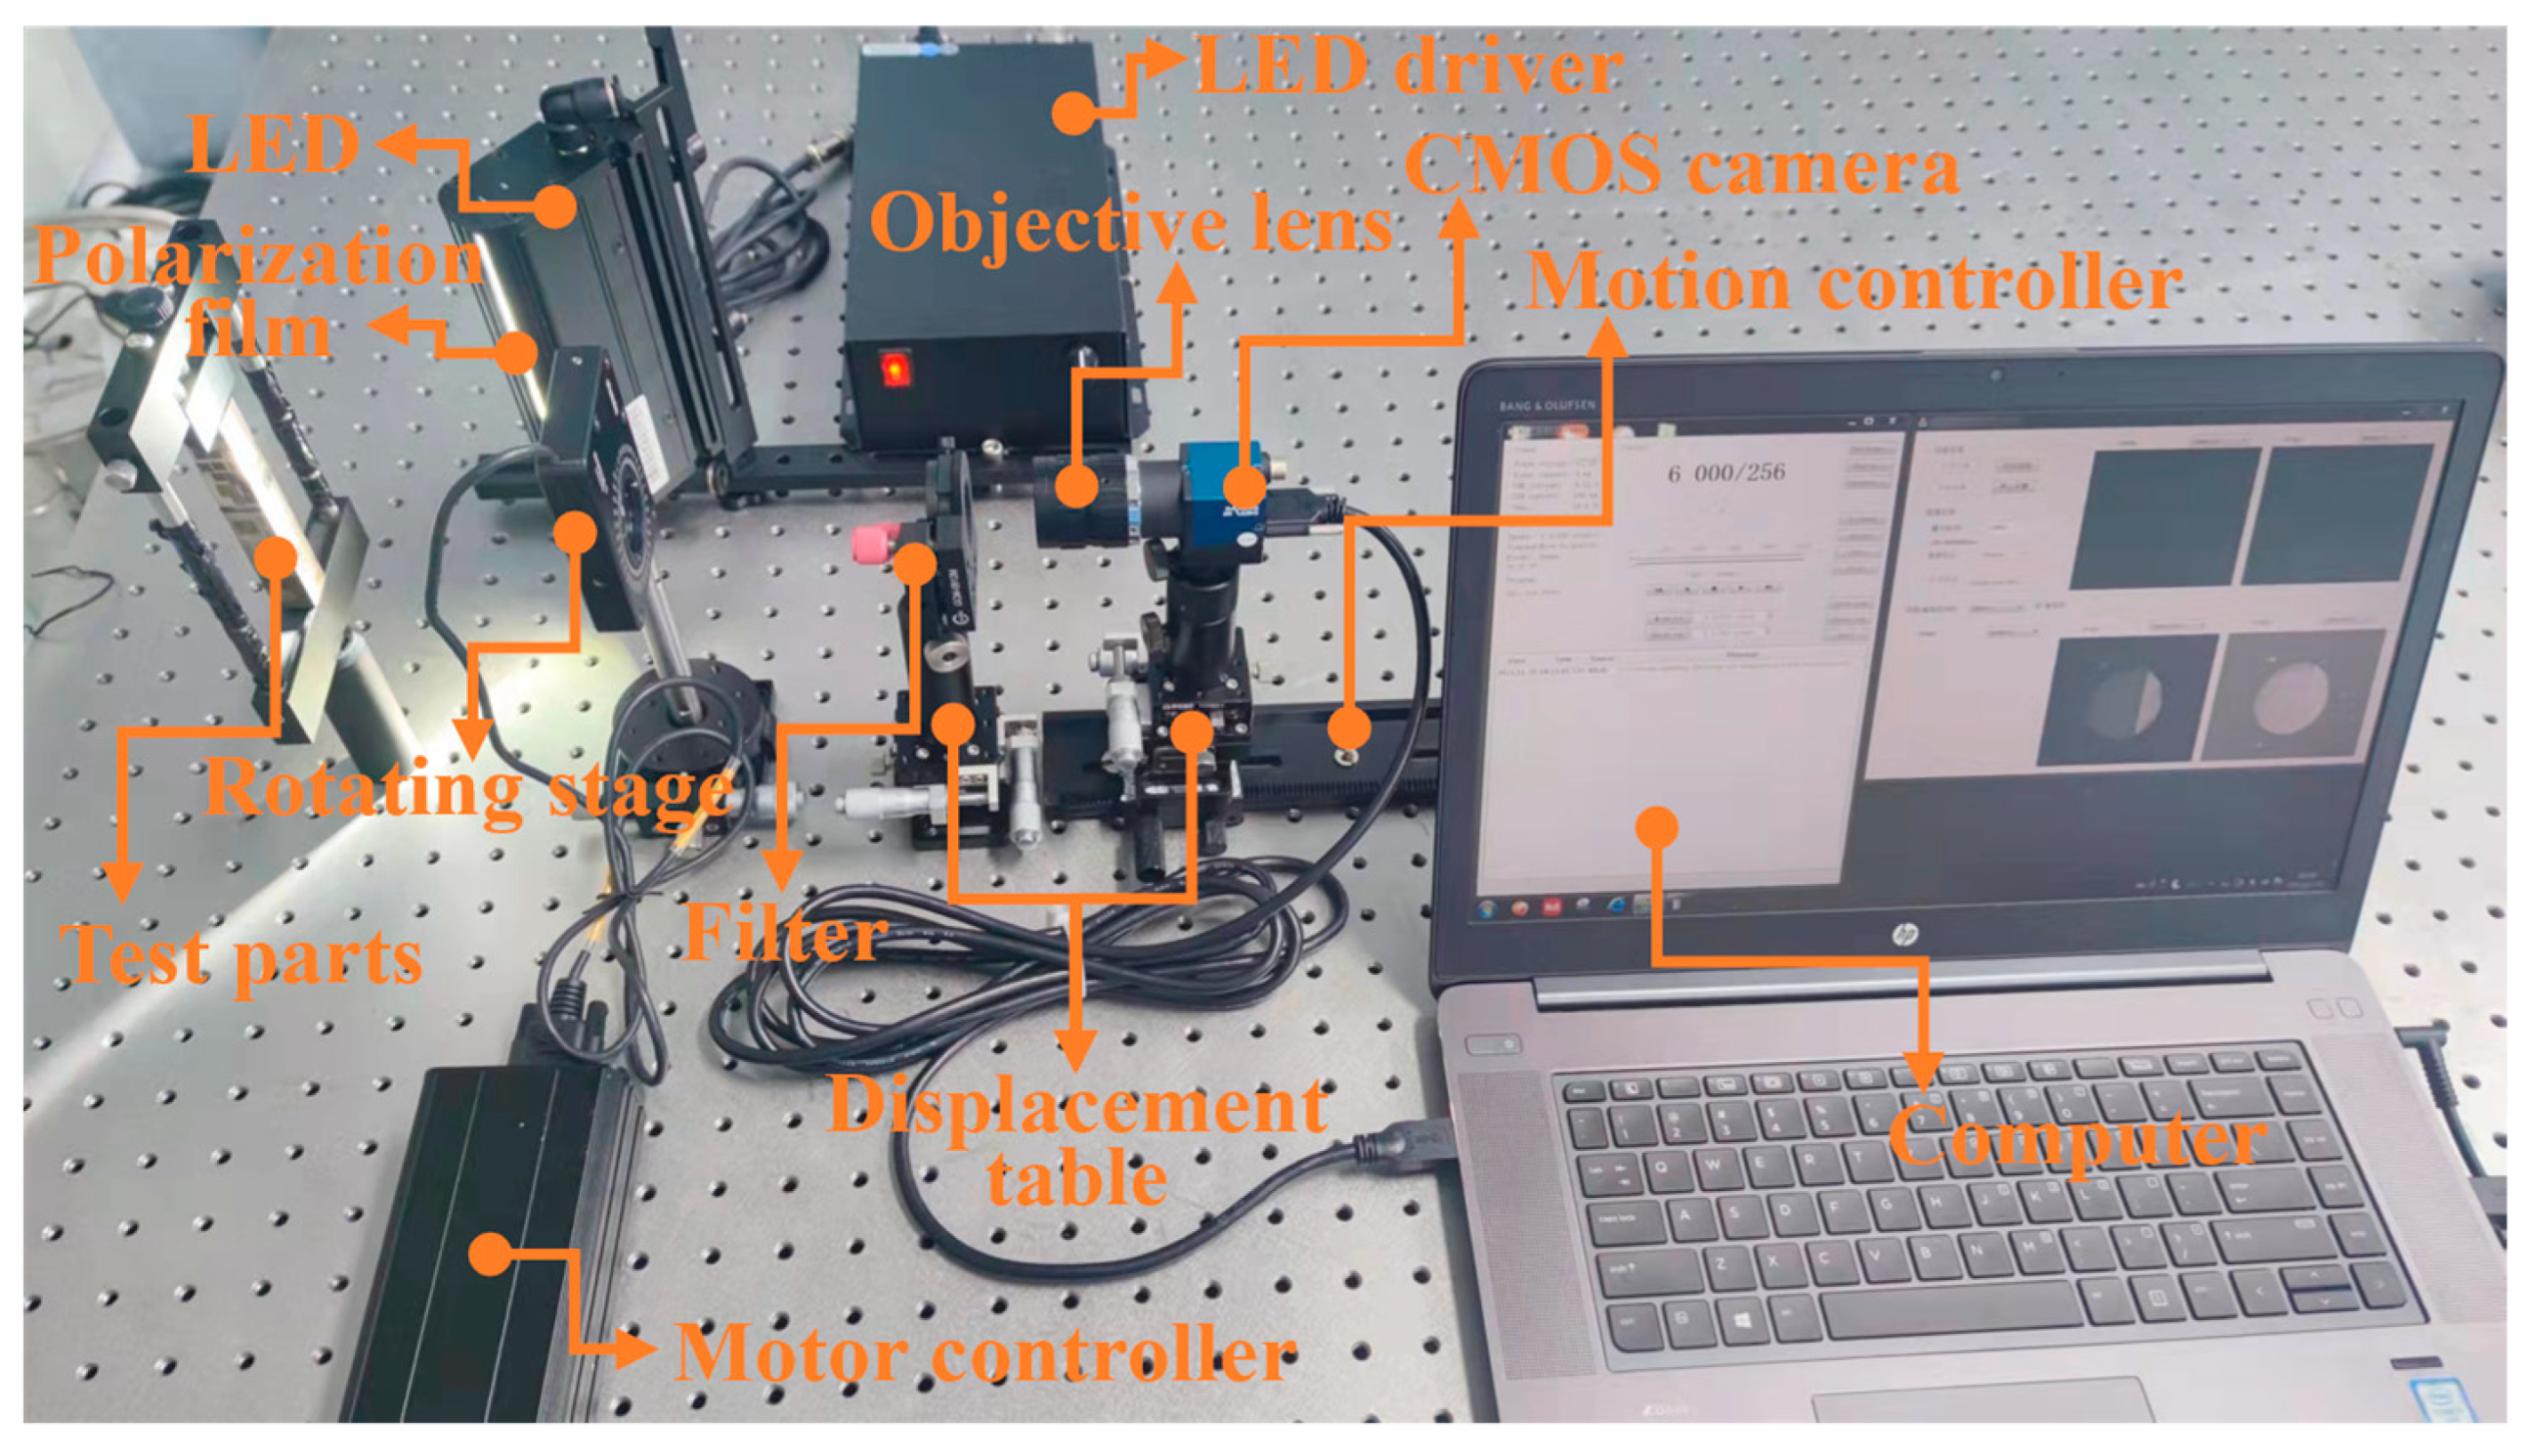
The experimental part of this study was conducted on self-collected datasets to compare the performance of the proposed YOLOV5-CAD with the original YOLOV5 and other target detection algorithms, respectively. All the experiments were performed on NVIDIA GeForce RTX 4090 GPU with the software platform torch-2.3.1+cu121, Anaconda. Each detection model was trained for 100 epochs, respectively. The experimental setup is presented in Figure 8. The experimental setup primarily comprises the test specimen, an LED illumination source, a linear polarizing filter, a motorized rotation stage, a CMOS imaging device, and a computing unit. The polarization element employed is a THORLABS LPVISE100-A model, characterized by dimensions of 25.4 mm and operational within the visible spectrum spanning from 400 to 700 nanometers. The CMOS sensor boasts a high-resolution capability of 2448 × 2048 pixels, individual pixel measurements of 3.45 microns, and utilizes an optical lens with a focal length of 50 mm. The motorized stage, identified as Standa’s FPSTA-8MPR16-1, facilitates precise angular adjustments up to a full 360 degrees, offering minute stepwise control at 0.75 arcminutes per step, thereby enabling meticulous manipulation of the polarizer’s orientation. This rotation mechanism is interfaced through an 8SMC4-USB controller for seamless integration and control.
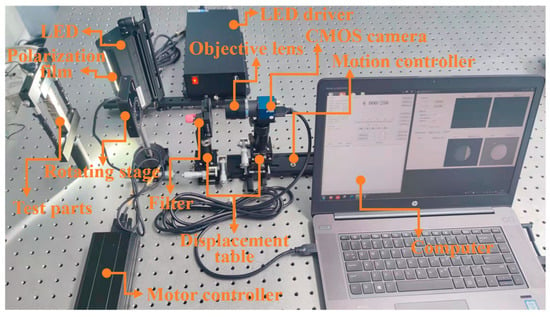
Figure 8.
The experimental setup.
4.3. Performance Metrics
In this study, precision, recall, average precision value AP, and mean average precision (mAP) are used as evaluation criteria to verify the superiority of the YOLO V5-CAD model proposed in this paper, respectively. In the target classification problem, it is assumed that the target to be classified is classified as Positive (Positive) and that the background is classified as Negative (Negative). The number of samples that are actually Positive and classified as Positive is defined as True Positive (TP); the number of samples that are actually Negative and classified as Positive is defined as False Positive (FP); the number of samples that are actually Negative and classified as Negative is defined as False Negative (FN). The sample size that is actually Negative and classified as Negative is defined as False Negative (FP); the sample size that is actually Positive and classified as Negative is defined as True Negative (TN) [42].
4.3.1. Precision
Precision, also known as checking accuracy, reflects the model’s ability to detect, and it represents the proportion of positive cases that are predicted to be Positive.
where (True Positive) represents positive cases correctly identified; (False Positive) represents negative cases misclassified as positive.
4.3.2. Recall
Recall, also known as the checking rate, responds to the model’s checking performance and indicates the number of correct samples predicted to be Positive as a percentage of the number of actual positive examples and is a way to assess the proportion of the model’s ability to find all the true positive samples [43].
where (True Positive) represents correctly identified positive samples; (False Negative) represents positive samples misclassified as negative.
Precision and recall together measure the accuracy of the algorithm. For high-precision scenarios, such as medical image analysis, industrial injury detection, etc., the algorithm should recognize the target as accurately as possible even if the detection speed is a little slow. Therefore, in this scenario, more emphasis is placed on algorithm accuracy.
4.3.3. AP
The AP (average precision) integrates the changes in precision and recall and characterizes the area under the precision–recall curve and is an important indicator of the strengths and weaknesses of a target detection model.
where is the value corresponding to on the PR curve, and .
4.3.4. mAP
mAP is the abbreviation standing for mean average precision, which indicates the mean average precision value. As a comprehensive metric, it can reflect the precision, recall, and mean average precision values together. mAP50 represents the mAP value at the 50% loU threshold. A higher mAP value reflects a more accurate model.
where the value range of mAP is [0, 1], and the closer to 1, the better. This index is the most important in the algorithm for detecting targets.
AP and mAP are comprehensive evaluation metrics that reflect the algorithmic accuracy of the algorithm for single targets and for all classes of targets. A high AP or mAP value means that the YOLO algorithm model detects the target object with higher confidence.
4.4. Evaluation
This section analyzes the training results of the model on the collected dataset from three perspectives: quantitative experiments, ablation studies, and detection performance on diverse defect images. First, in quantitative experiments, the proposed model is compared with widely used object detection models in recent years, and the rationale for selecting YOLOv5 as the baseline is discussed. Second, ablation studies are conducted by combining experimental data from different improvement components to validate the effectiveness of the proposed modules. Finally, to highlight the practical performance of the enhanced model, tests are performed on various types of defect images using different models.
4.4.1. Quantitative Analysis
This study selected several object detection models widely used in recent years for comparison, including YOLOv4, YOLOX, CenterNet, Faster-RCNN, RetinaNet, and YOLOv5. The experimental results of these models are summarized in Table 2.
Table 2.
Comparison of experimental results of commonly used target models.
As evident from the experimental results, the YOLOv5 model exhibits superior overall performance compared to other baseline models. The closest competitor, YOLOvX, achieves only a 2% higher precision but lags by 7.8% in recall and 4% in mAP50. Specifically, YOLOv5 attains a mAP50 of 77.5%, with precision and recall rates of 80.1% and 72.5%, respectively. Considering its balanced detection performance and ease of local deployment, YOLOv5 is selected as the baseline for this study. Compared to the original YOLOv5, the proposed model improves precision and recall by 2.5% and 2.2%, respectively, demonstrating enhanced correctness and coverage in defect detection. Furthermore, the mAP50 of the proposed model increases by 3.1%, validating the effectiveness of integrating the CBAM attention mechanism, decoupling the detection head, and refining the loss function to improve detection accuracy [44].
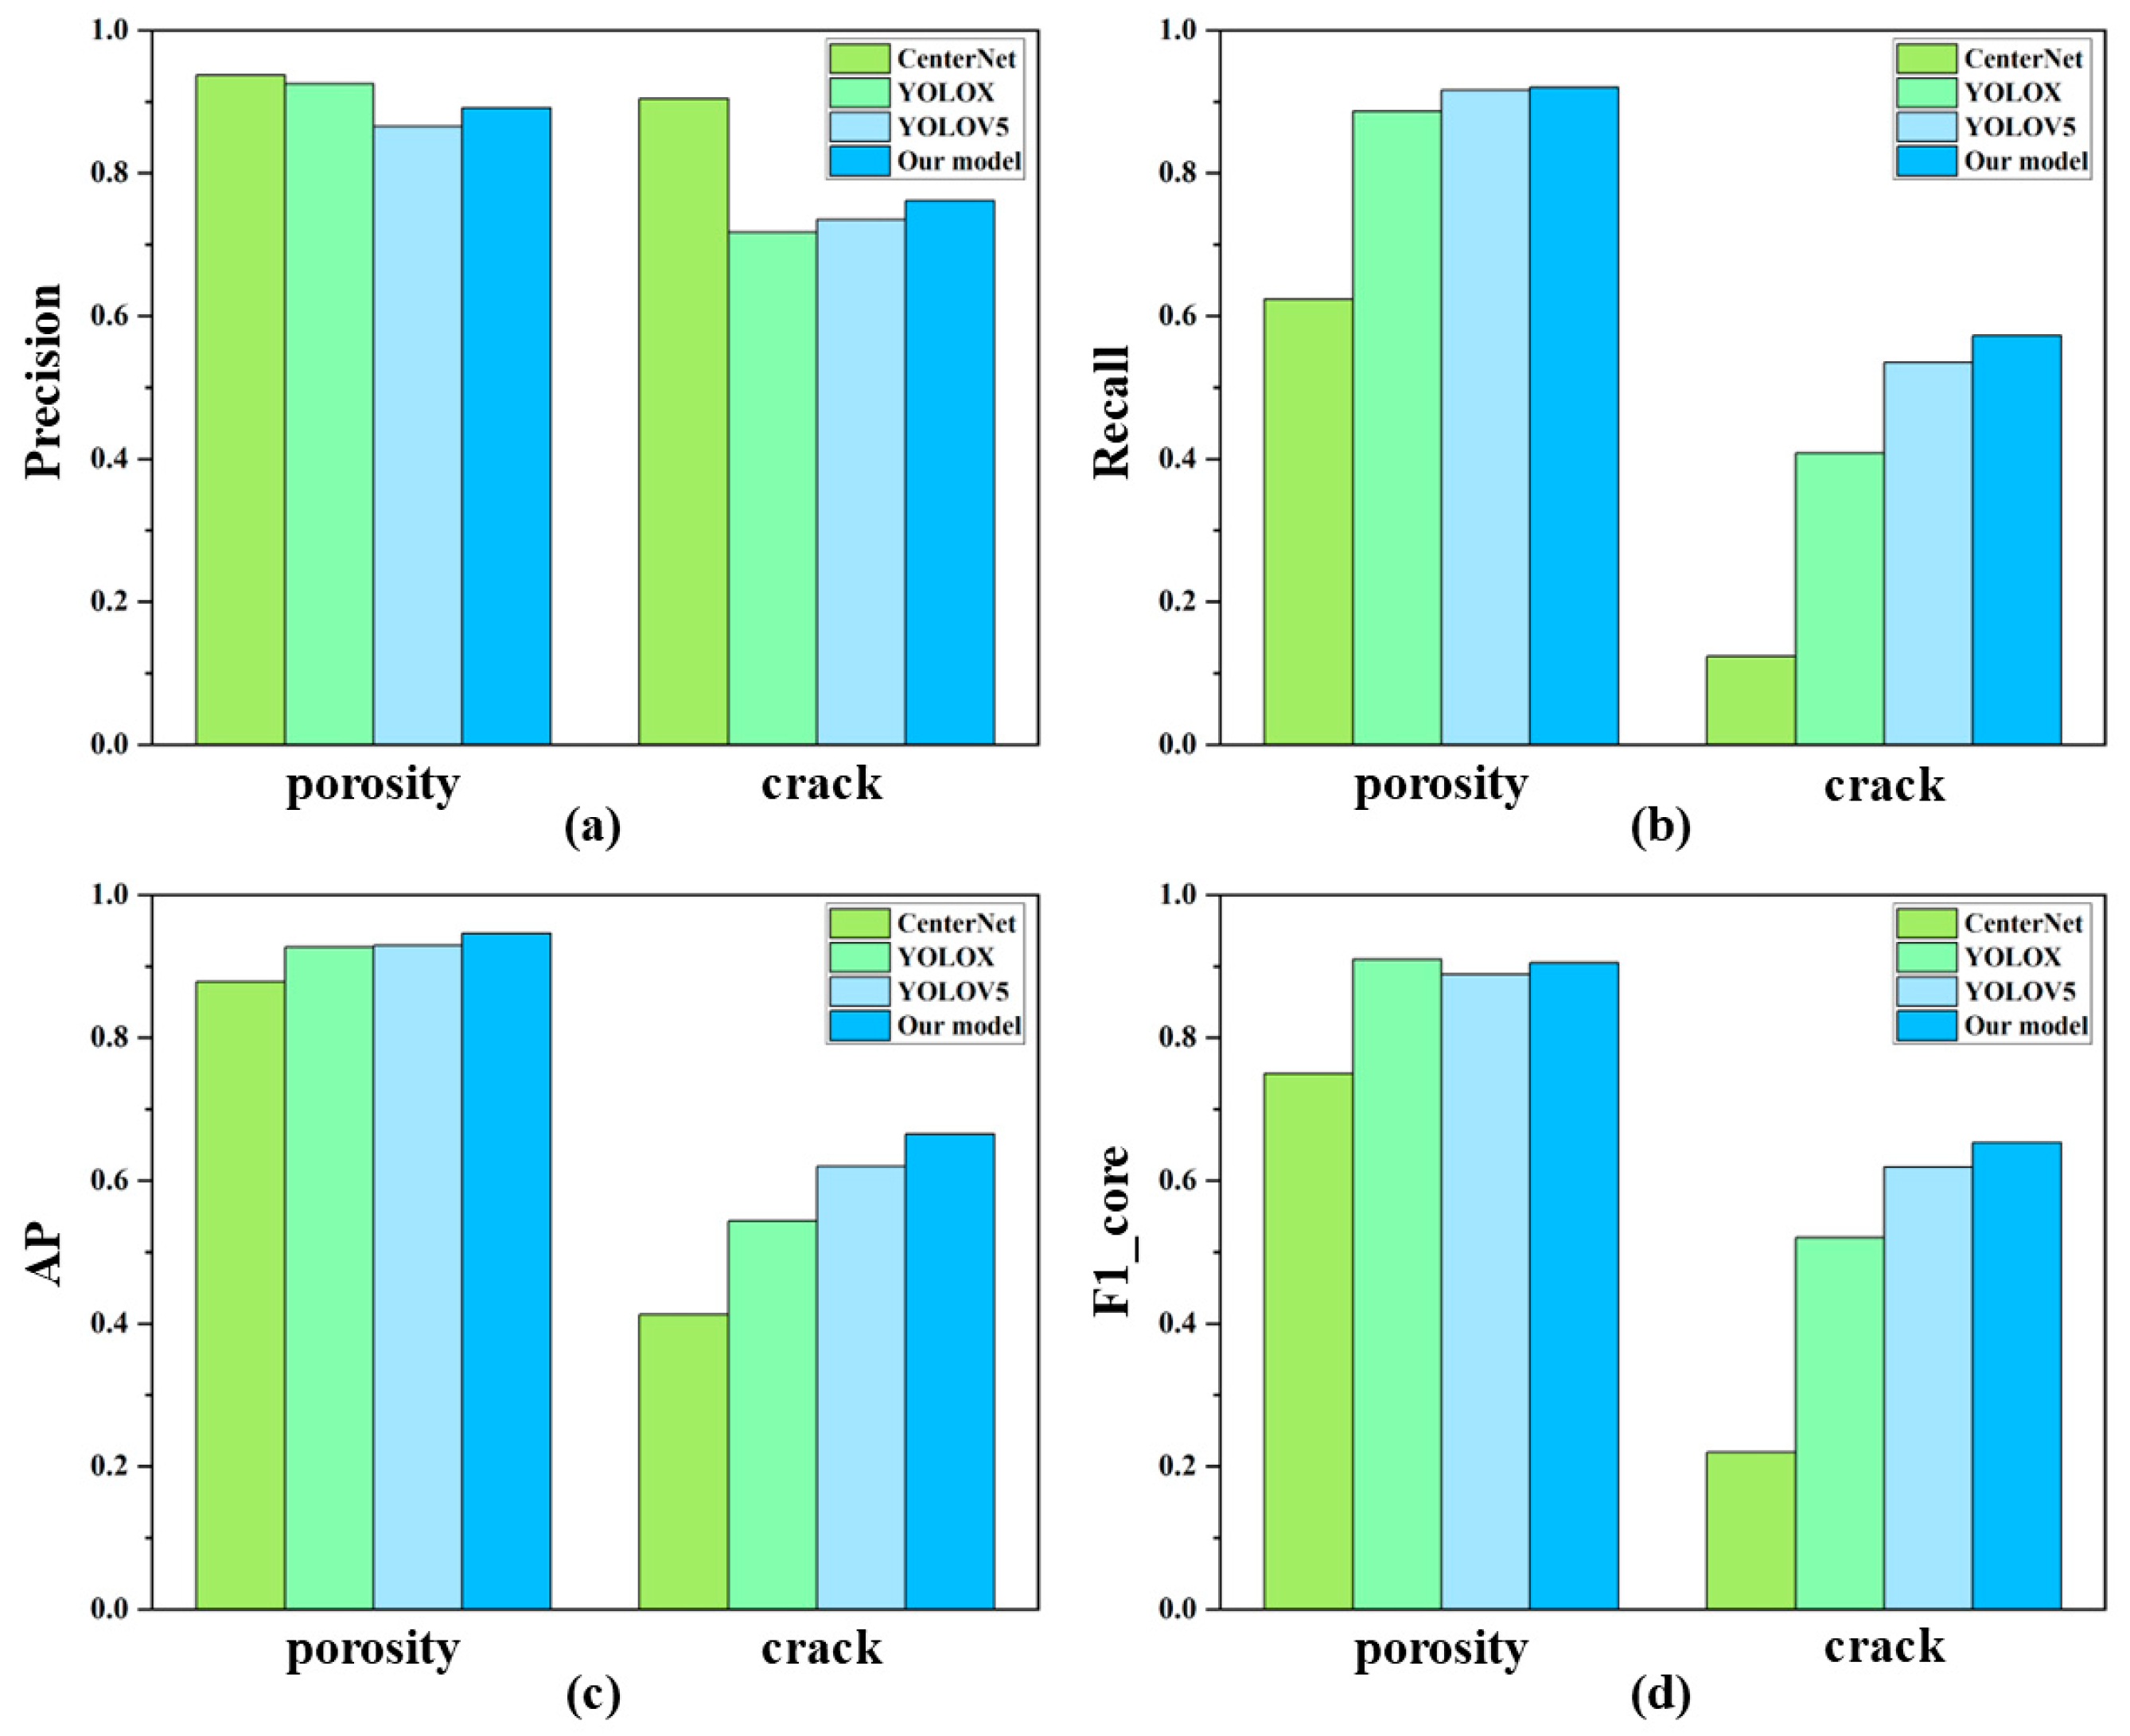
To highlight the detection performance of the proposed model on two types of defects, we compared it with CenterNet, YOLOX, and YOLOv5. The evaluation metrics included precision, recall, AP, and F1-score, with the score threshold uniformly set to 0.5 for all metrics. The comparative results of model performance on different defects are illustrated in Figure 9.

Figure 9.
Comparison of the performances of different models.
As clearly shown in Figure 9b–d, the proposed model improves the performance of two defect types in terms of precision, recall, mAP, and F1-score. Although the precision of the proposed model for porosity and crack detection is 4.56% and 14.31% lower than CenterNet, respectively, CenterNet’s other three metrics (recall, mAP50, and F1-score) are significantly inferior to the proposed model. Specifically, the proposed model achieves 44.84%, 25.2%, and 43.3% higher recall, mAP50, and F1-score compared to CenterNet. Additionally, the model’s detection performance for cracks is notably weaker than for porosity; this is likely due to the complex scale variations in crack features, which demand stronger multi-scale adaptability from the model. Despite improvements in crack detection after the proposed modifications, further optimization remains necessary. Overall, the proposed model demonstrates enhanced metrics compared to YOLOv5, validating the effectiveness of our improvements. Both longitudinal and horizontal comparisons confirm that the proposed model achieves state-of-the-art performance across all evaluation criteria.
4.4.2. Ablation Experiment
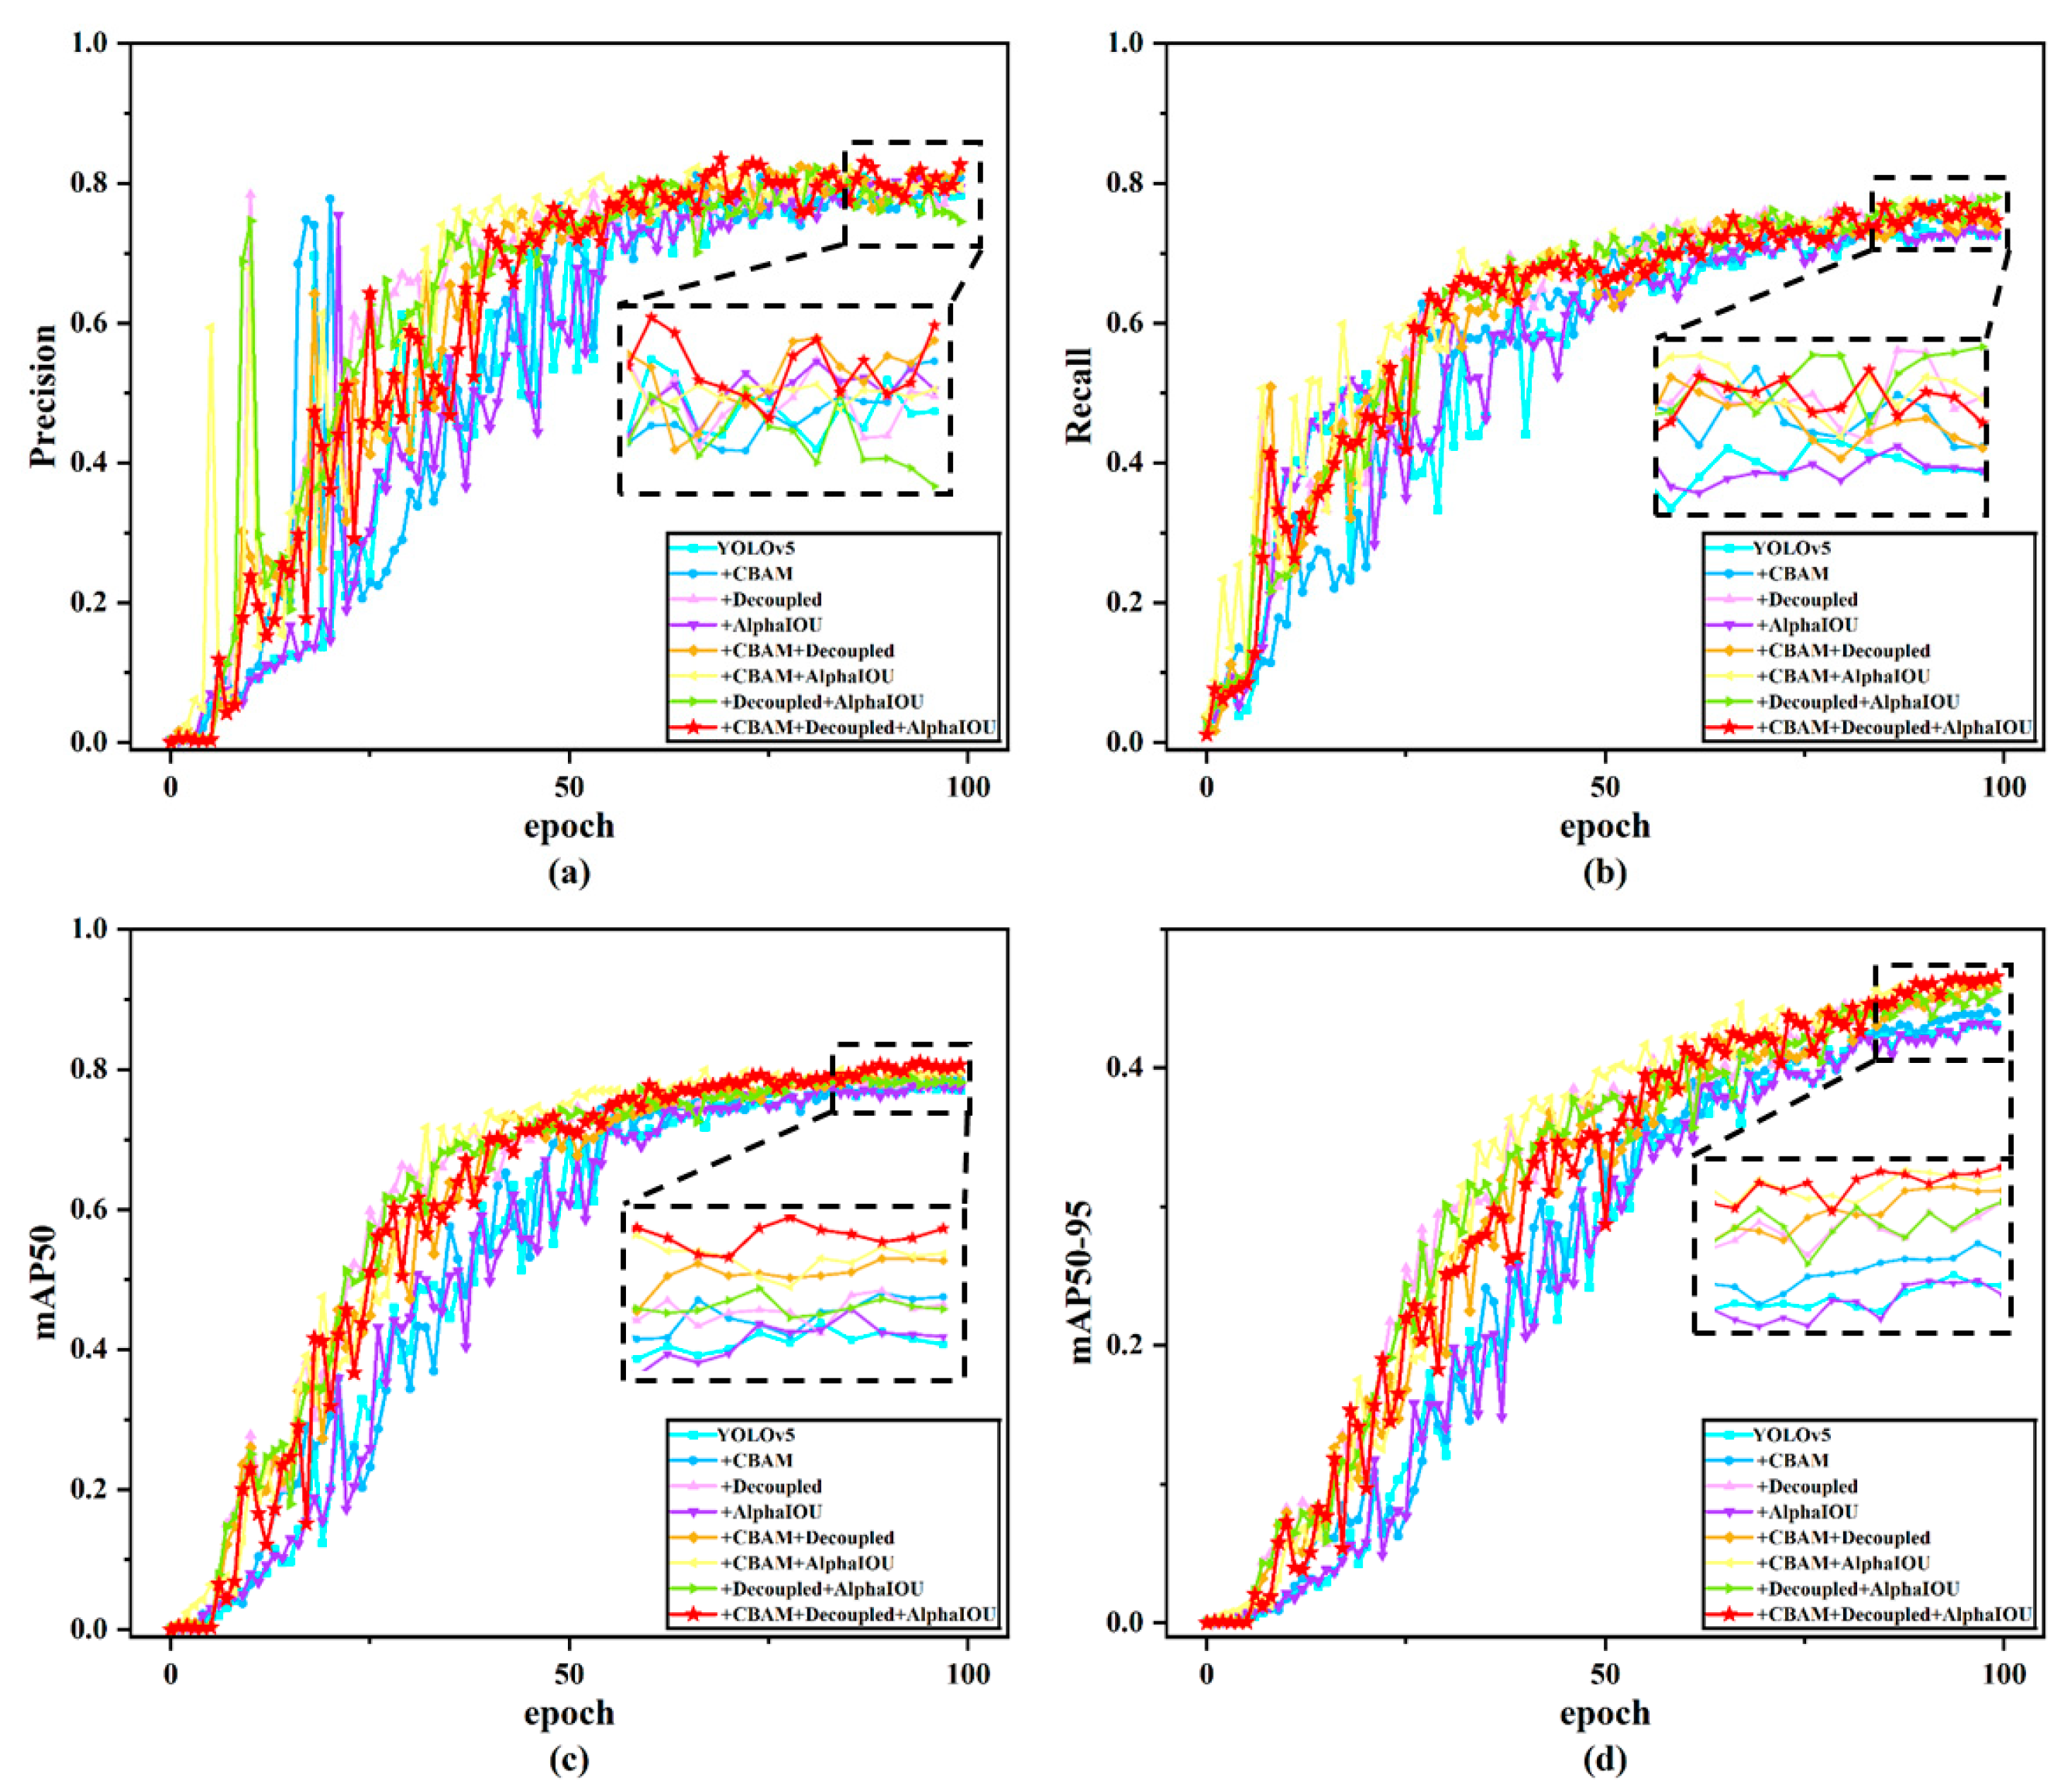
To intuitively demonstrate the impact of different modules on model accuracy, we conducted a series of ablation experiments based on YOLOv5 to validate the effectiveness of each module. First, we used YOLOv5s as the baseline model and obtained its detection results as the experimental benchmark. Subsequently, we modified the baseline model with different improvements to verify their individual contributions. Initially, we enhanced the C3 module in the YOLOv5 backbone network while keeping other components unchanged, ensuring that the results were not influenced by external factors. Following this approach, we validated each improvement method separately. Finally, all modifications were integrated to form the YOLOv5-CAD model, thereby confirming its overall effectiveness. The training process of the ablation experiments is illustrated in Figure 10, where curves of different colors represent the training results of models with distinct modification strategies. Additionally, Table 3 presents the outcomes of the ablation experiments, demonstrating the quantitative impact of each module on performance metrics.
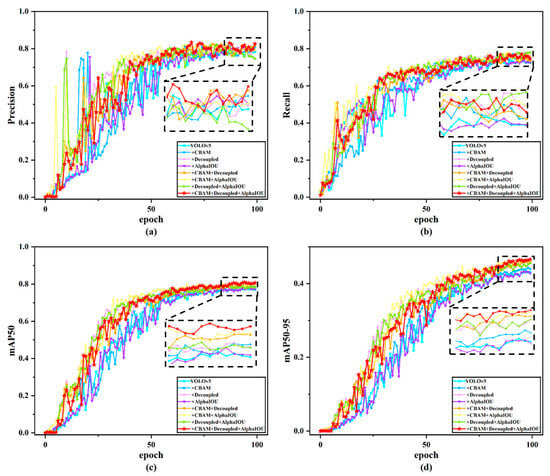
Figure 10.
Improved ablation experiment training results.
Table 3.
Ablation experimental test results.
As shown in Figure 10, the accuracy training curve rises sharply after the initial epochs and subsequently grows gradually with oscillations. We hypothesize that the model rapidly learns salient defect-related features during early training stages. However, due to insufficiently learned representations, the accuracy exhibits fluctuations throughout the training process. Furthermore, the mAP50 and mAP50-95 curves of our proposed model progressively surpass those of other comparative models as the epochs increase, demonstrating that our improvements enhance both average precision and robustness, thereby validating the effectiveness of the proposed approach.
In Table 3, the first row represents the baseline of the ablation experiments. Compared to the baseline, the subsequent three rows show the training results when introducing the CBAM, decoupled head, and AlphaIOU modules individually, which improve the mAP50 of the original model by 1%, 0.8%, and 0.7%, respectively, demonstrating the effectiveness of each improvement when applied independently. Furthermore, the combined application of these enhancements yields a superior solution. Notably, the integration of the CBAM, decoupled head, and AlphaIOU modules achieves the optimal performance improvement: precision, recall, mAP50, and mAP50-95 are increased by 2.5%, 2.2%, 3.1%, and 3.2%, respectively, compared to the original YOLOv5s model [45,46]. The most significant improvement in mAP50-95 indicates enhanced target localization accuracy and multi-scale adaptability. This improvement is attributed to the synergistic combination of the CBAM attention mechanism and the decoupled head design. By embedding the CBAM attention mechanism into the C3 module, the model effectively integrates spatial and channel-wise information, enabling the network to capture richer positional and detailed features of target regions, thereby optimizing localization precision. Simultaneously, the decoupled head separates classification and regression tasks into distinct channels within the same feature map, allowing the classification branch to focus on object category information while the regression branch specializes in bounding box localization.
4.4.3. Qualitative Analysis
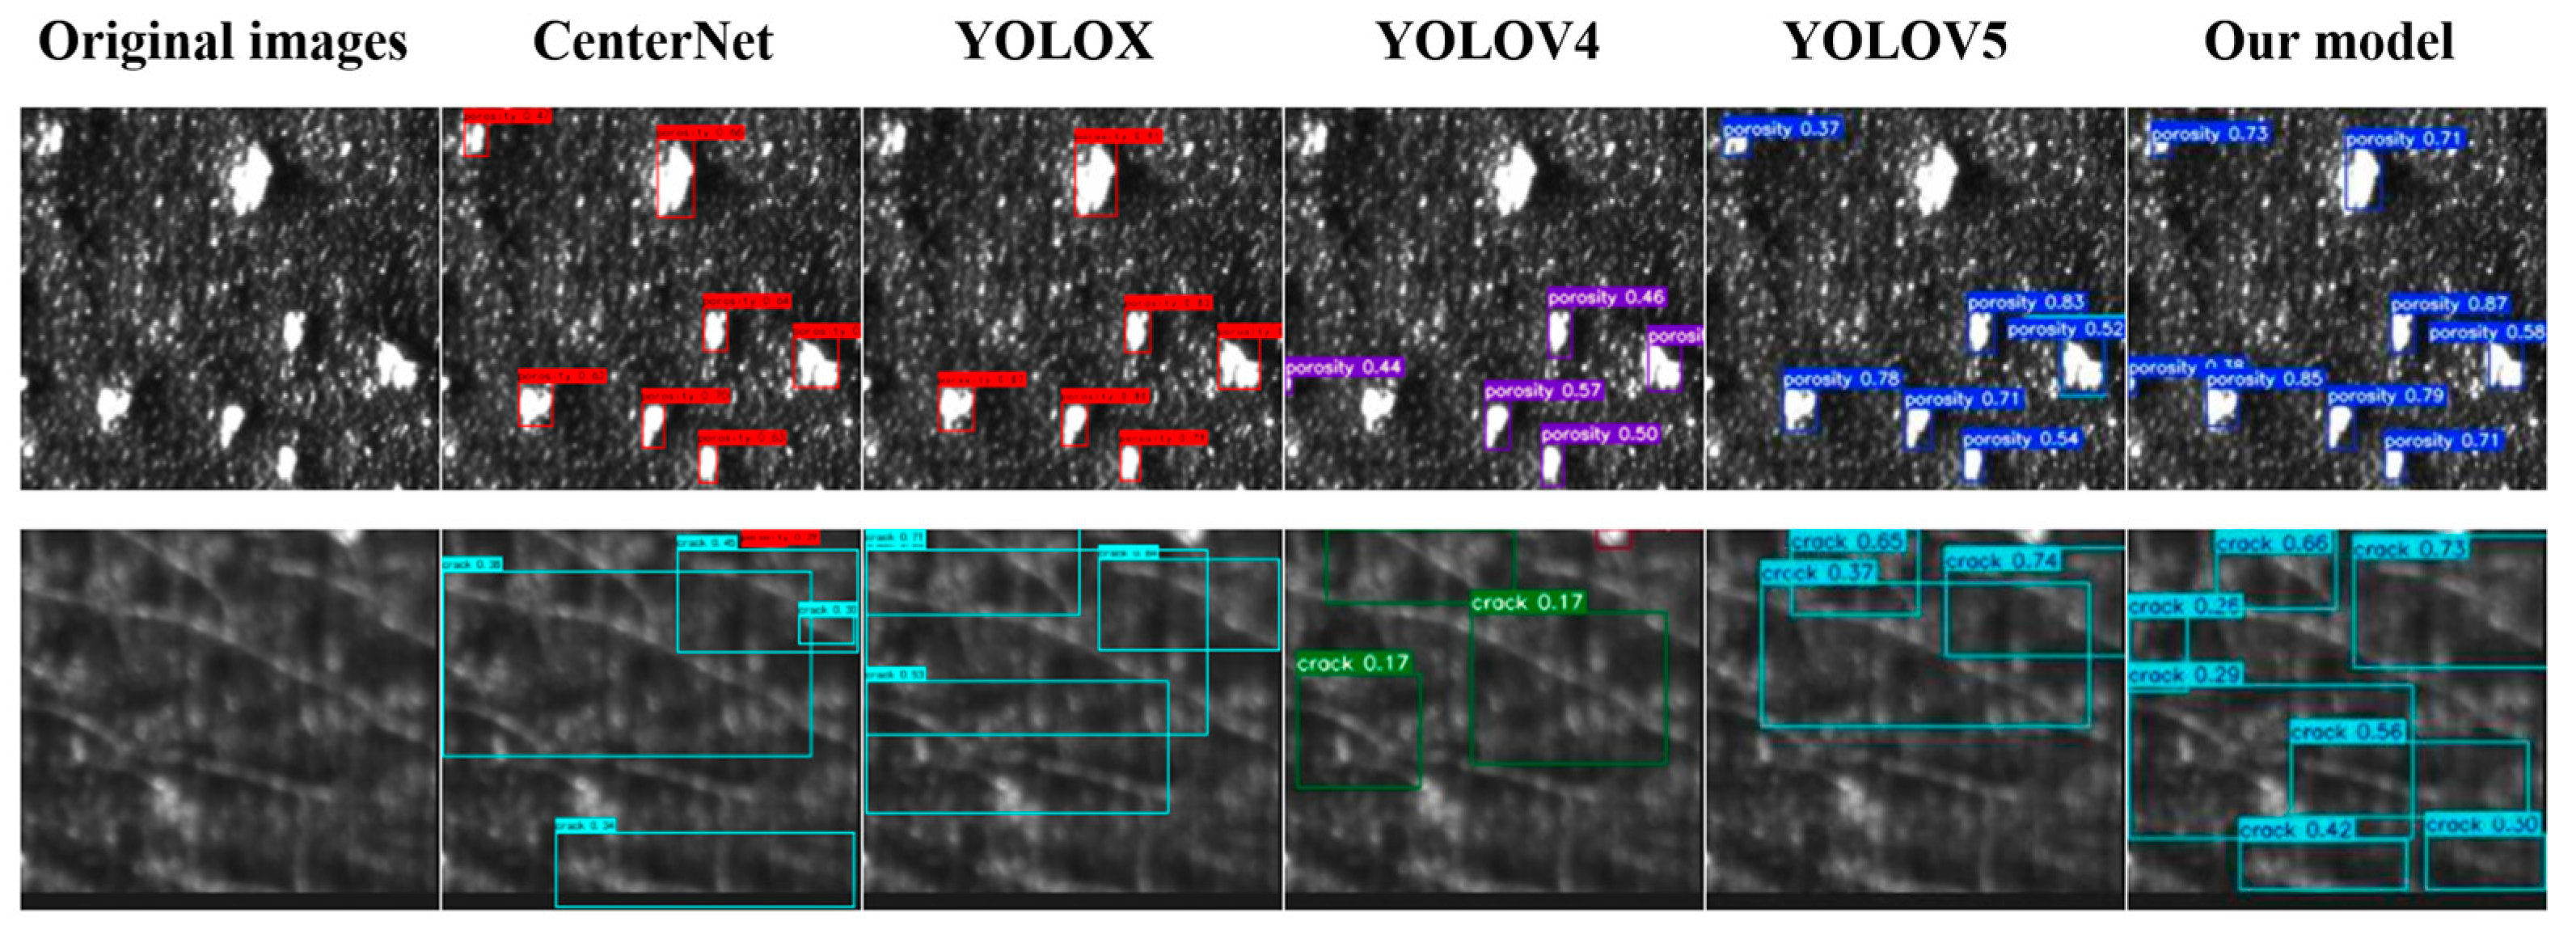
To more intuitively demonstrate the effectiveness of our improved method compared to other models, we conducted qualitative analysis. Two representative images of surface defects on additive-manufactured components were selected from the test set. Figure 11 illustrates the actual detection results of surface damage precursors on the workpiece using several state-of-the-art models. Specifically, the six columns correspond to the original image, CenterNet, YOLOX, YOLOv4, YOLOv5, and the predictions from our proposed model.
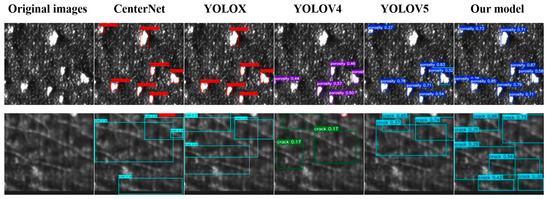
Figure 11.
Actual detection results of workpiece surface defects by several better models.
As shown in the detection results comparison in Figure 11, the selected baseline models exhibit missed detections for porosity, whereas our improved model demonstrates no such failures. Among all the evaluated models, our approach achieves the highest confidence scores and the most precise bounding boxes for porosity detection. Furthermore, the superiority of our model in crack detection is evident: other models suffer from significant missed detections for cracks, primarily due to their limited adaptability to large intra-scale variations in cracks within individual images. In contrast, our model accurately identifies cracks regardless of scale variations. These observations confirm that our proposed model effectively adapts to multi-scale targets. We attribute this capability to the integration of CBAM into the backbone network and the optimized C3 module, which collectively enhance multi-scale feature representation. This architectural refinement enables simultaneous high-precision detection of both cracks and porosity, further validating our network’s robust multi-scale feature extraction and fusion capabilities.
5. Conclusions and Discussion
This study focuses on improving the detection accuracy of surface defects in additive-manufactured components by proposing an effective detection network, YOLOv5-CAD. The experimental results demonstrate the following conclusions.
Through quantitative analysis, the improved model was compared with Faster-RCNN, RetinaNet, CenterNet, YOLOv4, YOLOX, and YOLOv5. The proposed YOLOv5-CAD achieved the highest detection accuracy and optimal overall performance, with notable improvements in the detection of various defect types. Specifically, the model attained precision, recall, mAP50, and mAP50-95 scores of 82.6%, 74.7%, 80.6%, and 46.6%, respectively, validating its feasibility and practicality in surface defect detection for additive manufacturing.
Ablation experiments confirmed the effectiveness of individual modules: modifying the C3 module in the original network architecture, decoupling the detection head, and introducing the AlphaIoU loss function collectively optimized model performance. Compared to YOLOv5, YOLOv5-CAD improved precision by 2.5%, recall by 2.2%, mAP50 by 3.1%, and mAP50-95 by 3.2%.
Although the proposed model in this study demonstrates improved capability in adapting to targets of different scales compared to the original network, it still has certain limitations. For instance, the model achieves an impressive detection accuracy of 94.6% for porosity defects, but only 66.5% for cracks, showing a 28.1% lower performance compared to porosity. This discrepancy is attributed to the more consistent feature scales of porosity defects versus the significant scale variations in cracks, which exceed the detection capability of the current model. Therefore, substantial research and exploration remain necessary for crack-type defects with large-scale variations. Additionally, while the introduced attention mechanism and head decoupling in the model enable adaptation to defect targets of different scales, they also increase model complexity and reduce detection efficiency. Consequently, we propose to design more lightweight attention mechanisms or employ pruning and knowledge distillation methods in future work to enhance the model’s capability in handling multi-scale targets while simultaneously simplifying the architecture and improving the detection efficiency.
Author Contributions
D.L., methodology, manuscript drafting, conceptualization, manuscript revision, experimental data curation, manuscript review, and supervision; X.P., funding; H.C., conceptualization and manuscript review; Y.X., experimental data curation; S.L., manuscript review; X.S., manuscript revision; X.Z., supervision. All authors have read and agreed to the published version of the manuscript.
Funding
This paper was supported by the National Natural Science Foundation of China (52305594); Natural Science Foundation of Hunan Province (2024JJ6460); China Postdoctoral Science Foundation Grant (2024M754299); Natural Science Foundation of Zhejiang Province (LZ25A040002); Jiangxi Provincial Natural Science Foundation (20224BAB214053, 20242BAB25104).
Institutional Review Board Statement
Not applicable.
Informed Consent Statement
Not applicable.
Data Availability Statement
Data is contained within the article.
Conflicts of Interest
The authors declare that they have no known competing financial interests or personal relationships that could have appeared to influence the work reported in this paper.
References
- Ye, J.F. Research on Direct Writing 3D Printing Technology Based on Ultrasonic Vibration Assistance. Master’s Thesis, Nanjing University of Aeronautics and Astronautics, Nanjing, China, 2021. [Google Scholar]
- Qing, L.; Yang, L.I.; Jianwei, F.U. Development of additive manufacturing machine for repairing waste parts of machine tools. Manuf. Technol. Mach. Tool 2019, 8, 22–25. [Google Scholar]
- Qijie, Y.; Bin, H.; Shengyuan, L. Effect of Interlayer Waiting Time on Forming Quality of 4043 Aluminum Alloy Arc Additive Manufacturing. Hot Work. Technol. 2022, 51, 140–144. [Google Scholar]
- Lian, Y.; Wang, P.; Gao, J.; Liu, J.; Li, Q.; Liu, C.; He, X.; Gao, L.; Li, H.; Lei, L.; et al. Fundamental mechanics problems in metal additive manufacturing: A state-of-art review. Adv. Mech. 2021, 51, 648–701. [Google Scholar]
- Sun, S.; Peng, X.; Cao, H. Accurate Inspection and Super-Resolution Reconstruction for Additive Manufactured Defects Based on Stokes Vector Method and Deep Learning. Photonics 2024, 11, 874. [Google Scholar] [CrossRef]
- Pan, X.Y. Research on Crack Detection Technology of Brake Disk Bolts for High-Speed Trains. Master’s Thesis, Beijing Jiaotong University (BJTU), Beijing, China, 2016. [Google Scholar]
- Yang, G.J. Research on rapid detection and treatment method of soil heavy metal element pollution based on LIBS technology. Environ. Sci. Manag. 2023, 48, 108–113. [Google Scholar]
- Xia, Q.; Wang, G.X. Research on laser spot position detection based on digital image processing technology. Laser Mag. 2024, 45, 208–212. [Google Scholar]
- Zhang, Y.; Hong, G.S.; Ye, D.; Zhu, K.; Fuh, J.Y.H. Extraction and evaluation of melt pool, plume and spatter information for powder-bed fusion AM process monitoring. Mater. Des. 2018, 458–469. [Google Scholar] [CrossRef]
- Zhang, Y.; Fuh, J.Y.H.; Ye, D.; Hong, G.S. In-situ monitoring of laser-based PBF via off-axis vision and image processing approaches. Addit. Manuf. 2019, 263–274. [Google Scholar] [CrossRef]
- Meng, R.F.; Liang, Z.; Jia, C.; Qiao, Z.; Zhao, C. Research and Optimisation of Mask R-CNN Algorithm for Rail Surface Defect Detection. Urban Rapid Rail Transit 2024, 37, 68–77. [Google Scholar]
- Chen, P.; Xie, F. A Machine Learning Approach for Automated Detection of Critical PCB Flaws in Optical Sensing Systems. Photonics 2023, 10, 984. [Google Scholar] [CrossRef]
- Qu, L.; Chen, G.; Liu, K.; Zhang, X. A Study on the Improvement of YOLOv5 and the Quality Detection Method for Cork Discs. Photonics 2024, 11, 825. [Google Scholar] [CrossRef]
- Du, Y.; Xu, X.; Zhao, L.; Yuan, D.; Wang, J. Study on the Transient Extraction Transform Algorithm for Defect Detection in Welded Plates Based on Laser Vibrometer. Photonics 2024, 11, 1193. [Google Scholar] [CrossRef]
- Tang, H.; Liang, S.; Yao, D.; Qiao, Y. A visual defect detection for optics lens based on the YOLOv5-C3CA-SPPF network model. Opt. Express 2023, 31, 2628–2643. [Google Scholar] [CrossRef]
- Zhang, X.; Peng, J.; Zhang, Q.; Tian, K.; Tang, S.; Liang, X.; Wang, T.; Gao, X. Non-destructive analysis of rolling contact fatigue cracks using induced scanning thermography. Opt. Express 2022, 30, 42982–42994. [Google Scholar] [CrossRef]
- Wang, J.; Tian, F.; Xin, X.; Zhou, J.; Zhang, Q.; Tian, Q.; Wang, F.; Luo, B. Multi-scale self at-tention based method for automatic defect detection in electroluminescent images of semiconductor laser chips. Opt. Express 2024, 32, 46467–46488. [Google Scholar] [CrossRef]
- Li, W.H. Deep Learning-Based Surface Defect Detection for Arc Metal Additive Manufacturing. Master’s Thesis, Huazhong University of Science and Technology, Wuhan, China, 2021. [Google Scholar]
- Chen, P.; Chen, M.; Wang, S.; Song, Y.; Cui, Y.; Chen, Z.; Zhang, Y.; Chen, S.; Mo, X. Real-time defect detection of TFT-LCD displays using a lightweight network architecture. J. Intell. Manuf. 2023, 35, 1337–1352. [Google Scholar] [CrossRef]
- Bichong, D.; Mingtao, M.A. Research on Improved Mask Detection Method Based on YOLOv5 Algorithm. Comput. Eng. Appl. 2023, 59, 223–231. [Google Scholar]
- Ailing, Z.; Guangxing, T. Traffic signal detection algorithm based on YOLOv5s. J. Guangxi Univ. Sci. Technol. 2023, 34, 69–76. [Google Scholar]
- Hao, L.; Jiaoxiong, X. Metal surface defect detection method based on improved YOLOv7. Comput. Era 2023, 9, 48–53. [Google Scholar]
- Guo, X.S. Research on PCB Bare Board Defect Detection Algorithm Based on Deep Learning. Master’s Thesis, Nanchang University, Nanchang, China, 2021. [Google Scholar]
- Zhang, Y.; Yang, Y.; Sun, J.; Ji, R.; Zhang, P.; Shan, H. Surface Defect Detection of Wind Turbine Based on Lightweight YOLOv5s Model. Measurement 2023, 220, 113222. [Google Scholar] [CrossRef]
- Zixuan, Y.; Yikui, L. Research on Infrared Road Condition Detection and Recognition in Complex Environment. Mod. Comput. 2022, 28, 1–9. [Google Scholar]
- Miao, C.; Sun, D. Research on fault detection of belt conveyor drum based on improved YOLOv5s. Ind. Mine Autom. 2023, 49, 41–48. [Google Scholar]
- Woo, S.; Park, J.; Lee, J.; Kweon, I.S. CBAM: Convolutional Block Attention Module. In Proceedings of the European Conference on Computer Vision (ECCV), Munich, Germany, 8–14 September 2018. [Google Scholar]
- Qiang, F.; Zhiwei, L.; Lei, P. CC-YOLOv5: Improved YOLOv5 used for object detection in UAV aerial images. Mod. Comput. 2023, 29, 16–22. [Google Scholar]
- Wang, Z.; Zhongsheng, C.; Chaolin, L.I.; Haopeng, L. A Positive Sample-Based Visual Inspection Method of Product Surface Defects. J. Hunan Univ. Technol. 2023, 37, 69–74. [Google Scholar]
- Shui, Y.; Zhang, H.; Chen, B.; Xiong, J.; Fu, M. Method for Lightweight Crack Segmentation Based on Convolutional Neural Network. J. Hydroelectr. Eng. 2023, 42, 110–120. [Google Scholar] [CrossRef]
- Yewei, S.; Guanghai, B. Bamboo End Face Segmentation and Branch Position Detection Method Fused with Improved ASPP and CBAM. J. For. Eng. 2023, 8, 138–145. [Google Scholar]
- Wang, W. Design and Implementation of YOLOv5s-Based Platform for Detecting Sick Chickens and Monitoring Chicken House Environment. Master’s Thesis, Anhui Agricultural University, Hefei, China, 2022. [Google Scholar]
- Yang, L.I.; Caihong, Y.; Guanqun, G.; Jianchun, W. A Target Detection Method based on YOLOv5 in Multi-stage of Strawberry Growing Period. Tianjin Agric. Sci. 2022, 28, 81–90. [Google Scholar]
- Ge, Z.; Liu, S.; Wang, F.; Li, Z.; Sun, J. YOLOX: Exceeding YOLO Series in 2021. arXiv 2021, arXiv:2107.08430. [Google Scholar]
- Wu, H. Deep Learning-Based Text Detection and Recognition for Natural Scenes. Master’s Thesis, Nanchang University, Nanchang, China, 2022. [Google Scholar]
- Lu, K.W. Research on Laser Welding Inspection System for Power Battery Module. Master’s Thesis, China Academy of Machinery Science and Technology, Beijing, China, 2022. [Google Scholar]
- Shuai, H.; Chenlu, Y.; Qiulin, Z.; Xu, M.A.; Xizi, S.; Haiying, W.; Haobo, S.; Yingqi, W.U. Pedestrian detection method in disaster environment based on double branch Decoupled Head and Attention Mechanism. J. Xi’an Univ. Sci. Technol. 2023, 43, 797–806. [Google Scholar]
- Wang, L. Research on Improved Target Detection Algorithm Based on YOLO. Master’s Thesis, Jiangnan University, Wuxi, China, 2020. [Google Scholar]
- Luo-geng, X.; Shang, Z.; Hai-tao, Z.; Hua-long, Y.U.; Shang, G. Software Self-admitted Technical Debt Identification with Bidirectional Gate Recurrent Unit and Attention Mechanism. Comput. Sci. 2022, 49, 212–219. [Google Scholar]
- Guo, Y.Y. Research on Fire Flame and Smoke Recognition Algorithm Based on Deep Learning. Master’s Thesis, Ningxia University, Yinchuan, China, 2021. [Google Scholar]
- Wang, J.; Bi, L.; Ma, X.; Sun, P. An Efficient YOLOX-Based Method for Photovoltaic Cell Defect Detection. Instrumentation 2024, 11, 83–95. [Google Scholar]
- Wang, J.; Guo, X.; Xun, Y.; Liu, J.; Guo, X.; Li, Y. Longitudinal Wave Defect Detection Technology Based on Ablation Mechanism. Photonics 2024, 11, 805. [Google Scholar] [CrossRef]
- Lin, B.; Chen, W.; Fan, X.; Peng, P.; Guo, Z. Transformer-Based Improved U-Net for High-Performance Underwater Polarization Imaging. Opt. Laser Technol. 2025, 181, 111664. [Google Scholar] [CrossRef]
- Li, D.; Montes, I.; Canabal-Carbia, M.; Estévez, I.; Lopez-Coronado, O.; Guo, Z.; Campos, J.; Lizana, Á. Enhanced Characterization of Depolarizing Samples Using Indices of Polarization Purity and Polarizance–Reflection–Transformation Spaces. Adv. Photon. Nexus 2025, 4, 016009. [Google Scholar] [CrossRef]
- Fan, X.; Chen, W.; Lin, B.; Peng, P.; Guo, Z. Improved Polarization Scattering Imaging Using Local-Global Context Polarization Feature Learning Framework. Opt. Lasers Eng. 2024, 178, 108194. [Google Scholar] [CrossRef]
- Fan, X.; Lin, B.; Guo, Z. Infrared Polarization-Empowered Full-Time Road Detection via Lightweight Multi-Pathway Collaborative 2D/3D Convolutional Networks. IEEE Trans. Intell. Transp. Syst. 2024, 25, 12762–12775. [Google Scholar] [CrossRef]


Disclaimer/Publisher’s Note: The statements, opinions and data contained in all publications are solely those of the individual author(s) and contributor(s) and not of MDPI and/or the editor(s). MDPI and/or the editor(s) disclaim responsibility for any injury to people or property resulting from any ideas, methods, instructions or products referred to in the content. |
© 2025 by the authors. Licensee MDPI, Basel, Switzerland. This article is an open access article distributed under the terms and conditions of the Creative Commons Attribution (CC BY) license (https://creativecommons.org/licenses/by/4.0/).