Abstract
A platform for converting near-infrared (NIR) laser power modulation into the self-mixing (SM) signal of a quantum cascade laser (QCL) operating at terahertz (THz) frequencies is introduced. This approach is based on laser feedback interferometry (LFI) with a THz QCL using a metal-coated silicon nitride trampoline membrane resonator as both the external QCL laser cavity and the mechanical coupling element of the two-laser hybrid system. We show that the membrane response can be controlled with high precision and stability both in its dynamic (i.e., piezo-electrically actuated) and static state via photothermally induced NIR laser excitation. The responsivity to nanometric external cavity variations and robustness to optical feedback of the QCL LFI apparatus allows a highly sensitive and reliable transfer of the NIR power modulation into the QCL SM voltage, with a bandwidth limited by the thermal response time of the membrane resonator. Interestingly, a dual information conversion is possible thanks to the accurate thermal tuning of the membrane resonance frequency shift and displacement. Overall, the proposed apparatus can be exploited for the precise opto-mechanical control of QCL operation with advanced applications in LFI imaging and spectroscopy and in coherent optical communication.
1. Introduction
Laser feedback interferometry (LFI) [1] is a homodyne technique where the response of a laser to optical feedback (OF), namely, the self-mixing (SM) signal [2], is detected to perform ultrasensitive metrology, such as obtaining the distance and motion of reflective targets acting as external mirrors or the permittivity of the external medium. The universal nature of the SM effect enabled LFI applications throughout laser systems as diverse as solid-state [3], gas [4], and semiconductor [5,6,7] laser sources. Thanks to their intrinsic stability to OF [8] and the highly sensitive detection of the SM signal in their voltage modulation without the need of an external photodetector, quantum cascade lasers (QCLs) emerged as the most efficient and compact tools [8] for LFI at mid-infrared (IR) and terahertz (THz) frequencies. A QCL can act as a source, mixer, and shot-noise-limited detector, allowing a broad range of applications [9], including the following: characterization of internal laser properties [10,11], laser emission spectroscopy [12], displacement sensing [13,14], trace gas detection [15,16], material analysis [17,18], and far-field [19,20] and near-field coherent imaging [21,22,23].
In general, LFI is primarily used to characterize external cavities and monitor their temporal evolution through the SM signal. In this study, we target the reverse approach: exploiting OF to precisely modulate the SM voltage of a THz QCL. By controlling the feedback dynamics through the photothermally induced motion (driven by a pumping laser) of a trampoline resonator (acting as the external mirror for the QCL cavity), we aim to demonstrate a robust platform for signal transfer from the near-infrared (NIR) domain to the THz frequency range. In this configuration, the power modulation of the NIR laser commands the evolution of the SM signal of the THz QCL. The link between these two frequency regimes intends to show the broadest coverage of the optical spectrum for the proposed hybrid laser scheme, spanning from near-telecom wavelengths (in principle extendable to optical frequencies) to the ultimate band limit for semiconductor lasers. Thanks to the peculiar properties of THz light, the exploitation of LFI with THz QCLs enables the possible implementation of advanced LFI-based imaging and spectroscopy (in fields like biomedicine/biology and security screening), where the mechanical resonator could act as a tuning element of the THz QCL operation, providing adaptive control over the sensing or imaging process.
For the resonator, we choose a thin, high-stress stoichiometric, metal-coated silicon nitride () trampoline membrane. The metal coating on the membrane front side serves as both the reflective surface for the THz beam and the absorption layer for NIR laser radiation. This resonator platform has been originally introduced as ideal for optomechanics [24], such as for quantum experiments at room temperature [25,26], and it has been later exploited for sensing experiments [27], where a compound cavity laser diode was used to measure the thermal noise of the membrane acting as the external vibrating mirror. More recent examples show the potential of the trampoline mechanical resonator design for the high-performance sensing of position [28], acceleration [29], and electron spin resonance [30]; and for light detection in ultra-broadband graphene-based [31] NEMS or electrode-integrated membrane MEMS operating in the NIR [32] and sub-THz band [33,34]. In the framework of LFI, reflective trampoline membranes were introduced to demonstrate the ability of measuring oscillation amplitudes with deeply subwavelength precision within the SM voltage of a THz QCL [35], while, in another work, the SM signal of an NIR laser was exploited to detect photothermally induced resonant frequency variations in a membrane used as a micromechanical bolometer [36].
In the present experiment, we implement these previous SM configurations by performing THz QCL LFI from the metal-coated facet of a trampoline membrane that is collinearly excited from the rear side by a NIR diode laser. This second laser controls the membrane movement, which, in turn, determines the OF phase evolution of the THz QCL and, therefore, its SM voltage. The absorption of NIR light by the metal layer generates heat, inducing thermomechanical stress that displaces the membrane equilibrium position and shifts its resonance frequency. The recording of the THz QCL SM signal allows the measurement of the displacement of the resonator at both its static and dynamic (in the presence of piezo-electric excitation) equilibrium under continuous wave (CW) NIR illumination. By sweeping the piezo-excitation frequency and using it as the reference for the lock-in amplified detection of the SM signal, we characterize the membrane resonant motion. This includes measuring the maximum trampoline oscillation amplitude, quality factor and resonance frequency, therefore, the photothermally-induced resonance red-shift with respect to the non-illuminated state. The measured SM signal is found to be in agreement with the numerical solutions of the Lang–Kobayashi equations (governing the laser-population inversion under OF) in both the static and actuated states of the membrane. These results agree with finite element (FEM) simulations of the resonator thermomechanical dynamics under illumination. The reproducibility of the membrane mechanical response (both in amplitude and frequency) after several cycles of NIR-induced thermal deformations guarantees the consistent control of the THz QCL SM signal over time via the custom and tailored modulation of the NIR beam power. Interestingly, we show the possibility of independently encoding external laser modulations within the THz SM signal via both photothermally induced membrane frequencies and displacement shifts. As a demonstration of the potential of the proposed platform, we show the feasibility of successfully transferring a signal encoded in the NIR laser power to the SM voltage of the THz QCL, with a bandwidth limited by the thermal response of the mechanical resonator.
2. Experimental Apparatus
The experimental setup, comprising both optics and electronics for laser powering and signal readout, is depicted in Figure 1a. The optical scheme is composed of two branches, a NIR and a THz QCL beam path, impinging on the same suspended mechanical resonator as the final reflective movable target. As shown in the optical image reported in Figure 1b, the resonator consists of a thick trampoline membrane with a central plate and tethers clamped to a Si supporting frame. On the membrane surface, a thick disc layer with a radius of acts as a nearly perfect reflective mirror for the THz beam and as an absorption layer for NIR excitation. All membrane fabrication details can be found in [33]. The resonator is fixed on a pass-through-holed piezo-electric actuator and installed inside a room temperature vacuum cell equipped with two thick cyclic olefin copolymer (COC) windows to allow transparency and the access of both NIR and THz beams relative to the membrane. The NIR light—CW emitted by a laser diode that operates as the “master” laser (ML) source commanding the resonator deformation and consequent displacement—is aligned and focused on the rear side of the membrane by two flat mirrors and a 10×, 0.28 NA, 34 mm focal length objective lens. The THz beam is generated by a single metal long, wide ridge QCL with a thick GaAs-AlGaAs active region based on longitudinal–optical phonon-assisted miniband transitions [37]. This device was already calibrated and demonstrated to be suitable for imaging and LFI applications [38,39]. The CW-powered THz QCL is fixed at a 40 mA higher current with respect to the lasing threshold (∼810 mA) and a temperature of (using a continuous-flow helium-gas-cooled cryostat) to achieve stable single-mode emission at () with an output power of ∼450 μW. After passing through the cryostat COC window, the THz beam is collimated and focused on the center of the membrane metal side using two off-axis gold-coated parabolic mirrors with a diameter and a unitary focal ratio (f-number ), resulting in a less than laser spot size. The vacuum chamber is mounted on a three-axis motorized stage achieving a sub-micrometer resolution of the membrane positioning with respect to the THz source. While the the x- and y-axis stages facilitate the sample alignment on the orthogonal plane with respect to the laser beam, the z-axis stage allows the membrane to be scanned along the optical path to vary the external laser cavity length (L, defined as the distance between the membrane and the QCL emission facet) of the THz LFI apparatus. The atmosphere inside the vacuum cell is constantly kept at a pressure of throughout all performed experiments described in the following sections.
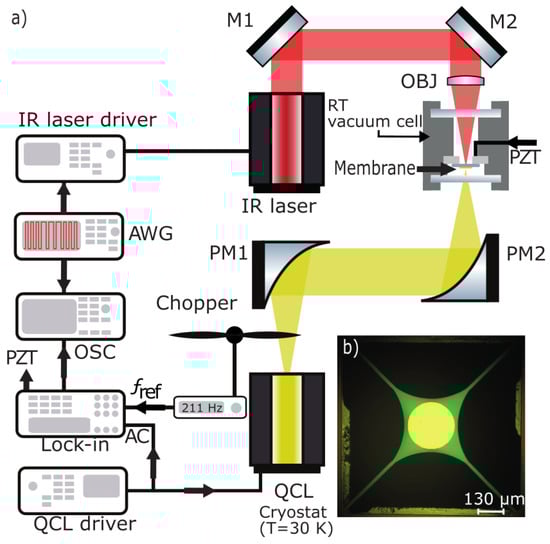
Figure 1.
(a) Sketch of the experimental setup with the optical and electronic apparatus for SM signal generation and readouts. The NIR laser and THz QCL beams are reported in red and yellow, respectively. The optical components are as follows: two flat mirrors (M1 and M2) and a 10× objective lens (OBJ) for aligning and focusing the NIR beam on the membrane back side and two parabolic mirrors (PM1 and PM2) for collimation and focusing the metal-coated side of the membrane fixed in the COC windows equipped with a vacuum cell for environment pressure control. In the SSM configuration, a chopper is used to modulate the THz power at the reference frequency () for the lock-in amplified detection of the AC-coupled voltage (i.e., SM signal) of the CW-driven THz QCL. In the ASM configuration, the piezo-electric actuator (PZT) provides both the driving and reference frequency for the lock-in measurement of the SM voltage. An arbitrary waveform generator (AWG) is used to generate NIR laser modulations while an oscilloscope (OSC) monitors the SM signal evolution. (b) Optical image of the fabricated membrane resonator with a metal disc centered on the trampoline plate.
3. LFI Without NIR Membrane Excitation
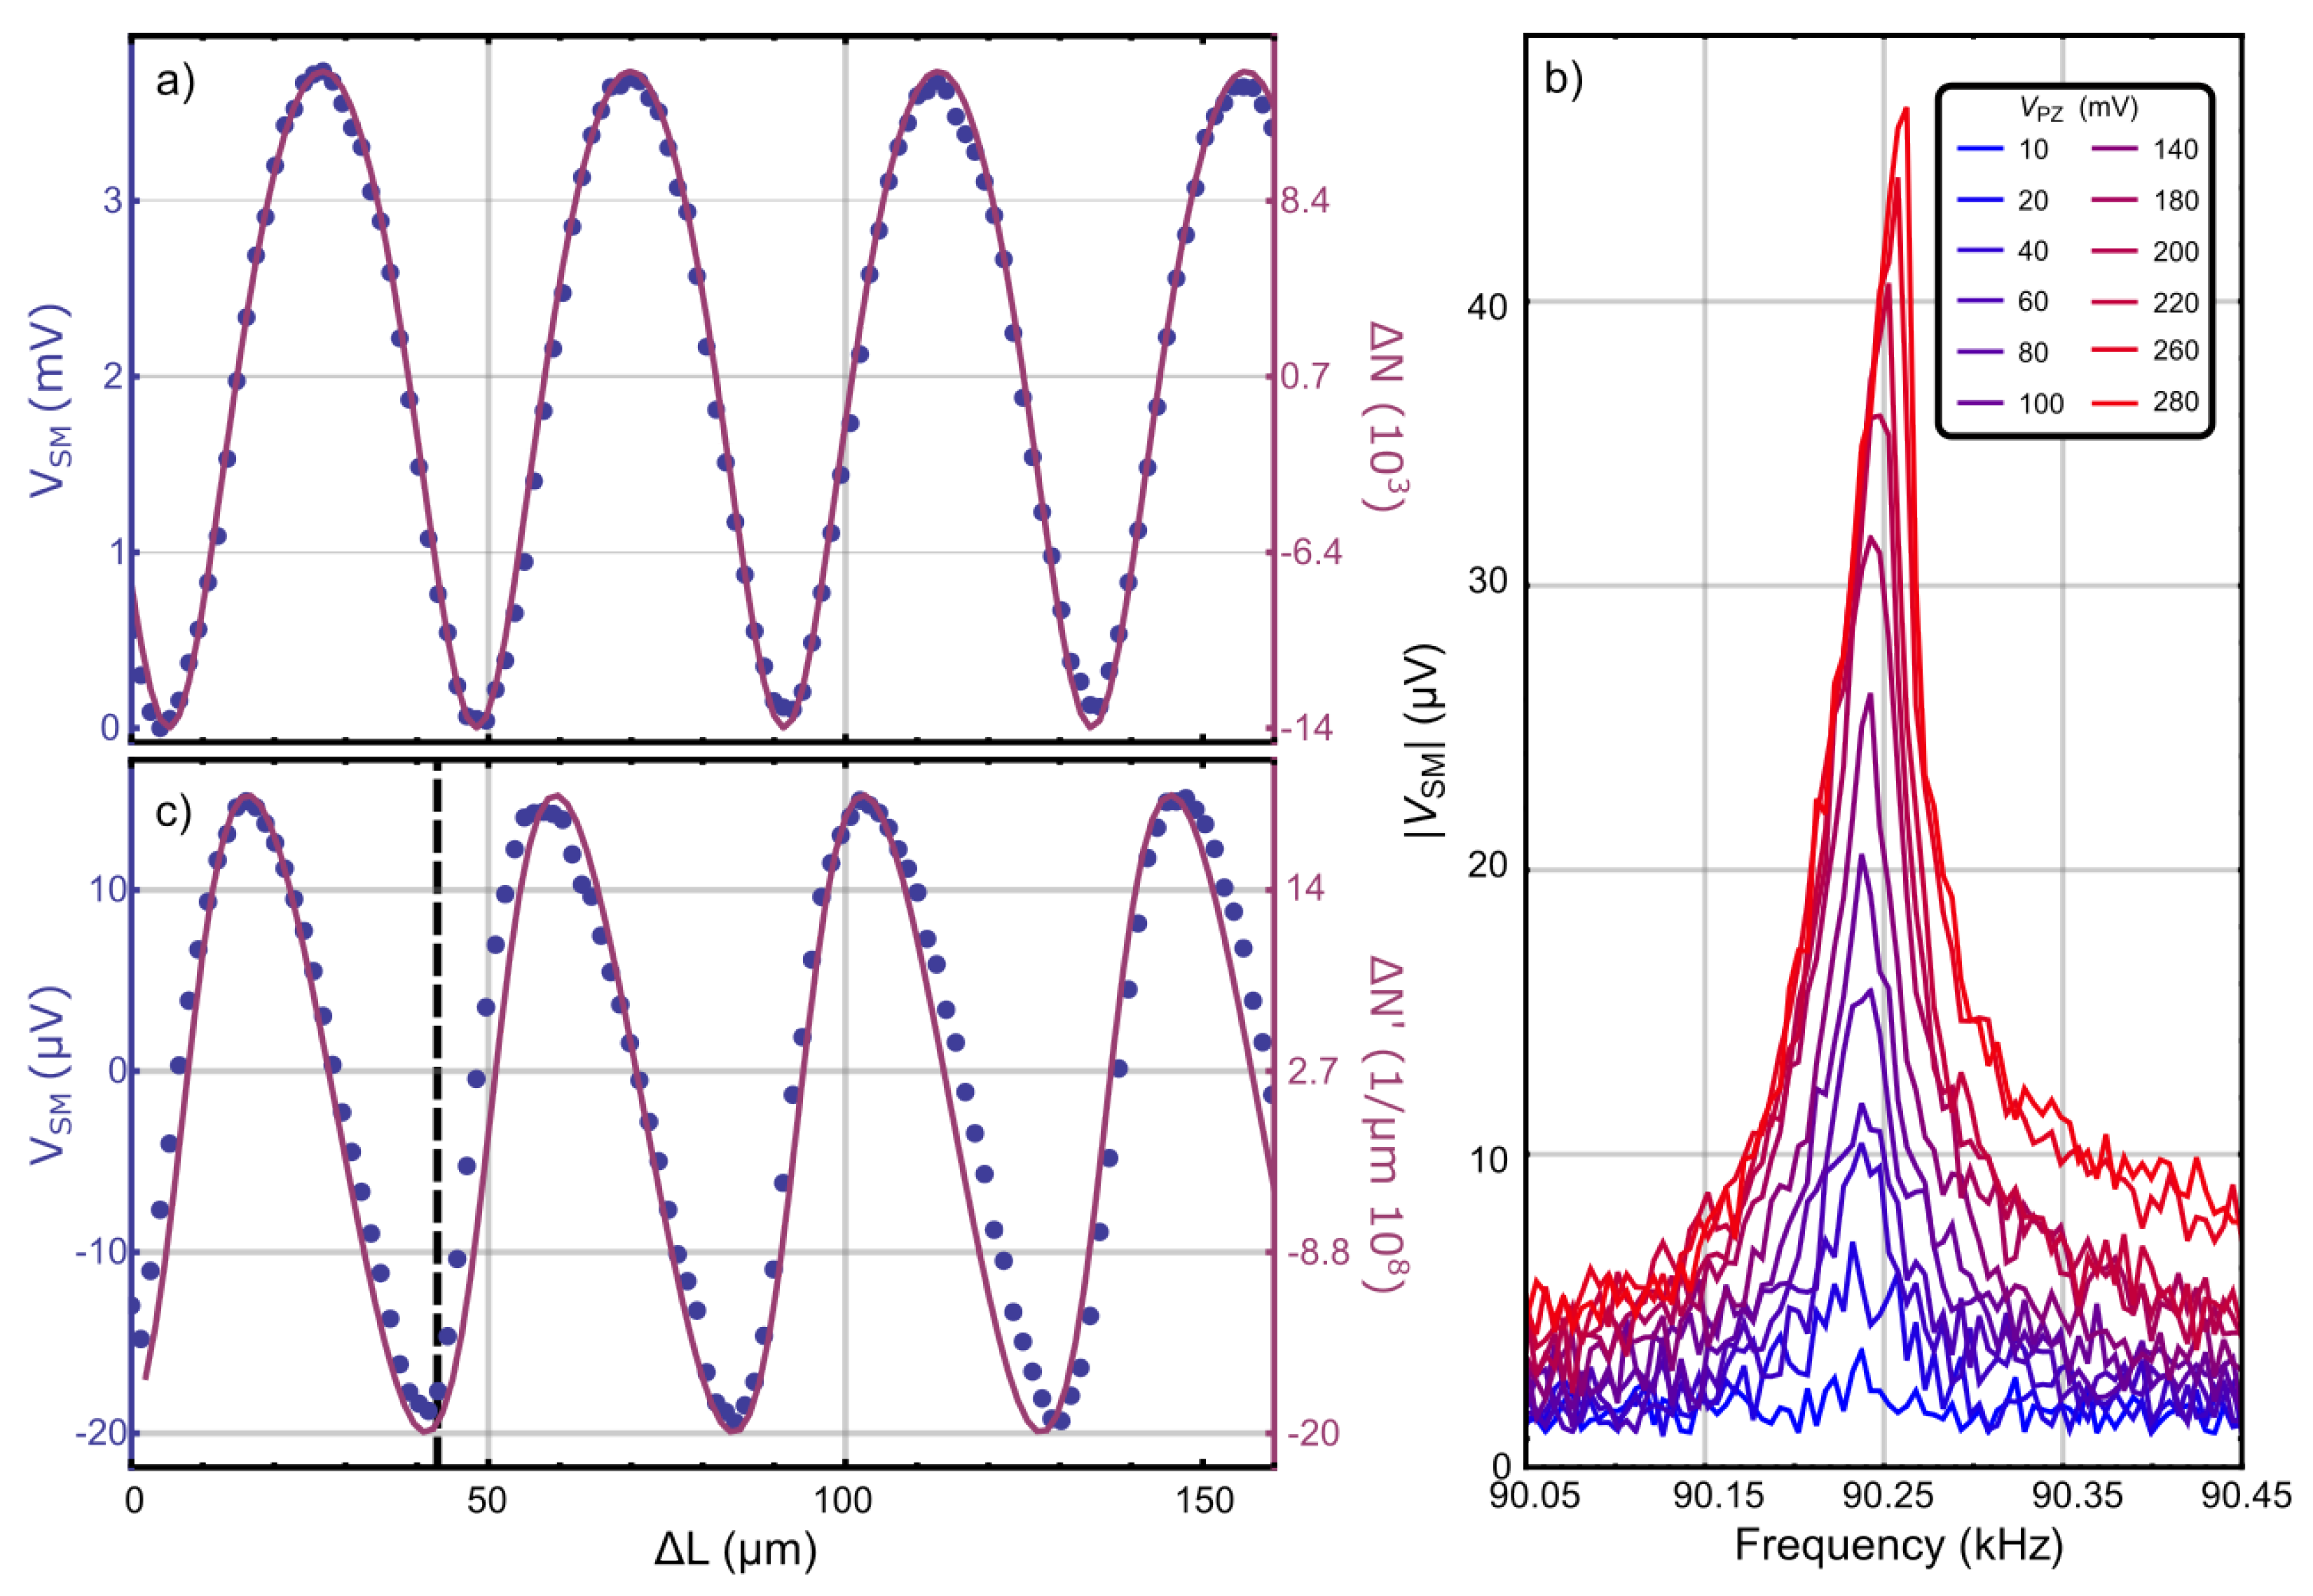
Two distinct LFI measurements of the THz QCL SM signal are performed, and we defined them as stationary SM (SSM) and alternate SM (ASM) detection. In the SSM configuration, the SM signal is measured by directly recording the lock-in amplified QCL voltage () synchronized to the QCL laser power modulation frequency () imposed by a mechanical chopper placed in front of the QCL emission facet (as shown in Figure 1a). An example of the measured obtained by sweeping the membrane rest position (with a step size) toward the QCL emission facet is shown in Figure 2a. is plotted as a function of the external cavity variation, , showing the characteristic fringe periodicity of the SM response. The SM signal can be computed by solving the Lang–Kobayashi equations, which describe the laser operation under OF [40]. The OF-affected laser frequency () can be numerically estimated using the following equation:
where is the emission frequency without OF; and are the laser cavity and external cavity round-trip times, respectively; is the Henry’s linewidth enhancement factor; and is the OF coupling rate. The variation in the laser inversion population due to OF is given by:
where G is the modal gain factor. Starting from the initial external cavity optical length, , is calculated from Equation (2) as a function of after computing the solution for from Equation (1) at each L. The numerical results for are reported via the solid curve in Figure 2a. A good agreement with the measured is found using the following best-fitting parameters: , . G and are fixed at and 0.5, respectively, according to the THz QCL LFI literature [9,11,41]. In agreement with the experimental quasi-sinusoidal shape of , the fit confirms that the laser is in the weak OF coupling regime with feedback coefficient , where only a single stable solution for is found.
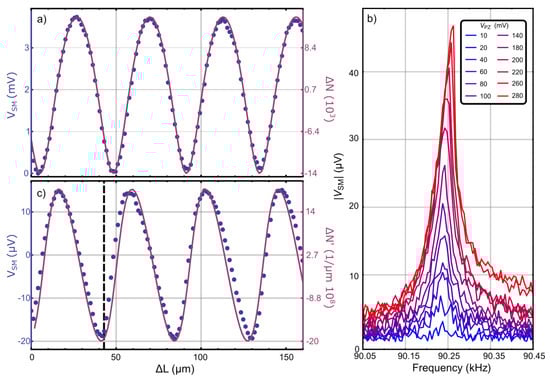
Figure 2.
(a) Experimental (blue dots) and corresponding calculated (solid line) as a function of the position obtained in the SSM configuration. (b) spectra measured by sweeping the piezo-driving frequency for different in the ASM configuration at a fixed pressure of . (c) acquired by applying with and sweeping (blue dots). The derivative of the calculated in (a) is also reported via the solid curve. The black dashed line indicates the relative membrane position fixed to obtain the values reported in (b).
In the ASM measurements, the membrane position is kept fixed, and a voltage modulation is applied to the piezo-electric actuator. This modulation serves two purposes: it excites the membrane motion and it acts as the reference signal for the lock-in amplified detection of the QCL . Unlike the SSM configuration, no chopper-induced power modulation is required in this case. Figure 2b shows the amplitude obtained from the lock-in amplifier by sweeping the piezo-electric actuator driving frequency () in the range. The reported curves present a rising signal (from blue to red colors) by increasing the piezo-driving voltage amplitudes () from 10 to . The spectra can be analyzed using the model of a damped mechanical oscillator, where the mechanical susceptibility is defined as follows:
with and representing the membrane resonance frequency and damping coefficient, respectively. The oscillation amplitude of the membrane trampoline in Fourier space can be thus described as , where is the maximum oscillation amplitude. By using Equation (3), is found to be peaked at with a quality factor of . The observed resonance corresponds to the excitation of the membrane fundamental mode where the membrane trampoline oscillates as a whole orthogonally to the chip plane thanks to the tethers elongation, as confirmed via FEM simulations (reported in Appendix A) and consistent with a previous work with similar resonator designs [35]. The latter experiment demonstrated the independence of from the THz impinging power by detecting no resonance variation frequency between independent THz LFI and laser Doppler vibrometry measurements. Therefore, a photothermal shift of the resonance frequency due to THz radiation absorption can be neglected, and the measured mechanical response can be considered that of the bare resonator. A linear mechanical response is observed up to while Duffing-like features start to arise beyond this voltage amplitude. is therefore maintained throughout all following experiments to guarantee coherence between measurements and avoid any frequency shifts from a piezo-voltage-induced mechanical non-linearity. In order to maximize the signal shown in Figure 2b, the membrane positions giving the maximum values are identified. This is obtained by sweeping at fixed and values, and monitoring . The recorded signal is reported in Figure 2c. These data are in agreement with the derivative of the numerical solution for (), whose peak and dip positions indicate values where the membrane vibration amplitudes (A) produce the maximum response in the ASM configuration, i.e., the highest LFI sensitivity to vibrations. Specifically, the maximized ASM signal reported in Figure 2b is achieved by fixing the membrane at , as highlighted by the dashed vertical line of Figure 2c. Interestingly, by obtaining the derivative of the static in Figure 2a, a maximum slope coefficient of is obtained, which reveals that oscillation amplitudes as low as a few nanometers can in principle be detected. Using an independent laser Doppler calibration to match the oscillation amplitude to the piezo-electric voltage (), we can estimate that our THz QCL LFI is capable of detecting a minimum of oscillation amplitude.
4. LFI with NIR Membrane Excitation
In this section, we report the THz QCL LFI characterization of the membrane mechanical response under the NIR illumination provided by the ML diode. The wavelength of NIR radiation falls inside the band gap of the THz QCL active region avoiding possible alterations in the QCL carrier density due to interband transitions induced by collinear NIR radiation, therefore avoiding the need for a NIR optical filter in the THz beam path.
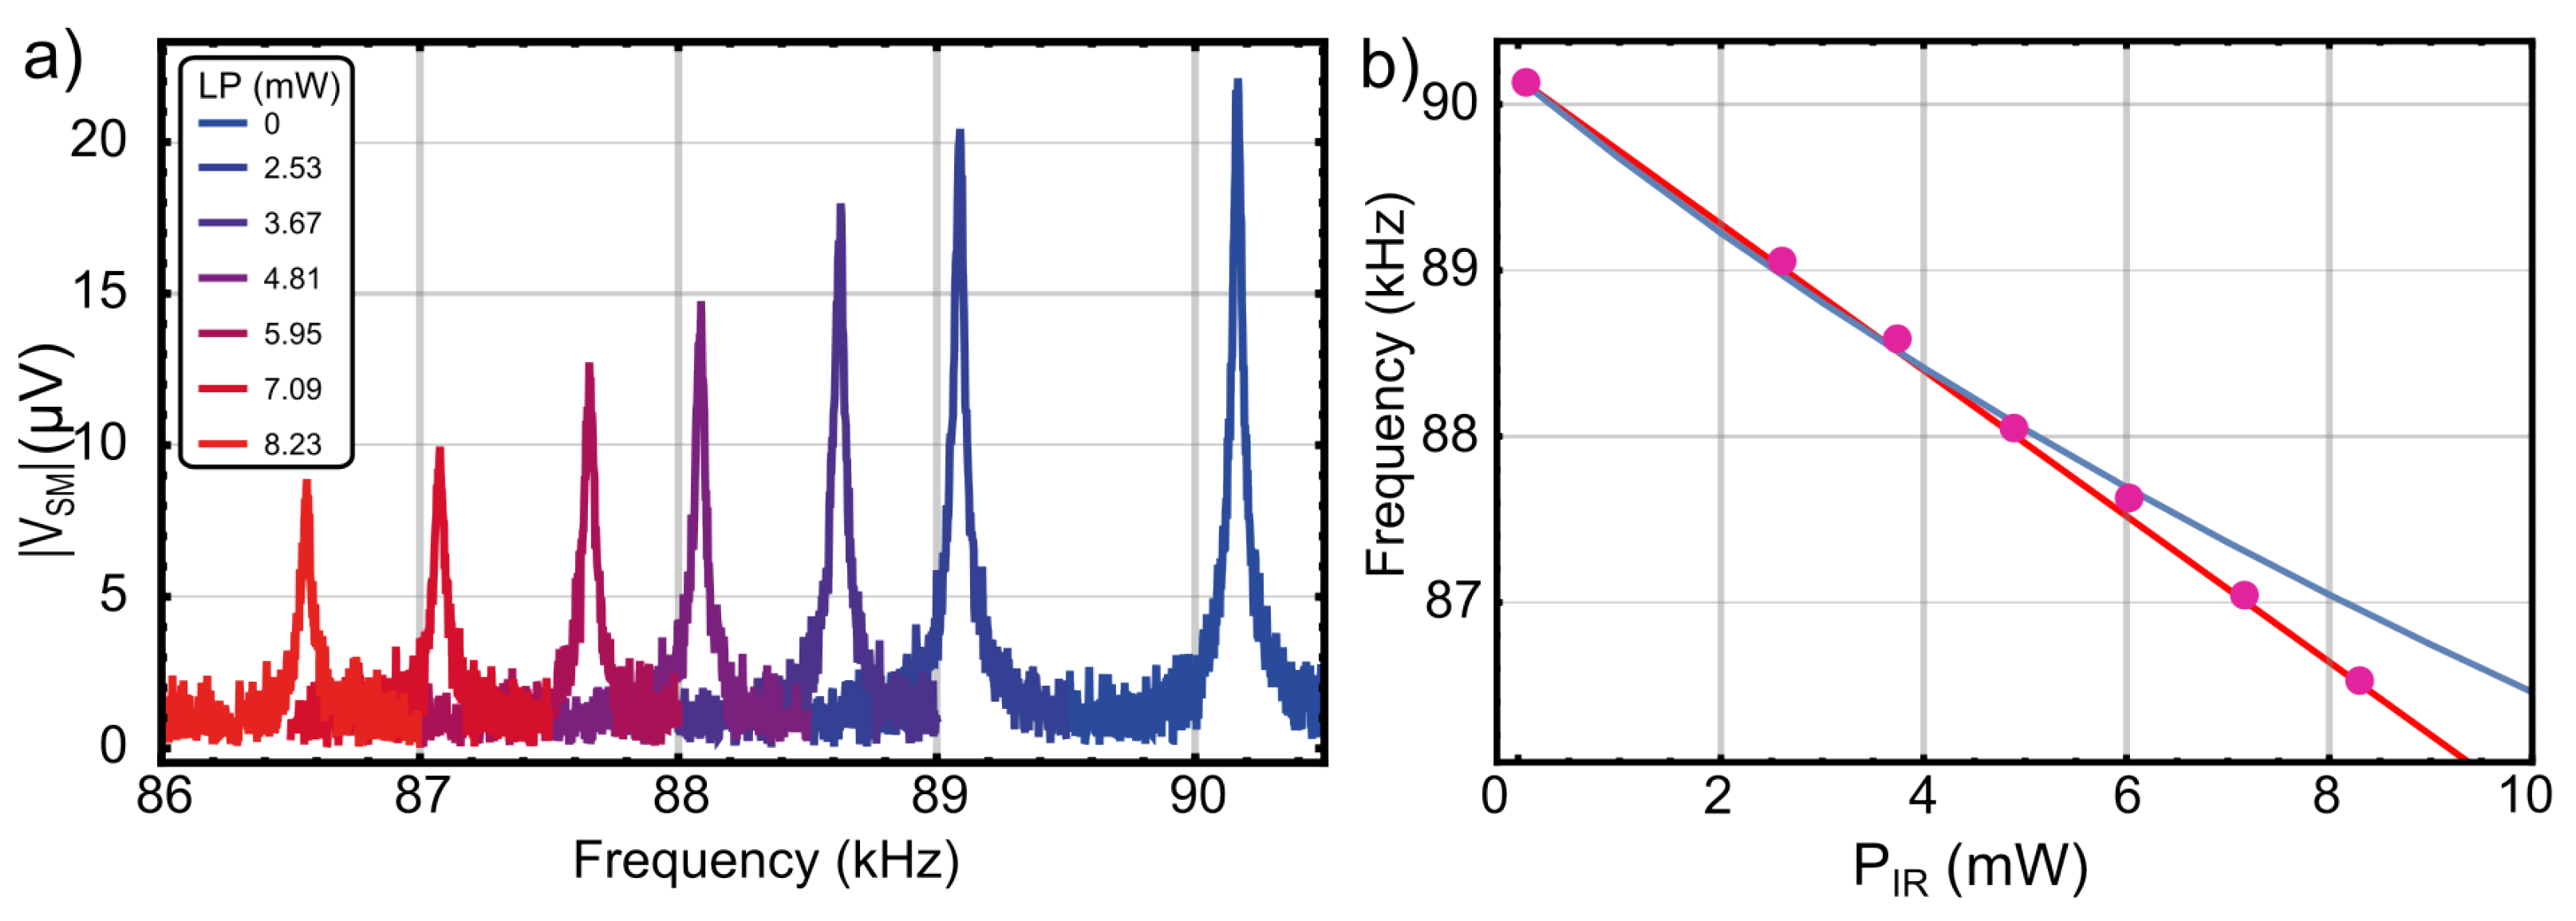
First, with the membrane fixed at and actuated by applying , THz QCL spectra are acquired in the ASM configuration for different NIR ML powers (, in the range) focused on the rear side of the trampoline membrane. The corresponding results are shown in Figure 3a. Two distinct effects associated with the NIR power illumination can be observed. As is increased, a resonance red-shift and a reduction in peak amplitude can be clearly observed. Both effects originate from the NIR-induced photothermal heating of the trampoline membrane. The metal bilayer on the trampoline absorbs a fraction of the NIR ML light, leading to a relaxation in tension on the membrane compared to room-temperature conditions, thereby resulting in a red-shift relative to the resonance frequency. While (at 1 wavelength) the gold layer mostly contributes to the membrane reflection (with an estimated absorption of [42]), the Cr layer dominates the membrane optical absorption with an amplitude that can increase by several percentages relative to the incoming NIR power [43] due to multiple reflection interference in the thin /Cr/Au-layer stack. From FEM thermo–mechanical simulations, where thermal material properties are fixed as reported in Table A1 of Appendix A, we phenomenologically observe that an effective absorption of the metal bilayer of correctly reproduces the membrane thermo–mechanical response, as described in the following sections. The frequency shift as a function of is reported in Figure 3b, showing a linear trend with . The simulated photothermal frequency shift (obtained as described in Appendix A) is also reported in the same graph. A good agreement is found up to , while a deviation is observable at a higher power level that is ascribed to a geometric non-linearity arising in the simulations, which is not yet observable in the experiment throughout the investigated power range of irradiation.
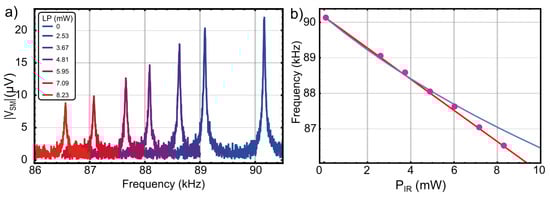
Figure 3.
(a) spectra measured with under different focused on the trampoline membrane. The first spectrum on the right side of the plot represents the outcomes obtained without NIR illumination. (b) Membrane resonance frequency as a function of NIR ML power retrieved from (a) (purple dots, and corresponding linear fit) and calculated via FEM simulations (solid blue line).
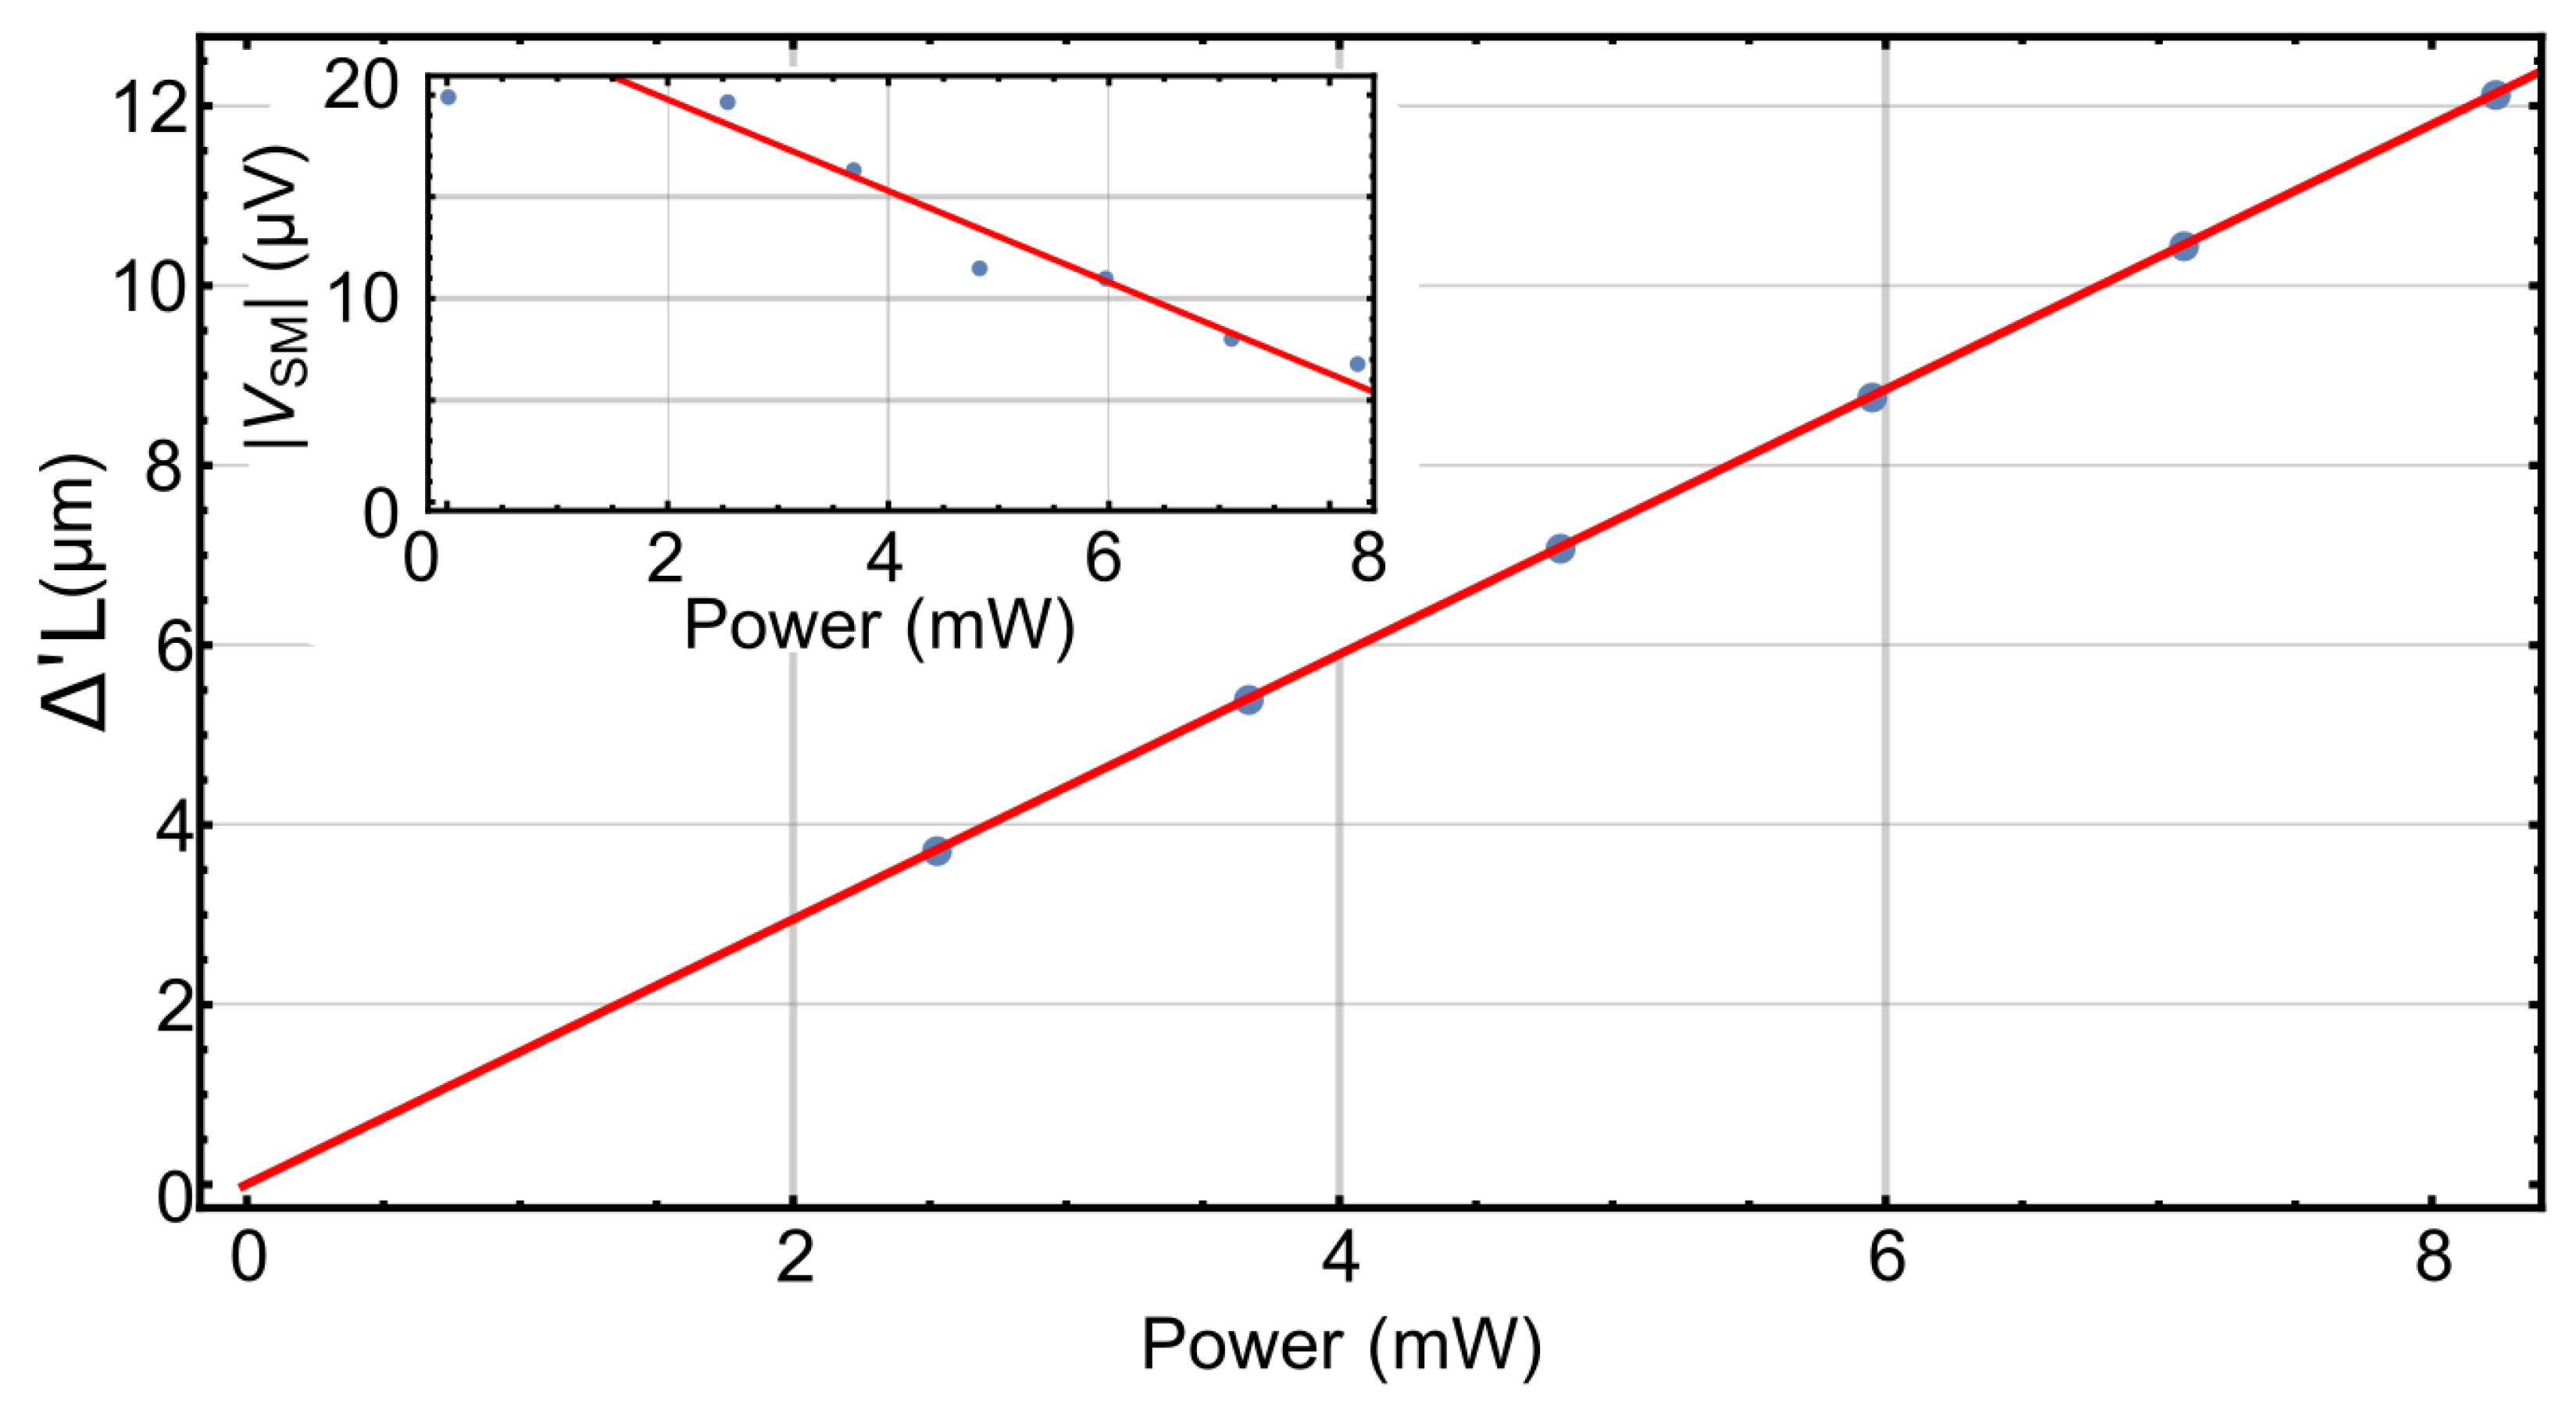
The second effect of NIR CW illumination is a decrease in the peak amplitude when an increase in NIR ML power occurs, which is highlighted by the inset of Figure 4. The peak values are obtained via a Lorentzian fit (using Equation (3)) of the spectra of Figure 3a. Starting from , the data show a linear dispersion with a slope coefficient of . As the CW NIR excitation power is not expected to affect the membrane oscillation amplitude (as confirmed by [36]), this effect can be explained by a shift in the membrane dynamical equilibrium position along the cavity axis. FEM simulations show that this membrane deformation points toward the metal-coated side, which in turn reduces the external optical path, in both the static and actuated states of the resonator, as shown in Figure A2 of Appendix A. The direction of the displacement in the membrane equilibrium position is determined by the z-axis geometric asymmetry induced by the metallization. Accordingly to the fixed absolute membrane position , this membrane displacement direction implies a consequent quasi-linear reduction in (as can be observed in Figure 2c), which is indeed confirmed by the spectra as a function of NIR power. In order to experimentally quantify the relative displacement of the membrane equilibrium position () as a function of in the linear response regime, we convert the measured Lorentzian amplitudes, recorded in volts, into cavity displacements using the calculated average derivative of the of Figure 2c between its minimum and maximum values (only considering the linear fitting of the positive slopes). This leads to an average slope coefficient of . The volts-to-power ratio and volts-to-micrometer coefficients establishes the link between the photothermally induced membrane relative displacement and . Figure 4 reports the calculated as a function of power with a quantified slope coefficient of . This change in the membrane dynamical equilibrium position is also found in agreement with the increment of the external cavity length needed to recover the same spectrum amplitude at the original reference membrane equilibrium position without NIR excitation.
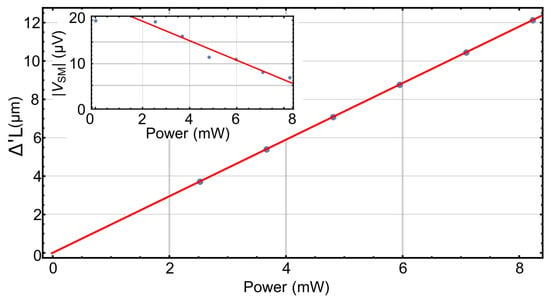
Figure 4.
Calculated relative displacements (blue points) of the membrane dynamical equilibrium position as a function of NIR impinging power under constant piezo-electric excitation. The red dashed line highlights the linear dispersion. Inset: peak amplitude values as a function of obtained from a Lorentzian fit of the spectra in Figure 3a.
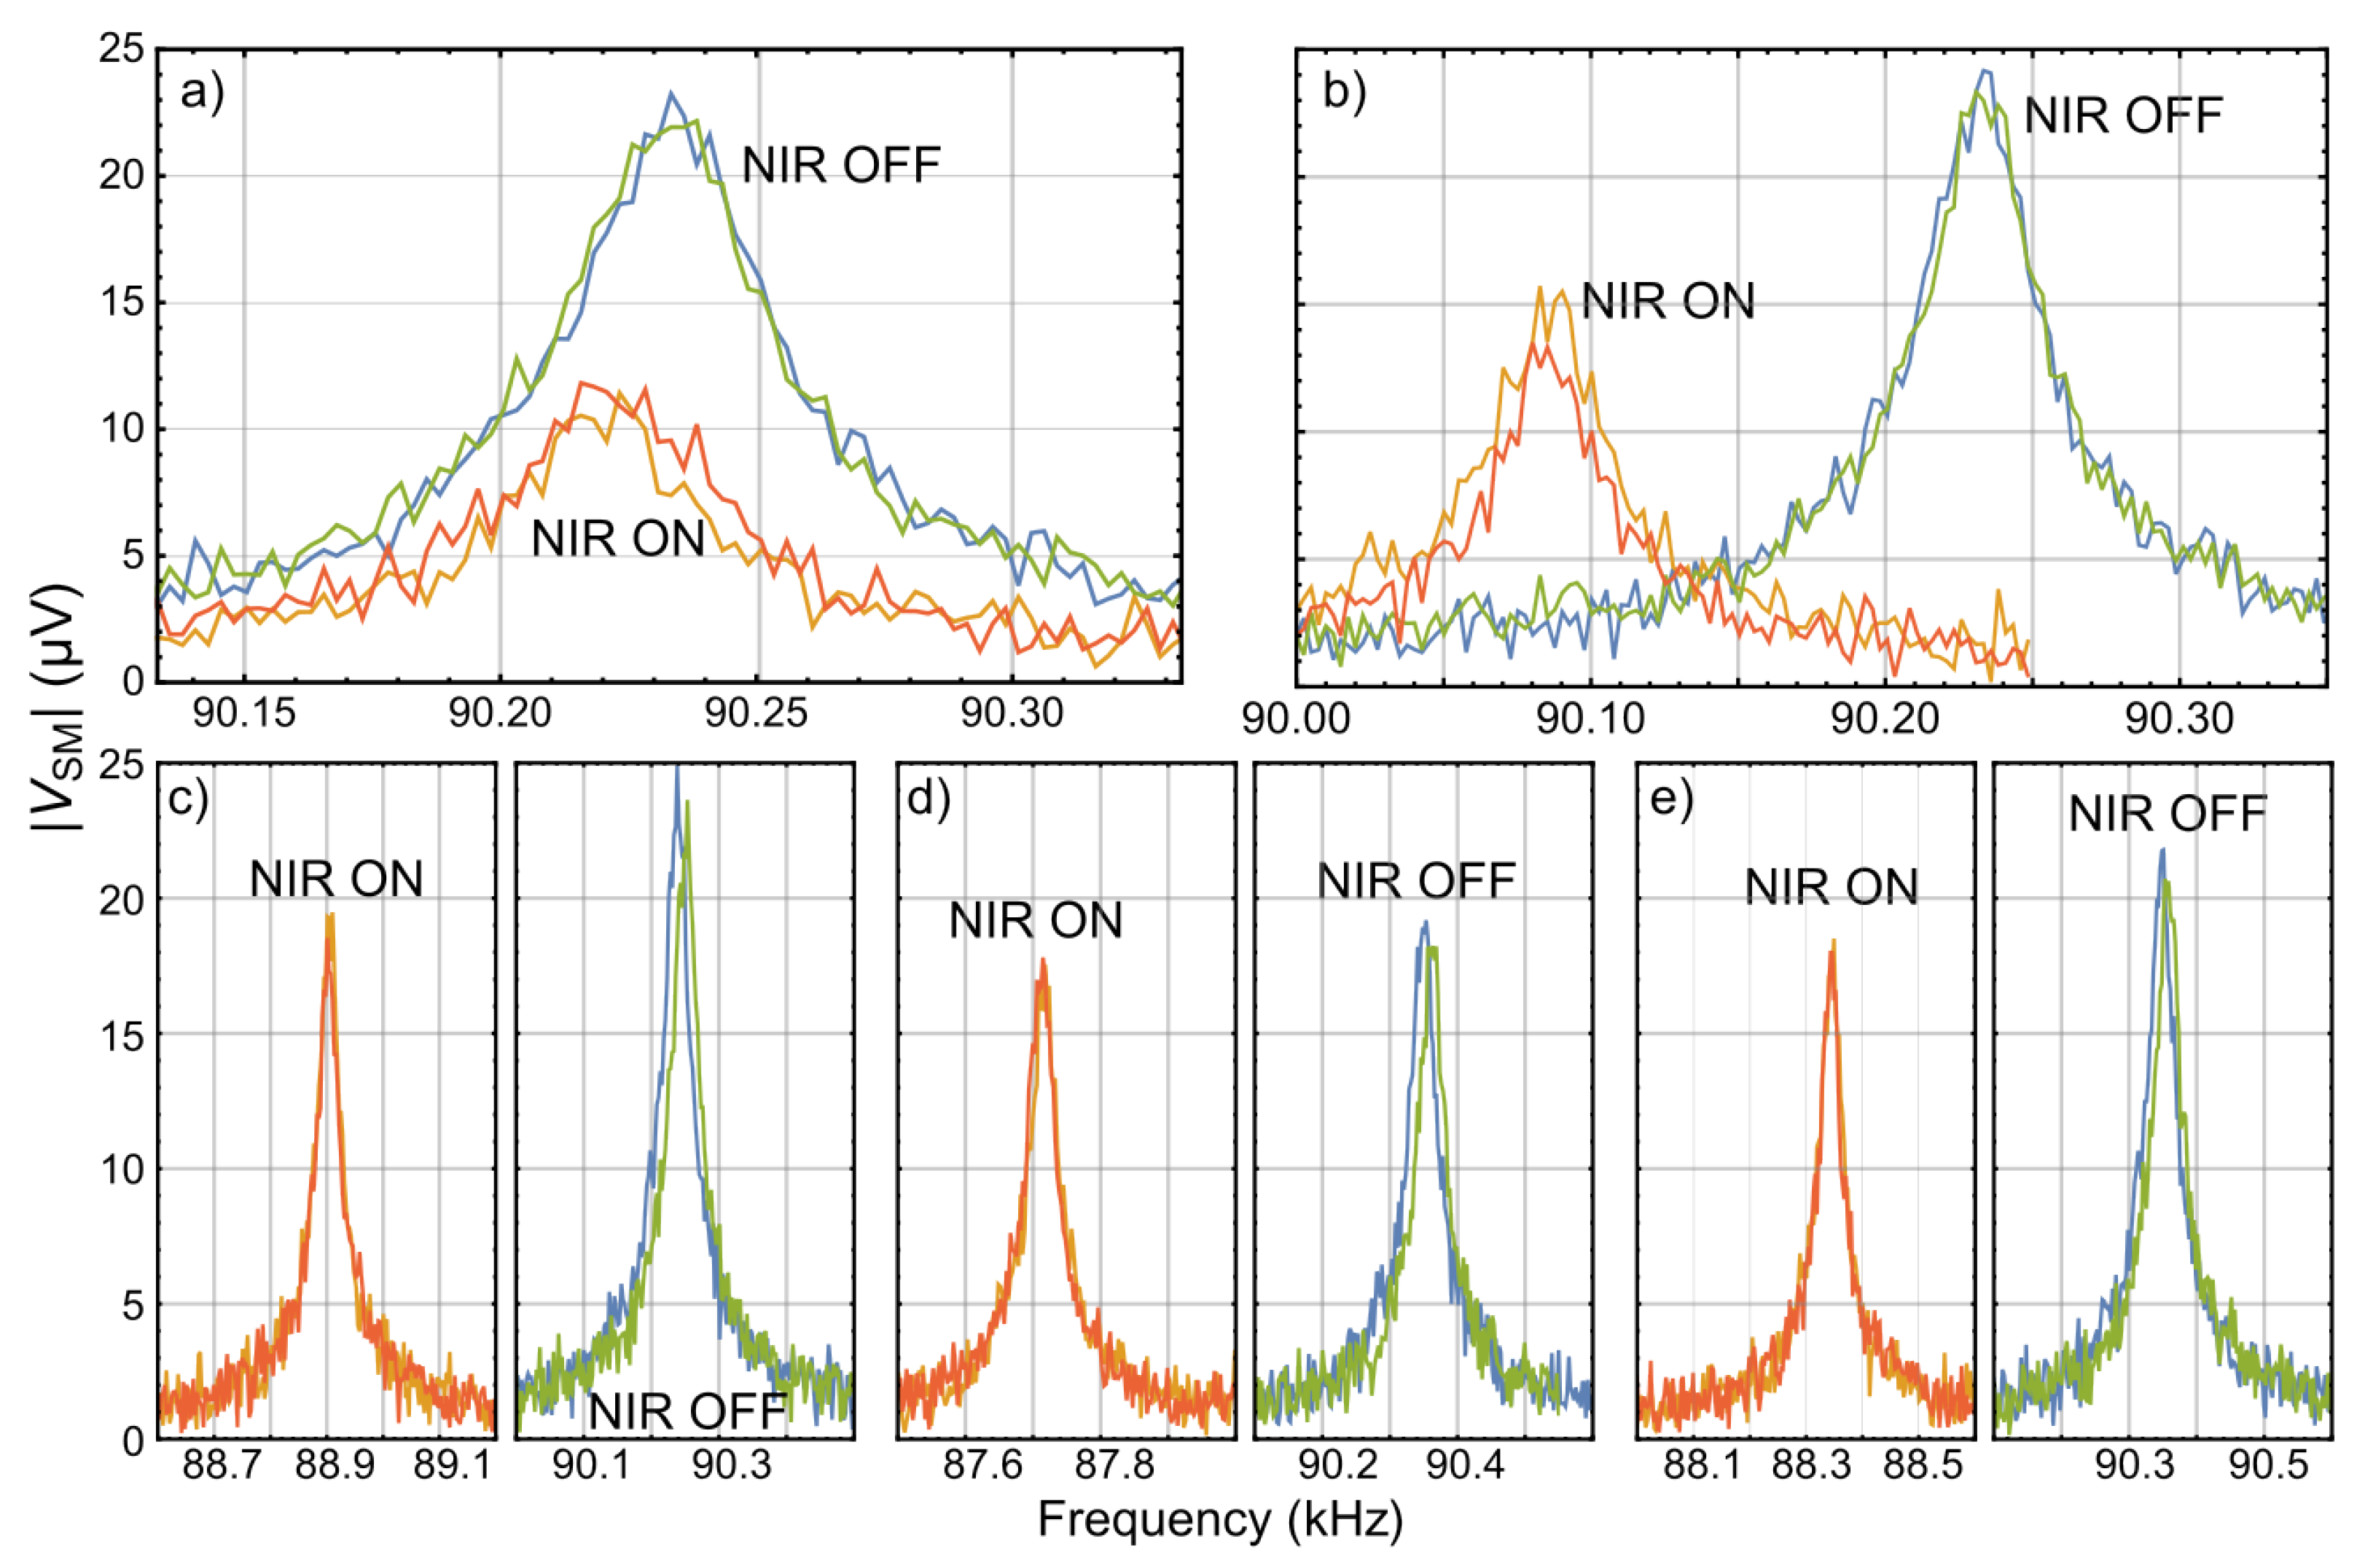
In the subsequent study, we investigate the reproducibility of the performed measurements by showing the repeatability of the observed effects in the mechanical response of the membrane under NIR illumination, such as its corresponding resonance frequency and position shift. Figure 5 displays the spectra recorded for five different powers in order to compare the response after repeated photothermal cycles. Each plot reports the spectra after two representative ON/OFF excitation cycles. For the investigated range of powers, the spectra in the excited states are observed to always recover the same resonance frequency and signal/oscillation amplitude. A little response variation in the not-excited state is observed for , but with almost the same small blue-shift () and amplitude decrease (), which we ascribe to a systematic hysteresis of the membrane equilibrium position after thermal relaxation. Overall, the observed stability of the membrane response to NIR excitation demonstrates the consistency of the acquired signals over time, therefore guaranteeing a reliable transfer of the NIR-induced membrane response in terms of frequency and position shifts in the THz QCL SM signal.
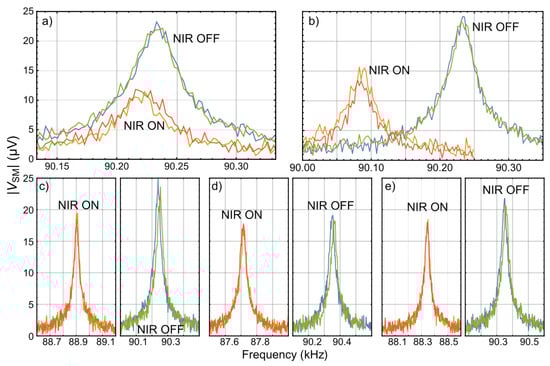
Figure 5.
spectra showing the membrane response and stability after ON/OFF cycles of NIR ML illumination. Each plot shows two NIR excitation cycles at a specific NIR power. The blue, red, green, and orange curves represent the response at the initial ML off state, first NIR excitation, second ML OFF state, and second NIR excitation state, respectively. (a) , (b) , (c) , (d) , and (e) .
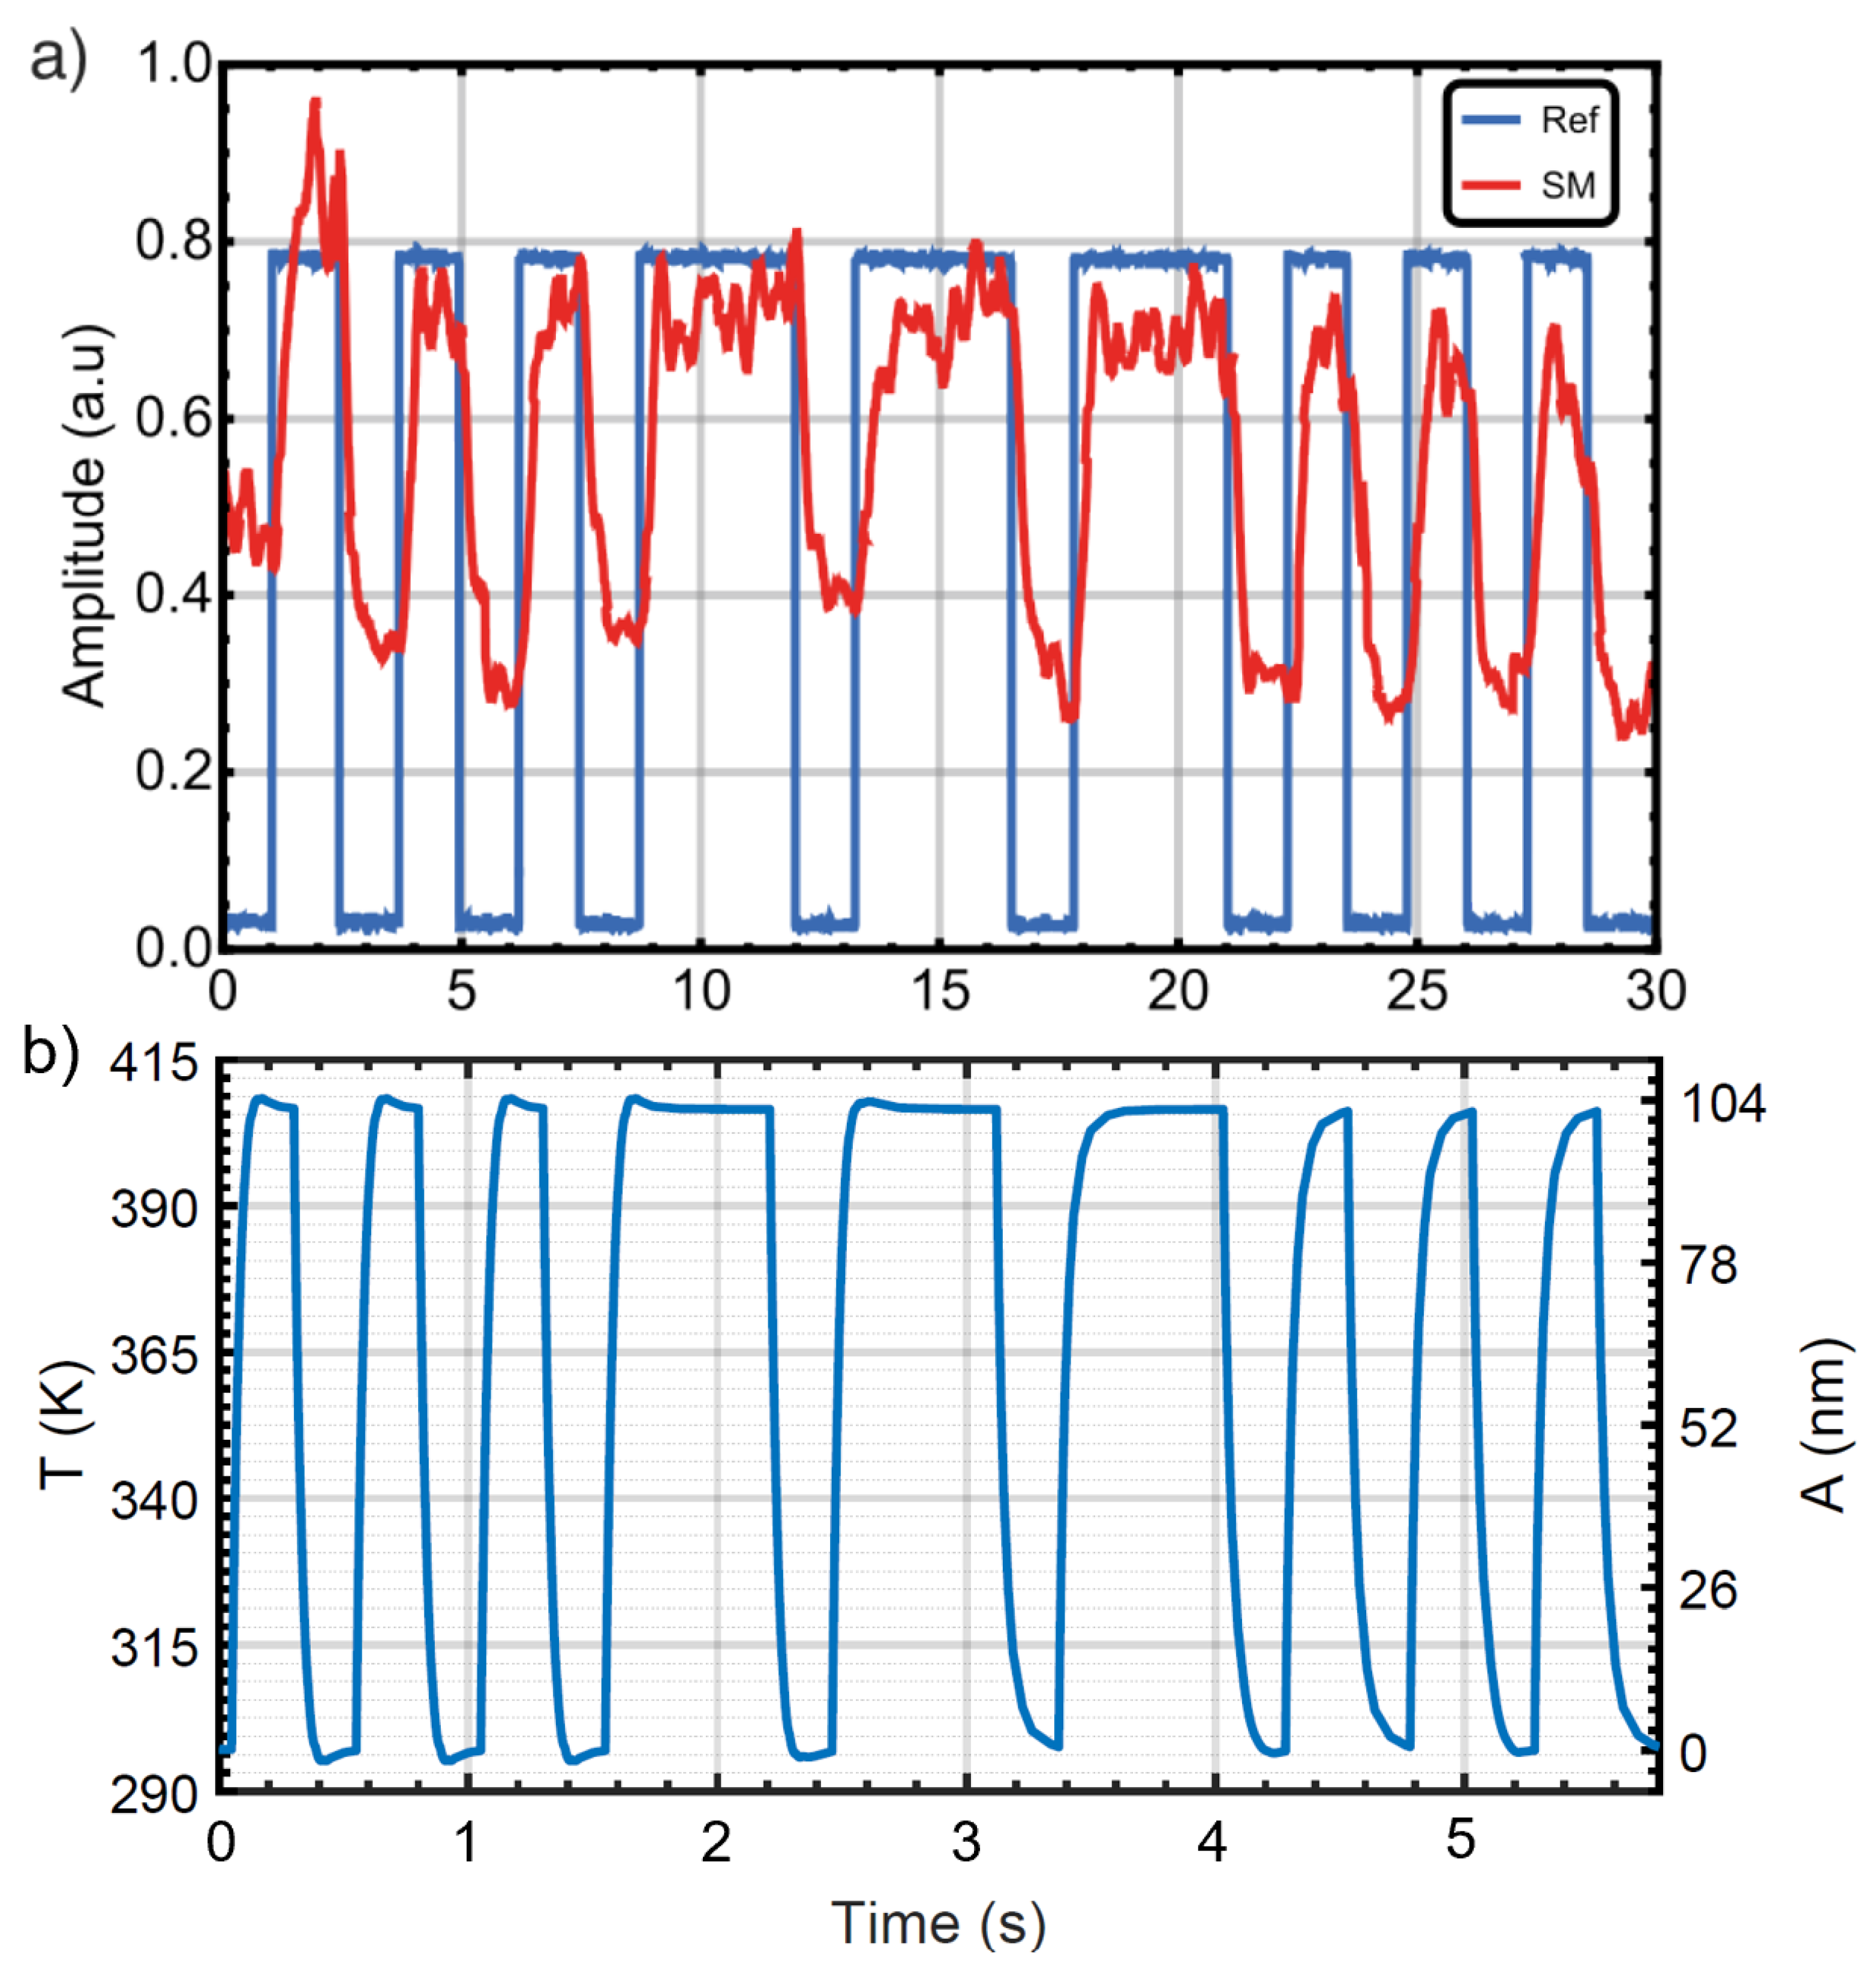
The possibility of converting a specific ML NIR power modulation into the THz QCL SM signal is then investigated. In particular, a SOS Morse signal is encoded in the ML NIR-emitted power by directly driving its current, and it is transferred into THz QCL voltage through the membrane motion, solely driven by the NIR photothermal excitation (i.e., with no piezo-electric actuation applied). The ML driving signal, along with the detected QCL , using as reference the chopper modulation frequency, is reported in Figure 6a. The duration of the short and long ON/OFF states of the SOS signal is 125 and , respectively, while the emitted power in the ON state is fixed at . A close alignment is observed between the detected and reference signals, with a calculated rise/fall time of approximately . FEM simulations suggest that the response time of the signal transfer in the setup is intrinsically limited by the thermal response time of the membrane resonator. The simulated thermal response times are approximately ∼ and depending on whether geometrical non-linearity is excluded or included from the model, respectively. Moreover, the performed simulations (reported in Figure A3 of the Appendix A) show that the thermal response time of the membrane does not depend on the NIR power (or membrane heating rate) for the investigated range of power and corresponding range of temperature reached by the membrane. The fastest achievable SOS signal transfer (with a total duration of ∼), preserving the same ON/OFF time ratio of the experimental one, is reported in Figure 6b in terms of both simulated temperature and deformation amplitudes reached by the central point of the trampoline membrane metal disc. A temperature increase per unit power of ∼, corresponding to a maximum oscillation amplitude of ∼, is computed and reported in more detail in Appendix A. The significant discrepancy in the photothermally induced displacement of the membrane equilibrium position between the static and dynamic/actuated states can be ascribed to the different initial strain conditions of the two states. Notably, analogous signal transfer can be also performed in the ASM configuration by applying a fixed piezo-electric actuation amplitude at a frequency matching that of its photothermally excited state, which is already known for the specific impinging NIR power; by demodulating at the piezo-driving frequency, the signal can indeed be detected only during the ON states of the NIR ML. Alternatively, both membrane resonance red-shifts and the relative displacement can be detected by the real-time tracking of both phase and amplitude variations in the ASM-, analogously with what was carried out in reference [36] for the recording of the solely photothermally induced frequency variation.
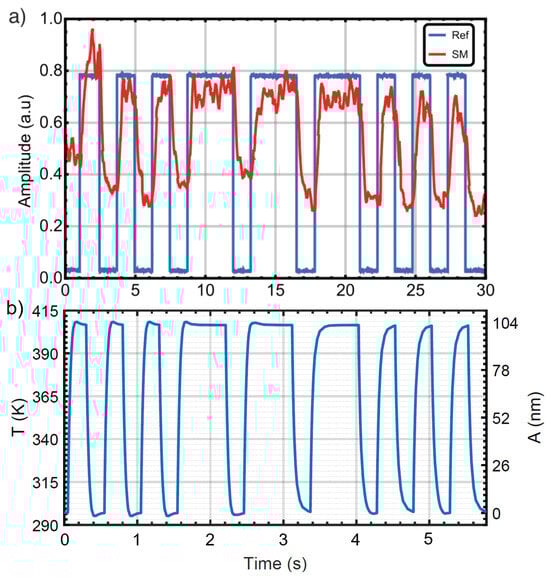
Figure 6.
(a) NIR to THz self-mixing conversion of a SOS signal in Morse code via the photothermal excitation of the membrane at zero piezo-electric voltage. The blue line shows the driving signal of the ML emitting up to ∼ in its ON state. The red line represents the corresponding SM signal in the THz QCL. (b) Thermo–mechanical simulation of the membrane subject to NIR irradiation encoding the SOS signal. The temperature and displacement evolutions at the membrane metalized center are reported. The time duration of the entire signal is scaled according to the ON/OFF duration ratio of the experimental signal in (a).
5. Conclusions
A platform to achieve the conversion of a NIR (∼) laser power modulation into the self-mixing signal of a QCL operating at THz frequencies (∼) is introduced. This is realized by exploiting the NIR laser-driven motion of a mechanical resonator (a metal-coated trampoline membrane) used as the external cavity mirror of a THz QCL LFI scheme.
Fine control over the resonator mechanical response via NIR photothermal heating is demonstrated. In particular, the resonance red-shift and the relative membrane displacement can be tuned with CW NIR power with a high sensitivity of ∼ and ∼ (in the linear range of ), respectively. A controlled deformation is also shown via solely photothermal excitation with a responsivity of , in agreement with FEM simulations. The shown stability of the membrane mechanical response to the cycles of CW NIR irradiation guarantees the reliable control of the membrane motion over time. This allows the exploitation of the NIR laser source as a master laser to infer tailored modulations in the SM signal of the THz QCL acting as a slave laser source. As a demonstration of the potential of the developed master–slave configuration, we show the successful transfer of a specific signal encoded in the power amplitude of the NIR ML to the THz QCL SM voltage. NIR ML excitation power as low as (corresponding to a static membrane displacement of a few nanometers) can in principle be used to perform the proposed signal conversion thanks to the high membrane NIR photothermal responsivity and the high sensitivity of the THz QCL LFI apparatus. The bandwidth of NIR power modulations relative to SM signal conversion is shown to be limited by the photothermal response time of the membrane, calculated to be within the 150–300 ms range. The response time of the signal conversion can be thus decreased by lowering the heat capacity and increasing the thermal conductance of the mechanical resonator. This can be engineered by reducing the mass portion of the resonator (i.e., by decreasing the overall thickness and the size of the central trampoline pad, keeping the rest of the geometry fixed), which provides the highest contribution to heat capacities, and by making metal paths on the tethers in order to enhance the overall thermal conductance. Interestingly, as the NIR power controls both membrane frequency and position shifts in the excited state of the resonator, the ML modulation can provide dual information-encoding processes in the phase and amplitude of the detected SM voltage.
In summary, the presented mechanical LFI configuration represents a suitable platform for information transfer between NIR and THz laser frequencies, coupled via a finely controllable thermo–mechanical element. In general, by providing detailed insights on the QCL LFI detection of the photothermally driven dynamics of a -suspended membrane prototype, the present study can be beneficial for opto-mechanical experiments in which high precision control over the resonator frequency and position is crucial, such as for coherent optical communication within heterogeneous/hybrid laser systems. Moreover, as the resonator dynamics can be directly inferred from the voltage and power amplitude of the QCL, the proposed platform represents a versatile proof-of-concept scheme of a master–slave configuration in realizing the external laser-driven mechanically-mediated control of QCL operations, particularly suitable for advanced QCL LFI-based imaging and spectroscopic applications.
Author Contributions
Conceptualization, A.T., A.O. and P.V.; methodology, P.V., A.O., M.S., L.V., L.L. and A.P.; formal analysis, P.V. and A.O.; investigation, P.V. and A.O.; data curation, P.V. and A.O.; writing—original draft preparation, A.O. and P.V.; writing—review and editing, A.T., L.V., A.P., P.D., V.M., A.O. and P.V.; supervision, A.T., A.P., P.D. and V.M.; project administration, A.T. and A.P.; funding acquisition, A.P., A.T., P.D. and E.L. All authors have read and agreed to the published version of the manuscript.
Funding
The authors gratefully acknowledge funding from ATTRACT, a European Union’s Horizon 2020 research and innovation project, under grant agreement No. 101004462 (H-cube project); European Union—Next Generation EU under the Italian National Recovery and Resilience Plan (NRRP), Mission 4, Component 2, Investment 1.3, CUP D43C22003080001, partnership on “Telecommunications of the Future” (PE00000001—program “RESTART”); MUR through the project PRIN 2022 TRUST; and “Support from EPSRC (UK) Program grants “HyperTerahertz” (Grant No. EP/P021859/1) and “Teracom” (Grant No. EP/W028921/1)”.
Institutional Review Board Statement
Not applicable for this study.
Informed Consent Statement
Not applicable for this study.
Data Availability Statement
The data presented in this study are available upon request from the corresponding authors.
Conflicts of Interest
The authors declare no conflicts of interest.
Abbreviations
The following abbreviations are used in this manuscript:
| SM | Self-mixing; |
| QCL | Quantum cascade laser; |
| THz | Terahertz; |
| LFI | Laser feedback interferometry; |
| NIR | Near-infrared; |
| OF | Optical feedback; |
| CW | Continuous wave; |
| SSM | Stationary self-mixing; |
| ASM | Alternate self-mixing; |
| PZT | Piezo-electric; |
| OSC | Oscilloscope; |
| AWG | Arbitrary waveform generator; |
| ML | Master laser. |
Appendix A. FEM Simulations of the Membrane Mechanical Response
The thermo–mechanical dynamics of the fabricated silicon nitride () metal-coated trampoline membrane is calculated via FEM simulations using COMSOL Multiphysics (version 6.2).
The developed 3D model is based on the and modules. The two modules are independently used to compute the membrane sole mechanical or thermal response, while they are combined through the multiphysics coupling provided by the module to calculate the thermo–mechanical response. The 3D geometry is obtained by importing a 2D CAD file of the trampoline membrane design and extruding it in the vertical direction by a distance equal to the thickness (). A cylinder with radius R and thickness is added and centered on the top membrane surface. The final geometry consists of two domains: one corresponding to the membrane and the other to the metal disc plate. In the module, all domains are set as with different components () depending on the specific material of each domain. The boundary defining the vertical side wall of the membrane is set as , while the rest of the boundaries are set as . are set to 0 for both displacement and structural field vectors. In the Heat Transfer module, the domains are set as media, and the same temperature is fixed as the module reference and temperature for all domains and for the boundary identifying the membrane side walls in the setting. Moreover, a Surface-to-Ambient Radiation setting with a specific surface emissivity coefficient () is associated with all boundaries identifying the solid-to-ambient interface of the resonator, while a Heat Source setting is set by fixing the heat source power for the Au domain. The heat source power value is given by the product between the IR excitation power () and the phenomenological absorption percentage () of the metal disc layer. Here, an effective absorption is considered for the metal 3/50 nm Cr/Au bilayer, but the metal is considered to be composed of only Au, as the thermal capacity of the Au layer is more than an order of magnitude higher with respect to the Cr layer. In the reported simulations, heating is set as homogeneously distributed in the metal domain, which corresponds to the assumption of homogeneous photothermal heating with respect to the metal disc via the focused IR power excitation. This assumption was confirmed by preliminary simulations where the radial reduction in the heated domain (simulating a reduction in the IR beam spot at the membrane surface) provided only negligible contributions to the thermo–mechanical response of the membrane in terms of both stationary temperature and displacement gradients. No absorption in the domain was considered. For multiphysics couplings, a secant coefficient of Thermal Expansion () is set for each material. All material properties are retrieved from those assigned to the Materials settings, which in turn are defined in the global parameters. All parameters and corresponding values used in the simulations are reported in Table A1.

Table A1.
Global parameters for materials and external environment properties exploited in each module of the FEM simulation model.
Table A1.
Global parameters for materials and external environment properties exploited in each module of the FEM simulation model.
| Module | Description | Symbol | Values |
|---|---|---|---|
| Geometry | Au disc radius | R | 100 μm |
| Au thickness | 50 nm | ||
| thickness | 300 nm | ||
| Au density | 19,300 kg/m3 | ||
| density | 3100 kg/m3 | ||
| Solid Mechanics | Au Young’s modulus | 90 GPa | |
| Young’s modulus | 260 GPa | ||
| Au Poisson ratio | 0.42 | ||
| Poisson ratio | 0.23 | ||
| Au initial stress | GPa | ||
| initial stress | 1039 GPa | ||
| Heat Transfer | Au thermal conductivity | 300 W/(m*K) | |
| thermal conductivity | 30 W/(m*K) | ||
| Au specific heat | 125 J/(kg*K) | ||
| specific heat | 700 J/(kg*K) | ||
| Surface thermal emissivity | 0.9 | ||
| IR excitation power | 1–10 mW | ||
| Reference temperature | 293.15 K | ||
| IR metal absorption | 5% | ||
| Events | Event start time | 50 ms | |
| IR pulse ON/OFF state duration (short) | 250 ms | ||
| IR pulse ON/OFF state duration (long) | 660 ms | ||
| IR metal absorption | 5% | ||
| Multiphysics | Au thermal expansion | 1/K | |
| thermal expansion | 1/K |
An Event module is added in order to define time-domain heat excitation pulses with ON/OFF states that are set by a Discrete State variable triggered via a series of Explicit Events with specific durations. The Mesh settings in the 3D geometry consists of a Free Triangular mesh with a general-physics-calibrated custom element size setting (with a minimum/maximum element size of , a maximum element growth rate of 1.3, and a curvature factor of 0.2) for all plane boundaries, which is Swept between specific source and destination faces with a Distribution presenting one and three elements for the metal and domain, respectively. The complete Mesh presents ∼ number of elements with a (skewness) average element quality of ∼ in a mesh volume of ∼.
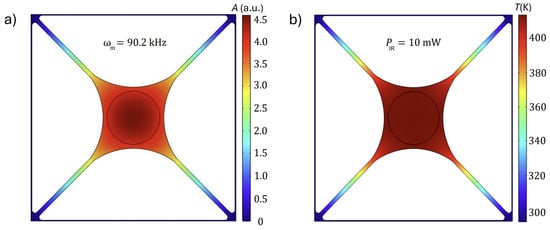
Figure A1.
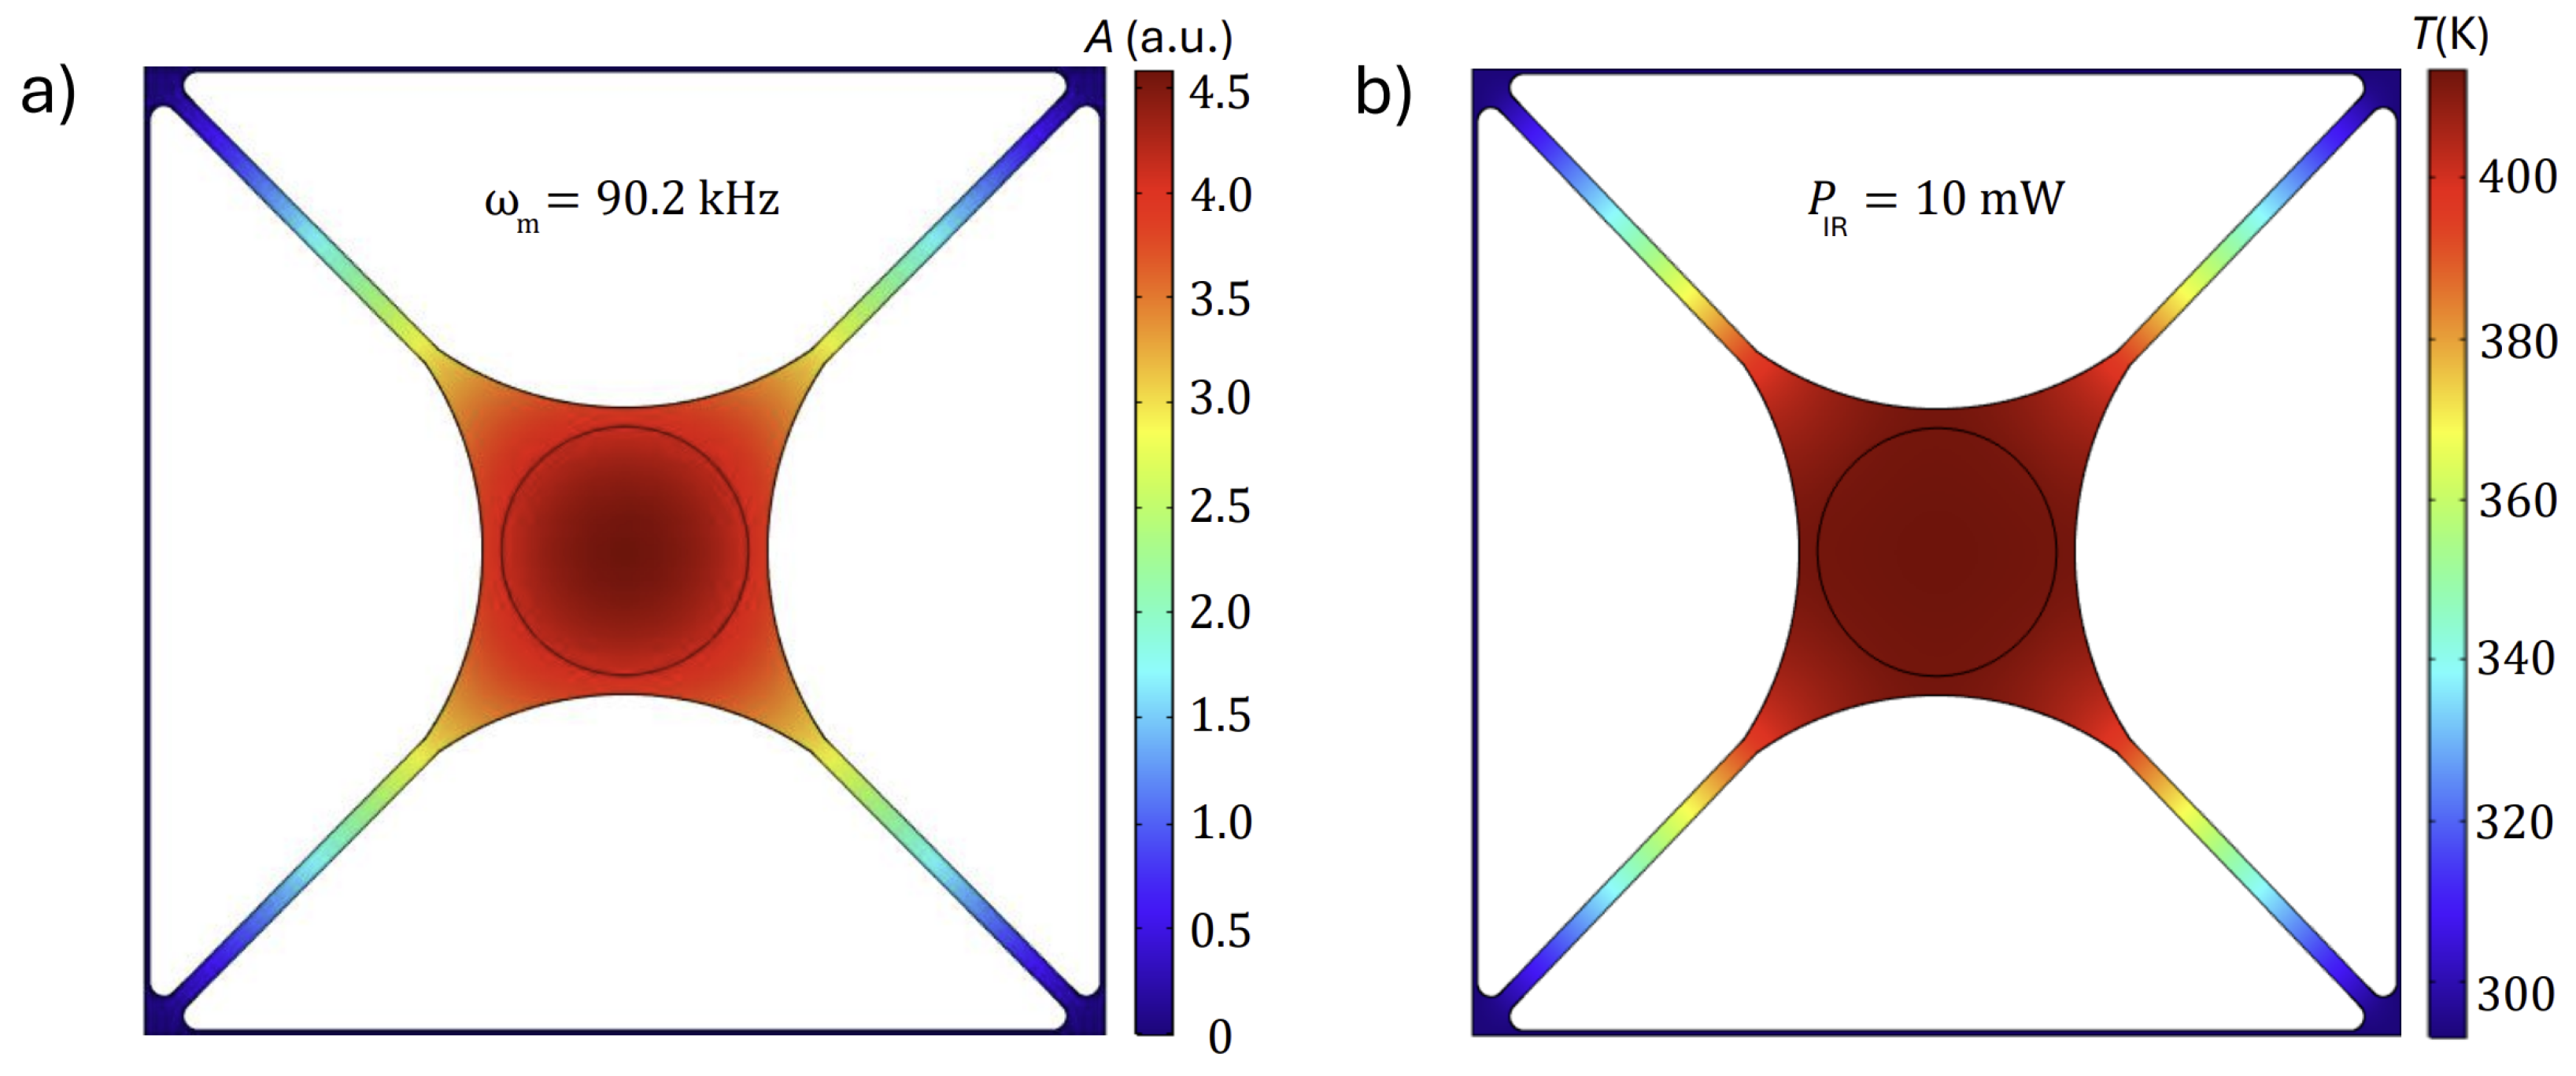
Two-dimensional color plots of the fundamental membrane mode resulting from a purely mechanical Eigenfrequency study (a) and of the membrane temperature distribution obtained with a solely thermal Stationary study (b) under constant heat rate.
Figure A1.
Two-dimensional color plots of the fundamental membrane mode resulting from a purely mechanical Eigenfrequency study (a) and of the membrane temperature distribution obtained with a solely thermal Stationary study (b) under constant heat rate.
Each performed study consists of using a single or a series of the following Study steps: Eigenfrequency, Stationary, and Time-dependent. The Eigenfrequency study involving the only Solid Mechanics module is used to calculate the bare resonance frequency and the corresponding eigenmode of the resonator fundamental mode.
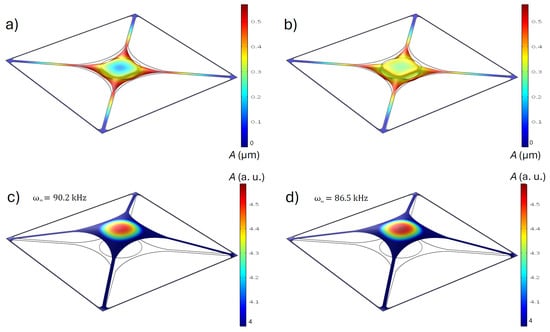
Figure A2.
Three-dimensional plots of the profile deformation of the membrane in its static and dynamic states without and with thermal excitation. (a,b) represent the static membrane state obtained by solving a purely mechanical Stationary problem or a Thermal Expansion multiphysics-coupled Stationary study, respectively. The calculated deformation amplitudes A are reported in via an overimposed color plot, while the 3D deformation is highlighted by scaling the output values of a factor of 50. (c,d) show the membrane eigenmode by solving a subsequent Eigenfrequency study, exploiting the initial stationary deformation obtained in (a,b) as an input, respectively. The deformation amplitudes are scaled to enhance visualization; the reported values shown in color are in arbitrary units, and they only highlight the most deformed membrane region. The calculated eigenfrequency values are reported. Color scales for A are shown for each figure.
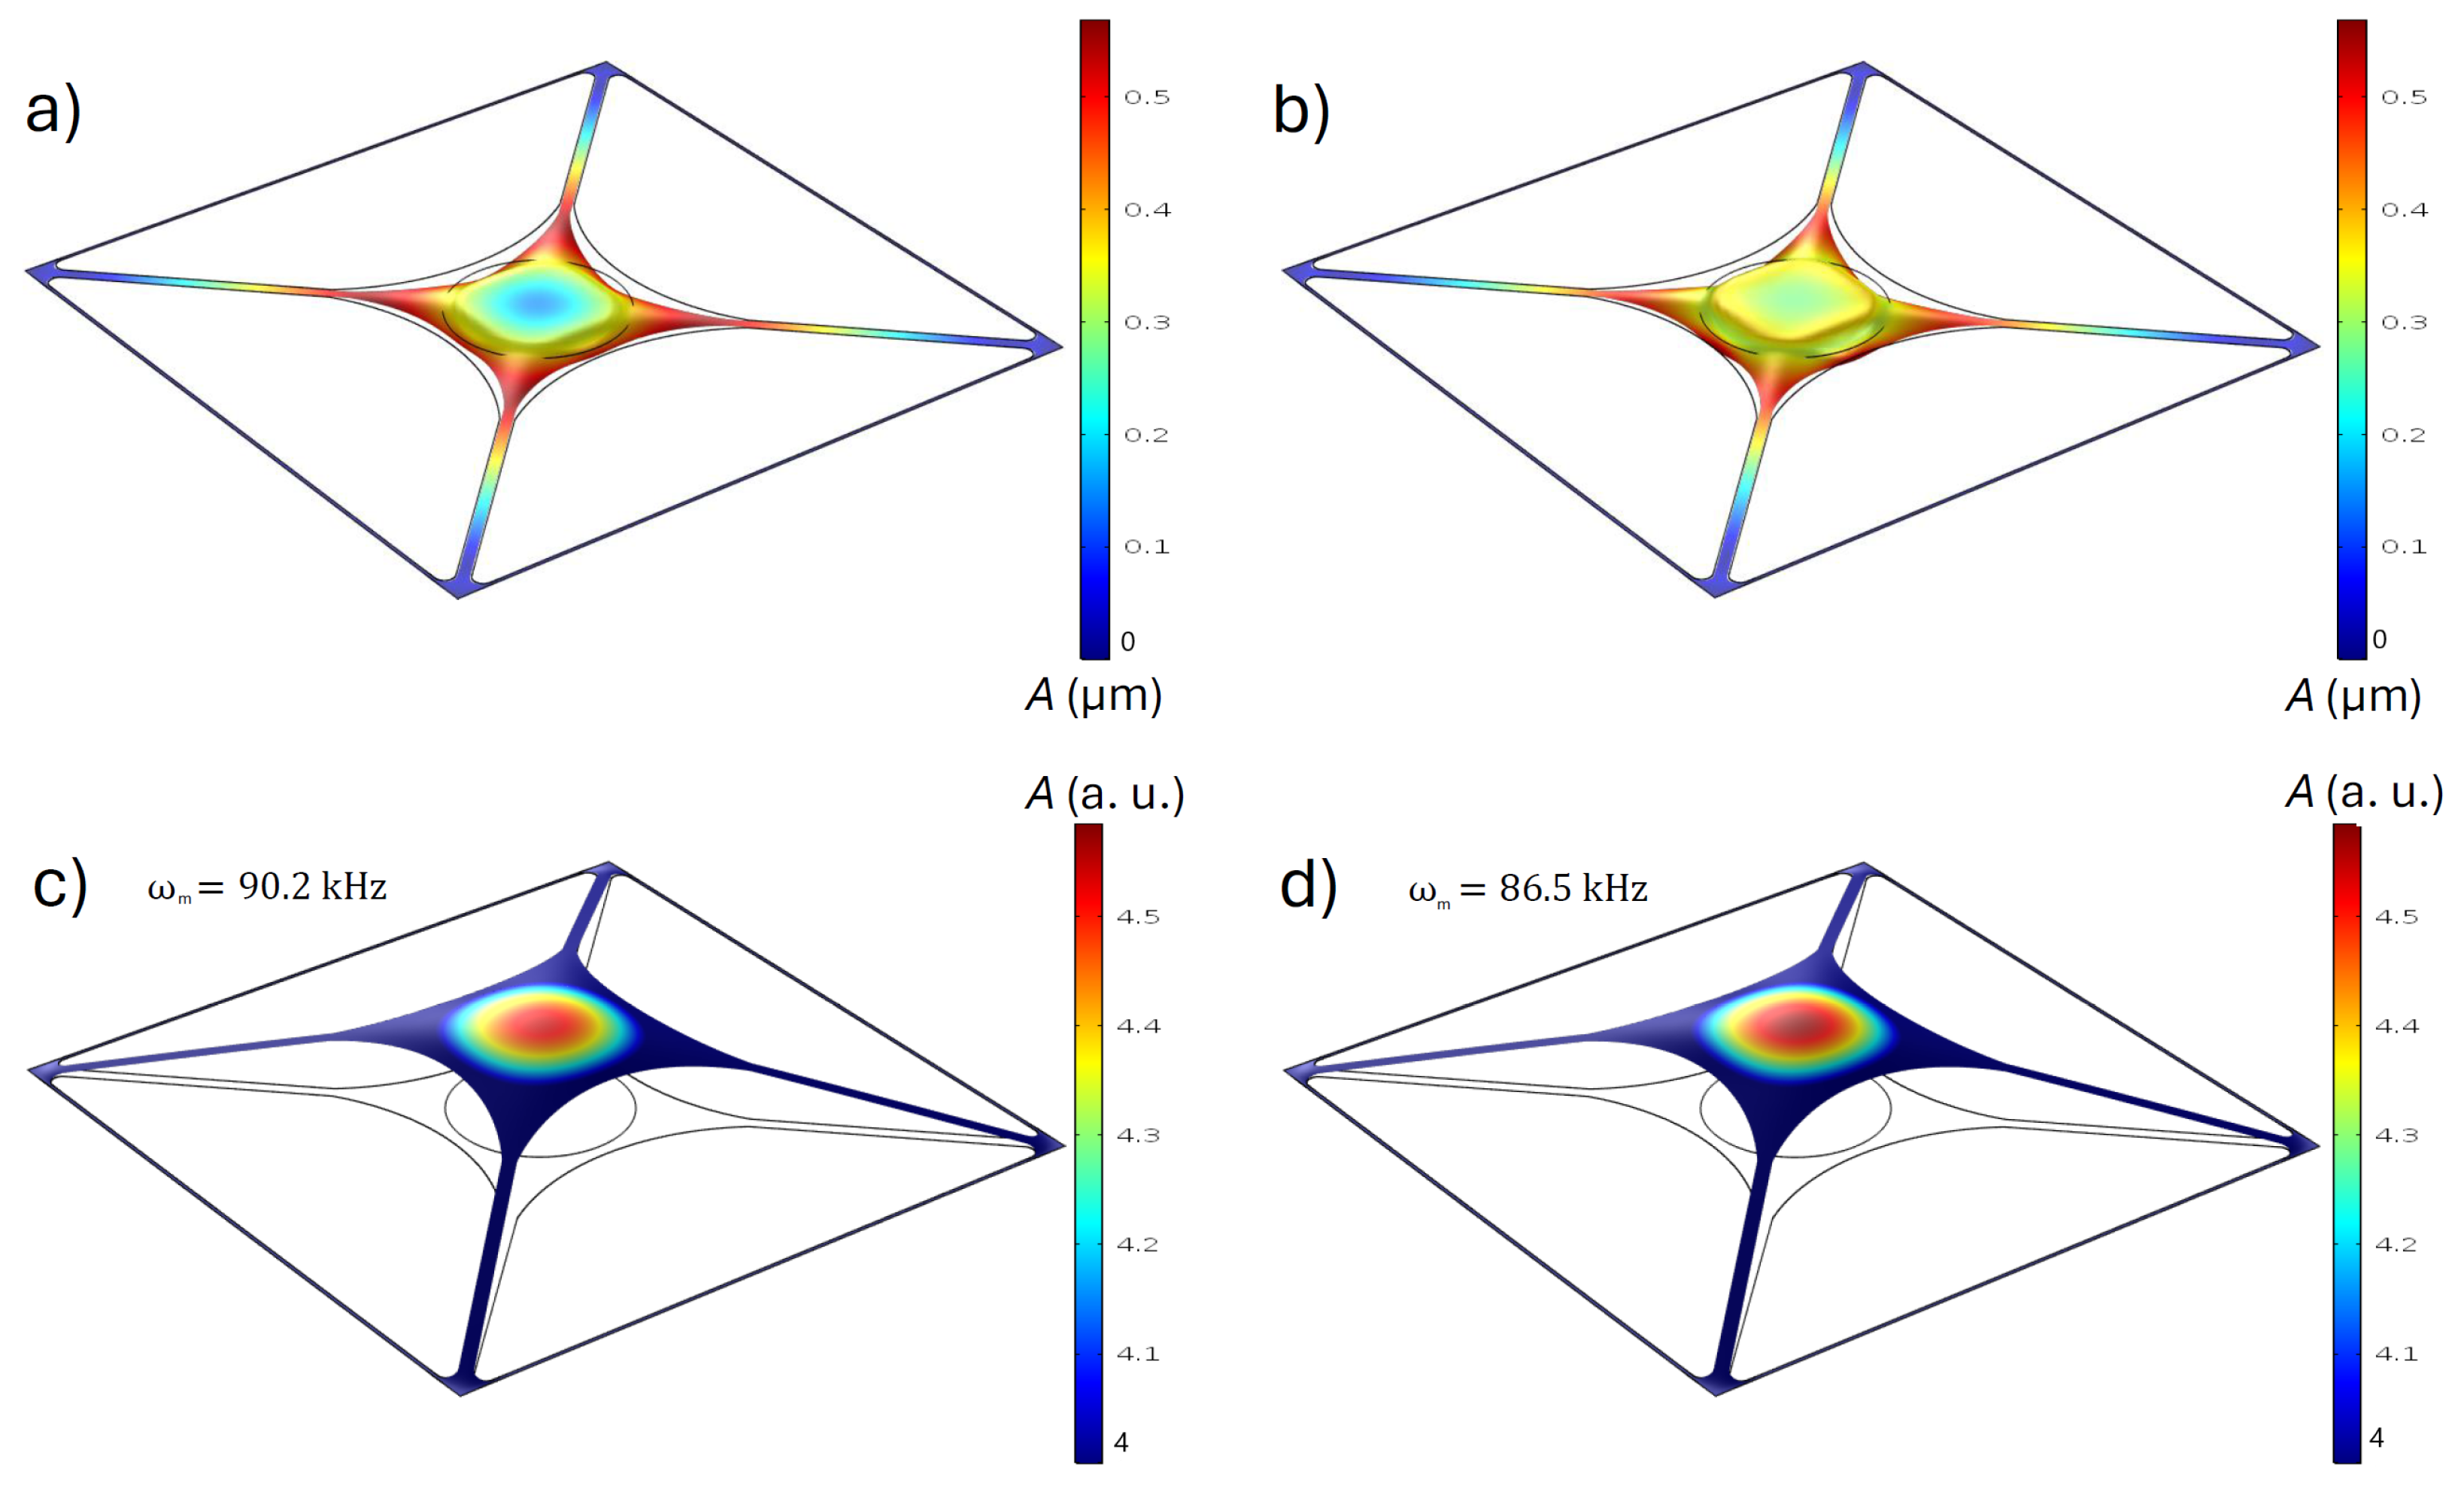
The membrane fundamental eigenmode is reported in Figure A1a via a 2D plot where the central plate of the membrane is observed to oscillate as a whole thanks to the sole elongation of the tethers. The Stationary study is exploited to calculate the membrane displacement distribution in its static state without heat rate excitation and under the regime with constant IR power excitation. This is achieved by solving for the Solid Mechanics and Heat Transfer in Solids interfaces coupled via Thermal Expansion and performing a Parametric Sweep of the NIR power. The regime temperature at each membrane location corresponding to the applied heat source power is also obtained. An example of the temperature distribution on the membrane for an impinging IR power of is shown in Figure A1b. The static deformation of the membrane due to the solely initial pre-stress difference between the Au layer and the , in combination with their different Young’s modulus values, is shown in Figure A2a (a scale factor of 50 is applied to the volume plot to highlight the deformation). The membrane is observed to bend upwards (in the direction of the metallization) at the location of the perimeter of the metal disc, and it bends downwards in the central plate that is not covered by the metallization in the region not aligned with the tethers. The variation in static membrane deformations for a heat source corresponding to a NIR power of is reported in Figure A2b. The computed stationary membrane temperature variation with respect to the ambient reference temperature and the corresponding stationary membrane displacement at its center location are reported in Figure A3a.
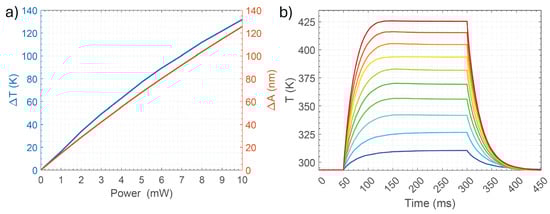
Figure A3.
(a) Temperature (, blue solid line) and deformation (, red solid line) increase with respect to the static membrane state at ambient temperatures as a function of the IR excitation power obtained by solving a Thermal Expansion multiphysics-coupled Stationary study. (b) Time evolution of the temperature at the center position of the membrane top metal domain for different IR excitation powers, starting from up to with a step (from blue to red color, respectively). The solution are obtained from a Time-dependent study for the sole Heat Transfer in Solids module.
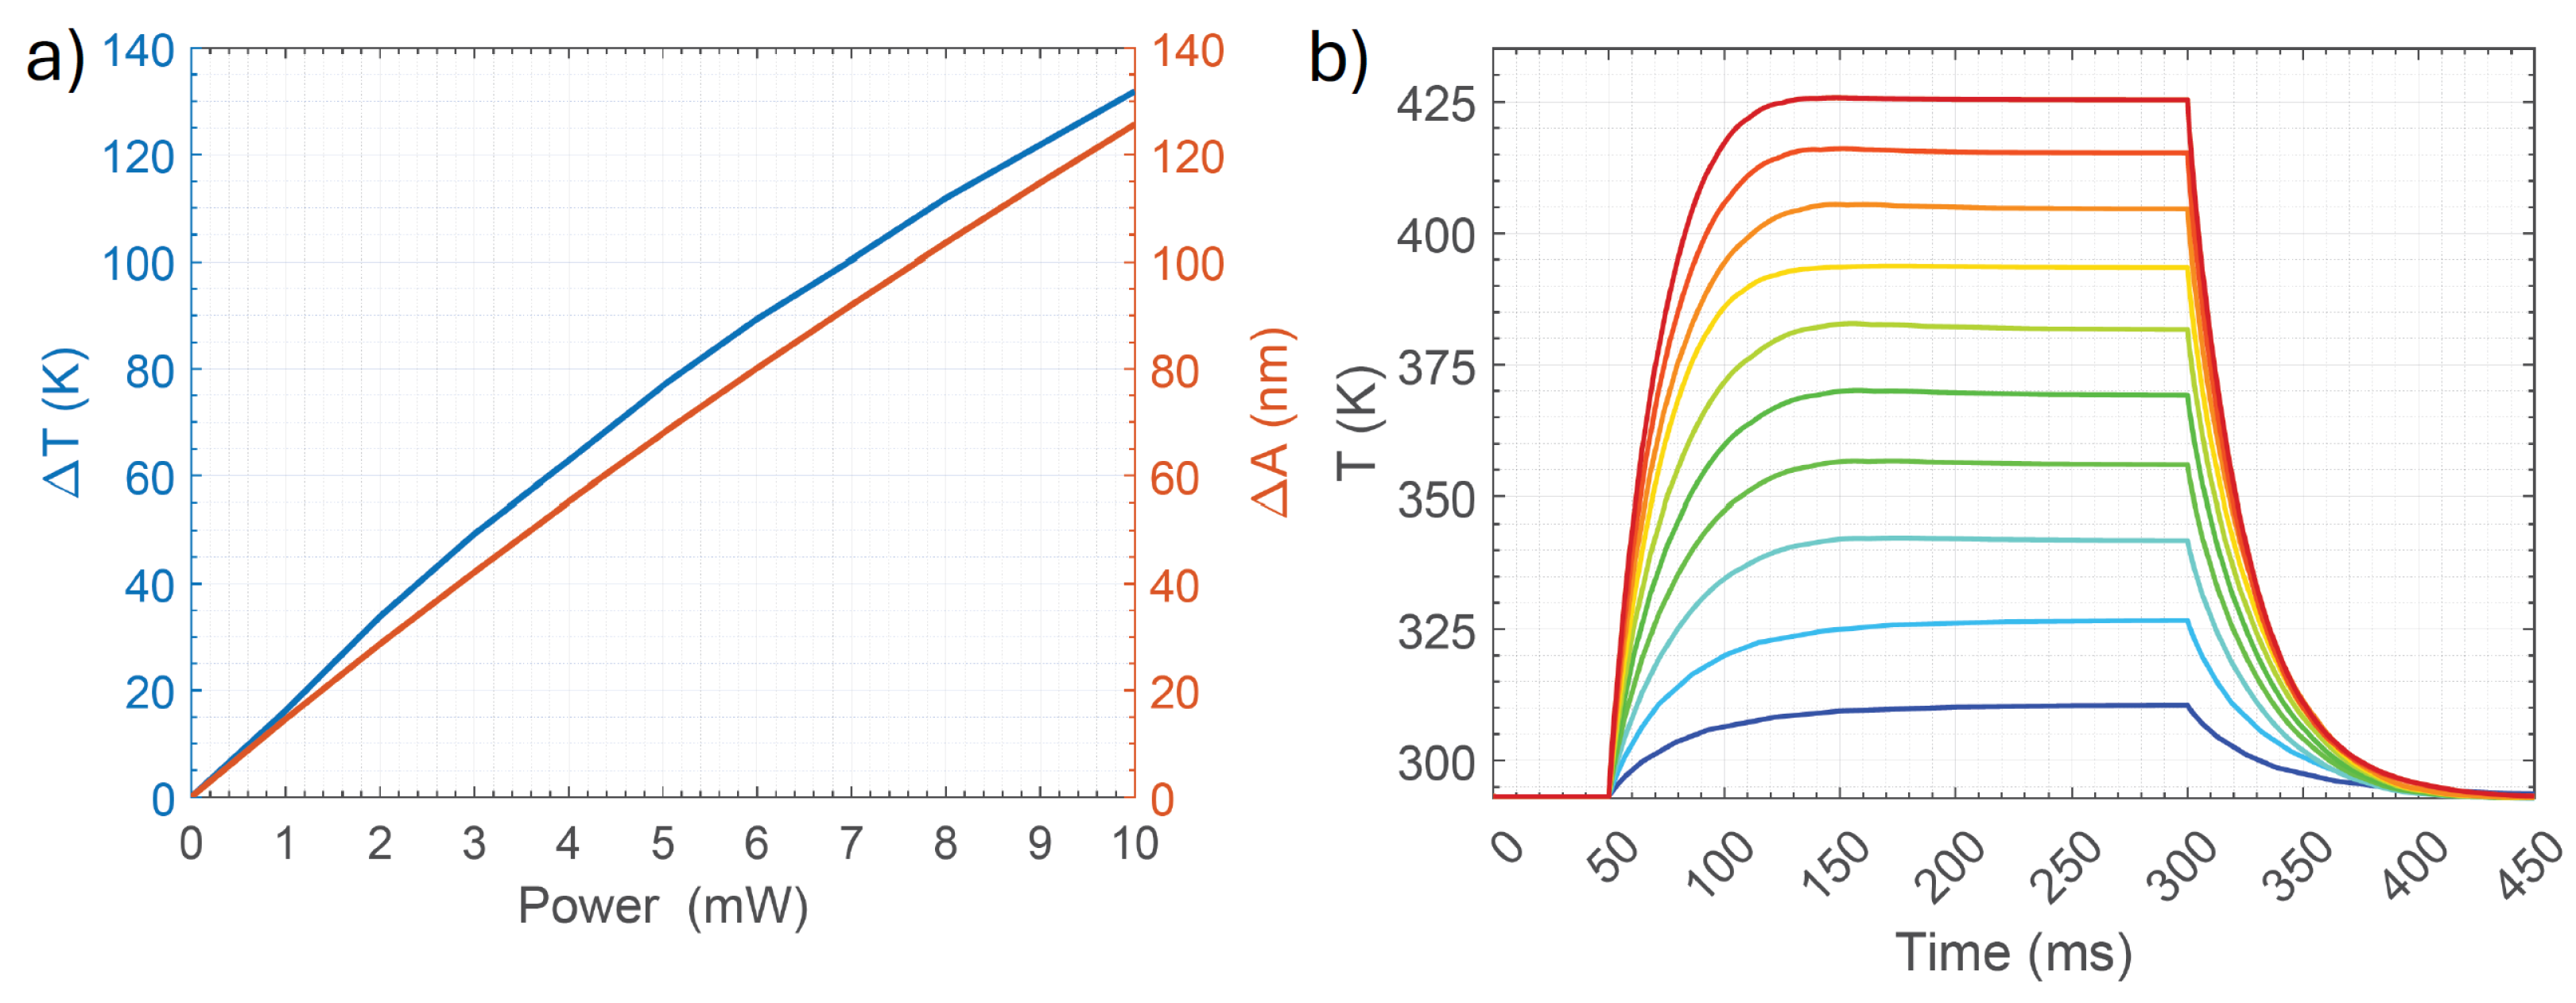
The solution of the same multiphysics-coupled Stationary study provides the initial values for the variables of a subsequent purely mechanical Eigenmode step, which calculates the membrane fundamental resonance frequency and the corresponding eigenmode modified by the stationary thermal expansion. While NIR power-modified eigenfrequencies are reported in Figure 3b, the membrane fundamental mode deformations in the absence of heating and with a heating rate corresponding to a power illumination value are shown via the 3D plots in Figure A2c,d, respectively. The variation in the membrane fundamental eigenmode caused by heating is observed at the location of the top metal disc, as highlighted by the overimposed color plot with a scale range that is only spatially limited to the disc plate area. The time evolution of the membrane temperature is obtained by solving a Time-Dependent study considering the Heat Transfer in Solids module in conjunction with the Events settings. The latter triggers an ON/OFF variable at specific times to induce pulse heat source excitation in the metal disc. The temperature evolution with respect to the membrane center metallization for different heat source power values (by performing a Parametric Sweep of the NIR power amplitude) is shown in Figure A3b for a time output range of with a time step of and a pulse duration of . The same study is performed to calculate the membrane mechanical response (shown in Figure 6b) to the time-varying excitation signal with short and long pulse durations (as reported in Table A1).
References
- Taimre, T.; Nikolić, M.; Bertling, K.; Lim, Y.L.; Bosch, T.; Rakić, A.D. Laser feedback interferometry: A tutorial on the self-mixing effect for coherent sensing. Adv. Opt. Photonics 2015, 7, 570–631. [Google Scholar] [CrossRef]
- Kane, D.M.; Shore, K.A. Unlocking Dynamical Diversity: Optical Feedback Effects on Semiconductor Lasers; John Wiley & Sons: Hoboken, NJ, USA, 2005. [Google Scholar]
- Nerin, P.; Puget, P.; Besesty, P.; Chartier, G. Self-mixing using a dual-polarisation Nd: YAG microchip laser. Electron. Lett. 1997, 33, 491–492. [Google Scholar] [CrossRef]
- King, P.; Steward, G. Metrology with an optical maser. New Sci. 1963, 17, 14. [Google Scholar]
- Seko, A.; Mitsuhashi, Y.; Morikawa, T.; Shimada, J.; Sakurai, K. Self-quenching in semiconductor lasers and its applications in optical memory readout. Appl. Phys. Lett. 1975, 27, 140–141. [Google Scholar] [CrossRef]
- Donati, S.; Giuliani, G.; Merlo, S. Laser diode feedback interferometer for measurement of displacements without ambiguity. IEEE J. Quantum Electron. 1995, 31, 113–119. [Google Scholar] [CrossRef]
- Giuliani, G.; Norgia, M.; Donati, S.; Bosch, T. Laser diode self-mixing technique for sensing applications. J. Opt. A Pure Appl. Opt. 2002, 4, S283. [Google Scholar] [CrossRef]
- Keeley, J.; Bertling, K.; Rubino, P.L.; Lim, Y.L.; Taimre, T.; Qi, X.; Kundu, I.; Li, L.H.; Indjin, D.; Rakić, A.D.; et al. Detection sensitivity of laser feedback interferometry using a terahertz quantum cascade laser. Opt. Lett. 2019, 44, 3314–3317. [Google Scholar] [CrossRef]
- Rakić, A.D.; Taimre, T.; Bertling, K.; Lim, Y.L.; Dean, P.; Valavanis, A.; Indjin, D. Sensing and imaging using laser feedback interferometry with quantum cascade lasers. Appl. Phys. Rev. 2019, 6, 021320. [Google Scholar] [CrossRef]
- von Staden, J.; Gensty, T.; Elsäßer, W.; Giuliani, G.; Mann, C. Measurements of the α factor of a distributed-feedback quantum cascade laser by an optical feedback self-mixing technique. Opt. Lett. 2006, 31, 2574–2576. [Google Scholar] [CrossRef]
- Green, R.P.; Xu, J.H.; Mahler, L.; Tredicucci, A.; Beltram, F.; Giuliani, G.; Beere, H.E.; Ritchie, D.A. Linewidth enhancement factor of terahertz quantum cascade lasers. Appl. Phys. Lett. 2008, 92, 071106. [Google Scholar] [CrossRef]
- Keeley, J.; Freeman, J.; Bertling, K.; Lim, Y.L.; Mohandas, R.A.; Taimre, T.; Li, L.H.; Indjin, D.; Rakić, A.D.; Linfield, E.H.; et al. Measurement of the emission spectrum of a semiconductor laser using laser-feedback interferometry. Sci. Rep. 2017, 7, 7236. [Google Scholar] [CrossRef] [PubMed]
- Leng Lim, Y.; Dean, P.; Nikolić, M.; Kliese, R.; Khanna, S.P.; Lachab, M.; Valavanis, A.; Indjin, D.; Ikonić, Z.; Harrison, P.; et al. Demonstration of a self-mixing displacement sensor based on terahertz quantum cascade lasers. Appl. Phys. Lett. 2011, 99, 081108. [Google Scholar] [CrossRef]
- Mezzapesa, F.P.; Columbo, L.L.; De Risi, G.; Brambilla, M.; Dabbicco, M.; Spagnolo, V.; Scamarcio, G. Nanoscale displacement sensing based on nonlinear frequency mixing in quantum cascade lasers. IEEE J. Sel. Top. Quantum Electron. 2015, 21, 107–114. [Google Scholar] [CrossRef]
- Maisons, G.; Carbajo, P.G.; Carras, M.; Romanini, D. Optical-feedback cavity-enhanced absorption spectroscopy with a quantum cascade laser. Opt. Lett. 2010, 35, 3607–3609. [Google Scholar] [CrossRef]
- Manfred, K.M.; Hunter, K.M.; Ciaffoni, L.; Ritchie, G.A. ICL-based OF-CEAS: A sensitive tool for analytical chemistry. Anal. Chem. 2017, 89, 902–909. [Google Scholar] [CrossRef]
- Rakić, A.D.; Taimre, T.; Bertling, K.; Lim, Y.L.; Dean, P.; Indjin, D.; Ikonić, Z.; Harrison, P.; Valavanis, A.; Khanna, S.P.; et al. Swept-frequency feedback interferometry using terahertz frequency QCLs: A method for imaging and materials analysis. Opt. Express 2013, 21, 22194–22205. [Google Scholar] [CrossRef]
- Mezzapesa, F.; Columbo, L.; Brambilla, M.; Dabbicco, M.; Vitiello, M.; Scamarcio, G. Imaging of free carriers in semiconductors via optical feedback in terahertz quantum cascade lasers. Appl. Phys. Lett. 2014, 104, 041112. [Google Scholar] [CrossRef]
- Dean, P.; Lim, Y.L.; Valavanis, A.; Kliese, R.; Nikolić, M.; Khanna, S.P.; Lachab, M.; Indjin, D.; Ikonić, Z.; Harrison, P.; et al. Terahertz imaging through self-mixing in a quantum cascade laser. Opt. Lett. 2011, 36, 2587–2589. [Google Scholar] [CrossRef]
- Dean, P.; Valavanis, A.; Keeley, J.; Bertling, K.; Lim, Y.; Alhathlool, R.; Burnett, A.; Li, L.; Khanna, S.; Indjin, D.; et al. Terahertz imaging using quantum cascade lasers—A review of systems and applications. J. Phys. D Appl. Phys. 2014, 47, 374008. [Google Scholar] [CrossRef]
- Dean, P.; Mitrofanov, O.; Keeley, J.; Kundu, I.; Li, L.; Linfield, E.H.; Giles Davies, A. Apertureless near-field terahertz imaging using the self-mixing effect in a quantum cascade laser. Appl. Phys. Lett. 2016, 108, 091113. [Google Scholar] [CrossRef]
- Degl’Innocenti, R.; Wallis, R.; Wei, B.; Xiao, L.; Kindness, S.J.; Mitrofanov, O.; Braeuninger-Weimer, P.; Hofmann, S.; Beere, H.E.; Ritchie, D.A. Terahertz nanoscopy of plasmonic resonances with a quantum cascade laser. ACS Photonics 2017, 4, 2150–2157. [Google Scholar] [CrossRef]
- Giordano, M.C.; Mastel, S.; Liewald, C.; Columbo, L.L.; Brambilla, M.; Viti, L.; Politano, A.; Zhang, K.; Li, L.; Davies, A.G.; et al. Phase-resolved terahertz self-detection near-field microscopy. Opt. Express 2018, 26, 18423–18435. [Google Scholar] [CrossRef] [PubMed]
- Kleckner, D.; Pepper, B.; Jeffrey, E.; Sonin, P.; Thon, S.M.; Bouwmeester, D. Optomechanical trampoline resonators. Opt. Express 2011, 19, 19708–19716. [Google Scholar] [CrossRef] [PubMed]
- Norte, R.A.; Moura, J.P.; Gröblacher, S. Mechanical resonators for quantum optomechanics experiments at room temperature. Phys. Rev. Lett. 2016, 116, 147202. [Google Scholar] [CrossRef] [PubMed]
- Reinhardt, C.; Müller, T.; Bourassa, A.; Sankey, J.C. Ultralow-noise SiN trampoline resonators for sensing and optomechanics. Phys. Rev. X 2016, 6, 021001. [Google Scholar] [CrossRef]
- Baldacci, L.; Pitanti, A.; Masini, L.; Arcangeli, A.; Colangelo, F.; Navarro-Urrios, D.; Tredicucci, A. Thermal noise and optomechanical features in the emission of a membrane-coupled compound cavity laser diode. Sci. Rep. 2016, 6, 31489. [Google Scholar] [CrossRef]
- Chien, M.H.; Steurer, J.; Sadeghi, P.; Cazier, N.; Schmid, S. Nanoelectromechanical position-sensitive detector with picometer resolution. ACS Photonics 2020, 7, 2197–2203. [Google Scholar] [CrossRef]
- Chowdhury, M.D.; Agrawal, A.R.; Wilson, D.J. Membrane-Based Optomechanical Accelerometry. Phys. Rev. Appl. 2023, 19, 024011. [Google Scholar] [CrossRef]
- Fischer, R.; McNally, D.P.; Reetz, C.; Assumpção, G.G.T.; Knief, T.; Lin, Y.; Regal, C.A. Spin detection with a micromechanical trampoline: Towards magnetic resonance microscopy harnessing cavity optomechanics. New J. Phys. 2019, 21, 043049. [Google Scholar] [CrossRef]
- Blaikie, A.; Miller, D.; Alemán, B.J. A fast and sensitive room-temperature graphene nanomechanical bolometer. Nat. Commun. 2019, 10, 4726. [Google Scholar] [CrossRef]
- Piller, M.; Hiesberger, J.; Wistrela, E.; Martini, P.; Luhmann, N.; Schmid, S. Thermal IR Detection With Nanoelectromechanical Silicon Nitride Trampoline Resonators. IEEE Sens. J. 2023, 23, 1066–1071. [Google Scholar] [CrossRef]
- Gregorat, L.; Cautero, M.; Vicarelli, L.; Giuressi, D.; Bagolini, A.; Tredicucci, A.; Cautero, G.; Pitanti, A. Highly dispersive multiplexed micromechanical device array for spatially resolved sensing and actuation. Microsyst. Nanoeng. 2024, 10, 179. [Google Scholar] [CrossRef] [PubMed]
- Alborghetti, L.; Bertoni, B.; Vicarelli, L.; Zanotto, S.; Roddaro, S.; Tredicucci, A.; Cautero, M.; Gregorat, L.; Cautero, G.; Cojocari, M.; et al. Enhanced sensitivity of sub-THz thermomechanical bolometers exploiting vibrational nonlinearity. arXiv 2024, arXiv:2411.09071. [Google Scholar]
- Ottomaniello, A.; Keeley, J.; Rubino, P.; Li, L.; Cecchini, M.; Linfield, E.H.; Davies, A.G.; Dean, P.; Pitanti, A.; Tredicucci, A. Optomechanical response with nanometer resolution in the self-mixing signal of a terahertz quantum cascade laser. Opt. Lett. 2019, 44, 5663–5666. [Google Scholar] [CrossRef]
- Vicarelli, L.; Tredicucci, A.; Pitanti, A. Micromechanical bolometers for subterahertz detection at room temperature. ACS Photonics 2022, 9, 360–367. [Google Scholar] [CrossRef]
- Wienold, M.; Schrottke, L.; Giehler, M.; Hey, R.; Anders, W.; Grahn, H. Low-voltage terahertz quantum-cascade lasers based on LO-phonon-assisted interminiband transitions. Electron. Lett. 2009, 45, 1030–1031. [Google Scholar] [CrossRef]
- Mohun, D.; Sulollari, N.; Salih, M.; Li, L.H.; Cunningham, J.E.; Linfield, E.H.; Davies, A.G.; Dean, P. Terahertz microscopy using laser feedback interferometry based on a generalised phase-stepping algorithm. Sci. Rep. 2024, 14, 3274. [Google Scholar] [CrossRef]
- Ottomaniello, A.; Vezio, P.; Tricinci, O.; Hoed, F.M.D.; Dean, P.; Tredicucci, A.; Mattoli, V. Highly conformable terahertz metasurface absorbers via two-photon polymerization on polymeric ultra-thin films. Nanophotonics 2023, 12, 1557–1570. [Google Scholar] [CrossRef]
- Lang, R.; Kobayashi, K. External optical feedback effects on semiconductor injection laser properties. IEEE J. Quantum Electron. 1980, 16, 347–355. [Google Scholar] [CrossRef]
- Agnew, G.; Grier, A.; Taimre, T.; Lim, Y.L.; Bertling, K.; Ikonić, Z.; Valavanis, A.; Dean, P.; Cooper, J.; Khanna, S.P.; et al. Model for a pulsed terahertz quantum cascade laser under optical feedback. Opt. Express 2016, 24, 20554–20570. [Google Scholar] [CrossRef]
- Yakubovsky, D.I.; Arsenin, A.V.; Stebunov, Y.V.; Fedyanin, D.Y.; Volkov, V.S. Optical constants and structural properties of thin gold films. Opt. Express 2017, 25, 25574–25587. [Google Scholar] [CrossRef] [PubMed]
- Sytchkova, A.; Belosludtsev, A.; Volosevičienė, L.; Juškėnas, R.; Simniškis, R. Optical, structural and electrical properties of sputtered ultrathin chromium films. Opt. Mater. 2021, 121, 111530. [Google Scholar] [CrossRef]

Disclaimer/Publisher’s Note: The statements, opinions and data contained in all publications are solely those of the individual author(s) and contributor(s) and not of MDPI and/or the editor(s). MDPI and/or the editor(s) disclaim responsibility for any injury to people or property resulting from any ideas, methods, instructions or products referred to in the content. |
© 2025 by the authors. Licensee MDPI, Basel, Switzerland. This article is an open access article distributed under the terms and conditions of the Creative Commons Attribution (CC BY) license (https://creativecommons.org/licenses/by/4.0/).