Article

Noise Reduction in LED-Based Photoacoustic Imaging

1
Faculty of Systems Design, Tokyo Metropolitan University, 6-6 Asahigaoka, Hino 191-0065, Tokyo, Japan
2
Department of Mechanical Engineering, Shibaura Institute of Technology, 3-7-5 Toyosu, Koto-ku 135-8548, Tokyo, Japan
3
Department of Precision Machinery Engineering, College of Science and Technology, Nihon University, 7-24-1 Narashinodai, Funabashi-shi 274-8501, Chiba, Japan
*
Author to whom correspondence should be addressed.
Photonics 2025, 12(4), 398; https://doi.org/10.3390/photonics12040398
Submission received: 10 December 2024 / Revised: 16 April 2025 / Accepted: 17 April 2025 / Published: 18 April 2025
(This article belongs to the Special Issue Emerging Trends in Biomedical Optical Imaging)

Abstract

:
Photoacoustic tomography (PAT), also known as optoacoustic tomography, has been emerging as a biomedical imaging modality that can provide cross-sectional or three-dimensional (3D) visualization of biological tissues such as blood vessels and lymphatic vessels in vivo at high resolution. The principle behind the visualization involves the light being absorbed by the tissues which results in the generation of ultrasound. Depending on the strength of ultrasound and its decay rate, it could be used to visualize the absorber location. In general, pulsed lasers such as the Q-switched Nd-YAG and OPO lasers that provide high-energy widths in the range of a few nanoseconds operating at low repetition rates are commonly used as a light source in photoacoustic imaging. However, such lasers are expensive and occupy ample space. Therefore, PAT systems that use LED as the source instead of lasers, which have the advantage of being obtainable at low cost and portable, are gaining attention. However, LED light sources have significantly low energy, and the photoacoustic signals generated have a low signal-to-noise ratio (SNR). Therefore, in LED-based systems, one way to strengthen the signal and improve the SNR is to significantly increase the repetition rate of LED pulses and use signal processing, which can be achieved using a high-power LED along M-sequence signal decoding. M-sequence signal decoding is effective, especially under high repetition rates, thus improving the SNR. However, power supplies for high-power LEDs have a circuit jitter, resulting in random temporal fluctuations in the emitted light. Such jitters, in turn, would affect the M-sequence-based signal decoding. Therefore, we propose a new decoding algorithm which compensates for LED jitter in the M-sequence signal processing. We show that the proposed new signal processing method can significantly improve the SNR of the photoacoustic signals.

1. Introduction

Photoacoustic imaging (PAI) has been emerging as a potential tool for the noninvasive visualization of biological tissue. Irradiation of high-power short-pulse light in biological tissues causes a rapid rise in local temperature in the light absorber. This in turn results in thermoelastic expansion which leads to photo-induced ultrasound. These ultrasound signals are used to visualize the absorbers within the biological tissues in PAI [1]. Furthermore, making use of the wavelength dependence of light absorbers, structures within the body such as arteries, veins, and lymphatic vessels, have been successfully visualized as 3D images [2,3]. Many clinical applications for the use of PAI are being considered, for example, in vascular biology [4,5,6,7], dermatology [8,9], neurology [1,10,11], and oncology [12,13,14,15].
In PAI systems, pulse lasers that deliver high-energy pulses, typically tens to hundreds of mJ per pulse with pulse width times of 5 to 10 ns, are used. Commonly used equipment for a high-power short-pulse laser include a Q-switched Nd: YAG, Ti:Sapphire, or dye laser system [16,17]. These lasers are not suitable to be widely utilized in actual clinical settings, not only because they are expensive, but also because they require a laser safe room for stable and safe use [6]. As a way to overcome such limitations, researchers are focusing on constructing inexpensive and compact systems using laser diodes (LDs) and light-emitting diodes (LEDs). In addition, one more problem with pulse laser systems is the low repetition rate of a few tens of Hz which results in slow image acquisition. Such problems can be overcome using LD- and LED-based systems that can operate at much higher repetition rates of a few tens of kHz. On the other hand, with such LED systems, one critical issue is that measurements need to be performed at much lower pulse energies than with conventional high-power laser systems, thus limiting practical applications. As irradiation energy is lowered, the ultrasound signals from the tissue become smaller, resulting in a poor signal-to-noise ratio (SNR) of the measurement and a reduction in spatial and depth resolution [18].
In recent years, several methods have been investigated to realize PAI with LD and LED systems [19,20,21,22]. Hariri et al. [21] developed a low-cost PAI system using LDs. They successfully imaged mouse skin ex vivo using a very low-intensity LD (wavelength: 905 nm, peak power: 6 W, pulse width: 55 ns). The improved light-focusing ability of LDs was utilized to improve the light energy per unit area in their successful experiment. In their experiments, a time-averaging method was used to improve the measured SNR. Singh et al. [19] used a multispectral LED-based photoacoustic (wavelength: 750/850 nm, pulse energy: 100/200 μJ, pulse width: 70 ns) and ultrasound system (AcousticX, CYBERDYNE INC, Tsukuba, Japan) for investigating human breasts in vivo. They developed a system that drives a large number of LEDs simultaneously to compensate for the low energy of the LEDs. Their system was constructed by combining LEDs that emit light at different wavelengths to identify different absorbers (e.g., arteries and veins). As the detected raw signals were weak, their system employed multiple amplifiers to amplify the signals followed by the use of the time-averaging method to improve the measured SNR.
The time-averaging method is often used to improve the SNR of measured signals. However, the time-averaging method is not suitable for achieving high frame rates because it takes significant time for the SNR to improve at a single measurement point, and thus, it is not suitable in clinical applications. For SNR improvement at high frame rates, methods such as adaptive denoising [20], empirical mode decomposition [23], wavelet transform [24], Wiener deconvolution [25], and coded excitation [26,27] can be possibly used. One of the coded excitations is the periodic and unipolar M-sequence (PUM). One major difference between time-averaging and PUM is the possibility of using PUM in decomposing overlapping acoustic waves.
Practical photoacoustic imaging requires a high repetition rate of light irradiation to improve SNR and shorten the measurement time. At high repetition rates, the chance of overlapping acoustic waves is highly probable because within the interval of measurement of one acoustic wave the next pulsed light signal is expected to be irradiating the sample. Such overlapping of acoustic waves becomes a significant issue when multiple vessels are present and, thus, distinguishing the signals becomes a complex problem. The time-averaging method cannot decompose such overlapping acoustic waves, but the PUM method can decompose overlapping acoustic waves because it uses the light irradiation timing as a reference signal. Zhang et al. [28] proposed a PUM-based coded excitation for PAI and applied to a laser-based system. Their study successfully demonstrated high SNR by applying PUM to PAI and showed the possibility of determining fluid velocity from photoacoustic wave measurement.
More advanced PAI research has investigated methods to improve the resolution of images obtained using deep learning [29,30]. Paul et al. [29] provided a simple deep learning U-Net framework and demonstrated real-time SNR improvement. Anas et al. [30] demonstrated the potential to improve resolution and reduce imaging processing time using a phantom medium and biological tissues. The use of deep learning in PAI is a very effective technique. On the other hand, as pointed out in their research, the image improvement could only be minimal if the SNR of the original PA signal itself is low. In other words, improving the SNR of the PA signal simultaneously with imaging approaches such as deep learning is necessary for the future development of PAI. Therefore, this study aimed to improve the SNR of the PA signal.
The development of a PUM technique that can improve the SNR of PAI signals and increase the scanning speed with high frame rates is very useful. However, while such a system has been realized only in laser-based systems, LED-based systems remain to be verified and their application has yet to be demonstrated. In an LED-based system, in order to achieve the exact spatial and depth resolution as in a laser-based system it is necessary to use not only PUM but also a high-current-driven LED system operating at high repetition rates. However, when using high repetition rates and short pulses with high-current drivers, circuit jitters [31,32] can cause a delay in LED emission. Such delays in the LED emission serve as a reference signal for the PUM-coded excitation technique which would introduce unwanted deviations, and this could become a critical drawback, thus reducing amplification efficiency. Therefore, we propose a new PUM algorithm, jitter-compensated PUM, which is applicable even when jitters are present in PAI systems.
The objective of this paper is to demonstrate the improvement to the SNR by using the proposed jitter-compensated PUM through simple experiments and to promote the future development of LED-based PAI. A simple experimental system of measuring photoacoustic signals was constructed using a black-coated iron plate and a narrow tube filled with ink as light absorbers, which act as the source of the photoacoustic waves, and a high-current-driven LED system. The presence of jitters in the LED driving circuit was measured, and a demonstration of the comparison of the SNR improvement with the conventional and proposed PUM was performed.

2. Theory and Method

2.1. Conventional Coded Excitation and PUM Theory

In the coded excitation, first, a signal is transmitted at an arbitrary particular code pattern. Next, the signal generated due to that coded pattern is decoded to recover the initial pulse response. The transmitted signal is a pseudo-random code with periodic autocorrelation characteristics, and its autocorrelation peaks once per cycle. Signals decoded by autocorrelation could have a higher SNR than single-shot signals. Coded excitation is a technique that can improve the SNR while maintaining a high frame rate [28]. Therefore, in PAI systems with low-power LEDs, the possibility of enhancing the SNR and spatial resolution can be feasible.
The coding process generally uses positive and negative bipolarity, but in PAI, using optical irradiation, only signals as positive codes, i.e., unipolar codes, can be transmitted. Zhang et al. [28] proposed the periodic and unipolar M-sequence (PUM), a non-negative part-periodic transmission scheme, as a coding process for PAI.
M-sequence is a bipolar sequence generated with a linear feedback shift register. On the other hand, PUM is a unipolar sequence generated from the positive code of the bipolar M-sequence. When a 7-bit PUM is used as an example, from the bipolar M-sequence M = {1, 1, 1, −1, −1, 1, −1}, a unipolar sequence M′ = {1, 1, 1, 0, 0, 1, 0} can be generated where the negative 1 is replaced by 0. Using the number of shifts in register stage m, the bit length (N) of the M-sequence can be expressed by the following equation:
N = 2 m 1 .
In the laser-based model of Zhang et al. [28], using the shifted cycle number k, the photoacoustic wave w(k) can be obtained by convolution of the triggered pulsed signal M′(k) with the impulse response of the laser pulse h(k). The generated photoacoustic signal w(k) is convolved with the bipolar signal M(−k) to obtain the decoded signal c(k), which is represented by the following equations:
w k = M k h k ,
c k = w k M k .
From this signal processing, the photoacoustic signal can be amplified by a factor of (N + 1)/2. Therefore, the larger the number of bits, the higher the amplification ratio of the photoacoustic signal which can be achieved.

2.2. Proposed New Decoding Algorithm of Jitter-Compensated PUM

The PUM theory used for PAI presented in Section 2.1 is applicable only when there is no deviation in the light emission timing from the triggered pulsed signal. In other words, if there is a deviation in light emission timing, autocorrelation will be lost and signal amplification will fail to perform as per the theory. When using a laser system, as Zhang et al. [28] have successfully performed in their experiments, there is almost no variation in the light emission timing. To achieve the equivalent spatial resolution with LED-based systems as that of laser-based systems, it is necessary to use high-current-driven LED circuit as well as PUM. When using high repetition rates and short pulses in high-current drives, current delays, called jitters, often occur as power supply noise [31,32]. In general, the jitters are caused by various off-chip circuits as well as thermal factors of high-current drives, and it has been reported that not only can constant time delays occur, but also random time delays can occur.
Figure 1 shows a schematic diagram of the effect of jitter on the measured photoacoustic waves when random jitter is present in the LED light-emitting circuit. When a time shift occurs due to a random jitter, as shown in Figure 1, it can be assumed that the periodic time of the trigger signal (tc) used as a reference signal in conventional PUM will not match the time of the measured photoacoustic wave (tj). Due to the jitter, the autocorrelation algorithm will not function, and the amplification efficiency of the conventional PUM could be reduced. Therefore, instead of the conventional PUM trigger timing, this study proposes a new decoding algorithm for PUM that compensates for the time shift due to a jitter by applying the monitor signal of the LED-driver current circuit. Here, it is assumed that the jitter is not periodic but has a random period. In the case of periodic jitter, the periodicity of the reference signal is not impaired and so the amplification principle using the conventional PUM model can be applied.
The conventional PUM assumes that there is no jitter and that the photoacoustic waves are measured in precise synchronization with the reference-triggered signal. However, in the proposed method, a new reference-triggered signal needs to be constructed using the current signal to incorporate the effect of jitters. Figure 2 shows the proposed decoding algorithm incorporating jitter, using an example model where one period is a 7-bit cycle. The new reference signal Mji(k), including the actual jitter effect, is defined by the following equation:
M j i k = I j i ( k ) × M 0 ( k ) ,
where k is an arbitrary shifted cycle number and Ij(k) is the timing of current flow to the LEDs with subscript j being the state of jitter influence. When one cycle of any period is denoted as M0(k), then Mji(−k) is shifted i times in the M0(k). Then, by convolving the generated Mji(k) with the photoacoustic signal wji(k), the decoding results cji(k) can be calculated as follows:
c j i k = w j i k M j i k .
By performing this algorithm for each shift and combining the decoding results, a jitter-compensated PUM can be performed.

2.3. Theoretical Value of SNR Improvement by Jitter-Compensated PUM

In the measurement results, the SNR can be simply defined by dividing the amplitude of the obtained photoacoustic signal, Asignal, by the standard deviation of the photoacoustic signal, σnoise, which is assumed to be noise. On the other hand, for the theoretical SNR, the signal amplification Asignal can be described as (N + 1)/2, where N is the PUM bits number and the noise standard deviation varies according to the two methods of the conventional or our proposed PUM. In conventional method, the number of 1 s and −1 s that construct the reference code for N-bit decoding becomes N. On the other hand, in the proposed method, the number of 1 s and −1 s becomes (N + 1)/2. Therefore, the N-bit noise can be, respectively, expressed for the conventional model σc (Equation (6)) and the proposed model σp (Equation (7)) by the law of error propagation, which is as follows:
σ c = σ 1 2 + σ 2 2 + + σ N 2 = N σ ,
σ p = σ 1 2 + σ 2 2 + + σ ( N + 1 ) / 2 2 = N + 1 2 σ .
Thus, the theoretical SNRs can be, respectively, expressed as the conventional model SNRc (Equation (8)) and the proposed model SNRp (Equation (9)), which are as follows:
S N R c N + 1 2 N ,
S N R p N + 1 2 .

3. Experiment

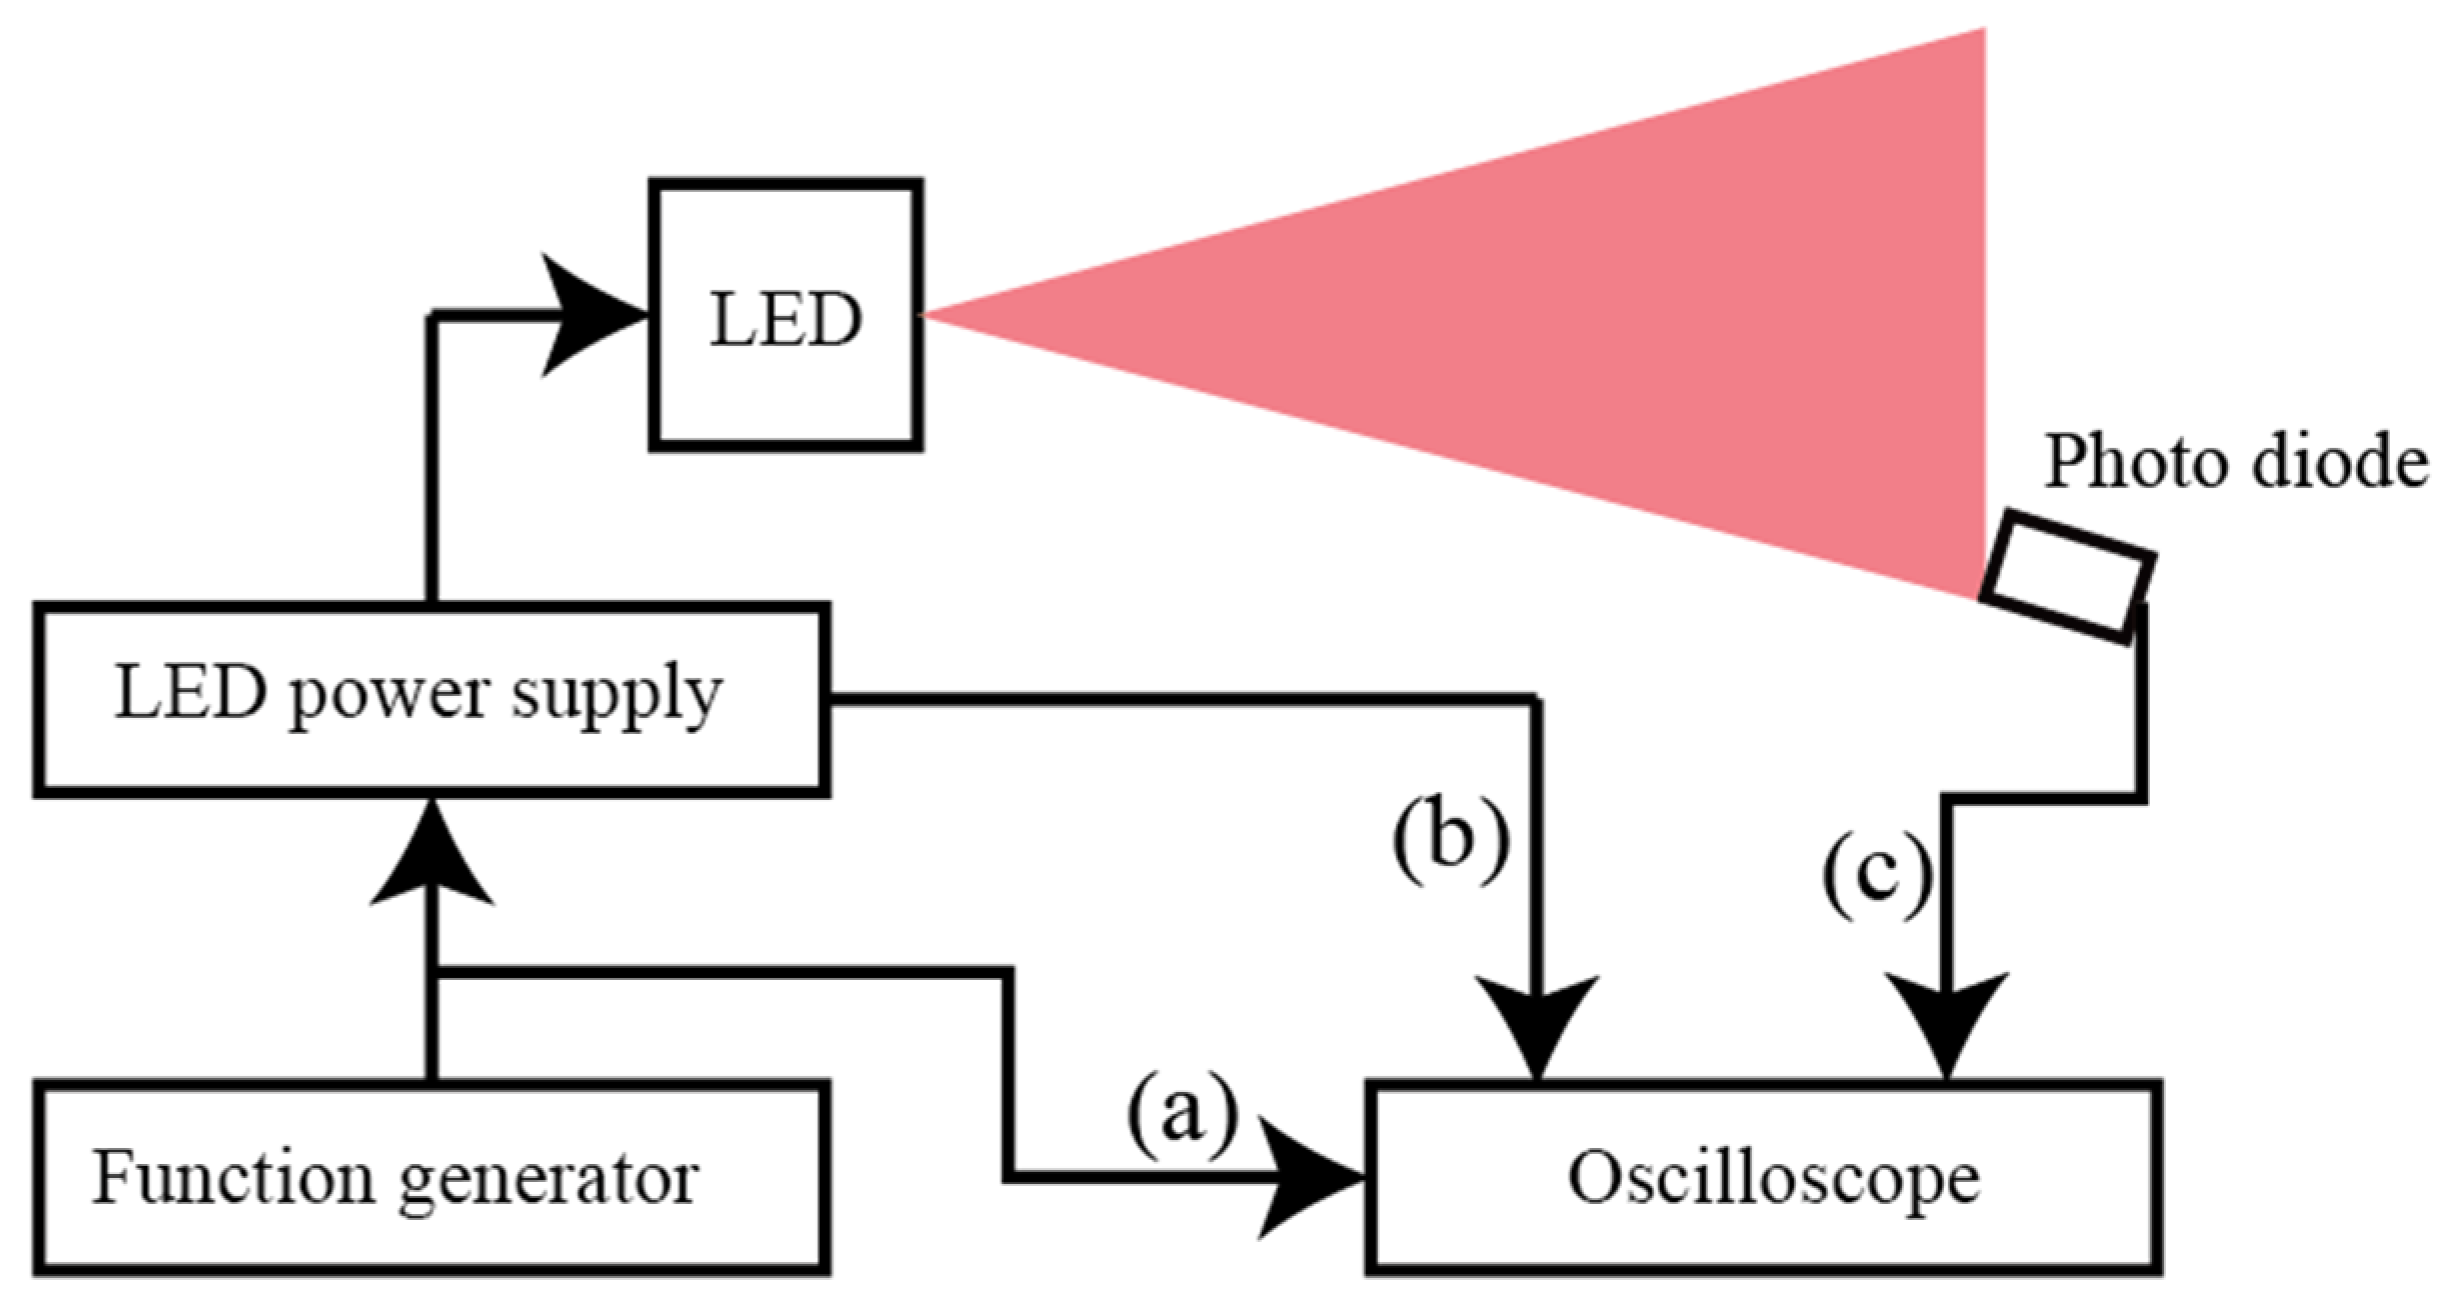
3.1. Experimental Setup

Figure 3 shows the experimental setup. LEDs (wavelength: 850 nm, SBB850DS-1200-02, Ushio Inc., Tokyo, Japan) were driven by an LED power supply (LDD100-F80, Artifex Engineering GmbH & Co KG., Emden, Germany). A function generator (WF1974, NF Corporation, Yokohama, Japan) was used as an external trigger to turn on the LEDs at the timing of the M-sequence. Light focused by two lenses (ACL50832U, Thorlabs Inc., Newton, NJ, USA) was irradiated onto an iron plate coated with black spray or a blood vessel model as a light absorber. The blood vessel model was made of a nylon tube (Aram Corporation, Osaka, Japan) with respective inner and outer diameters of 0.4 mm and 0.5 mm. The tube was filled with Indian ink (Royal Talens, Apeldoorn, The Netherlands) at a mass concentration of 0.5% in water, which was about five times the amount needed to make the optical absorption coefficient of human blood [33]. A total of 16 LEDs can be driven at a maximum of 40 V and 80 A. An aperture was placed between the LED substrate and the focusing lenses on a setup that allowed the performance of a single LED to be examined. Photoacoustic waves generated by the irradiated light were measured with an ultrasound sensor (V384-SU, Olympus Corporation, Tokyo, Japan) and amplified with a voltage amplifier (SA-230F5, NF Corporation, Yokohama, Japan). In this experiment, both the ultrasound sensor and the light absorber were placed in a water tank. The tank was designed with the dimensions shown in Figure 3 and was large enough for the reflection of photoacoustic waves on the tank walls to not affect the measurement results. Amplified signals and current/voltage monitors were measured using an oscilloscope (MSO5354, RIGOL Technologies, Suzhou, China). The LED power supply device has a function to monitor the timing of current/voltage flow, and the signal was measured with an oscilloscope.

3.2. Experimental Conditions

LEDs were driven at 40 V, 80 A, pulse width 500 ns, and pulse interval 100 μs (10 kHz). The pulse interval is long enough to prevent damage to the LEDs even when the device is not equipped with a cooling mechanism such as a heat sink. The pulse energy of a single LED was 4.7 μJ per pulse, as measured with a power meter (PM16-130, Thorlabs Inc.). M-sequences were generated using Matlab (R2022b) functions, and experiments were performed with 31, 63, 127, and 255 bits. Input triggers were created using arbitrary waveform creation software. All signal measurements were made at a sampling rate of 200 MS/s. A 3.5 MHz low-pass filter was applied to the signal obtained by decoding the M-sequence from the sensor sensitivity band of the ultrasonic sensor to filter out background noise that was not relevant for algorithm validation. The experimental model in this study does not fully represent the elements of biological tissue complexity, such as light scattering properties, the presence of several different sized blood vessels, and the difference between arteries and veins. In practical situations, such as clinical applications, it is necessary to make the setting parameters such as pulse energy, pulse width, pulse interval, and sensor bandwidth optimal to the sample being measured. Especially in actual human vessel measurements, shorter pulse width settings of 150 ns or less should be applied to accommodate the size of the absorber to adapt to the stress and relaxation confinement conditions. Therefore, the purpose of this study is limited to demonstrating the proposed algorithm using a simple light absorber.

4. Result and Discussion

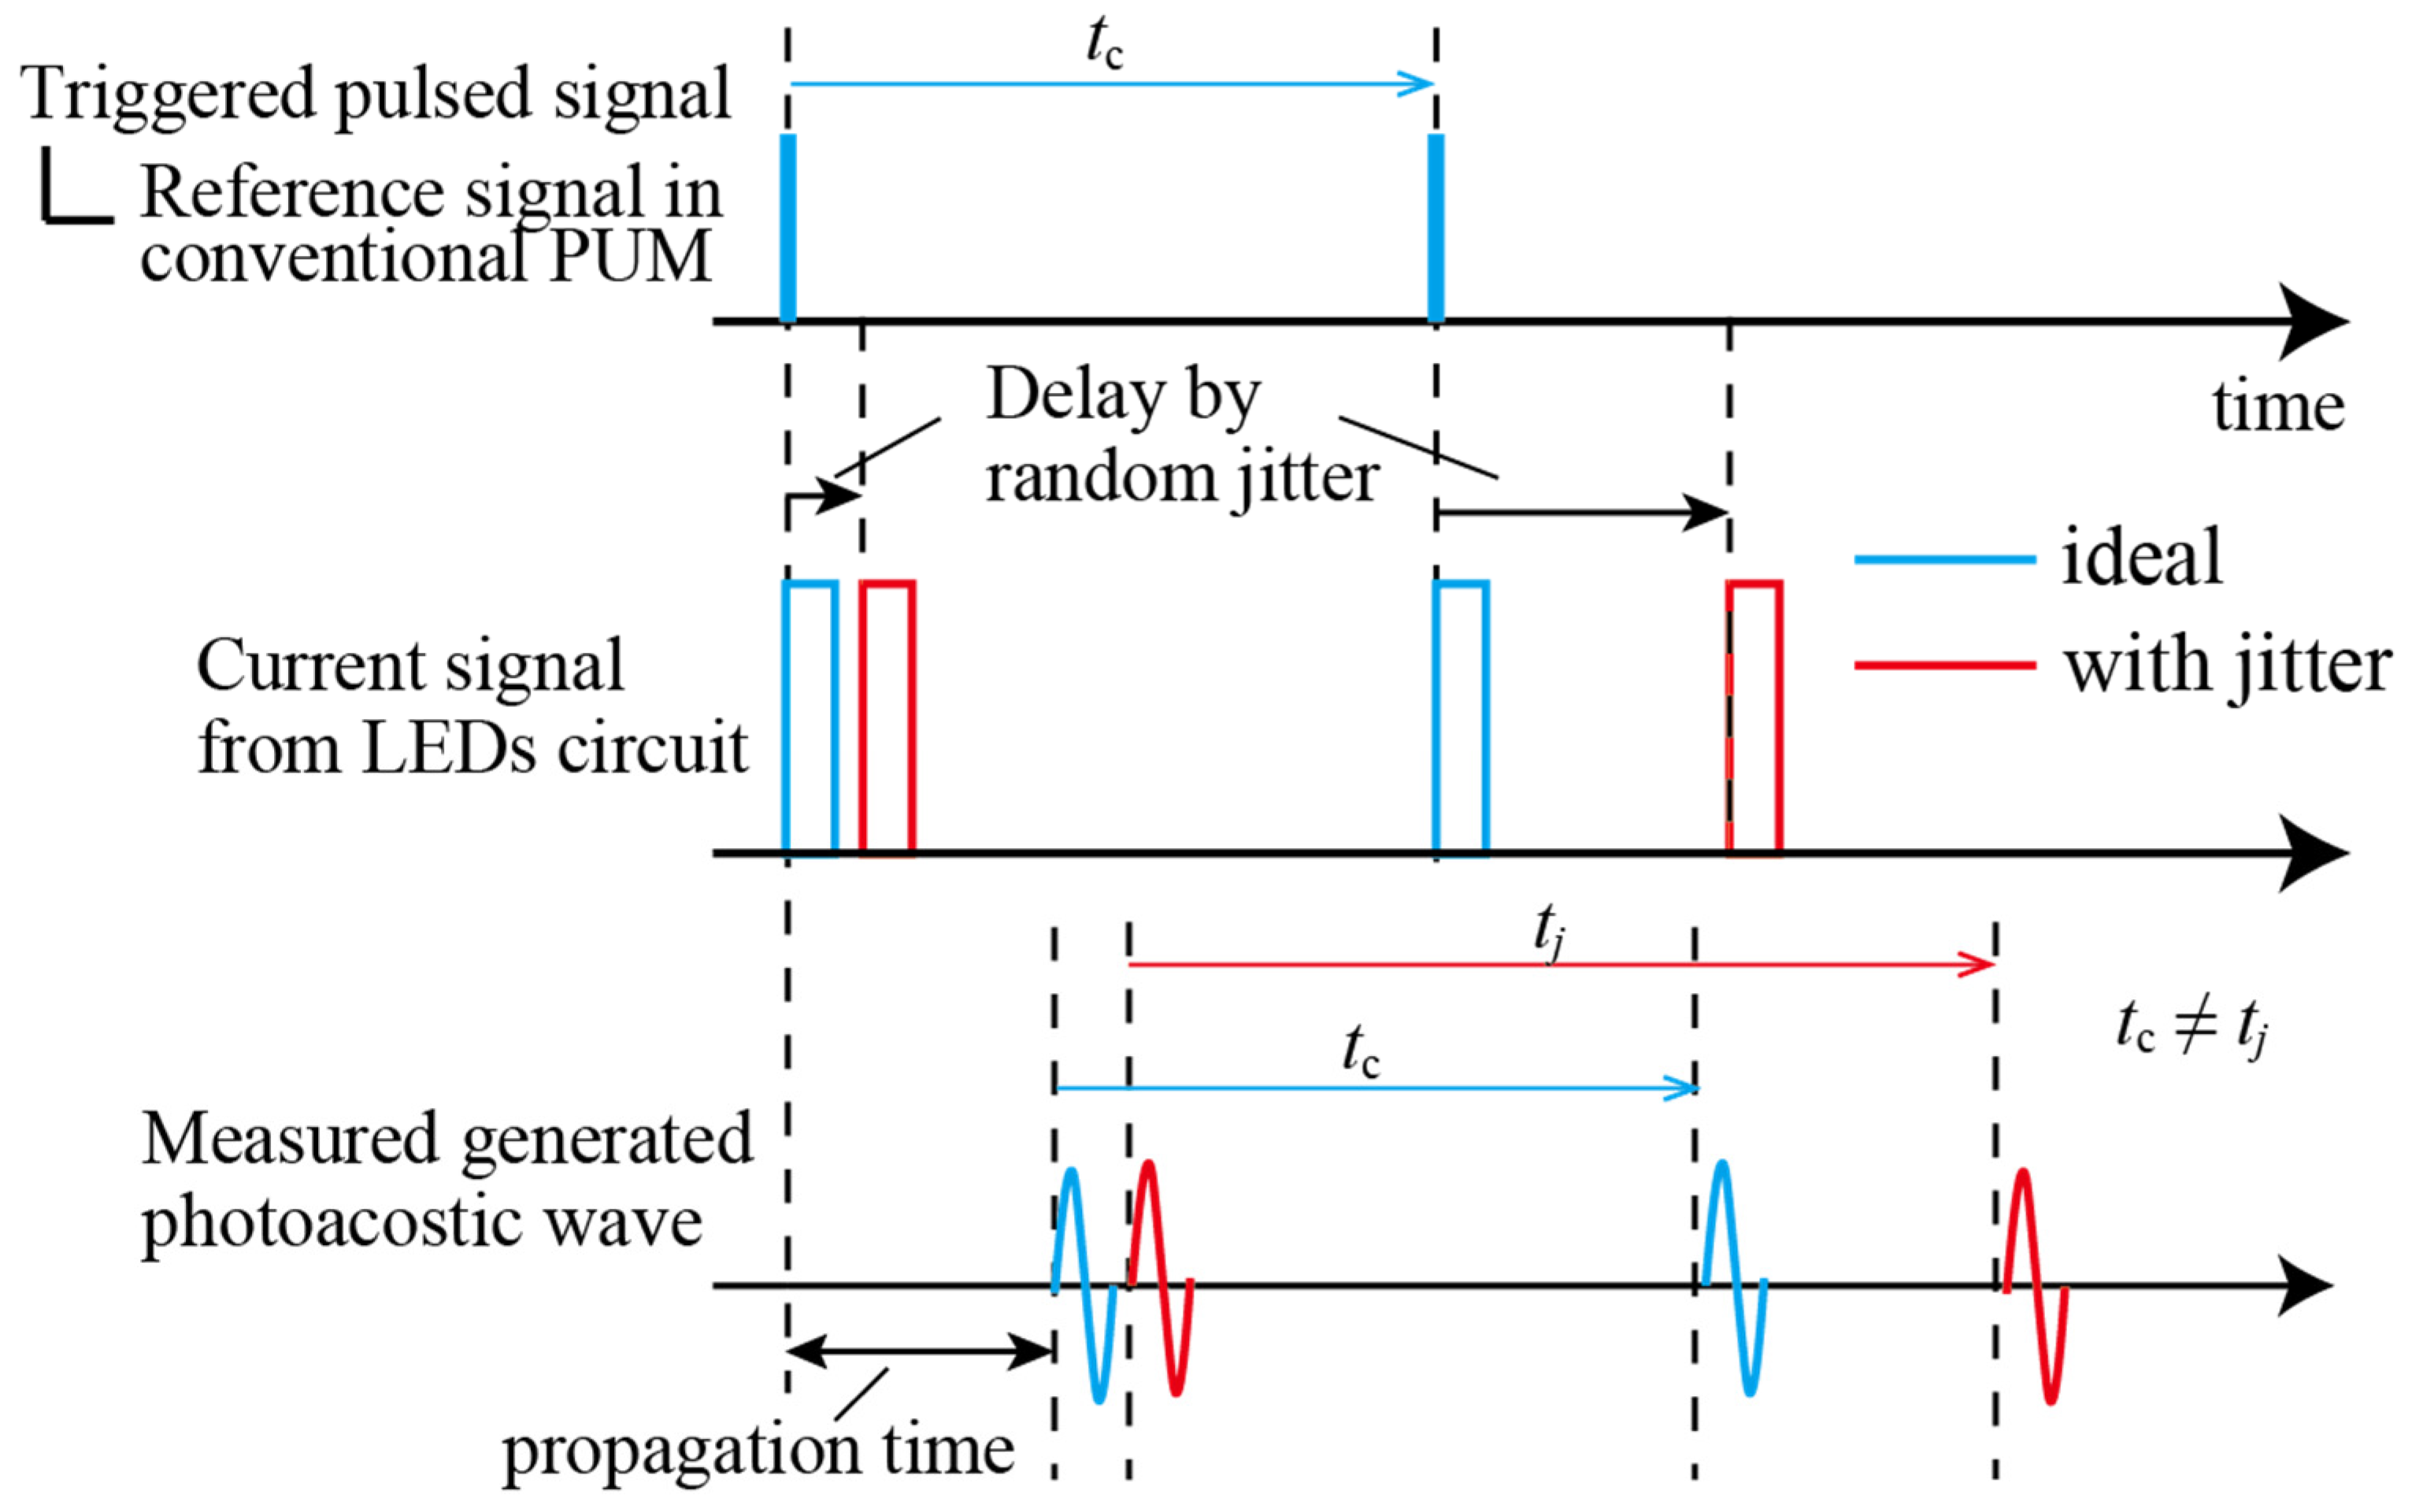
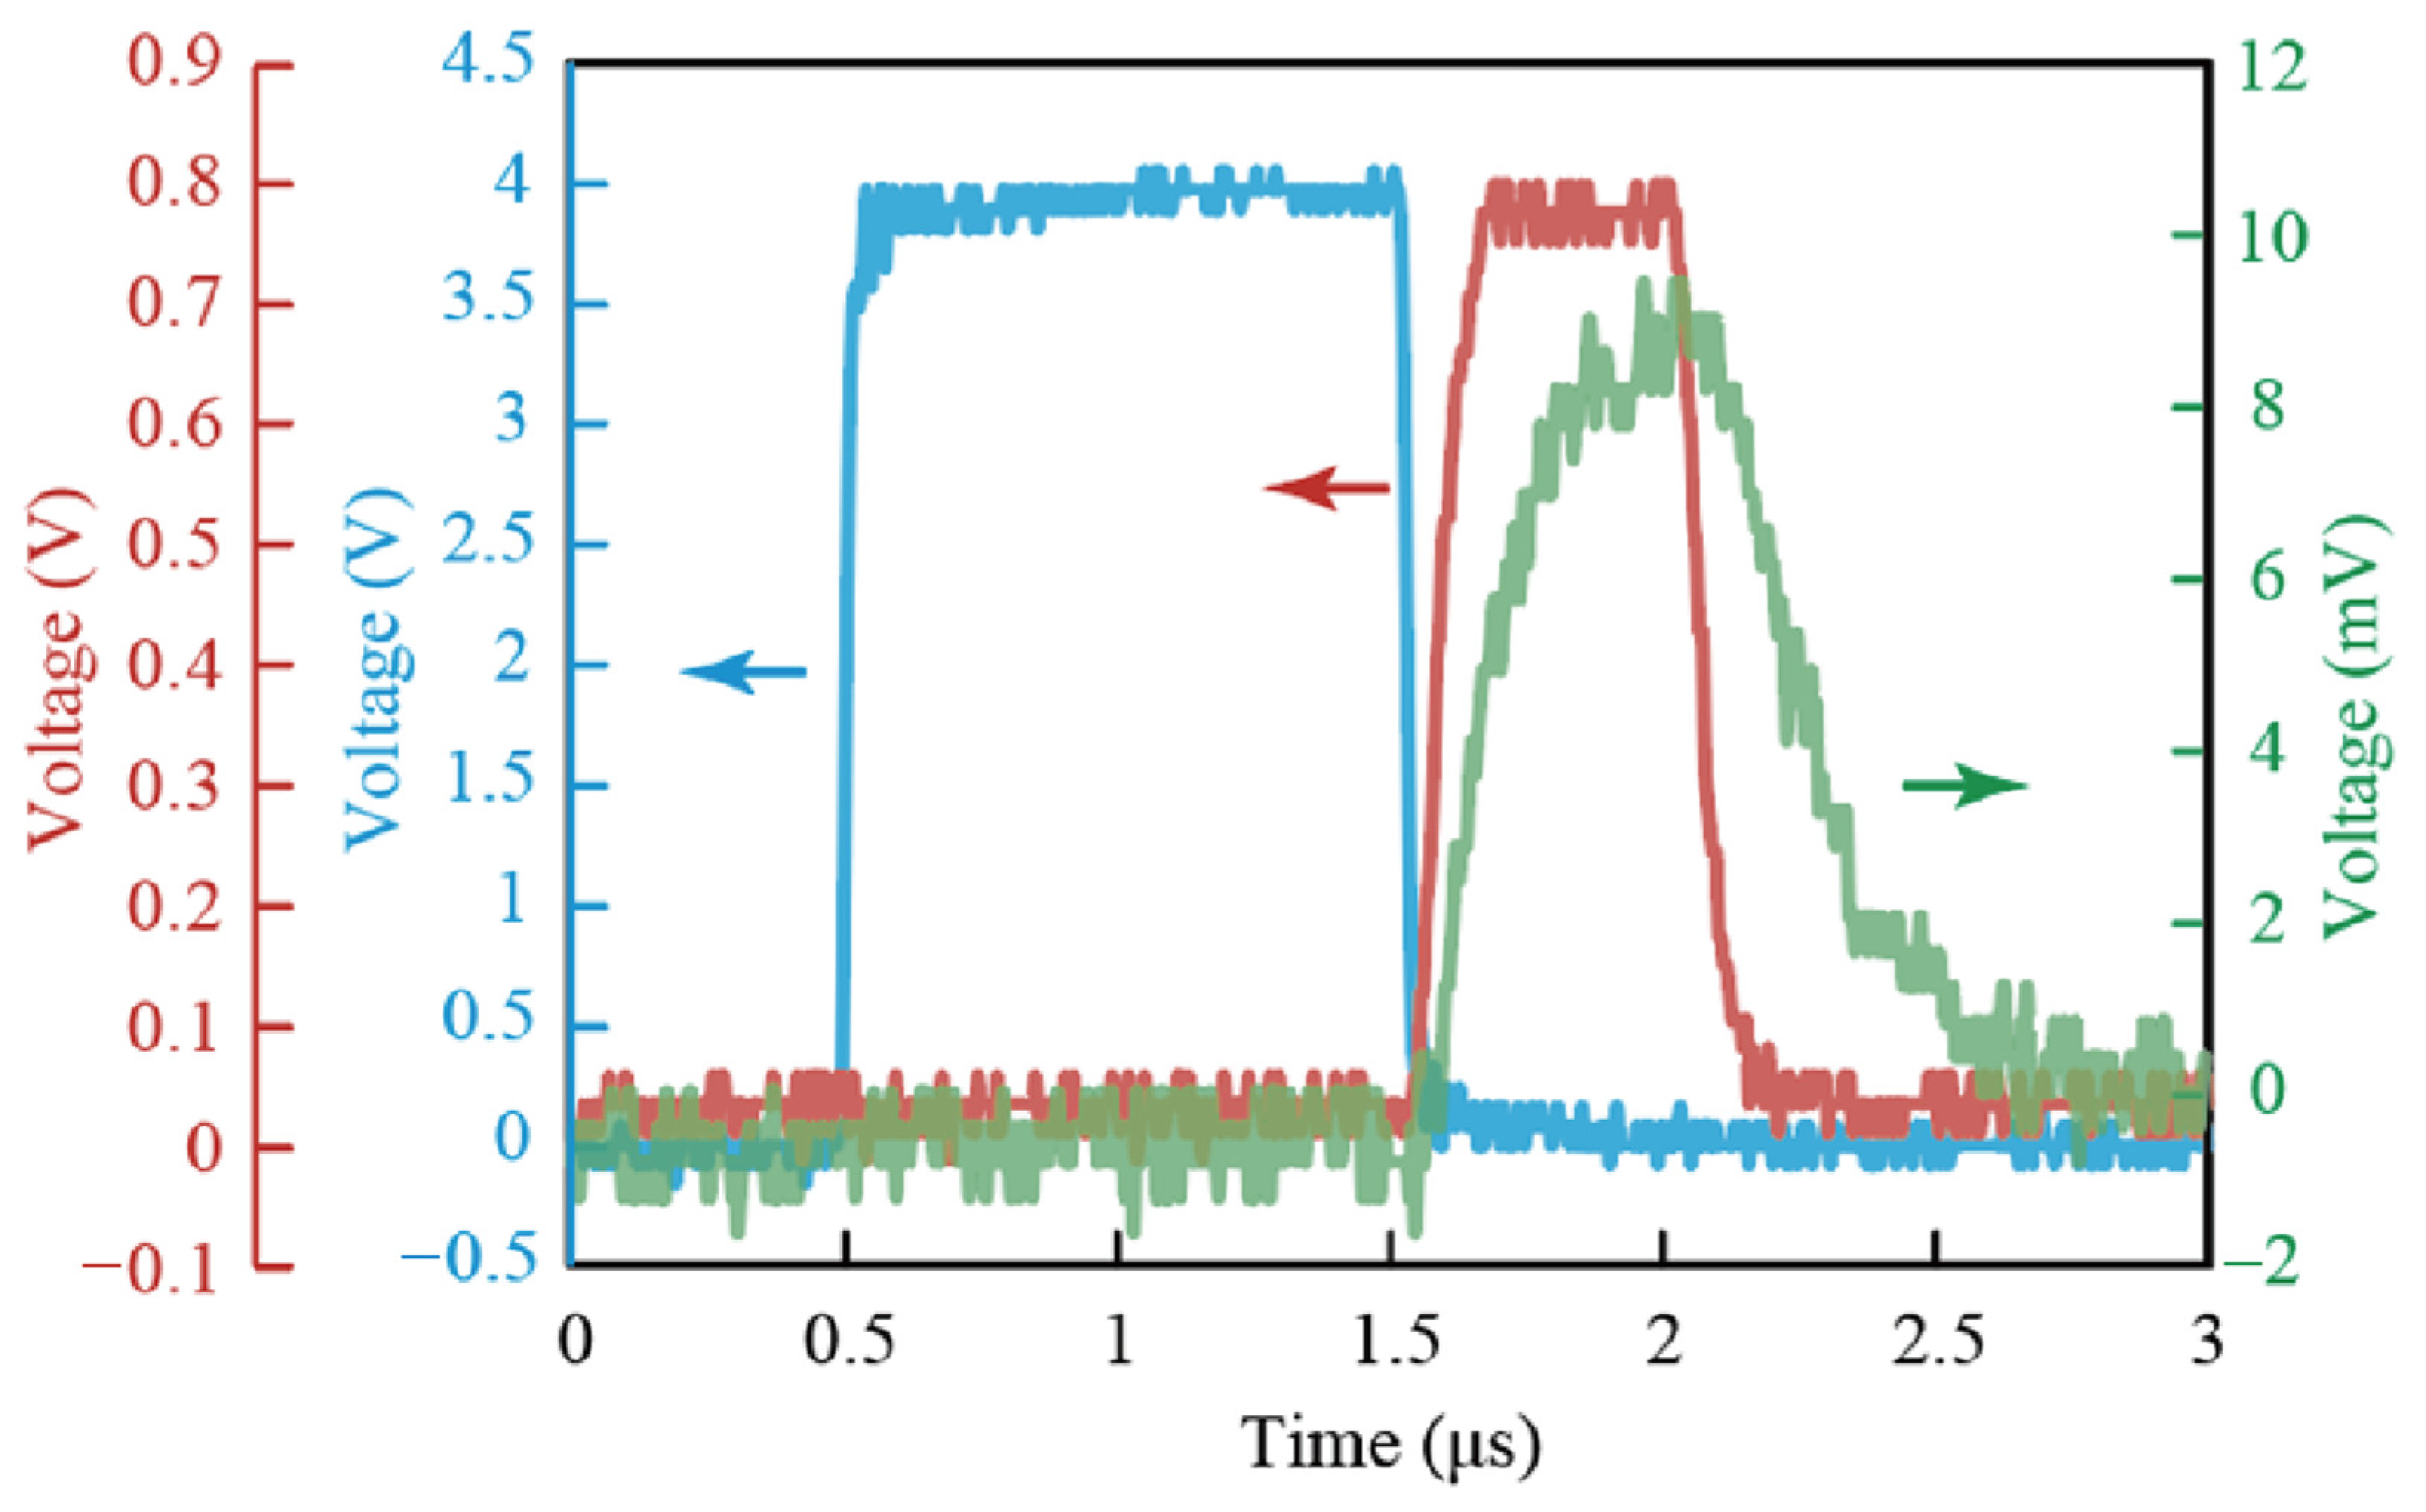
4.1. Evaluation of Time Delay of a Jitter in Circuit and Light Emission

A schematic of the experiment to measure the actual jitter and delay in the emission of LEDs is shown in Figure 4. In this experiment, based on the setup shown in Figure 3, the light from the LEDs was measured directly with a photodiode (S6775, Hamamatsu Photonics K.K., Shizuoka, Japan). Figure 5 shows examples of raw data measured with an oscilloscope: (a) function generator trigger, (b) LED power supply flow, and (c) photodiode.
To evaluate the delay time of LED emission and the effect of circuit jitter, threshold values for rising the timing were set to 0.1 V for the function generator trigger, 0.1 V for the LED power supply flow, and 5 mV for the photodiode, and the time beyond these values was recorded 30 times, respectively. From these results, we concluded that the sampling rate we set was small enough to measure the timing. The time from the function generator trigger to the LED power supply flow was about 1288 ns (standard deviation 117 ns), which is the circuit jitter. The standard deviation of the circuit jitter indicated the presence of random jitters. On the other hand, the time from the LED power supply flow to the photodiode was 122 ns (standard deviation = 10 ns), which is the delay time of LED emission. This measurement potentially includes the response at the photodiode and the delay in its circuit. However, the standard deviation of the delay time of LED emission was much smaller than the circuit jitter, indicating that the LED power supply and LED emission were well synchronized. Based on these results, we defined the reference timing as the timing of the LED power flow monitor, including the random jitter, which is assumed to have a significant impact on SNR improvement. The random delays in the LED emission are expected to decrease the SNR amplification obtainable by PUM.

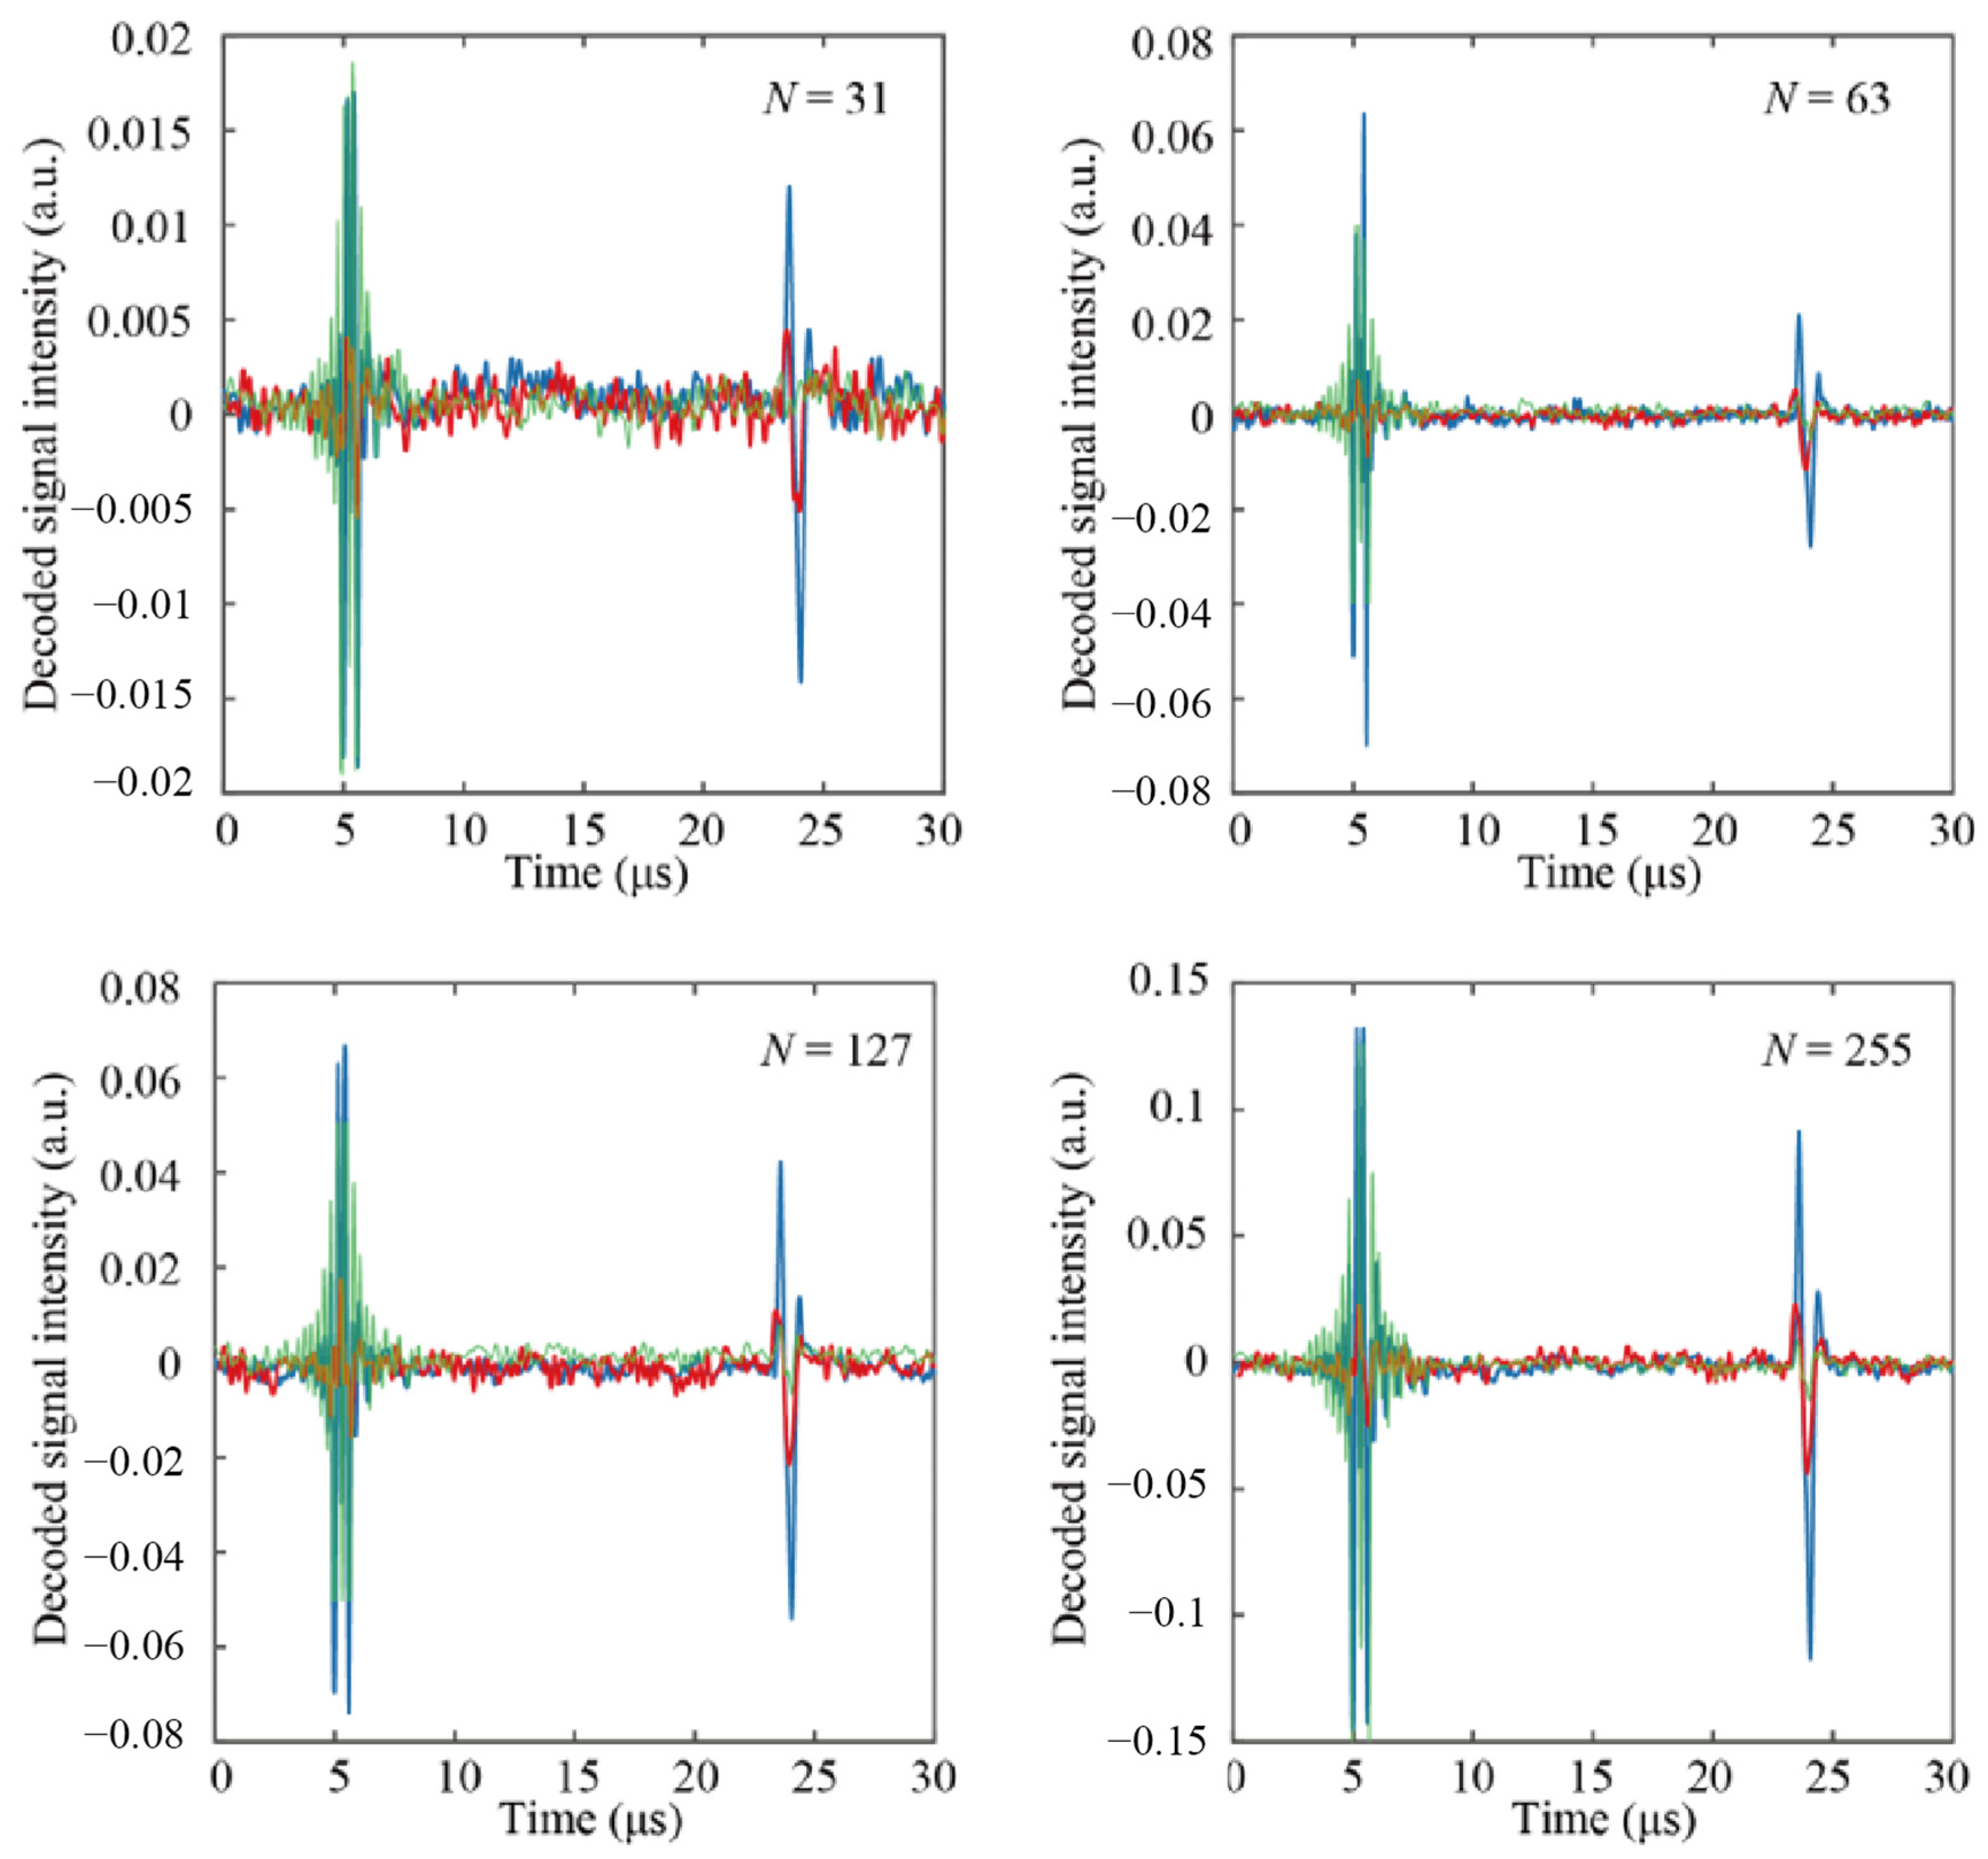
4.2. Evaluation of the Proposed Jitter-Compensated PUM

The proposed method presented in Section 2.2 uses the LED power supply flow monitors to determine the timing of Ij(k) and generate decoding signals. Figure 6 shows a schematic diagram of the decoding definition. In the decoding signal, 0.1 V of the LED power supply flow monitor is used as the threshold value due the results of Section 4.1. Values below this threshold are set to 0 and above threshold values are set to 1.
Figure 7 shows the photoacoustic signals obtained by the conventional PUM model (red line) and the jitter-compensation PUM model (blue line). Here, the experimental results were obtained by varying the number of bits N from 31 to 255 bits. The decoded signal intensity (a.u.) is shown on the vertical axis and time (μs) on the horizontal axis. In every result, a significant signal change was observed around 5 μs. This is consistent with the timing of the rise in the LED power supply flow monitor and can be judged to be noise generated by the LED emission. Since the emission noise is measured by the ultrasound sensor in synchronization with the PUM, it was also amplified by the PUM in the same way as the photoacoustic wave. When developing a practical device, it is necessary to incorporate a mechanism to eliminate LED noise during emission. For example, in this work, data were presented to include the timing of the light emission from the LED as part of the algorithm validation.
An N-shaped signal wave was obtained at around 25 μs. This coincided with the propagation time of the ultrasound wave calculated from the distance from the light absorber and the velocity of the ultrasound wave, so it can be verified that the measured N-shaped signals were derived from the photoacoustic wave. As for the blood vessel model, N-shaped signal waves were observed at more than 63 bits in the proposed jitter-compensated PUM, whereas N-shaped signal waves were not observed at all bits in the conventional PUM. The vertical values of the conventional PUM and the proposed jitter-compensated PUM were significantly different, indicating that the jitter-compensated PUM was higher. It was also shown that as the number of bits N increases, the ultrasound waves become clearer.
To compare the differences in amplification ratio due to the decoding methods, Figure 8 shows the SNR calculated from the experimental results and the theoretical values calculated from Equations (8) and (9). These experimental results are the averaged results from five experiments, and error bars are calculated standard deviations. The standard deviation of the noise used to calculate the SNR was calculated from 5000 data points during a time range unrelated to the signal, i.e., the photoacoustic waves from the iron plate and blood vessel model, and Welch’s t-test was used to evaluate statistically significant differences. This SNR analysis was not performed on the conventional PUM because N-shaped waves were not observed in the blood vessel model.
SNR significantly improved as the number of bits N increased for both the conventional and proposed methods (p < 0.05). The results of the conventional model show that the experimental SNR deviates gradually from the theoretical value, and the deviation increases with the increasing number of bits N. This deviation from the theoretical value was found to be statistically significant (p < 0.05). On the other hand, the proposed jitter-compensated PUM model shows that the SNR amplification ratio remains close to the theoretical value with the deviation being significantly low between the experimental and theoretical value as the number of bits N increases. There was no difference in the tendency between the iron plate experiment and the blood vessel model. Based on the differences in our results with PUM models, it can be concluded that in conventional PUM, jitters impair the autocorrelation of the M-sequence, resulting in a lower SNR amplification ratio. The proposed jitter-compensated PUM model also shows a significant difference (p < 0.05) from the theoretical value. This difference is probably because of external noise, sampling rate, and errors in the timing between the LED power supply flow monitoring and LED emission.
In our experiments, if there is no improvement in SNR, the algorithm will need to be constructed by replacing the LED radiation with reference timing. However, since there is no increase in the deviation from the theoretical value with an increase in the number of bits, and the SNR does not reach its peak in the bit number ranges used in our experiments, we expect that the amplification ratio can still be improved with a still larger number of bits in future applications. Therefore, the proposed jitter-compensated PUM model was shown to work effectively when using circuits with high current and jitter. Although the results presented here are from samples of plate and a narrow tube phantom object and not actual tissue samples, the signal improvement has been demonstrated. To further improve the practicality of our proposed method, it is necessary to validate it using practical biological tissue models, such as the light scattering properties of skin and the placement of multiple blood vessels.

5. Conclusions

A new jitter-compensated PUM was proposed to obtain a high SNR even when using LED light sources with jitter in the emission circuit. Experiments revealed the existence of jitters when using a high-current and high-voltage LED light driver. Photoacoustic wave measurement experiments were conducted using this LED system, and the results of decoding by the PUM for PAI using a conventional laser system and the proposed jitter-compensated PUM were shown. The results showed that the proposed jitter-compensated PUM gave a high SNR close to the theoretical SNR. In addition, the amplification ratio could be increased without much deviation from the theoretical values with an increasing number of bits. For application to biological tissues, it is necessary to employ a larger number of bits than shown in this study. The proposed method needs to be further improved in future studies, and it is important to develop further signal amplification methods for the clinical application of PAI with LEDs. The results presented here are based on experiments using a simple flat optical absorber plate or a single blood vessel model with a high optical absorption coefficient placed in water. Therefore, future work is needed to verify the practicality of the proposed method in biological tissues, such as in medical applications, using an experimental model that includes multiple blood vessels and light scattering factors, as well as the light source and other parameters mentioned as limitations. In particular, efforts must be taken to mitigate the LED temperature rise due to a high current drive and the possibility of increased emission delay effects on the SNR amplification when using higher current drives and higher repetition rates. Since the temperature rise in the driver circuit and LEDs potentially affects the jitter, research on jitter characteristics is also needed for the practical use of the LEDs.

Author Contributions

Conceptualization, T.K., U.M.R., K.N. and J.Y.; methodology, T.K., K.H., K.F., U.M.R., K.N. and J.Y.; software, T.K., K.H., K.F. and K.N.; validation, T.K., K.H., K.F. and K.N.; formal analysis, T.K., K.H., K.F. and K.N.; investigation, T.K., K.H., K.F. and K.N.; resources, T.K., U.M.R., K.N. and J.Y.; data curation, T.K., K.H., K.F. and K.N.; writing—original draft preparation, T.K., K.H., K.F. and K.N.; writing—review and editing, T.K., U.M.R., K.N. and J.Y.; visualization, T.K., K.H., K.F. and K.N.; supervision, T.K., U.M.R., K.N. and J.Y; project administration, T.K., U.M.R., K.N. and J.Y.; funding acquisition, T.K., U.M.R., K.N. and J.Y. All authors have read and agreed to the published version of the manuscript.

Funding

This research received no external funding.

Institutional Review Board Statement

Not applicable.

Informed Consent Statement

Not applicable.

Data Availability Statement

The original contributions presented in this study are included in the article. Further inquiries can be directed to the corresponding author.

Conflicts of Interest

The authors declare no conflicts of interest.

References

  1. Wang, X.; Pang, Y.; Ku, G.; Xie, X.; Stoica, G.; Wang, L.V. Noninvasive laser-induced photoacoustic tomography for structural and functional in vivo imaging of the brain. Nat. Biotechnol. 2003, 21, 803–806. [Google Scholar] [CrossRef] [PubMed]
  2. Oraevsky, A.A.; Savateeva, E.V.; Solomatin, S.V.; Karabutov, A.A.; Andreev, V.G.; Gatalica, Z.; Khamapirad, T.; Henrichs, P.M. Optoacoustic imaging of blood for visualization and diagnostics of breast cancer. Biomed. Optoacoust. III 2002, 4618, 81–94. [Google Scholar]
  3. Kim, C.; Song, K.H.; Gao, F.; Wang, L.V. Sentinel lymph nodes and lymphatic vessels: Noninvasive dual-modality in vivo mapping by using indocyanine green in rats—Volumetric spectroscopic photoacoustic imaging and planar fluorescence imaging. Radiology 2010, 255, 442–450. [Google Scholar] [CrossRef] [PubMed]
  4. Oladipupo, S.; Hu, S.; Kovalski, J.; Yao, J.; Santeford, A.; Sohn, R.E.; Shohet, R.; Maslov, K.; Wang, L.V.; Arbeit, J.M. VEGF is essential for hypoxia-inducible factor-mediated neovascularization but dispensable for endothelial sprouting. Proc. Natl. Acad. Sci. USA 2011, 108, 13264–13269. [Google Scholar] [CrossRef]
  5. Oladipupo, S.S.; Hu, S.; Santeford, A.C.; Yao, J.; Kovalski, J.R.; Shohet, R.V.; Maslov, K.; Wang, L.V.; Arbeit, J.M. Conditional HIF-1 induction produces multistage neovascularization with stage-specific sensitivity to VEGFR inhibitors and myeloid cell independence. Blood J. Am. Soc. Hematol. 2011, 117, 4142–4153. [Google Scholar] [CrossRef]
  6. Zhu, Y.; Xu, G.; Yuan, J.; Jo, J.; Gandikota, G.; Demirci, H.; Agano, T.; Sato, N.; Shigeta, Y.; Wang, X. Light emitting diodes based photoacoustic imaging and potential clinical applications. Sci. Rep. 2018, 8, 9885. [Google Scholar] [CrossRef] [PubMed]
  7. Zhu, Y.; Lu, X.; Dong, X.; Yuan, J.; Fabiilli, M.L.; Wang, X. LED-based photoacoustic imaging for monitoring angiogenesis in fibrin scaffolds. Tissue Eng. Part C Methods 2019, 25, 523–531. [Google Scholar] [CrossRef]
  8. Zhang, E.Z.; Povazay, B.; Laufer, J.; Alex, A.; Hofer, B.; Pedley, B.; Glittenberg, C.; Treeby, B.; Cox, B.; Beard, P.; et al. Multimodal photoacoustic and optical coherence tomography scanner using an all optical detection scheme for 3D morphological skin imaging. Biomed. Opt. Express 2011, 2, 2202–2215. [Google Scholar] [CrossRef]
  9. Favazza, C.P.; Jassim, O.; Cornelius, L.A.; Wang, L.V. In vivo photoacoustic microscopy of human cutaneous microvasculature and a nevus. J. Biomed. Opt. 2011, 16, 016015. [Google Scholar] [CrossRef]
  10. Hu, S.; Wang, L.V. Neurovascular photoacoustic tomography. Front. Neuroenergetics 2010, 2, 1560. [Google Scholar] [CrossRef]
  11. Hu, S.; Yan, P.; Maslov, K.; Lee, J.M.; Wang, L.V. Intravital imaging of amyloid plaques in a transgenic mouse model using optical-resolution photoacoustic microscopy. Opt. Lett. 2009, 34, 3899–3901. [Google Scholar] [CrossRef]
  12. Feng, T.; Perosky, J.E.; Kozloff, K.M.; Xu, G.; Cheng, Q.; Du, S.; Yuan, J.; Deng, C.X.; Wang, X. Characterization of bone microstructure using photoacoustic spectrum analysis. Opt. Express 2015, 23, 25217–25224. [Google Scholar] [CrossRef]
  13. Kaiplavil, S.; Mandelis, A.; Wang, X.; Feng, T. Photothermal tomography for the functional and structural evaluation, and early mineral loss monitoring in bones. Biomed. Opt. Express 2014, 5, 2488–2502. [Google Scholar] [CrossRef]
  14. Feng, T.; Kozloff, K.M.; Tian, C.; Perosky, J.E.; Hsiao, Y.S.; Du, S.; Yuan, J.; Deng, C.X.; Wang, X. Bone assessment via thermal photo-acoustic measurements. Opt. Lett. 2015, 40, 1721–1724. [Google Scholar] [CrossRef]
  15. Wang, X.; Feng, T.; Cao, M.; Perosky, J.E.; Kozloff, K.; Cheng, Q.; Yuan, J. Photoacoustic measurement of bone health: A study for clinical feasibility. In Proceedings of the 2016 IEEE International Ultrasonics Symposium (IUS), Tours, France, 18–21 September 2016. [Google Scholar]
  16. Garcia-Uribe, A.; Erpelding, T.N.; Krumholz, A.; Ke, H.; Maslov, K.; Appleton, C.; Margenthaler, J.A.; Wang, L.V. Dual-modality photoacoustic and ultrasound imaging system for noninvasive sentinel lymph node detection in patients with breast cancer. Sci. Rep. 2015, 5, 15748. [Google Scholar] [CrossRef]
  17. Song, K.H.; Wang, L.V. Deep reflection-mode photoacoustic imaging of biological tissue. J. Biomed. Opt. 2007, 12, 060503. [Google Scholar] [CrossRef]
  18. Hariri, A.; Lemaster, J.; Wang, J.; Jeevarathinam, A.S.; Chao, D.L.; Jokerst, J.V. The characterization of an economic and portable LED-based photoacoustic imaging system to facilitate molecular imaging. Photoacoustics 2018, 9, 10–20. [Google Scholar] [CrossRef]
  19. Singh, M.K.A.; Dantuma, M.; Joseph, F.K.; Manohar, S.; Steenbergen, W. Breast imaging using an LED-based photoacoustic and ultrasound imaging system: A proof-of-concept study. In Photons Plus Ultrasound: Imaging Sensing 2021; SPIE: Bellingham, WA, USA, 2021; Volume 11642, pp. 32–38. [Google Scholar]
  20. Hariri, A.; Hosseinzadeh, M.; Noei, S.; Nasiriavanaki, M.R. Photoacoustic signal enhancement: Towards utilization of very low-cost laser diodes in photoacoustic imaging. In Photons Plus Ultrasound: Imaging and Sensing 2017; SPIE: Bellingham, WA, USA, 2017; Volume 10064, pp. 822–826. [Google Scholar]
  21. Hariri, A.; Fatima, A.; Mohammadian, N.; Mahmoodkalayeh, S.; Ansari, M.A.; Bely, N.; Avanaki, M.R. Development of low-cost photoacoustic imaging systems using very low-energy pulsed laser diodes. J. Biomed. Opt. 2017, 22, 075001. [Google Scholar] [CrossRef]
  22. Shi, M.; Vercauteren, T.; Xia, W. Spatiotemporal singular value decomposition for denoising in photoacoustic imaging with a low-energy excitation light source. Biomed. Opt. Express 2022, 13, 6416–6430. [Google Scholar] [CrossRef]
  23. Sun, M.; Feng, N.; Shen, Y.I.; Shen, X.; Li, J. Photoacoustic signals denoising based on empirical mode decomposition and energy-window method. Adv. Adapt. Data Anal. 2012, 4, 1250004. [Google Scholar] [CrossRef]
  24. Ermilov, S.A.; Khamapirad, T.; Conjusteau, A.; Leonard, M.H.; Lacewell, R.; Mehta, K.; Miller, T.; Oraevsky, A.A. Laser optoacoustic imaging system for detection of breast cancer. J. Biomed. Opt. 2009, 14, 024007. [Google Scholar] [CrossRef]
  25. Zhang, C.; Maslov, K.; Yao, J.; Wang, L.V. In vivo photoacoustic microscopy with 7.6-µm axial resolution using a commercial 125-MHz ultrasonic transducer. J. Biomed. Opt. 2012, 17, 116016. [Google Scholar] [CrossRef]
  26. Mienkina, M.P.; Friedrich, C.S.; Gerhardt, N.C.; Beckmann, M.F.; Schiffner, M.F.; Hofmann, M.R.; Schmitz, G. Multispectral photoacoustic coded excitation imaging using unipolar orthogonal Golay codes. Opt. Express 2010, 18, 9076–9087. [Google Scholar] [CrossRef]
  27. Zhang, H.; Kondo, K.; Yamakawa, M.; Shiina, T. Simultaneous multispectral coded excitation using Gold codes for photoacoustic imaging. Jpn. J. Appl. Phys. 2012, 51, 07GF03. [Google Scholar] [CrossRef]
  28. Zhang, H.K.; Kondo, K.; Yamakawa, M.; Shiina, T. Coded excitation using periodic and unipolar M-sequences for photoacoustic imaging and flow measurement. Opt. Express 2016, 24, 17–29. [Google Scholar] [CrossRef]
  29. Paul, A.; Mallidi, S. U-Net enhanced real-time LED-based photoacoustic imaging. J. Biophotonics 2024, 17, e202300465. [Google Scholar] [CrossRef]
  30. Anas, E.M.A.; Zhang, H.K.; Kang, J.; Boctor, E. Enabling fast and high quality LED photoacoustic imaging: A recurrent neural networks based approach. Biomed. Opt. Express 2018, 9, 3852–3866. [Google Scholar] [CrossRef]
  31. Balestrieri, E.; Picariello, F.; Rapuano, S.; Tudosa, I. Review on jitter terminology and definitions. Measurement 2019, 145, 264–273. [Google Scholar] [CrossRef]
  32. Tripathi, J.N.; Sharma, V.K.; Shrimali, H. A review on power supply induced jitter. IEEE Trans. Compon. Packag. Manuf. Technol. 2018, 9, 511–524. [Google Scholar] [CrossRef]
  33. Kolkman, R.G.; Steenbergen, W.; Van Leeuwen, T.G. In vivo photoacoustic imaging of blood vessels with a pulsed laser diode. Lasers Med. Sci. 2006, 21, 134–139. [Google Scholar] [CrossRef]
Figure 1. The effect of jitters on the generated photoacoustic waves. The top row represents the reference sequence that acts as a trigger for pulsed emission with a constant interval tc, the middle represents the current signal from the LED that is supposed to be emitted at the same intervals, and the bottom row represents the measured PA signal. Blue lines indicate the ideal case while the red ones indicate the presence of jitters, with the interval no longer than tc but represented as tj. Dashed lines represent the random jitters.
Photonics 12 00398 g001
Figure 2. A schematic explanation of the proposed algorithm process for jitter compensation with two slightly shifted signals given as red Ij0(k) and blue Ij1(k) dashed lines. The original reference trigger signal and the current with jitter represented, respectively, as M′(k) and Ij(k). Note the random jitter in the current signal because of the jitter in the current generation. The two example cases given in red and blue each produce the respective PA signals, red wj0(k) and blue wj1(k), with each generation of the PA signal within the red-dotted and blue-dotted boxes. Within each box, the process given by Equations (4) and (5) are performed to give the respective PA signals represented in red and blue N-shaped PA signals.
Photonics 12 00398 g002
Figure 3. The schematic of the experimental system with the LED mounted directly on the current driver source with the light from the LED collimated by a system of two lenses. An aperture was placed in front of the source to have light from only one LED, and it was confirmed that the sample region was uniformly illuminated. The ultrasound from the absorber in the sample was collected by an ultrasound sensor, and also was acquired by an oscilloscope.
Photonics 12 00398 g003
Figure 4. A schematic for the measurement of the time delay of circuit jitter and light emission. Light from the LED was directly measured using the scattered light with a fast photodiode while the function generator reference signal was also monitored simultaneously to account for the jitter from the LED power supply. There was almost a time delay between the time measured by the photodiode and the reference signal that is given to the LED power supply.
Photonics 12 00398 g004
Figure 5. Examples of raw data measured with an oscilloscope: Here, blue, red, and green lines, respectively, correspond to the signals from the function generator that is the trigger for the LED emission, LED power supply flow, and the signal measured by the photodiode. Note there is almost no delay between the LED power supply rise and the PD rising signal level and the small difference is much less than the pulse width of 500 ns.
Photonics 12 00398 g005
Figure 6. Definition of the decoding signal from the LED power supply flow monitor. The threshold is set to be 0.1 V.
Photonics 12 00398 g006
Figure 7. Decoded signals with conventional PUM for iron plate (red line), proposed jitter-compensated PUM for iron plate (blue line), and blood vessel model (green line) at each bit number N.
Photonics 12 00398 g007
Figure 8. Theoretical and experimental results of SNR with (a) conventional PUM for iron plate, (b) proposed jitter-compensated PUM for iron plate, and (c) proposed jitter-compensated PUM for blood vessel model.
Photonics 12 00398 g008
Disclaimer/Publisher’s Note: The statements, opinions and data contained in all publications are solely those of the individual author(s) and contributor(s) and not of MDPI and/or the editor(s). MDPI and/or the editor(s) disclaim responsibility for any injury to people or property resulting from any ideas, methods, instructions or products referred to in the content.

