Article

Microstructured Waveguide Sensors for Point-of-Care Health Screening

by
Svetlana S. Konnova
1,*,
Pavel A. Lepilin
1,
Anastasia A. Zanishevskaya
1,
Alexey Y. Gryaznov
1,
Natalia A. Kosheleva
2,
Victoria P. Ilinskaya
3,
Julia S. Skibina
1 and
Valery V. Tuchin
4,5,6
1
SPE LLC “Nanostructured Glass Technology” (SPE LLC “NGT”), Saratov 410033, Russia
2
Department of Hospital Therapy, Saratov State Medical University Named After V.I. Razumovsky, Saratov 410000, Russia
3
Department of Cardiology, Regional Clinical Hospital, Saratov 410053, Russia
4
Institution of Physics and Science Medical Center, Saratov State University, Saratov 410012, Russia
5
Laboratory of Laser Molecular Imaging and Machine Learning, Tomsk State University, Tomsk 634050, Russia
6
Institute of Precision Mechanics and Control, FRC “Saratov Scientific Centre of the Russian”, Saratov 410028, Russia
*
Author to whom correspondence should be addressed.
Photonics 2025, 12(4), 399; https://doi.org/10.3390/photonics12040399
Submission received: 28 February 2025 / Revised: 14 April 2025 / Accepted: 17 April 2025 / Published: 20 April 2025
(This article belongs to the Special Issue Optical Sensors for Advanced Biomedical Applications)

Abstract

:
Biosensor technologies in medicine, as in many other areas, are replacing labor-intensive methods of monitoring human health. This paper presents the results of experimental studies on label-free sensors based on a hollow core microstructured optical waveguide (HC-MOW) for human blood serum analysis. The MOWs with a hollow core of 247.5 µm in diameter were manufactured and used in our work. These parameters allow the hollow core to be filled with high-viscosity solutions due to the capillary properties of the fiber. Calculations of the spectral properties of the HC-MOW fiber were carried out and experimentally confirmed. Twenty-one blood serum samples from volunteers were analyzed using standard photometry (commercial kits) and an experimental biosensor. The obtained transmission spectra were processed by the principal component analysis method and conclusions were drawn about the possibility of using this biosensor in point-of-care medicine. A significant difference was shown between the blood serum of healthy patients and patients with confirmed diagnoses and a long history of cardiovascular system abnormalities. Algorithms for spectra processing using the Origin program are presented.

1. Introduction

Disease prevention is an important trend in the development of modern medicine. The life expectancy of patients with some non-infectious diseases with a high mortality rate can be significantly increased with the timely diagnosis of these diseases and medical maintenance of the patient’s health. Such diseases include various cardiovascular diseases, diabetes mellitus, kidney diseases, etc. [1,2,3,4].
For example, according to the WHO, 17.9 million people die each year from cardiovascular disease [5]. This number could be significantly reduced if pathological changes could be detected by screening every time a patient visits a medical clinic. The reason for screening is to detect disease or its precursors earlier (before symptoms appear) [6].
The physical, chemical, and biological properties of blood vary depending on many factors, such as sex, age, and also disease. However, there are established standards for blood parameters, and deviations from these standards indicate disease development [7,8]. The most effective indicator of pathological metabolic disorders during screening is human blood serum. This liquid component of blood, devoid of formed elements and fibrinogen, contains many markers that reflect the health of the body [9]. In addition to clinical laboratory and functional routine studies, clinical blood tests are widely used in hospitals to assess the condition of patients. There are a number of diseases that are known to cause changes in blood characteristics, often before the onset of symptoms [8].
To detect deviations in blood parameters, various automatic and semi-automatic biochemical analyzers and kits based on affinity chromatography, photometry, colorimetry, turbidimetry, etc., are used. These methods are labor-intensive, require qualified personnel, are not very accurate, have problems with sensitivity and specificity, aim to identify only one analyzed parameter, and usually have an insufficiently accurate control system. In addition, the analysis of the desired parameter may not be performed or might be ignored [10].
Optical biosensors are modern analytical devices, most of which employ light-guiding technologies as their transducer part. In recent years, a significant number of investigations into the creation of biosensors have been based on the use of the properties of photonic crystal fibres. In recent studies, photonic crystal fibres have been used to create biosensors based, for example, on IgG proteins [11,12].
Less articles devoted to the study of the properties of micro- and nanostructured glass fibers and the possibilities of their use for biomedical applications have been published [13,14,15]. The detection of such organic components of blood serum, like cholesterol [16], glucose [17], and albumin [18], as well as the identification of antibody/antigen interactions using microstructured glass fibers, have been studied [19,20]. Biosensors based on microstructure waveguides demonstrate the greatest promise for their use, since, due to their unique structure, they require less labor for their manufacture, compared with other types of biosensors [21,22].
Unlike photonic crystal waveguides, microstructured fibers have a larger internal capillary diameter, which allows liquids of higher viscosity to be placed inside the fiber, as well as a wide range of wavelengths used for research [10,16]. The advantages of biosensors based on microstructured fibers lie in their accuracy, speed, and ease of use [18]. Interest in these objects is also based on the possibility of introducing the studied materials into the internal channels of the fibers and thereby ensuring their interaction with the light propagating through the core along the entire length of the fiber. Microstructured waveguides with a hollow core and one row of capillaries have not yet been used to study blood serum in general. Glass waveguides are easy to manufacture, chemically stable, and neutral, so no special additional components applied to the surface are required [23].
There are several methods for making MOWs, depending on the material used to draw the fiber, the possibility of making the multicomponent materials, and the intended application [24]. The stack-and-draw technique is the most applicable and most efficient for drawing glass-based MOWs [25,26]. Alternative approaches include soft glass extrusion [27], slurry casting, and sol–gel method [28,29], or powder sintering of blanks [30], for drawing special glass optical fibers.
The operating principle of the HC-MOW used in this study is based on the detection of shifts in the maxima and minima in the transmission spectrum of the HC-MOWs and changes in their relative intensity, which are associated with changes in the refractive index and absorption coefficient of the bioanalyte and the presence of scattering particles in it [31]. Unlike conventional photometric systems, HC-MOWs has greater sensitivity due to an increase in the optical path, which is formed due to the multiple total internal reflection of the beam from the walls of the waveguide. The presence of 1–5 layers of capillaries surrounding the central hollow core ensures minimal signal loss on the way to the reading device, and an additional outer layer of capillaries ensures structural integrity during the drawing process. This design provides a higher sensitivity of the sensors compared to analogues and standard cuvettes [32].
The data obtained using HC-MOWs do not represent the result explicitly and require mathematical and statistical processing. There are several methods for analyzing multidimensional data, differing from each other in the parameters of the input data and the nuances of the analysis performed.
Principal factor analysis generates common factors that explain correlations between variables [33].
Correspondence analysis is suitable for analyzing contingency tables (a large number of qualitative variables) [34].
Canonical correlation analysis is used for analyzing two blocks of variables and analyzing the correlation between them [35].
Redundancy analysis predicts a linear combination of dependent variables from a combination of independent ones [36].
Independent component analysis is another method of component analysis. It allows one to identify latent factors that explain observed data [37].
Principal component analysis is associated with a certain proportion of the total variance of the original data set. Dispersion, which is a measure of data variability, can reflect the level of their information content [38]. The principal component method has proven itself in many studies related to various spectroscopy methods as a method of “grouping data” according to various indicators. This statistical method was used specifically for processing spectral data in UV [39], in the terahertz spectrum [40], and in the IR spectrum [41]. We considered this method the most suitable for processing our data.
The goal of this study is to identify differences in the transmission spectra of the blood serum of healthy volunteers and individuals with pathological blood parameters using specifically manufactured HC-MOWs and processing obtained data with principal component analysis.
Devices created on the base of the proposed biosensor could be used not only in medical laboratories, but also for point-of-care health monitoring in hospitals. They would make it possible to quickly and accurately determine the state of human health.

2. Materials and Methods

2.1. Blood Samples

This study analyzed serum samples from 21 female volunteers aged between 35 and 45 years old. The samples were then divided into two distinct groups: healthy control» (samples 1–11) and patients (samples 12–21). It should be noted that all the data underwent anonymization to maintain the confidentiality of the subjects; each sample was assigned a number. The healthy control samples were obtained from healthy women preparing for in vitro fertilization (IVF) and with no diagnosed cardiovascular disease. The study was standardized by recruiting a group of healthy women without chronic diseases, a prerequisite for obtaining a quota from the government for IVF procedures. Prior to undergoing further procedures, all participants underwent a preliminary examination that included measurements of blood pressure, temperature, and a general urine and blood analysis (complete blood count). They were also administered a standardized questionnaire that inquired about the presence of chronic diseases and any medications they were currently taking. It was ascertained that none of the participants had chronic diseases or took medications on a regular basis. The patient samples were obtained from recruited volunteers with a range of chronic conditions, namely, patients attending a cardiology clinic. The information pertaining to the patients was obtained from patient files. The patients had various diagnoses and were under observation and treatment in the cardiology clinic, with various cardiac diseases (e.g., heart attack and ischemic heart disease) at different stages. Each patient was administered medication in accordance with standard clinical protocols, which was expected to result in the restoration of normal blood counts in some cases.
Venous whole blood samples were carried out in accordance with the requirements of the methodological guidelines MU 4.2.2039-05 “Technique of collecting and transporting biomaterials to microbiological laboratories” after 8–13 h of fasting [42]. Blood serum separated according to a standard protocol was tested for icterus, hemolysis, and lipemia measurements using the Liquichek Serum Indices (BIO-RAD, Hercules, CA, USA). The collected samples were examined using certified kits produced by ABRIS+, Ltd. (St. Petersburg, Russia) for albumin, cholesterol, glucose, iron, magnesium, etc., in accordance with the kit instructions. In accordance with the literature data, the most significant blood parameters in terms of their impact on the blood serum spectrum were selected.
Optical density was registered in the wavelength range 350–1000 nm using a Spectrophotometer Evolution One (Thermo FS, Waltham, MA, USA). To measure transmission spectra of blood serum in the HC-MOW, it was diluted 1:20 (5 µL serum + 95 µL H2O) with 0.9% saline (9 g sodium chloride in 100 mL distillate water) and incubated at room temperature (22 °C) for 15 min. The analysis requires no more than 30 µL of diluted serum.

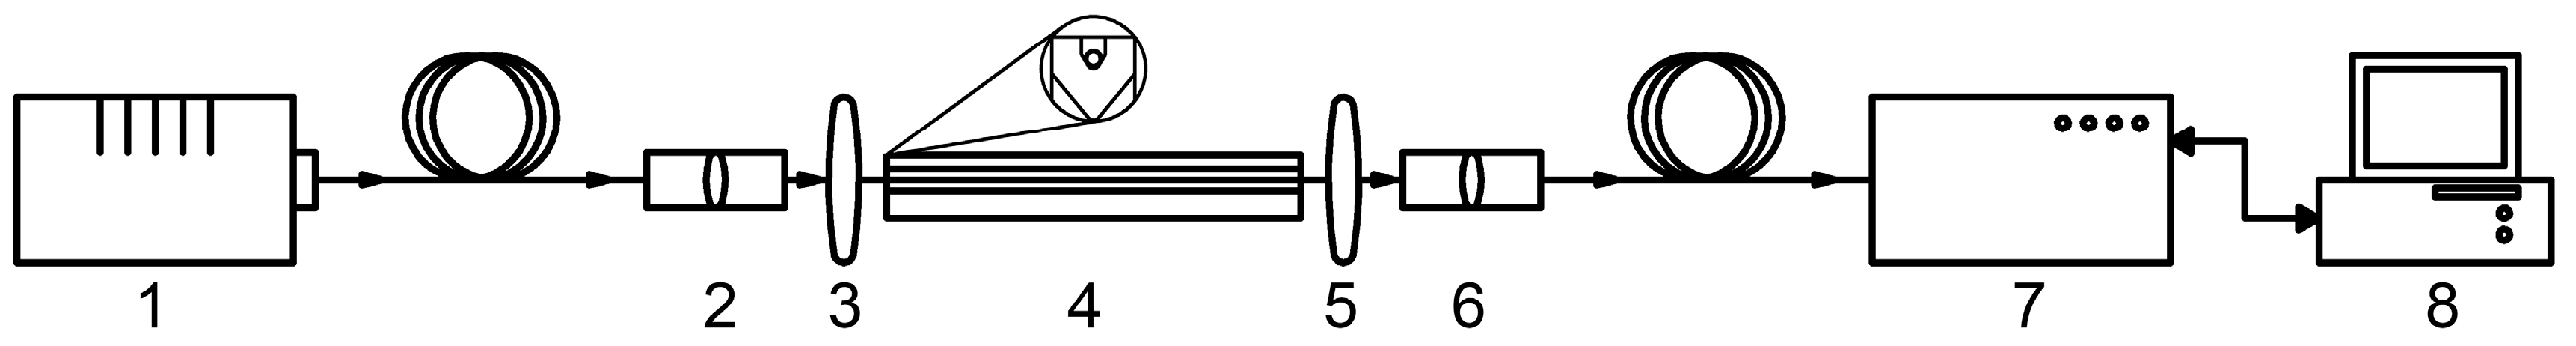
2.2. Optical Instrumentation

HC-MOWs were manufactured from Ar-Glass (Schott, Mainz, Germany) using stack-and-draw technique by SPE LLC Nanostructured Glass Technology (Saratov, Russia). HC-MOWs have one concentric circle of capillaries that surround a hollow core. Length of all samples was 6 cm; other parameters of the waveguide are shown in Figure 1.
We used this fiber only once, and after use, we disposed of it as standard, after disinfection, in accordance with Federal sanitary rules, norms, and hygienic standards [43].
The configuration of the experimental setup is delineated in Figure 2. The halogen lamp (Avalight-HAL-S-MINI 2, manufactured by “Avantes”, Apeldoorn, The Netherlands) emits radiation that is converted into a parallel beam by a collimating lens optimized for the range of 200–2500 nm (also manufactured by “Avantes”). This lens is connected to a fiber optical cable, the output end of which is fixed on the adjusting slide. Subsequently, the radiation enters the 10× achromatic objectives lens (JLLSMCMGGX, Nanking, China) (3), the function of which is to focus the radiation to the small core of HC-MOW, which is placed in a special plastic cuvette (4) designed by the authors. The radiation beam is introduced with precision into the hollow core of the waveguide, is collected by the second 10X achromatic objectives lens (5), enters the second collimating lens (6), and is fed into the spectrum analyzer (AvaSpec-ULS4096CL-EVO, Avantes, Apeldoorn, The Netherlands) (7), which is directly connected to a personal computer (8). The noise in the opto-electrical measurement system is approximately 1% of the total intensity, and is corrected by the built-in spectrometer software and smoothing. The spectral resolution of this configuration under consideration is 0.25 nm.

2.3. Data Processing

The processing of data, the creation of plots, and the conducting of statistical analysis were all undertaken utilizing standard Microsoft Office and Origin Pro 2021 (v. 9.8.0.200) software.
The measured optical spectra were processed in two ways for spectral analysis and for principal component analysis. For processing, a section of the transmission spectrum was selected in the wavelength range of 350–1050 nm. The main maxima of the comb of our waveguide are located in this range, which increases its sensitivity in this range. Furthermore, this range of radiation is considered to be the most gentle for biological molecules. The spectra were smoothed using a Savitzky–Golay filter (smoothing was performed in a window of 8 nm, with an average peak width of 45 nm) to reduce noise and remove external factors that influenced the spectrum. The filter window width of 29 points was chosen empirically, based on the analysis of spectra with different degrees of noise and after testing several window width options (e.g., 15, 21, 25, 29, 31, and 35). The window width of 29 was optimal based on the results of the visual and quantitative analysis, allowing for effective noise suppression with minimal impact on the location and relative intensity of the spectral peaks.
For spectral analysis the spectra were normalized to the maximum value. For principal component analysis entailed the following steps:
1. All data of transmission spectra were divided to the corresponding integration times.
2. The transmission spectra of HC-MOWs, filled with blood serum or solvent, were divided by the spectrum of the lamp.
3. All spectra were converted into optical density.
4. The transmission spectrum of the solvent (saline) were subtracted from the transmission spectrum of the diluted serum.
5. The spectra were smoothed once again using a Savitzky–Golay filter (smoothing was performed in a window of 8 nm, with an average peak width of 45 nm).
Origin Pro 2021 function principal component analysis (PCA) was then used to separate serum transmittance spectra into groups in the vectron view.

3. Results

3.1. Study of the Properties of the HC-MOW

The structural shell of the HC-MOW is composed of periodically stacked glass capillaries. The thickness of the capillary walls of the structural shell is the main geometric parameter that affects the spectral characteristics of the waveguide. The transmission spectrum of the HC-MOW typically exhibits one or multiple maxima. The wavelengths of these maxima can be calculated using two HC-MOW parameters: the thickness of the shell capillary walls and the refractive index of the material the waveguide was made from [44].
λ m a x = 2 d n 2 2 n 1 2 2 j + 1
where d is the wall thickness of the shell capillaries, µm; n1 is the refractive index of the medium filling the waveguide structure (in this case, air, i.e., n1 = 1); n2 is the refractive index of glass (1.473). A spectral minimum is located between two maxima. The experimental values of the minima and maxima of the transmission spectrum were then compared with the theoretical calculations (see Table 1). The measurements were carried out for all waveguides used in the experiment. The statistical processing of the measurement data demonstrated that the calculated parameters exhibited the greatest congruence with the experimental values of the resonant-comb wavelengths, which had the smallest standard deviation (SD) values, in the middle section of the spectrum within the wavelength range of 576–701 nm. Figure 3a shows the transmission spectrum of the empty HC-MOW, the HC-MOW filled with water (Figure 3b), the HC-MOW filled with saline solution (Figure 3c), and the HC-MOW filled with diluted serum (Figure 3d).

3.2. Biochemical Analysis of Blood Serum

At the first stage of the research, a biochemical analysis of the serum was performed using standard kits, as described in Section 2.1. Table 2 shows the serum parameters of the volunteers that did not deviate from the normative values. Conversely, Table 3 shows the parameters for which at least one subject had abnormal values. All abnormal values are emboldened and highlighted in grey for clarity.
Consequently, the conditionally healthy women exhibited minor elevations in cholesterol levels, with a range of 0.88 being observed. The remaining parameters under scrutiny were found to be within normal limits. Among the patients, only samples 14 and 20 showed no deviations in the studied parameters. However, these patients cannot be considered healthy, as they received compensatory treatment in accordance with their disease.

3.3. Spectral Analysis of Human Serum

Figure 4 shows the transmission spectra of blood serum samples from volunteers in a waveguide and in the photometric cuvette. It is impossible to explicitly divide the samples to healthy controls and patients based on the spectra in the photometric cuvette. However, the transmission spectra of the sera in the waveguide are clearly divided into two groups, which corresponds to their actual division into healthy controls and patients.
As mentioned above, the position of transmission peaks, their absolute intensity, and the intensity of individual peaks relative to neighboring peaks are determined by the optical parameters of the medium filling the waveguides. Blood serum is a complex multicomponent medium. The influence of blood serum components on its transmission spectrum varies over the entire wavelength range. For example, there is almost no absorption in the wavelength range from 600 nm to 800 nm. Comparing the results of dividing the volunteer groups into patients and healthy controls, obtained in a microstructured waveguide and in a photometric cuvette, at a wavelength of 600 nm (the only point of difference for the photometric cuvette), a clear differentiation of intensity was observed of approximately 45% when using the waveguide, while, with the photometric cuvette, this difference was less than 3%. The microstructured waveguide allows for increasing the sensitivity to critical parameters of blood serum by more than 10 times (Figure 4). One of the transmission maxima is located in this wavelength range.
Figure 5 shows the values of the position of this transmission peak and the refractive index of the samples.
The blood serum is characterized by the presence of absorption bands in the wavelength range up to 600 nm. This phenomenon may be linked to the presence of residual hemoglobin. The various forms of hemoglobin exhibit a high absorption capacity at numerous wavelengths, including 415, 542, and 577 nm for oxyhemoglobin; 431 and 556 nm for deoxyhemoglobin; 545 and 579 nm for glycated hemoglobin; and 500 nm for methemoglobin [45]. However, there are no explicit transmission minima in the spectra in the cuvette at the corresponding wavelengths because of the low concentration of blood and the short length of the interaction path between radiation and the solution. The design features of the waveguides provide a significant increase in the length of the interaction path between radiation and the substance (due to the larger actual size compared to the thickness of the cuvette and the multiple re-reflection of radiation in the core). Consequently, the influence of absorbing substances on the transmission spectrum in the waveguide is enhanced, as can be seen from the transmission spectra in Figure 6. The presented data demonstrate a significant difference in the degree of absorption at these wavelengths between the healthy control and patient volunteer groups.

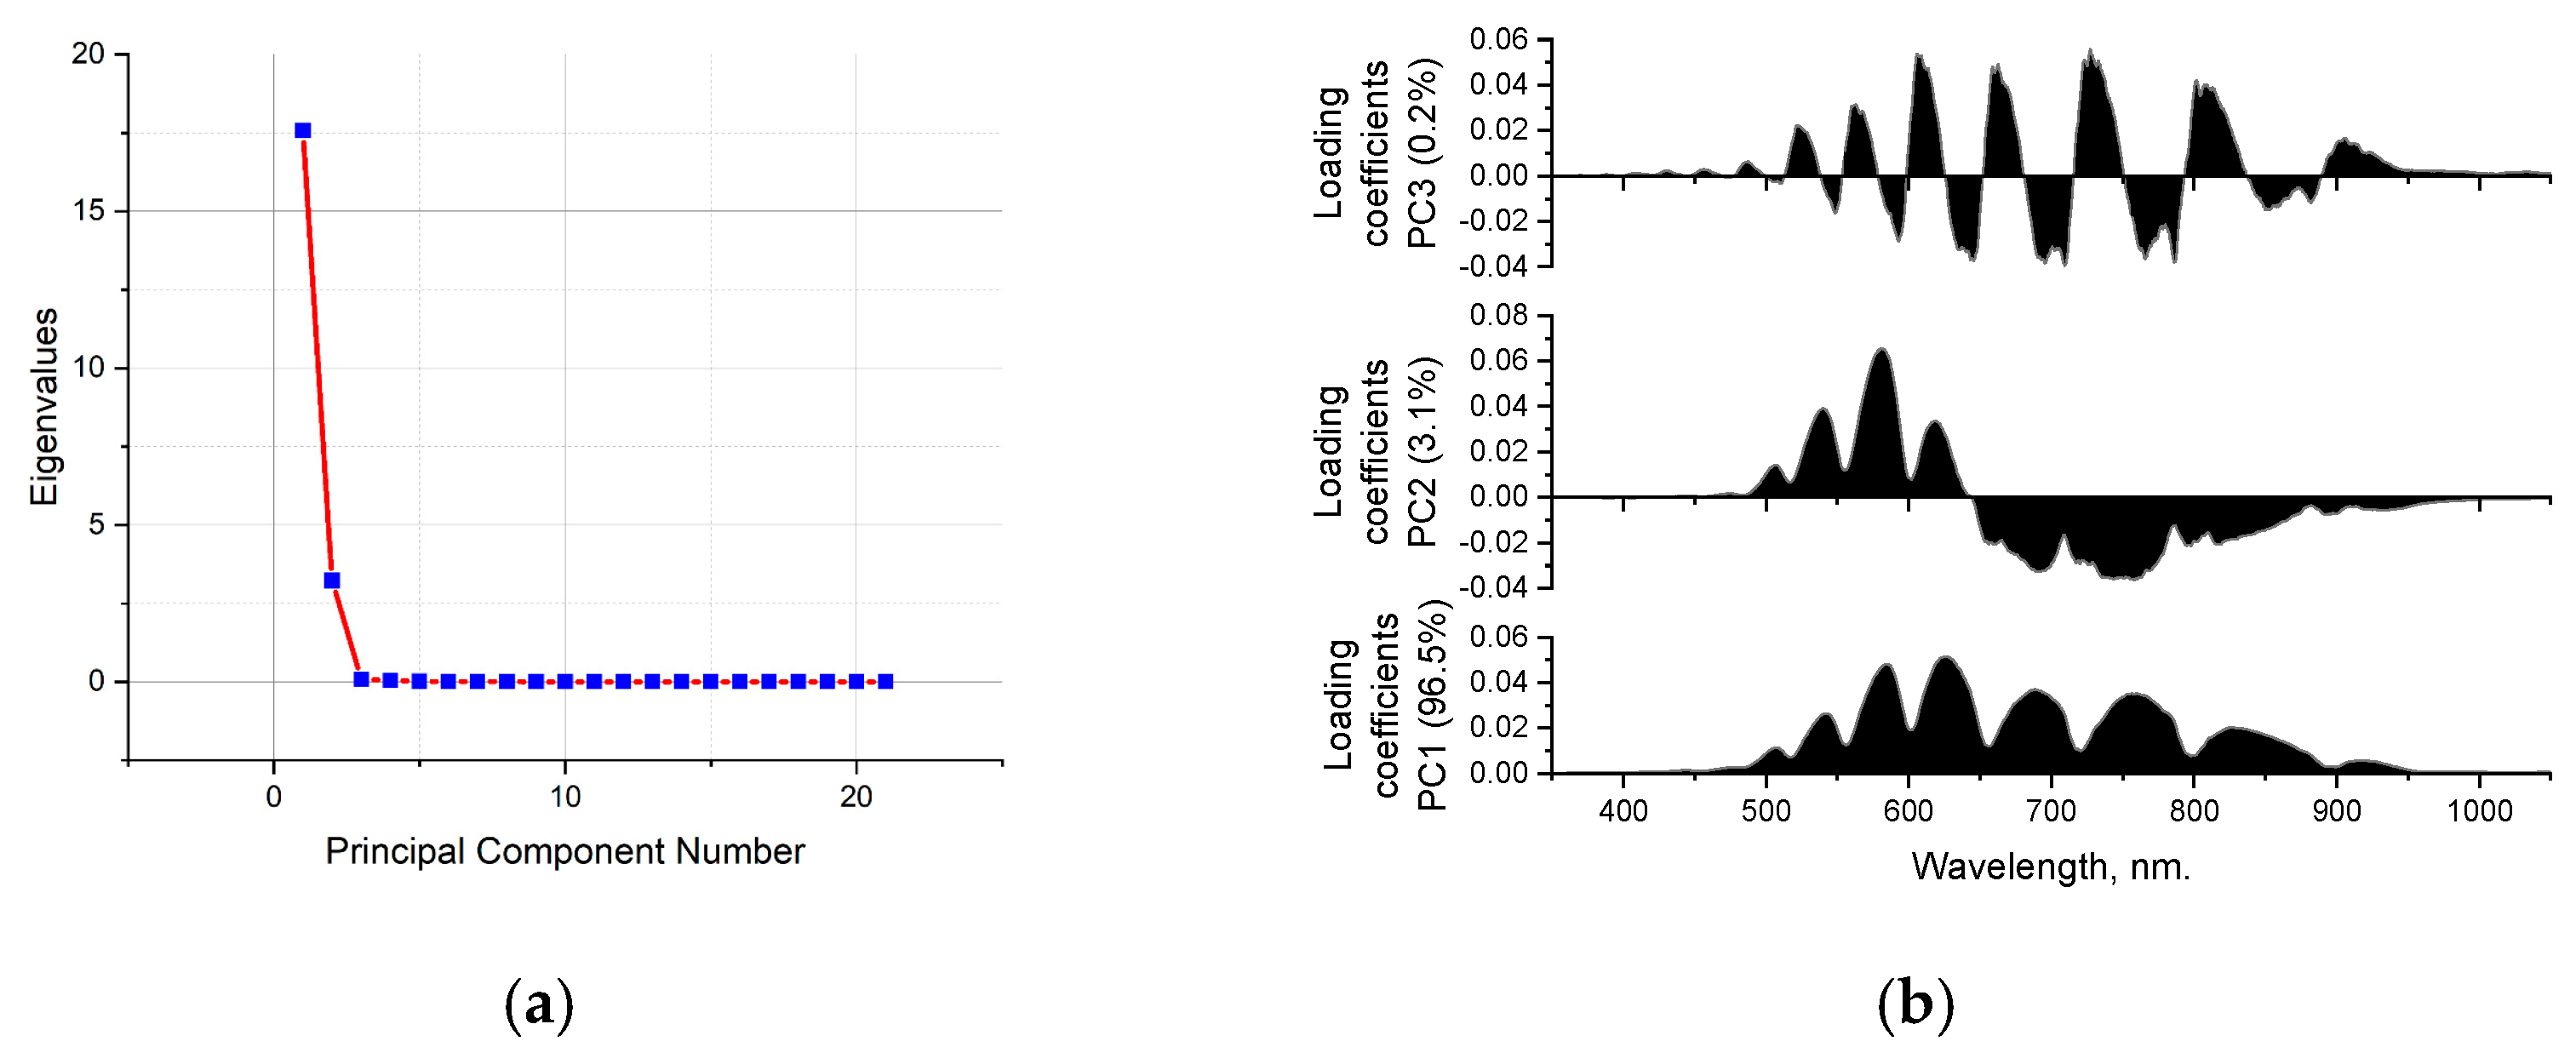
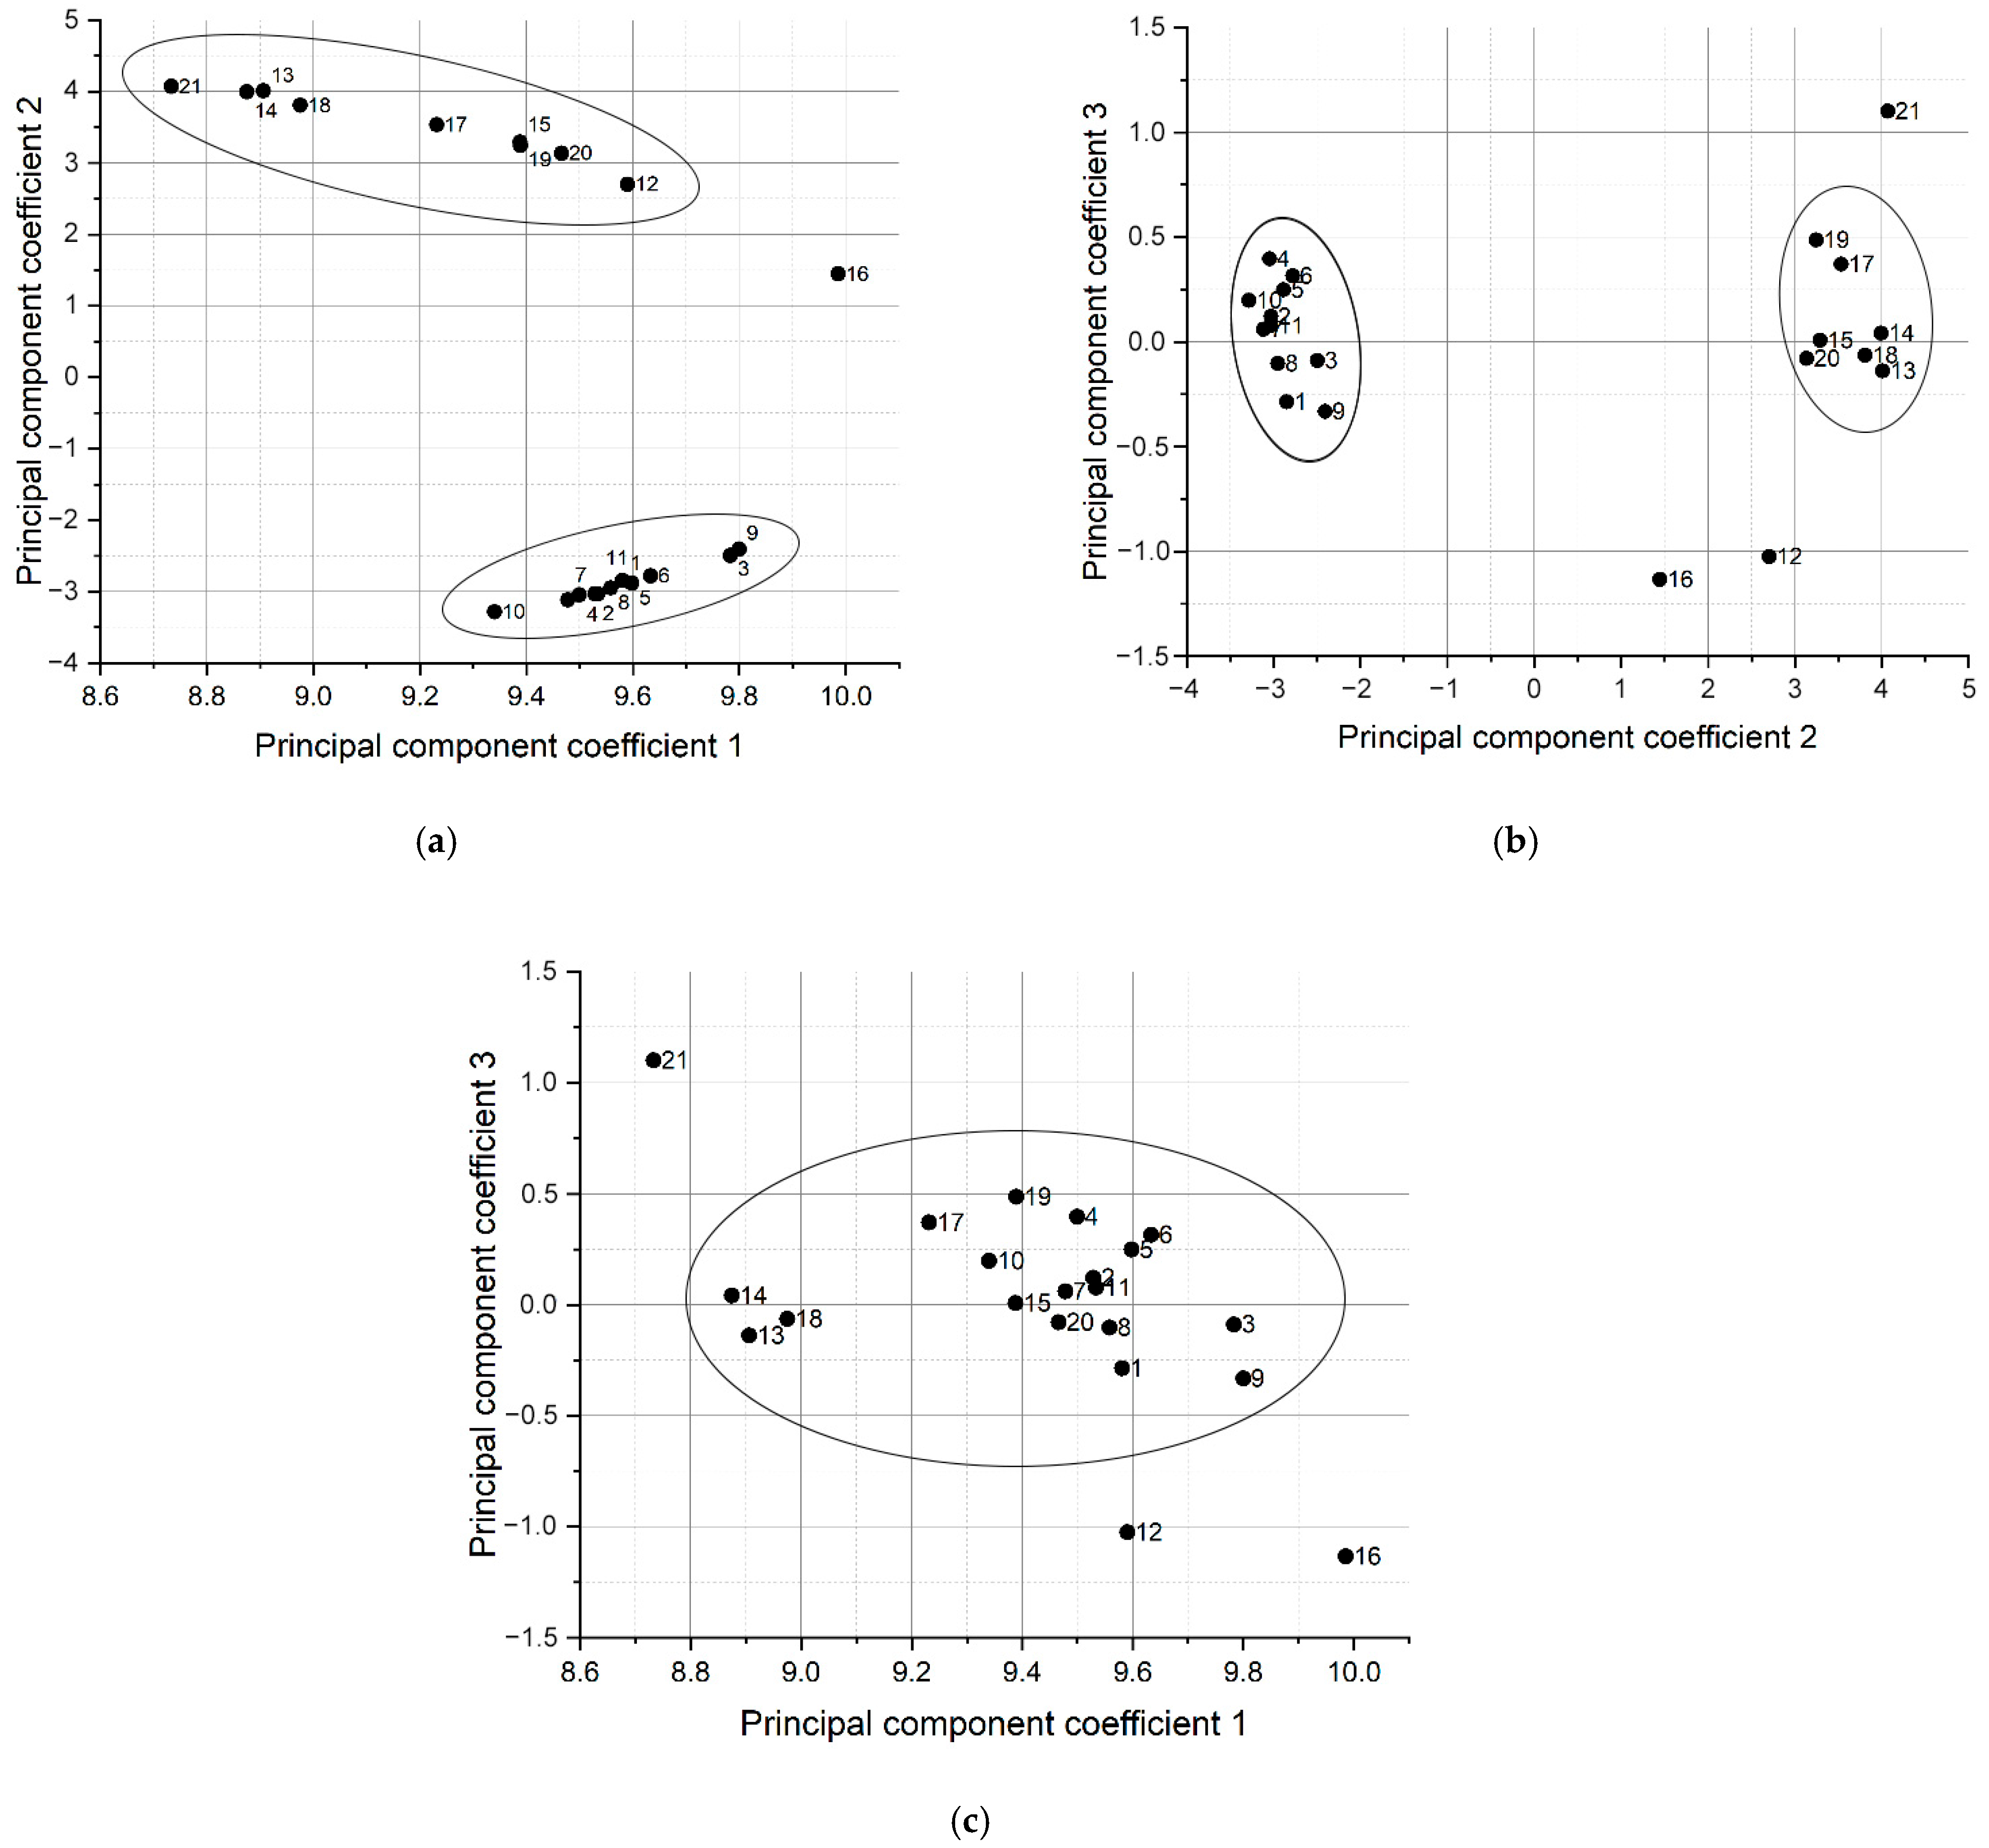
3.4. Principal Component Analysis

Principal component analysis (PCA) is one of the main methods for reducing the amount of data with minimal loss of information. The main goal of the principal component method is to replace the original data with certain aggregated values in a new space, while solving two problems, the first of which is to combine the most important (from the point of view of minimizing the mean square error) values into fewer but more informative parameters (reducing the dimension of the data space), and the second is to reduce noise in the data [46]. PCA is based on transforming the original variables into new variables called principal components. PCA allows one to transform correlated variables into a smaller number of uncorrelated variables, which explain the largest share of variance in the original data.
PCA works by identifying the direction in a multidimensional data space that has the greatest variance. This direction is called the first principal component. Then, the second direction with the greatest dispersion, but which is orthogonal to the first principal component, is found; this is the second principal component. The process continues until all the main components are identified. In our investigation, there are three main components.
To create the initial data set for applying the principal component method, we selected the region of interest in the spectrum where we intend to look for the difference in the measured blood serum samples.
Figure 7a shows that the principal component method found significant differences between the samples between the first three components (eigenvectors). To better understand the physical meaning of the principal components, an analysis of the loading coefficients of the first three components was performed (Figure 7b). The loading analysis allowed us to identify the spectral regions that had the greatest influence on the separation of blood samples into healthy control and patient groups. The first principal component (accounting for 96.5% of the total variance) was characterized by high positive loading coefficients in the spectral range of approximately 500 to 900 nm, which was likely associated with general differences in the optical density and refractive index of the analyzed samples. The second component (3.1% of the variance) showed pronounced positive loadings in the 500–650 nm range and negative loadings in the 650–1000 nm range. The third principal component explained only 0.2% of the variance and likely did not significantly contribute to sample separation. Thus, the main differences between the sample groups were determined by the first two principal components, which captured the key information about the spectral features of the blood serum.
From the fourth principal component onwards, the presence of meaningful information seems unlikely. Therefore, significant information in a spectral data matrix of dimensions 21 × 2099 can be described by a maximum of three components, where in the matrix, 21 is the number of samples, 2099 is the number of features (intensities at wavelengths). Figure 8a–c show graphs of scores in a two-dimensional space of three principal components. The ellipse (solid line) marks the boundaries of the 95% confidence interval for each cluster.
In Figure 8a,b, sample division into two clusters is observed clearly. The numbers of samples in each cluster are presented in Table 4.

4. Discussion

The development of a number of diseases, including cancer and cardiovascular disease, results in alterations to the composition of blood serum, which manifest as changes to its optical properties. The study of diluted serum and plasma samples and their models has led to the development of diagnostic methods for cancer and cardiovascular and other diseases [47,48]. The study of particle characteristics (size, molecular weight, concentration, etc.) in human biological fluids using optical methods is of great interest due to the practical significance of the results for medicine [49].
It has been demonstrated that any fluid contained within a microstructured waveguide core exerts an influence on the waveguide’s wave comb, thereby effecting a change in its configuration [11,50,51]. Due to their structure, HC-MOWs provide multiple reflections and a significant path length for the interaction of radiation with the analyte in a minimal volume, which allows for the detection of even the smallest fluctuations in the transmission spectrum of serum in response to changes in the composition of the solution components [11,12]. Experiments with whole and diluted serum have shown that serum dilution does not affect the determination of concentrations of substances in these solutions, since all parameters of particle content in serum change proportionally [49]. The employment of an incoherent radiation source facilitates the operation within a broad spectrum of wavelengths, thereby enabling the acquisition of multispectral data at each measurement [50].
Previous studies have shown that the glucose content in solutions studied using MOWs shifts the waveguide comb to the left towards shorter wavelengths, since glucose has a higher refractive index than other components [52]. The study of liquids with different refractive indices in waveguides carried out in this work shows that as the refractive index of the liquid increases, the waveguide comb shifts towards shorter wavelengths. This is also consistent with the data obtained in a study using a waveguide with a smaller hollow core diameter, but with similar waveguide properties, where the authors compared the comb spectra obtained as a result of filling the waveguides with water and ethanol at different concentrations, i.e., the principle of the comb shift is maintained as a function of the refractive index and independently of the class of dissolved substance [23]. HC-MOWs have a high limit of detection in the analysis of single-component solutions. For example, it has been shown that HC-MOWs allows for the detection of small amounts of absorbents at the level of ~10−8 mol∙L−1 [53]. The measurement of the refractive index is possible up to three decimal places, as it is limited by the resolving power of the spectrum analyzer. Thus, much is known from previous studies about the behavior patterns of solutions of different compositions when introduced into the HC-MOW structure, but human blood serum is a complex multicomponent solution, and the influence of individual components on the transmission spectrum of the waveguide can be mutually amplified/damped. Determining the sensitivity threshold of HC-MOWs in the analysis of multicomponent solutions is a difficult task and requires further research.
Blood serum contains particles of different geneses, sizes, and shapes. These are glucose, low-density lipoproteins, high-density lipoproteins, triglycerides, albumin (which varies in size because it is a carrier protein and can vary depending on the molecules attached to it), and cholesterol. Scattering particles in blood serum are divided by size into the following ranges: I—1–10 nm, corresponding to low-molecular-weight albumin monomers and free glycolipid complexes; II—11–30 nm, corresponding to globulins and lipoprotein complexes with low molecular weight; III—31–70 nm, corresponding to fibrinogen and its complexes, as well as low-molecular-weight immune complexes; IV—71–150 nm, corresponding to medium-molecular-weight immune complexes; and V—greater than 150 nm, corresponding to high-molecular-weight immune complexes formed as a result of activation of allergic or autoimmune processes [48]. The largest particles are chylomicrons (70–1000 nm), which are potentially responsible for sample turbidity and can be visually detected when the triglyceride concentration exceeds 3.4 mmol/L [54,55]. Turbidity and lipemia can be explained by the presence of lipid particles that scatter light and cause apparent absorption in a wide range of the UV/visible spectrum (from 400 nm to 800+ nm). The color of the serum is due to residual bilirubin (icterus) and hemoglobin. These components provide absorption in the range of 415–579 nm and, due to their proximity, the peaks of hemoglobin and bilirubin partially overlap. Enzymes are present in the blood in insignificant amounts compared to other components, and metal ions are too small to affect the transmission spectra in this system [50,56].
Lipemia, icterus, and hemolysis may affect the results of the analysis using the developed biosensor. Like optical methods, the active system is sensitive to the determination of the color and turbidity of the environment. Ultimately, this is the main limitation for this method of use, but proper sampling and laboratory controls can avoid these problems.
In published studies on the sensing properties of microstructured waveguides, some parameters of the transmission spectrum (e.g., the wavelength of the transmission maximum, its intensity, etc.) are often chosen as the characteristics to be studied [57]. Indeed, in this study, we have shown that, although the transmission spectra obtained with a photometric cell, as well as the refractometric data, do not differ for the patient and healthy control groups, the spectra obtained with HC-MOWs are clearly divided into these two groups according to the signal intensity. Nevertheless, we expect that, in the analysis of complex multicomponent systems, the analysis of the whole transmission spectrum over a wide range of wavelengths, using computer programs and methods that allow for the analysis of multiparametric systems, has great prospects. PCA has been successfully used as such a tool. In future studies, we plan to use supervised machine learning methods (e.g., logistic regression, support vector machines, or neural network classifiers) trained on PCA results for clinical diagnosis.
The application of the principal component method helped to divide the serum samples into patients and healthy controls, but we obtained several outliers. For example, samples 12, 16, and 21 are outside these groups. Analyzing the data obtained, it can be noted that samples 12 and 16, which fell out of the clusters when using the PCA, combined the overestimated glucose and creatinine values. The value of 122.2 µmol/L for sample 12 is an indicator at the upper limit of the norm, and 142 µmol/L for sample 16 is 18 µmol/L higher than the norm, which is a significant excess. In addition, these volunteers had an almost twofold increase in blood glucose. Sample 21 had a normal glucose level, but the creatinine level was also quite high, reaching the upper limit of the norm. Sample 21 also has a slightly elevated cholesterol level, which does not affect the position of the point on the graph, as in the case of the healthy control samples 4, 6, and 10. However, sample 21 has an excess of the value for the parameter of low-density lipoproteins; these are large molecules that have a significant effect on the spectrum, which obviously affected its loss from the general mass. Obviously, some blood parameters, such as creatinine and glucose, have a greater impact on the serum spectrum than others.
The initial selection of patients for the patient group was made from a cardiological clinic, with confirmed diagnoses and a long history of cardiovascular system abnormalities. The patients received drug therapy appropriate to their diagnosis, which significantly affected the biochemical blood parameters determined in clinical practice. It is important to note that the values for certain samples (14 and 20) are entirely consistent with normal parameters (see Table 2 and Table 3). However, these samples were still designated as patients when the spectra were analyzed. This may be indicative of the enhanced capabilities of this rapid diagnostic method in comparison to conventional biochemical testing, which does not encompass all of the blood parameters.
The PCA is a primary approach for reducing the dimensionality of data while minimizing information loss. It is widely applied across various disciplines and enables the visualization of high-dimensional data in two-dimensional or three-dimensional spaces. However, it is important to note that this method is not without disadvantages. The loss of information in the data is inevitable, and the method is limited to searching only linear dependence in the data. Additionally, there is no semantic meaning of the principal components because of the difficulty of linking them to real features. It is hypothesized that through the conduction of further research and the augmentation of the test sample, the employment of artificial intelligence and machine learning-based neural network methods will enhance the precision of classification and the processing of intricate spectral characteristics. These methods, particularly the multilayer perceptron, have already been extensively utilized in numerous research studies and have demonstrated a high degree of accuracy [58,59,60].
The present study is subject to several limitations. Firstly, the exclusion of males from the study limits the generalizability of the results. Secondly, the limited sample size precludes the execution of reliable subgroup analyses. Consequently, it is premature to discuss the accuracy and clinical significance of the study. In order to conduct a more in-depth study of serum using HC-MOWs, further research and statistical data collection are required. Nevertheless, the results of this study underscore the immense potential of this expeditious diagnostic technique.

5. Conclusions

Interesting data have been obtained on the relationship between the optical properties of a liquid medium (diluted blood serum) and the health of volunteers. It has been experimentally demonstrated that the data of transmission spectra, received in HC-MOWs, and then processed with principal component analysis, make it possible to determine deviations in the parameters of the blood serum of volunteers.
The approach used opens up the prospect of creating an easy-to-use and accurate label-free sensor for identifying abnormalities in human health that can be used in mass screening of the population for certain diseases. The method does not require special reagents, complex equipment, or highly qualified personnel. An analysis takes no more than 3 min.
The use of statistical methods to analyze transmission spectra and its training will make it possible to detect even small changes in blood parameters and compare them over time to accurately determine changes in blood composition. The collection of databases of patients and blood spectra will make it possible to track global changes in the health of the populations caused, for example, by environmental changes, or in the context of global pandemics. This approach can also be applied to global planning of healthcare and pharmaceutical company strategies.

Author Contributions

Conceptualization, J.S.S. and V.V.T.; methodology, J.S.S., S.S.K. and P.A.L.; formal analysis, J.S.S. and S.S.K.; investigation S.S.K., P.A.L., A.A.Z., A.Y.G., N.A.K. and V.P.I.; resources, J.S.S. and V.V.T.; writing—original draft preparation, S.S.K., V.V.T. and A.A.Z.; writing—review and editing, J.S.S. and V.V.T.; project administration, J.S.S. and V.V.T.; funding acquisition, J.S.S. and V.V.T. All authors have read and agreed to the published version of the manuscript.

Funding

Ministry of Science and Higher Education of the Russian Federation within the framework of a state assignment (project No. FSRR-2023-0007) (V.V.T.).

Institutional Review Board Statement

The study was conducted in accordance with the Declaration of Helsinki, and approved by the Ethics Committee of SPE LLC “Nanostructured Glass Technology” (No. 17 dated 13 November 2022).

Informed Consent Statement

Informed consent was obtained from all subjects involved in the study.

Data Availability Statement

The Data are available from the authors.

Acknowledgments

We would like to acknowledge Yuri I. Surkov and Andrey A. Shuvalov for the essential discussion of the PCA method and technical editing of the manuscript.

Conflicts of Interest

Authors Svetlana S. Konnova, Pavel A. Lepilin, Anastasia A. Zanishevskaya, Alexey Y. Gryaznov and Julia S. Skibina were employed by the company SPE LLC “Nanostructured Glass Technology” (SPE LLC “NGT”). The remaining authors declare that the research was conducted in the absence of any commercial or financial relationships that could be construed as a potential conflict of interest. The funders had no role in the design of the study; in the collection, analyses, or interpretation of the data; in the writing of the manuscript; or in the decision to publish the results.

References

  1. Kaminsky, L.A.; German, C.; Imboden, M.; Ozemek, C.; Peterman, J.E.; Brubaker, P.H. The importance of healthy lifestyle behaviors in the prevention of cardiovascular disease. Prog. Cardiovasc. Dis. 2022, 70, 8–15. [Google Scholar] [CrossRef] [PubMed]
  2. Araujo, L.F.; de Matos Soeiro, A.; Fernandes, J.L.; Pesaro, A.E.; Serrano, C.V., Jr. Coronary artery disease in women: A review on prevention, pathophysiology, diagnosis, and treatment. Vasc. Health Risk Manag. 2006, 2, 465–475. [Google Scholar] [CrossRef]
  3. Crandall, J.P.; Knowler, W.C.; Kahn, S.E.; Marrero, D.; Florez, J.C.; Bray, G.A.; Haffner, S.M.; Hoskin, M.; Nathan, D.M.; Diabetes Prevention Program Research Group. The prevention of type 2 diabetes. Nat. Clin. Pract. Endocrinol. Metab. 2008, 4, 382–393. [Google Scholar] [CrossRef]
  4. Kramer, H. Diet and Chronic Kidney Disease. Adv. Nutr. 2019, 10, S367–S379. [Google Scholar] [CrossRef] [PubMed]
  5. World Health Organization. Available online: https://www.who.int/ru (accessed on 20 February 2025).
  6. Aggarwal, R.; Ranganathan, P.; Pramesh, C.S. Research studies on screening tests. Perspect. Clin. Res. 2022, 13, 168–171. [Google Scholar] [CrossRef] [PubMed]
  7. Arunkumar, R.; Suaganya, T.; Robinson, S. Design and Analysis of 2D Photonic crystal based biosensor to detect different blood components. Photonic Sens. 2019, 9, 69–77. [Google Scholar] [CrossRef]
  8. Enejder, A.M.K.; Swartling, J.; Aruna, P.; Engels, S.A. Influence of cell shape and aggregate formation on the optical properties of flowing whole blood. Appl. Opt. 2003, 42, 1384–1394. [Google Scholar] [CrossRef]
  9. Liu, S.; Gao, W.; Li, H.; Dong, Y.; Zhang, H. Liquid-filled simplified hollow-core photonic crystal fiber. Opt. Laser Technol. 2014, 64, 140–144. [Google Scholar] [CrossRef]
  10. Hoffmann, J.J.M.L.; Urrechaga, E. Recent advances in laboratory hematology reflected by a decade of CCLM publications. Clin. Chem. Lab. Med. 2022, 61, 829–840. [Google Scholar] [CrossRef]
  11. Skibina, Y.S.; Tuchin, V.V.; Beloglazov, V.I.; Shteinmaeer, G.; Betge, I.L.; Wedell, R.; Langhoff, N. Photonic crystal fibres in biomedical investigations. Quantum Electron. 2011, 41, 284. [Google Scholar] [CrossRef]
  12. Sinibaldi, A.; Occhicone, A.; Munzert, P.; Danz, N.; Sonntag, F.; Michelotti, F. Label-Free monitoring of human IgG/Anti-IgG recognition using Bloch surface waves on 1D photonic crystals. Biosensors 2018, 8, 71. [Google Scholar] [CrossRef]
  13. Toma, A.D.; Brunetti, G.; Colapietro, P.; Ciminelli, C. High-resolved near-field sensing by means of dielectric grating with a box-bike resonance shape. IEEE Sens. J. 2024, 24, 6045–6053. [Google Scholar] [CrossRef]
  14. Lotfiani, A.; Jahromi, H.D.; Hamedi, S. Monolithic Silicon-Based Photovoltaic-Nanoplasmonic Biosensor with Enhanced Limit of Detection and Minimum Detectable Power. Light. Technol. 2022, 40, 1231–1237. [Google Scholar] [CrossRef]
  15. Khan, M.R.H.; Chowdhury, A.A.; Islam, M.R.; Hosen, M.S.; Mim, M.H.; Nishat, M.M. Wave-Shaped Microstructure Cancer Detection Sensor in Terahertz Band: Design and Analysis. Appl. Sci. 2023, 13, 5784. [Google Scholar] [CrossRef]
  16. Kumar, S.; Kaushik, B.K.; Singh, R.; Chen, N.K.; Yang, Q.S.; Zhang, X.; Wang, W.; Zhang, B. LSPR-based cholesterol biosensor using a tapered optical fiber structure. Biomed. Opt. Express 2019, 10, 2150–2160. [Google Scholar] [CrossRef] [PubMed]
  17. Zanishevskaya, A.A.; Malinin, A.V.; Skibina, Y.S.; Tuchin, V.V.; Chainikov, M.V.; Beloglazov, V.I.; Silokhin, I.Y.; Ermakova, A.M. Determination of glucose concentration in biological liquids using photonic crystal waveguides. Opt. Spectrosc. 2013, 115, 228–232. [Google Scholar] [CrossRef]
  18. Ermatov, T.; Noskov, R.E.; Machnev, A.A.; Gnusov, I.; Atkin, V.; Lazareva, E.N.; German, S.V.; Kosolobov, S.S.; Zatsepin, T.S.; Sergeeva, O.V.; et al. Multispectral sensing of biological liquids with hollow-core microstructured optical fibres. Light Sci. Appl. 2020, 9, 173. [Google Scholar] [CrossRef]
  19. Haes, A.J.; Chang, L.; Klein, W.L.; Van Duyne, R.P. Detection of a biomarker for Alzheimer’s disease from synthetic and clinical samples using a nanoscale optical biosensor. J. Am. Chem. Soc. 2005, 127, 2264–2271. [Google Scholar] [CrossRef]
  20. Kudryavtseva, O.M.; Skibina, Y.S.; Kozhevnikov, V.A.; Bugorkova, S.A.; Chainikov, M.V.; Gryaznov, A.Y.; Glukhov, D.E.; Konnova, S.S.; Shuvalov, A.A.; Shchukovskaya, T.N. Direct detection of antibodies to Yersinia pestis using glass microstructural waveguides as an express method for assessing seroconversion in individuals vaccinated against plague. Epidemiol. Vaccinal Prev. 2022, 21, 89–96. [Google Scholar] [CrossRef]
  21. Datta, S.; Christena, L.R.; Rajaram, Y.R.S. Enzyme immobilization: An overview on techniques and support materials. 3 Biotech 2012, 3, 1–9. [Google Scholar] [CrossRef]
  22. Gharib, G.; Bütün, İ.; Muganlı, Z.; Kozalak, G.; Namlı, İ.; Sarraf, S.S.; Ahmadi, V.E.; Toyran, E.; van Wijnen, A.J.; Koşar, A. Biomedical Applications of Microfluidic Devices: A Review. Biosensors 2022, 12, 1023. [Google Scholar] [CrossRef] [PubMed]
  23. Bzheumikhov, K.A.; Gurtueva, I.A.; Margushev, Z.C.; Savoysky, Y.V. Features of the spectral properties of photonic crystal fibers with a hollow core filled with liquid. News Kabard.-Balkar. Sci. Cent. Russ. Acad. Sci. 2012, 3, 26–29. [Google Scholar]
  24. Pissadakis, S. Lab-in-a-fiber sensors: A review. Microelectronics 2019, 217, 111105. [Google Scholar] [CrossRef]
  25. Cheng, T.; Sakai, Y.; Suzuki, T.; Ohishi, Y. Fabrication and characterization of an all-solid tellurite–phosphate photonic bandgap fiber. Opt. Lett. 2015, 40, 2088–2090. [Google Scholar] [CrossRef] [PubMed]
  26. Chillcce, E.F.; Cordeiro, C.M.D.B.; Barbosa, L.C.; Cruz, C.B. Tellurite photonic crystal fiber made by a stack-and-draw technique. J. Non-Cryst. Solids 2006, 352, 3423–3428. [Google Scholar] [CrossRef]
  27. Ravi Kanth Kumar, V.V.; George, A.K.; Reeves, W.H.; Knight, J.C.; Russell, P.S.J.; Omenetto, F.G.; Taylor, A.J. Extruded soft glass photonic crystal fiber for ultrabroad supercontinuum generation. Opt. Express 2002, 10, 1520–1525. [Google Scholar] [CrossRef]
  28. Yajima, T.; Yamamoto, J.; Ishii, F.; Hirooka, T.; Yoshida, M.; Nakazawa, M. Low-loss photonic crystal fiber fabricated by a slurry casting method. Opt. Express 2013, 21, 30500–30506. [Google Scholar] [CrossRef]
  29. El Hamzaoui, H.; Bigot, L.; Bouwmans, G.; Razdobreev, I.; Bouazaoui, M.; Capoen, B. From molecular precursors in solution to microstructured optical fiber: A Sol-gel polymeric route. Opt. Mater. Express 2011, 1, 234–242. [Google Scholar] [CrossRef]
  30. Schuster, K.; Unger, S.; Aichele, C.; Lindner, F.; Grimm, S.; Litzkendorf, D.; Kobelke, J.; Bierlich, J.; Wondraczek, K.; Bartelt, H. Material and technology trends in fiber optics. Adv. Opt. Technol. 2014, 3, 447–468. [Google Scholar] [CrossRef]
  31. Chen, Y.; Liu, J.; Yang, Z.; Wilkinson, J.S.; Zhou, X. Optical biosensors based on refractometric sensing schemes: A review. Biosens. Bioelectron. 2019, 144, 111693. [Google Scholar] [CrossRef]
  32. Alam, M.K.; Vadivel, K.; Natesan, A.; Sghaireen, M.G.; Ganji, K.K.; Srivastava, K.C.; Nashwan, S.; Khader, Y. Design of highly sensitive biosensors using hollow-core microstructured fibers for plasma sensing in aids with human metabolism. Opt. Quantum Electron. 2023, 55, 188. [Google Scholar] [CrossRef] [PubMed]
  33. Schreiber, J.B. Issues and recommendations for exploratory factor analysis and principal component analysis. Res. Soc. Adm. Pharm. 2021, 17, 1004–1011. [Google Scholar] [CrossRef] [PubMed]
  34. Ritov, Y.; Gilula, Z. Analysis of contingency tables by correspondence models subject to order constraints. Am. Stat. Assoc. 1993, 88, 1380–1387. [Google Scholar] [CrossRef]
  35. Du, L.; Liu, K.; Yao, X.; Risacher, S.L.; Han, J.; Saykin, A.J.; Guo, L.; Shen, L. Multi—Task sparse canonical correlation analysis with application to multi-modal brain imaging genetics. Trans. Comput. Biol. Bioinform. 2021, 18, 227–239. [Google Scholar] [CrossRef]
  36. Leistritz, L.; Weiss, T.; Bär, K.J.; De Vico Fallani, F.; Babiloni, F.; Witte, H.; Lehmann, T. Network redundancy analysis of effective brain networks: A comparison of healthy controls and patients with major depression. PLoS ONE 2013, 8, e60956. [Google Scholar] [CrossRef]
  37. Ashenova, A.; Daniyarov, A.; Molkenov, A.; Sharip, A.; Zinovyev, A.; Kairov, U. Meta-analysis of esophageal cancer transcriptomes using independent component analysis. Front. Genet. 2021, 12, 683632. [Google Scholar] [CrossRef] [PubMed]
  38. David, C.C.; Jacobs, D.J. Principal component analysis: A method for determining the essential dynamics of proteins. Methods Mol. Biol. 2014, 1084, 193–226. [Google Scholar] [CrossRef]
  39. Wang, C.; Chen, Q.; Hussain, M.; Wu, S.; Chen, J.; Tang, Z. Application of principal component analysis to classify textile fibers based on UV-vis diffuse reflectance spectroscopy. Zhurnal Prikl. Spektrosk. 2017, 84, 368–372. [Google Scholar] [CrossRef]
  40. Cao, Y.; Chen, J.; Zhang, G.; Fan, S.; Ge, W.; Hu, W.; Huang, P.; Hou, D.; Zheng, S. Characterization and discrimination of human colorectal cancer cells using terahertz spectroscopy. Spectrochim. Acta Part A Mol. Biomol. Spectrosc. 2021, 256, 119713. [Google Scholar] [CrossRef]
  41. Basova, E.M.; Litvinenko, Y.N.; Polotnyanko, N.A. Identification of drug manufacturers using IR spectroscopy and the principal component method. J. Bull. Int. Univ. Nat. 2021, 2, 7–15. [Google Scholar]
  42. MU4.2.2039-05 “Technique of Collecting and Transporting Biomaterials Tomicrobiological Laboratories”. Available online: https://www.rospotrebnadzor.ru/bitrix/redirect.php?event1=file&event2=download&event3=mu-4.2.2039_05.doc&goto=/upload/iblock/df9/mu-4.2.2039_05.doc (accessed on 20 February 2025).
  43. State System of Sanitary-Epidemiological Regulation of the Russian Federation. Federal Sanitary Rules, Norms and Hygienic Standards, SanPiN 2.1.7.2790-10. Sanitary and Epide-Miological Requirements for the Management of Medical Waste. Available online: https://docs.cntd.ru/document/902251609 (accessed on 20 February 2025).
  44. Zheltikov, A.M. Colors of thin films, antiresonant phenomena in optical systems, and the limiting loss of modes in hollow optical waveguides. Phys.-Uspekhi 2008, 51, 591–600. [Google Scholar] [CrossRef]
  45. Dhanabalan, S.S.; Sriram, S.; Walia, S.; Raja Avaninathan, S.; Flores Carrasco, M.; Bhaskaran, M. Wearable Label–Free Optical Biodetectors: Progress and Perspectives. Adv. Photonics Res. 2020, 2, 2000076. [Google Scholar] [CrossRef]
  46. Esbensen, K. Analysis of Multidimensional Data; Selected Chapters; Publishing House IPCP RAS: Chernogolovka, Russia, 2005; pp. 160–170. [Google Scholar]
  47. Alekseev, S.G.; Ivanov, A.V.; Sviridov, S.V.; Petrova, G.P.; Petrusevic, M.; Boiko, A.V.; Ten, D.I. Multiparametrical Testing of Blood Proteins Solutions with Diagnostic Purpose. Proc. SPIE 2005, 5973, 597301. [Google Scholar]
  48. Chaikov, L.L. Dynamics of statistically confident particle sizes and concentrations in blood plasma obtained by the dynamic light scattering method. J. Biomed. Opt. 2015, 20, 57003. [Google Scholar] [CrossRef] [PubMed]
  49. Kirichenko, M.N.; Chaikov, L.L.; Kazaryan, M.A.; Bulychev, N.A. Application of light scattering methods in biomedicine and ecology. Int. Sci. J. Altern. Energy Ecol. 2019, 80–103. [Google Scholar] [CrossRef]
  50. Márquez-Islas, R.; Pérez-Pacheco, A.; Quispe-Siccha, R.; Salazar-Nieva, L.B.; García-Valenzuela, A. Visual assessment of blood plasma versus optical transmittance and refractive index measurements for quantifying lipemia. Diagnostics 2022, 12, 510. [Google Scholar] [CrossRef]
  51. Khozeymeh, F.; Melli, F.; Capodaglio, S.; Corradini, R.; Benabid, F.; Vincetti, L.; Cucinotta, A. Hollow-core fiber-based biosensor: A platform for lab-in-fiber optical biosensors for DNA detection. Sensors 2022, 22, 5144. [Google Scholar] [CrossRef]
  52. Zanishevskaya, A.A.; Malinin, A.V.; Skibina, Y.S.; Tuchin, V.V.; Chaynikov, M.V.; Beloglazov, V.I.; Silokhin, I.Y.; Ermakova, A.M. Determination of glucose concentration in biological fluids using photonic crystal waveguides. Opt. Spectrosc. 2013, 115, 266–271. [Google Scholar] [CrossRef]
  53. Skibina, J.S.; Malinin, A.V.; Zanishevskaya, A.A.; Tuchin, V.V. Photonic Crystal Waveguide Sensing. In Portable Biosensing of Food Toxicants and Environmental Pollutants, 1st ed.; Nikolelis, D.P., Varzakas, T., Erdem, A., Nikoleli, G.-P., Eds.; CRC Press: Boca Raton, FL, USA, 2013; pp. 1–32. [Google Scholar]
  54. Nikolac, N. Lipemia: Causes, Interference Mechanisms, Detection and Management. Biochem. Medica 2014, 24, 57–67. [Google Scholar] [CrossRef]
  55. Febryani, N.; Amalia, I.N.; Anggraeni, I.D.; Nugraha, G. Study of hemoglobin levels on hemolysis sample. Indones. J. Med. Lab. Sci. Technol. 2019, 1, 74–79. [Google Scholar] [CrossRef]
  56. Huynh, T.; Lai, M.J.; Liu, Y.L. Spectral Analysis Methods Based on Background Subtraction and Curvature calculation used in the detection or quantification of hemolysis and icterus in Blood-derived clinical samples. Cureus 2017, 9, 1965. [Google Scholar] [CrossRef] [PubMed]
  57. Ayyanar, N.; Zanishevskaya, A.A.; Lepilin, P.A.; Shuvalov, A.A.; Skibina, J.S. Protein Detection Using Hollow Core Microstructured Optical Fiber. IEEE Sens. J. 2024, 20, 32172–32178. [Google Scholar] [CrossRef]
  58. Hamedi, S.; Jahromi, H.D.; Lotfiani, A. Artificial intelligence-aided nanoplasmonic iosensor modeling. Eng. Appl. Artif. Intell. 2023, 118, 105646. [Google Scholar] [CrossRef]
  59. Hamedi, S.; Jahromi, H.D. Performance analysis of all-optical logical gate using artificial neural network. Expert Syst. Appl. 2021, 178, 115029. [Google Scholar] [CrossRef]
  60. Jahromi, H.D.; Hamedi, S. Artificial intelligence approach for calculating electronic and optical properties of nanocomposites. Mater. Res. Bull. 2021, 141, 111371. [Google Scholar] [CrossRef]
Figure 1. Cross-sectional photo of a one-row chirped HC-MOW.
Photonics 12 00399 g001
Figure 2. Scheme of the experimental setup for studying the transmission spectra of blood serum: 1—lamp; 2, 3/5, 6—collimator and micro-objective on adjusting platforms, 4—HC-MOW integrated into the cuvette; 7—spectrum analyzer; 8—personal computer for data processing.
Photonics 12 00399 g002
Figure 3. Transmission spectrum of the empty HC-MOW (RI 1,000,293) (a), the HC-MOW filled with water (RI 1333) (b), the HC-MOW filled with saline (RI 13,345) (c), and the HC-MOW filled with serum 14 (RI 13,349) (d).
Photonics 12 00399 g003
Figure 4. Comparing averaged data of blood serum spectrum of the healthy controls and patients in HC-MOW and photometry in cuvette.
Photonics 12 00399 g004
Figure 5. The position of the transmission maximum and corresponding refractive index. —Refractive index for healthy control volunteers. ◼—Transmission maximum for healthy control volunteers. —Refractive index for patient volunteers. ▲—Transmission maximum for patient volunteers.
Photonics 12 00399 g005
Figure 6. Intensity of four maxima in the transmission spectra of waveguides filled with the diluted blood serum.
Photonics 12 00399 g006
Figure 7. Explained variance of the data matrix from the number of principal components for blood serum samples (a) and loading coefficients of the first three principal components, indicating the contribution of each wavelength to the respective component (b). The percentage of explained variance for each component is shown in parentheses.
Photonics 12 00399 g007
Figure 8. Graph of counts of blood serum samples in the space of the first and second principal components (a), space of the second and third principal components (b), and space of the first and third principal components (c).
Photonics 12 00399 g008
Table 1. Comparison of calculated and experimentally obtained maxima and minima of empty HC-MOWs.
λmax, nm
Calculated
λmin, nm
Calculated
λmax, nm
Experimental
λmin, nm
Experimental
SD
λmax
SD
λmin
8658378618342.081.53
8117868097841.041.4
7637417627390.761.22
7217017216991.731.1
6836656836650.751.15
6486336486310.641.13
6186036186010.61.08
5895765905751.260.7
5645525645521.00.75
5405295415310.51.15
Table 2. The set of biochemical parameters of blood serum of all volunteers without deviations from norm.
Serum No.High-Density Lipoproteins,
mmol/L
Triglycerides, mmol/LAlbumin,
g/L
Magnesium, mmol/LIron,
µmol/L
11.01 ± 0.091.20 ± 0.0744.01 ± 0.840.8 ± 0.0420.9 ± 1.15
21.35 ± 0.10.96 ± 0.0349.22 ± 0.760.79 ± 0.0316.1 ± 1.01
31.78 ± 0.121.93 ± 0.0843.36 ± 0.890.79 ± 0.0515.2 ± 0.9
41.54 ± 0.081.32 ± 0.0442.02 ± 0.90.79 ± 0.0515.8 ± 1.19
52.03 ± 0.072.01 ± 0.151.30 ± 0.630.77 ± 0.0317.4 ± 1.16
61.85 ± 0.031.37 ± 0.0241.26 ± 0.590.79 ± 0.0419.1 ± 1.50
72.05 ± 0.091.52 ± 0.153.03 ± 0.690.77 ± 0.0214.7 ± 1.02
81.12 ± 0.101.43 ± 0.0741.02 ± 0.740.78 ± 0.0115.2 ± 1.30
92.07 ± 0.080.96 ± 0.0350.56 ± 0.890.81 ± 0.0615.6 ± 0.56
101.07 ± 0.041.15 ± 0.0446.23 ± 0.60.78 ± 0.0220.7 ± 0.63
111.59 ± 0.051.54 ± 0.0545.36 ± 0.550.79 ± 0.0318.6 ± 0.89
121.11 ± 0.031.98 ± 0.0343.95 ± 0.450.90 ± 0.038.91 ± 1.16
132.03 ± 0.120.71 ± 0.0142.96 ± 0.980.84 ± 0.0610.1 ± 1.03
141.28 ± 0.091.23 ± 0.0240.46 ± 0.660.86 ± 0.0811.7 ± 0.64
151.09 ± 0.022.17 ± 0.0940.71 ± 0.0761.00 ± 0.0213.6 ± 0.75
161.18 ± 0.031.73 ± 0.0342.69 ± 0.580.83 ± 0.095.74 ± 0.56
171.12 ± 0.020.64 ± 0.0450.36 ± 0.350.98 ± 0.035.71 ± 0.43
181.52 ± 0.051.27 ± 0.0248.21 ± 0.450.84 ± 0.0415.21 ± 0.95
191.53 ± 0.020.71 ± 0.0346.62 ± 0.630.85 ± 0.0317.19 ± 1.23
202.01 ± 0.150.58 ± 0.0542.43 ± 0.790.84 ± 0.0212.21 ± 1.34
211.11 ± 0.030.99 ± 0.0446.35 ± 0.580.83 ± 0.0117.22 ± 1.57
Norm values0.9–2.101–2.332–460.66–1.079.0–30.4
Table 3. The set of biochemical parameters of blood serum of all volunteers with deviations for 11 volunteers.
Serum No.Glucose
mmol/L
Cholesterol
mmol/L
Low-Density Lipoproteins
mmol/L
Creatinine
µmol/L
Alaninetransferase
units/L
Aspartate
Transferase
units/L
Creatine Kinase
units/L
12.81 ± 0.194.74 ± 0.180.91 ± 0.0957.30 ± 0.9618.02 ± 0.7320.31 ± 1.2433.36 ± 1.98
23.63 ± 0.205.00 ± 0.201.37 ± 0.1268.20 ± 0.8810.31 ± 0.5612.54 ± 0.9153.72 ± 2.35
32.82 ± 0.174.16 ± 0.151.92 ± 0.13112.32 ± 1.2335.26 ± 1.2130.43 ± 1.2563.39 ± 2.14
43.43 ± 0.255.88 ± 0.191.78 ± 0.1878.82 ± 0.9232.49 ± 1.4631.54 ± 2.1367.52 ± 3.25
53.62 ± 0.184.57 ± 0.172.79 ± 0.2189.02 ± 0.1229.13 ± 1.2525.82 ± 2.26106.36 ± 3.71
63.16 ± 0.175.63 ± 0.162.63 ± 0.2395.52 ± 0.4515.42 ± 1.4917.29 ± 1.12152.24 ± 2.23
72.94 ± 0.194.94 ± 0.152.01 ± 0.19117.43 ± 1.2623.28 ± 1.7323.53 ± 1.9337.21 ± 0.24
82.99 ± 0.214.71 ± 0.181.99 ± 0.2047.57 ± 1.5837.32 ± 4.7939.62 ± 1.5263.82 ± 1.24
93.23 ± 0.224.82 ± 0.191.34 ± 0.1255.73 ± 1.5223.41 ± 1.2221.74 ± 1.4176.28 ± 1.29
102.61 ± 0.245.58 ± 0.201.78 ± 0.16115.02 ± 2.3139.62 ± 1.5835.28 ± 1.2354.34 ± 1.42
112.82 ± 0.154.14 ± 0.163.25 ± 0.1844.89 ± 1.2530.28 ± 1.4832.17 ± 1.5278.15 ± 2.29
1210.91 ± 0.434.12 ± 0.152.84 ± 0.16122.2 ± 1.2118.53 ± 1.3418.38 ± 1.13100.43 ± 2.41
134.93 ± 0.324.00 ± 0.341.56 ± 0.1576.72 ± 0.8846.15 ± 2.4651.29 ± 2.4195.34 ± 1.69
143.75 ± 0.194.78 ± 0.282.59 ± 0.17112.13 ± 0.9623.43 ± 1.4835.45 ± 2.1984.51 ± 1.98
156.83 ± 0.214.61 ± 0.252.86 ± 0.1894.92 ± 0.8739.93 ± 1.2636.97 ± 1.49300.01 ± 2.75
1612.51 ± 0.353.82 ± 0.231.80 ± 0.9142.21 ± 0.6518.74 ± 1.4215.68 ± 0.81125.23 ± 2.15
175.53 ± 0.195.65 ± 0.233.45 ± 0.2390.24 ± 1.5619.19 ± 1.5220.62 ± 0.9677.26 ± 1.72
186.42 ± 0.236.04 ± 0.313.97 ± 0.25113.41 ± 2.3145.26 ± 2.4675.35 ± 2.65254.19 ± 2.47
194.55 ± 0.165.53 ± 0.223.65 ± 0.3186.32 ± 1.1317.52 ± 1.3411.92 ± 0.4989.45 ± 2.56
205.57 ± 0.244.94 ± 0.282.68 ± 0.3297.49 ± 1.5421.39 ± 1.5716.42 ± 0.95136.26 ± 3.12
215.82 ± 0.325.99 ± 0.243.94 ± 0.36112.25 ± 2.2120.19 ± 1.9623.35 ± 2.15160.17 ± 2.49
Norm values3.9–6.13.3–5.0<3.544–1245–405–4026–174
Table 4. Separation of samples into clusters after using the PCA method.
Cluster #Sample #
11, 2, 3, 4, 5, 6, 7, 8, 9, 10, 11
213, 14, 15, 17, 18, 19, 20
Dropped samples12, 16, 21
Disclaimer/Publisher’s Note: The statements, opinions and data contained in all publications are solely those of the individual author(s) and contributor(s) and not of MDPI and/or the editor(s). MDPI and/or the editor(s) disclaim responsibility for any injury to people or property resulting from any ideas, methods, instructions or products referred to in the content.

