Article

Effect of Lower-Level Relaxation on the Pulse Generation Performance of Q-Switched Nd:YAG Laser

School of Optoelectronic Engineering, Xidian University, Xi’an 710071, China
*
Author to whom correspondence should be addressed.
Photonics 2025, 12(5), 408; https://doi.org/10.3390/photonics12050408
Submission received: 15 March 2025 / Revised: 13 April 2025 / Accepted: 21 April 2025 / Published: 24 April 2025
(This article belongs to the Special Issue Photodetectors for Next-Generation Imaging and Sensing Systems)

Abstract

:
When analyzing and designing Q-switched Nd:YAG lasers, the impact of lower-energy-level relaxation on the pulse waveform is often ignored. This approximation typically does not result in significant deviations when the laser pulse duration is much longer than the relaxation time of the lower energy level. However, when the pulse duration approaches the nanosecond range, the spontaneous emission time of lower energy level in the Nd:YAG crystal, which is approximately 30 ns, can severely affect the pulse waveform. In this study, a theoretical model is proposed to investigate the influence of lower-energy-level relaxation on the output pulse waveform of an Nd:YAG laser. Specifically, the output waveform of a narrow-pulse-width Q-switched Nd:YAG laser is simulated. The results indicate that for narrow-pulse-width laser output, lower-energy-level relaxation causes a secondary peak to appear after the main peak of the Q-switched pulse. The energy of this secondary peak is more than two times higher than that of the main peak. An experimental system for acousto-optic Q-switched Nd:YAG lasers has also been established, and the Q-switched pulse waveforms are measured under conditions similar to those in the simulations. The tail peak phenomenon observed in the experiments is consistent with the simulation results, verifying the accuracy of the theoretical model. These findings provide a crucial theoretical foundation for understanding and optimizing Nd:YAG lasers and have significant implications for the development of similar technologies. In laser technology, particularly for applications requiring high precision and performance, considering such factors is essential for optimizing the design and functionality of laser systems.

1. Introduction

Narrow-pulse, high-peak-power, Q-switched Nd:YAG lasers play a vital role in long-distance target detection, with the laser pulse waveform being a crucial factor affecting detection performance. Therefore, exploring the characteristics of the Q-switched Nd:YAG laser pulse waveform is of great value for enhancing detection accuracy [1,2,3,4,5,6,7,8,9,10,11,12].
In Q-switched lasers, multiple peaks, often referred to as sub-pulses, are frequently observed within the Q-switching pulse. These sub-pulses, in addition to the main Q-switched pulse, can arise during the Q-switching process. The presence of sub-pulses tends to degrade the performance of the Q-switching mechanism and limits the maximum achievable pulse energy and peak power of the Q-switched laser. This phenomenon is commonly observed in actively Q-switched lasers and is attributed to the relatively slow switching speed of the active Q-switch [13]. Additionally, Bartschke et al. reported a phenomenon of doublet pulses generated in a diode-pumped passively Q-switched and self-frequency-doubled Nd:YAG laser [14]. They attributed this to the coexistence of two longitudinal modes within the laser. S. P. Ng et al. studied the sub-pulse phenomenon in a diode-pumped passively Q-switched Nd:GdVO4 laser with a Cr4+:YAG saturable absorber, suggesting that the sub-pulse generation is primarily due to the limited lifetime of the lower laser level within the laser [15].
According to available data, the lifetime of the lower energy level in the Nd:YAG laser crystal is approximately 30 ns [16]. Due to the large energy difference between the lower laser level and the ground state, in the theoretical analysis of Q-switched lasers with pulse widths greater than 100 ns, the population of the lower energy level is often considered negligible. Consequently, the influence of the relaxation process caused by the lower-level lifetime on the laser waveform has long been ignored in the study of Q-switched Nd:YAG lasers. However, when the pulse width is compressed to within tens of nanoseconds, the pulse width and the lower-level lifetime become of similar magnitude. This causes a large number of lower-level particles to remain at the lower level during the pulse formation process, unable to transition to the ground state in time. This affects the density of the actually effective inverted population, thereby modulating the pulse formation process and causing pulse waveform distortion.
In this study, by simulating the waveforms of narrow-pulse, high-peak-power, solid-state lasers, it is demonstrated that pulse waveforms considering lower-level relaxation are significantly different from those that do not. Under the same parameters, the theoretically calculated peak value of the pulse considering lower-level particle relaxation is approximately 50% smaller than that in the case where lower-level relaxation is ignored, and the pulse width also broadens. Additionally, a sub-pulse with a smaller peak value and larger pulse width appears after the main pulse. The experimental results under comparable conditions reveal a similar sub-pulse phenomenon in the pulse waveform, verifying the accuracy of the theoretical model.
The findings of this study are of immense significance for accurately measuring the peak power of a Q-switched Nd:YAG laser. The common approach for determining the peak power of an acousto-optic Q-switched Nd:YAG laser involves first measuring the pulse energy and pulse duration of the Q-switched pulse. The peak power is then calculated by dividing the single-pulse energy by the pulse width. The method assumes that there is only one pulse per Q-switching cycle; however, it leads to significant errors when pronounced sub-pulses are present. Numerical calculations indicate that in the narrow pulses of Q-switched Nd:YAG lasers, if the impact of lower-level relaxation is considered, the energy of sub-pulses can exceed one-third of the main pulse energy, a finding that has been confirmed through experimental testing. Based on these observations, this study establishes a theoretical analysis model for the output performance of Q-switched Nd:YAG lasers, taking into account the influence of lower-level relaxation. Specifically, the impact of lower-level relaxation on the pulse waveform is examined through both numerical simulations and experimental tests.

2. Theoretical Principles

2.1. Theoretical Analysis and Simulation Model Design

(1).
Theoretical Model
The rate equations for a four-level Nd:YAG laser, considering the relaxation time of the lower level, are as follows [17]:
d ϕ d t = ( n 2 n 1 ) σ ϕ c ϕ τ c
d n 2 d t = w p n 0 ( n 2 n 1 ) σ ϕ c n 2 τ 21
d n 1 d t = ( n 2 n 1 ) σ ϕ c + n 2 τ 21 n 1 τ 1
where ϕ   represents the number of photons inside the resonator, n 2     is the population per unit volume of the     E 2 energy level (upper energy level), and n 1 is the population per unit volume of the E 1 energy level (lower energy level). n 0 is the population per unit volume of the ground state, σ   is the stimulated emission cross-section, c is the speed of light in the laser medium, τ c is the equivalent photon lifetime caused by intracavity losses (including output mirror losses), and w p is the pump rate of the pump source. τ 21 and τ 1 are the spontaneous emission lifetimes of the upper- and lower-level particles, respectively.
When applying the rate equations to actively Q-switched pulsed lasers, it is essential to account for the initial distribution of upper-level particle populations accumulated under low-Q conditions. The calculation of this distribution will be detailed in subsequent sections. Additionally, during the Q-switching cycle, after the active Q-switch is turned on, the pulse duration is extremely short. The reduction in the upper-level population caused by spontaneous emission during this period is generally negligible. Consequently, the n2/ τ 21 term in Equations (2) and (3) can be omitted in simulations.
In the Nd:YAG four-level system, τ 1 is approximately 30 ns, while τ 21 is nearly 230 μs, which is about 7667 times higher. For lasers with large pulse widths, the population density of lower level can drop to very low levels within tens of nanoseconds, which has a minor effect on the population difference, n 2 n 1 , and the achievement of population inversion, thereby negligibly impacting the pulse formation process. However, for narrow-pulse-width lasers (within tens of nanoseconds), a significant number of particles remain in the lower level during the pulse formation period. As a result, the actual number of inversion particles contributing to the gain is significantly lower than the number of upper-level particles.
(2).
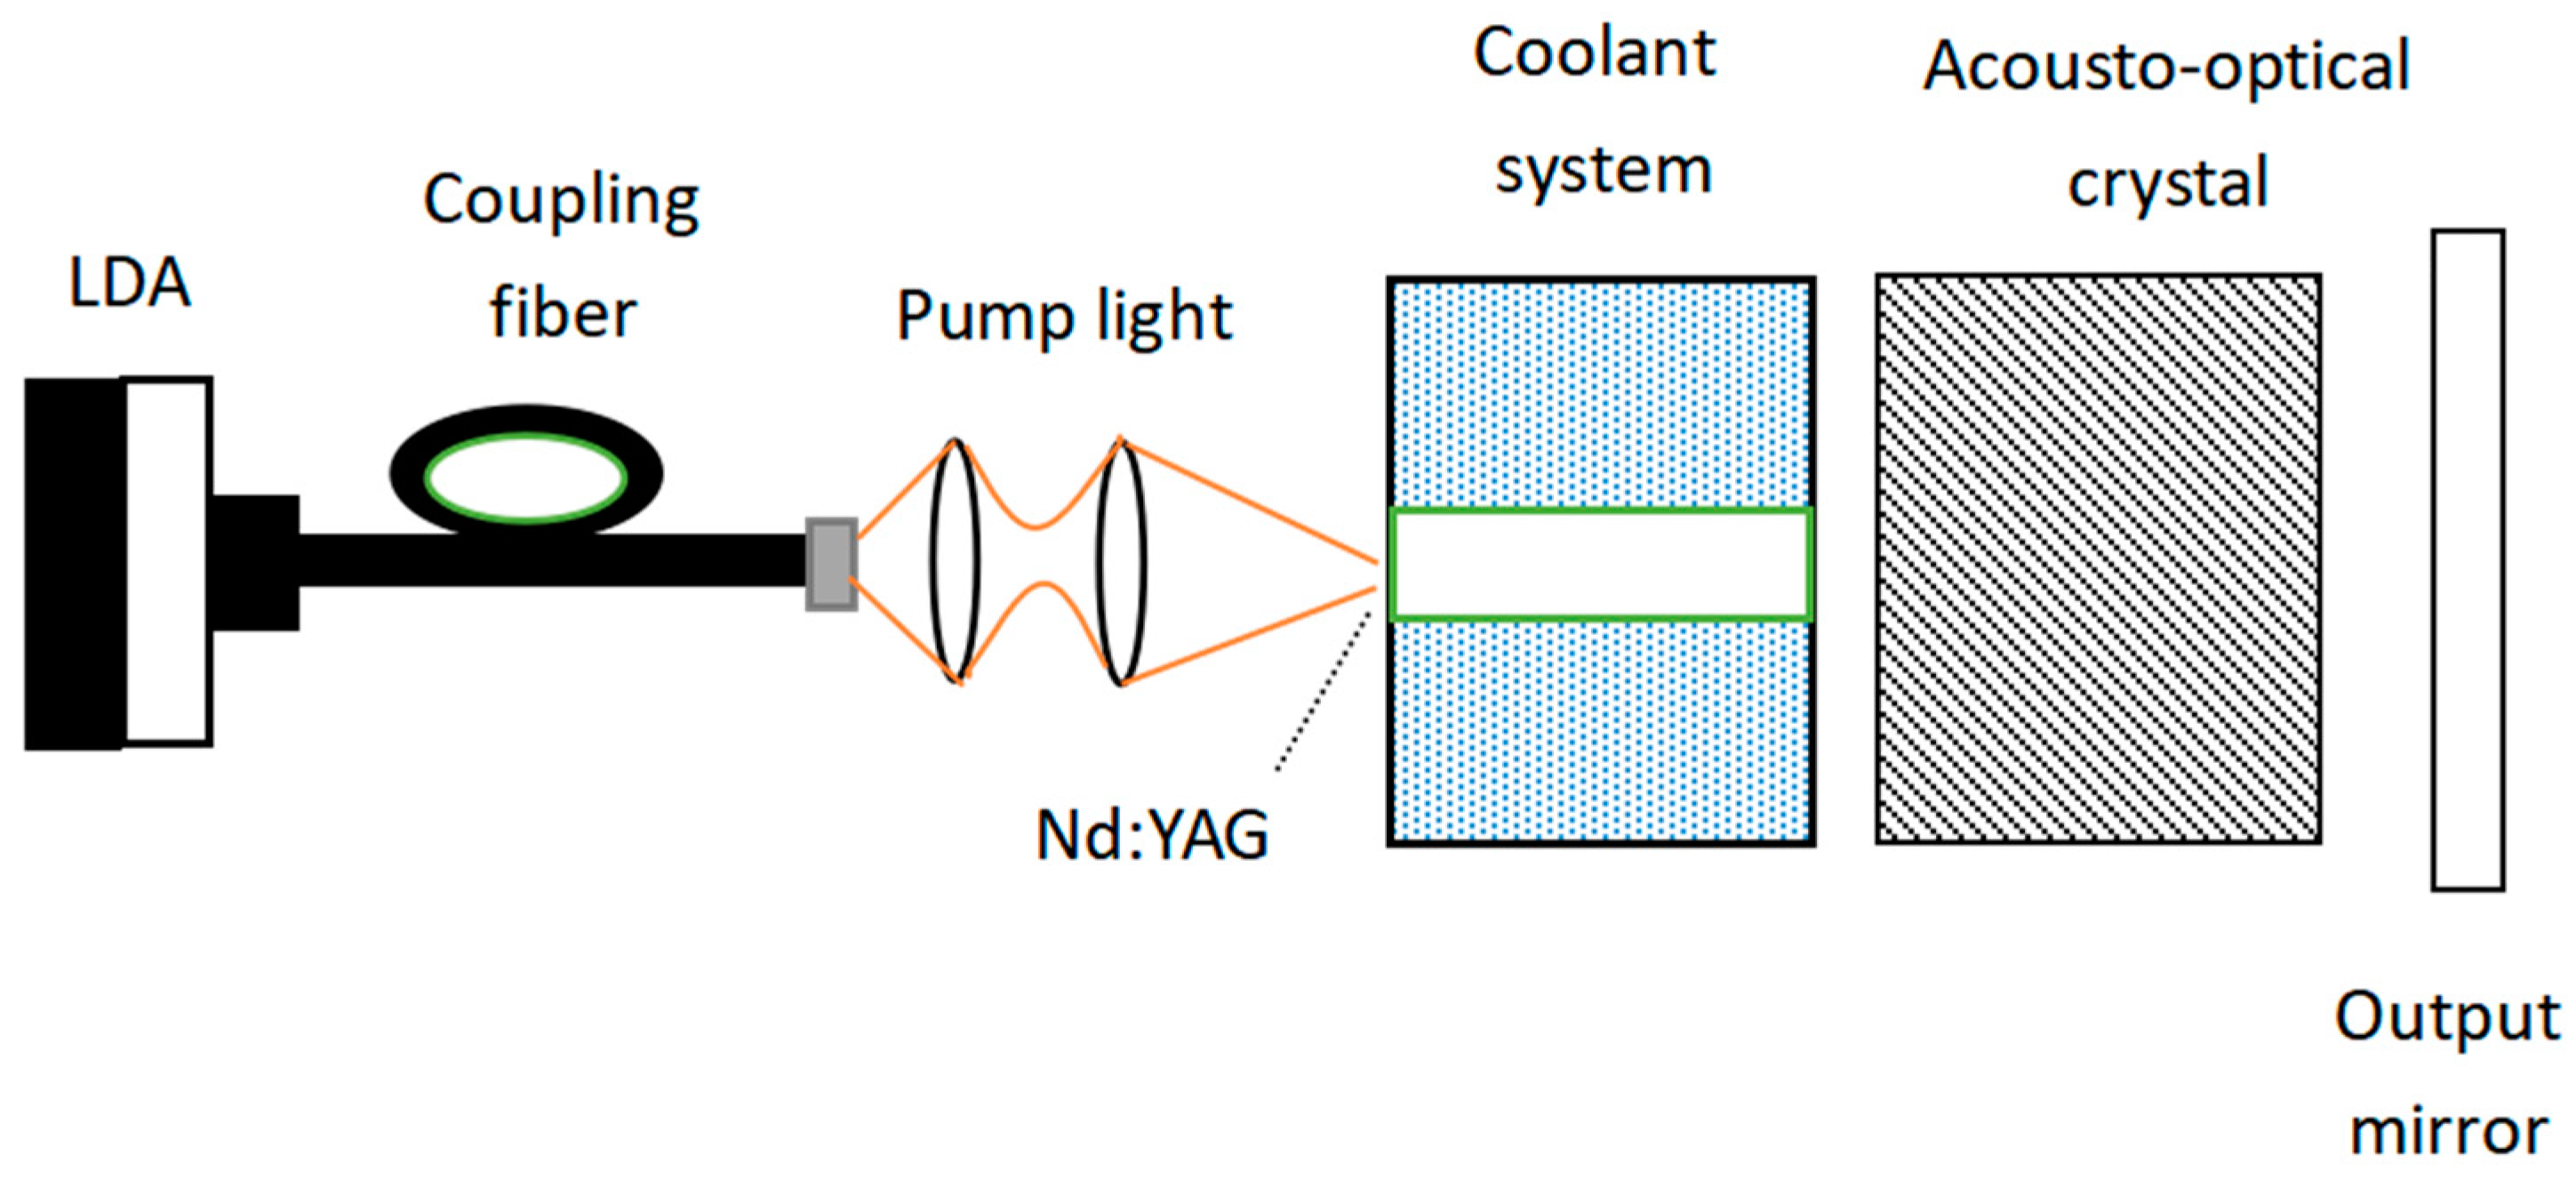
Simulation Model and Parametric Design
A high-peak-power, narrow-pulse Q-switched Nd:YAG laser was used as a model to analyze the impact of lower-level particles on the laser pulse waveform through simulations. The simulation model is shown in Figure 1, which features a linear cavity with an end-pumped laser diode (LD) and an integrated Q-switched system.
In Figure 1, a semiconductor laser with a wavelength of 808 nm is employed as the pump light source. The pump beam is output through a fiber coupling system, collimated and focused by a lens, and then directed into a cylindrical crystal rod. The laser medium is a cylindrical Nd:YAG crystal rod with a doping concentration of 0.1%. The crystal rod has a length of 30 mm and a radius of 1.5 mm. The pump end face is coated with an 808 nm antireflection coating and a 1064 nm high-reflection coating, while the opposite end of the crystal is coated with a 1064 nm antireflection coating. The output mirror used is a plane mirror with a 70% reflective coating at 1064 nm, and the cavity length is set at 11 cm.
(3)
Key Factors Involved in Simulations
(a).
Spatial Distribution of Pump Light
The semiconductor laser output from the fiber is focused and shaped by a double-lens system before entering the laser crystal. The gain crystal primarily absorbs the pump light over a very short axial distance near the end face. Therefore, a two-dimensional (2D) surface distribution can approximately represent the spatial distribution of the pump light, with the impact of axial distribution being neglected. In this paper, the pump light distribution is approximated as a two-dimensional Gaussian distribution in the simulation.
Under Q-switching conditions, the upper-level population accumulates when the resonator has a low Q-value, forming the initial upper-level population distribution in the process of pulse oscillation. The initial upper-level particle distribution function can be expressed as follows [18]:
N 0 ( x , y ) = P i n τ 21 [ 1 exp ( t τ ) ] 1 h v I 00 ( x , y )
where P i n is the effective pump power, τ 21 is the spontaneous emission lifetimes of the upper-level particles, h v is the photon energy of the pump source, t is the time for initial particle accumulation for population inversion during the Q-switching process, and I 00 x , y is the normalized light intensity distribution of the fundamental Gaussian mode.
  • (b).
    Thermal Effects and Equivalent Thermal Lensing
Thermal effects have a significant impact on high-power lasers [19,20]. Among various thermal effects, the thermal lens effect caused by the temperature-dependent refractive index difference is the most significant. In theoretical calculations, this effect can be equivalently modeled as a mirror with a curvature radius of R at the end face. The radius of curvature corresponding to the thermal effect is defined as follows [18]:
R t h e r = 2 π K ( T ) w p 2 P i n η h e a t ( d n / d T ) [ 1 exp ( a l ) ]
where P i n is the pump power, w p is the radius of the light spot, η h e a t is the optical-to-thermal conversion ratio, K ( T ) is the thermal conductivity, d n / d T is the refractive index gradient, a is the thermal absorption coefficient, and l is the crystal length.
  • (c).
    Intracavity Light Field
The intracavity light field is calculated using the Fresnel–Kirchhoff diffraction integral formula as follows [17]:
u ( x , y ) = i k 4 π s u ( x , y ) e i k d p d p ( 1 + cos θ ) d s
where u(x′, y′) and u(x, y) represent the distributions of the initial and diffracted optical fields, respectively. dp is the straight-line distance between the known point (x′, y′) and the point to be determined (x, y); θ is the angle between the normal direction at the known point (x′, y′) position on the surface S and the line connecting the point (x′, y′) and (x, y); k = 2π/λ is the magnitude of the wave vector.
In complex integral calculations, the Fourier transform method is often employed to reduce computational complexity. In this study, we apply the Fourier transform approach to solve the Fresnel–Kirchhoff diffraction integral formula, achieving a significant improvement in computational efficiency.
  • (d).
    Lower-Level Relaxation Time
Considering the significant impact of the lower-level population on the actual population inversion in the gain crystal for narrow-width laser pulses, it is necessary to simultaneously calculate the changes in both the upper-level and lower-level populations through simulations. Additionally, the effect of the spontaneous emission rate of the lower-level particles on the entire simulation process must be considered. The spontaneous emission lifetime of the lower-level particles is approximately 30 ns.
The changes in the population of the lower energy level are shown in Equation (3). The main increment in particle number originates from the stimulated emission process of upper-level particles, represented by the first term ( n 2 n 1 ) σ ϕ c in the equation, while the second term n 2 / τ 21 has a negligible impact on the increment due to the relatively large τ 21 . Therefore, when the photon density ϕ and the upper-level particle density n 2 in the resonant cavity are both high, the increment in lower-level particle density n 1 is larger. In other words, the high photon density ϕ in the cavity and the large increment in n 1 occur simultaneously. This significant increase in n 1 reduces the effective population inversion particle density, leading to a decrease in the gain of the resonant cavity, thereby affecting the entire pulse formation process.

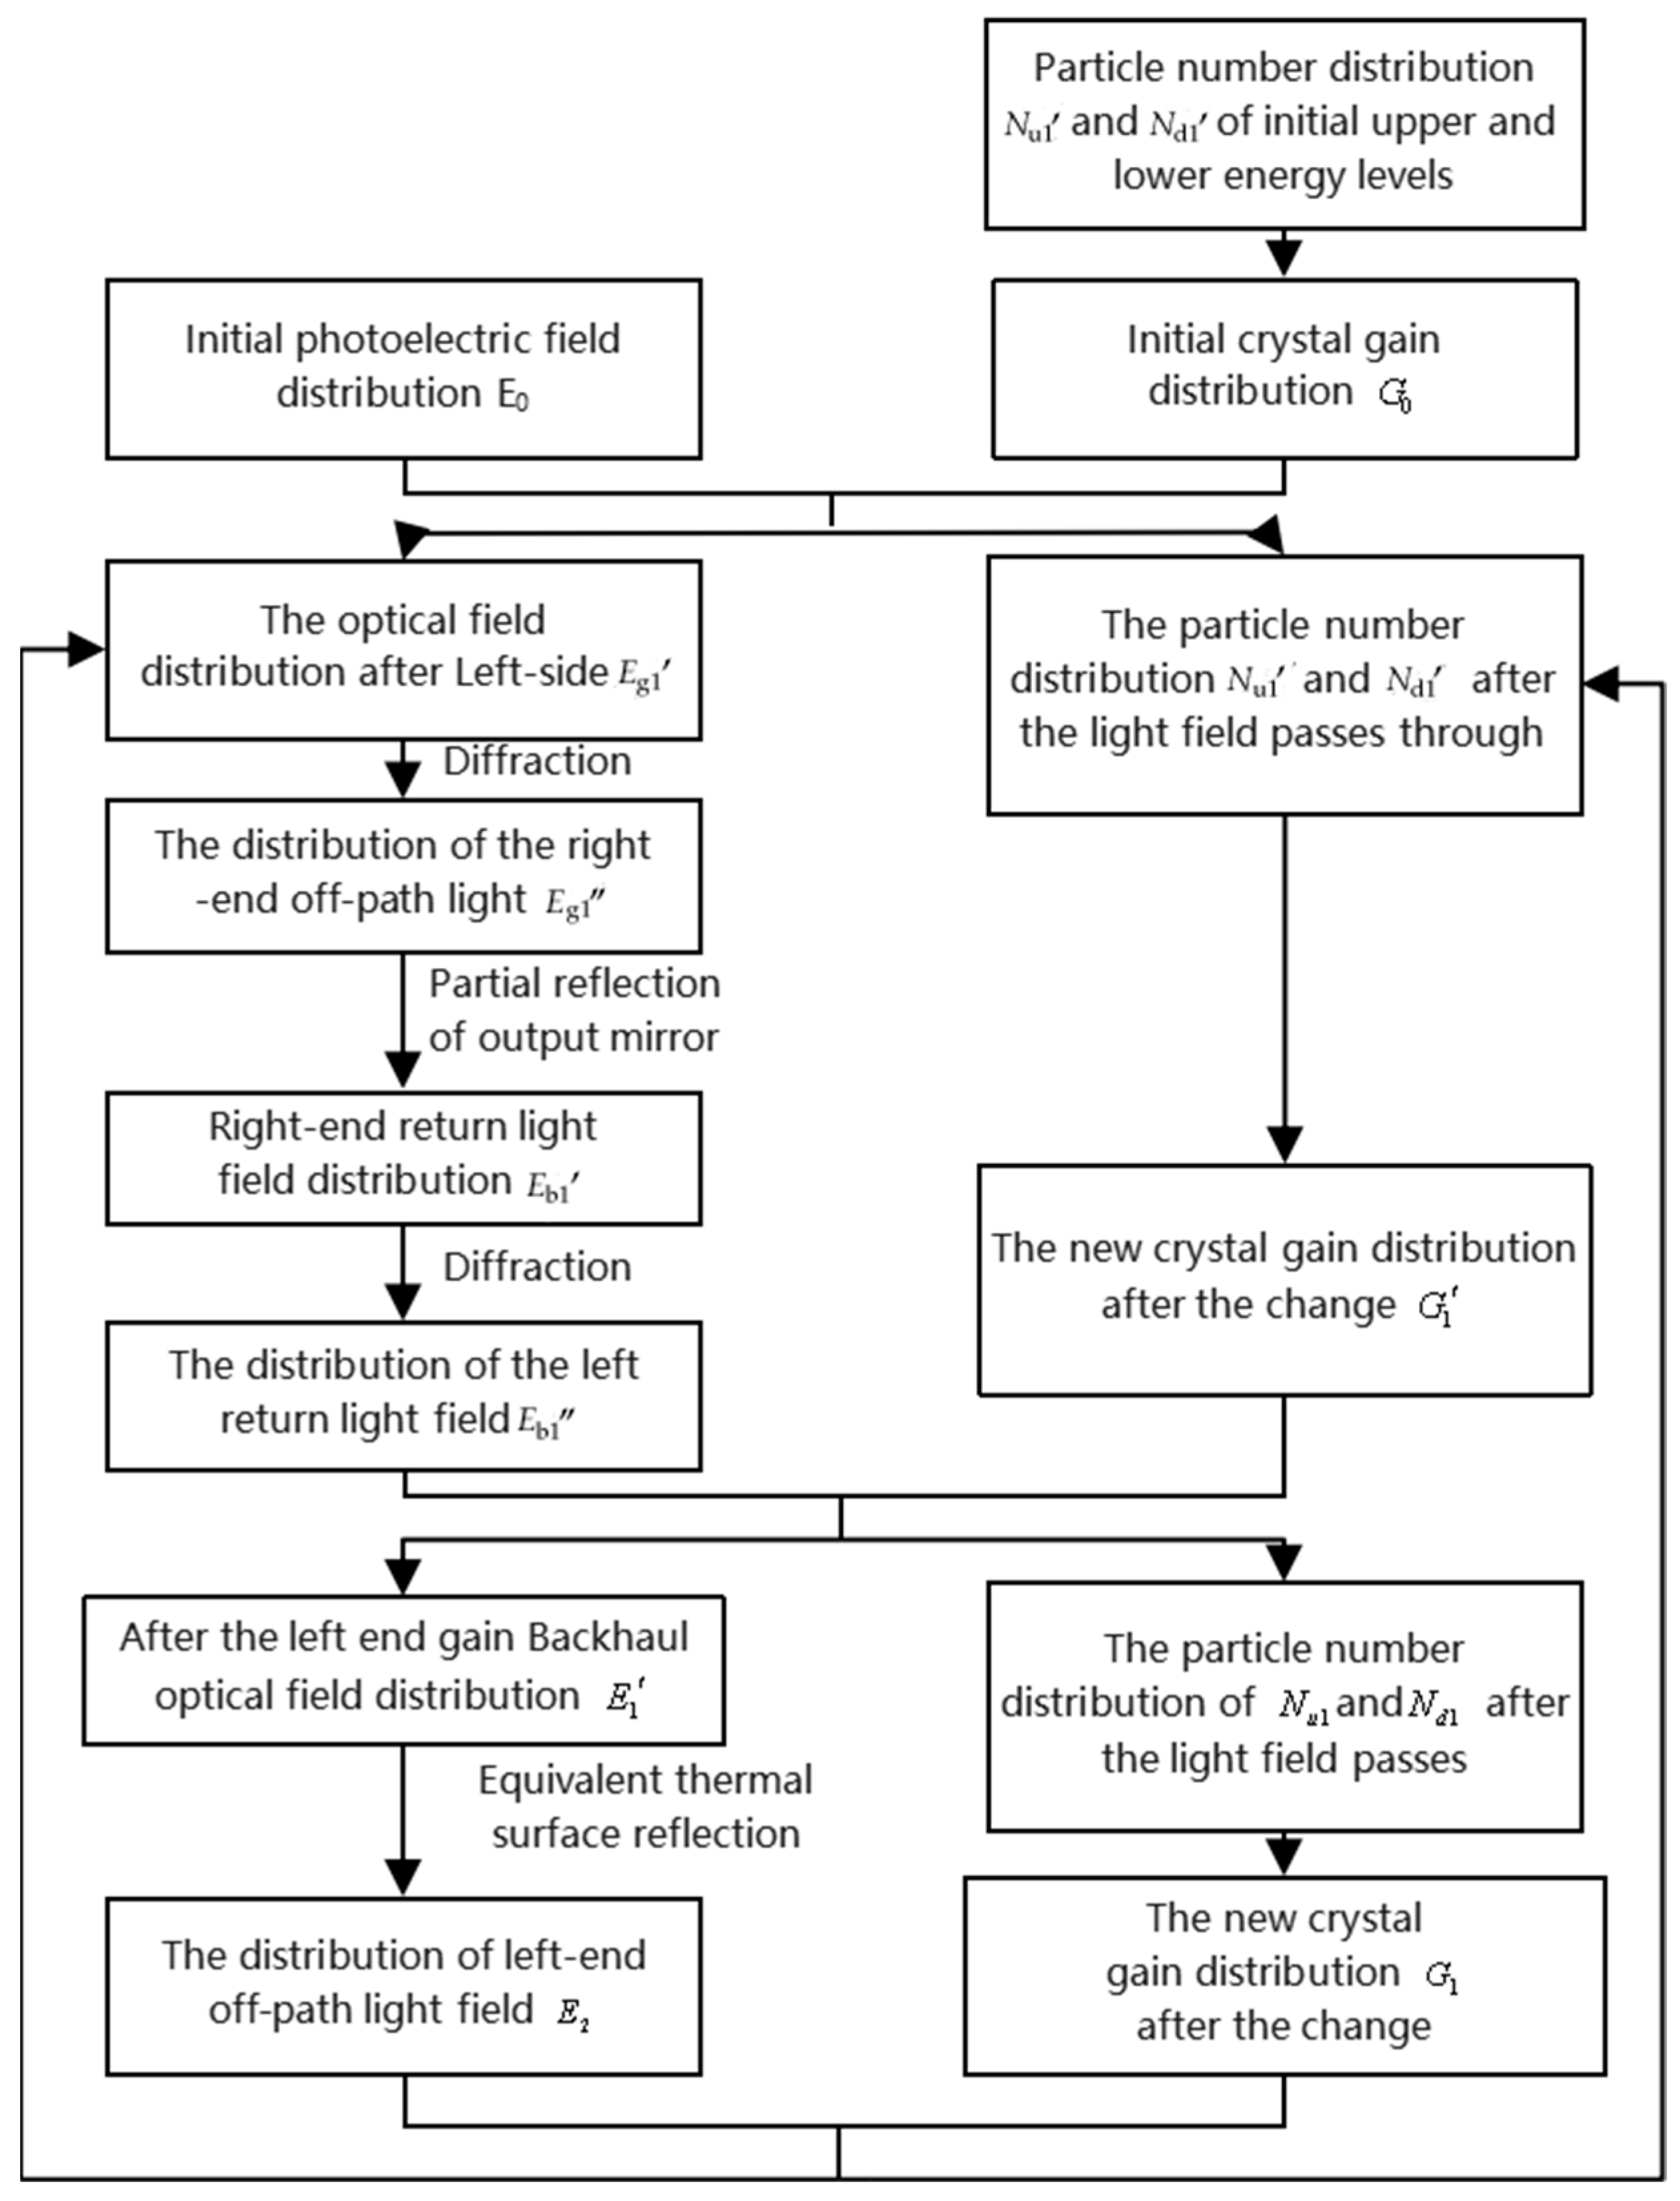
2.2. Simulation Algorithm

The numerical calculation methods are employed to solve the rate equations, using the duration of single-pass photon transmission in the resonant cavity as the time step. Each single-pass transmission corresponds to one iteration. For convenience, this algorithm is referred to as the lower-energy-level algorithm (LELA). The flowchart of the algorithm is presented in Figure 2. The specific calculation steps are described as follows:
Step 1: Calculate the equivalent thermal lens radius R using Equation (5). Then, calculate the initial upper-level particle number distribution matrix N 0 based on the initial pump light distribution and Equation (4). It is assumed that the pump light distribution along the axis is primarily concentrated near the end face, allowing for the determination of the initial single-pass optical intensity gain distribution matrix G 0 .
G 0 = exp ( σ N 0 l n V )
where σ is the stimulated emission cross-section, n is the refractive index of the laser crystal, l is the length of the laser crystal, and V is the volume of the crystal.
Step 2: Pointwise multiplication of the initial electric field distribution matrix E0 with the gain distribution matrix G 0 results in the electric field distribution matrix E g 1 after gain.
Step 3: Calculate the distribution of the upper-level particle number   N u 1 , the lower-level particle number N d 1 , and the inversion particle number N 1 after a single-pass gain.
Step 4: Calculate the new gain distribution matrix N 1 based on the inversion particle gain distribution G 1 .
Step 5: The electric field matrix E g 1 undergoes Fresnel–Kirchhoff diffraction over the resonant cavity length L, resulting in a new electric field matrix of the same scale, which serves as the output electric field distribution matrix E g 1 .
Step 6: E g 1 is transmitted and reflected by the output mirror, yielding the output electric field matrix E o u t 1 and the reflected electric field matrix E b 1 that returns into the resonant cavity. Here, the output mirror is modeled as a plane mirror.
Step 7: The reflected electric field matrix E b 1 undergoes Fresnel–Kirchhoff diffraction over the resonant cavity length L again, resulting in an electric field matrix E b 1 of the same scale.
Step 8: The electric field matrix E b 1 is then pointwise multiplied by the spatial gain distribution matrix G 1 to obtain a new optical field distribution matrix E 1 at the pumping end.
Step 9: Repeat steps 3 and 4 to calculate the new upper-level particle number distribution N u 1 , lower-level particle number distribution N d 1 , inverted particle number distribution N 1 , and the new single-pass gain distribution G 1 .
Step 10: E 1 undergoes two Fresnel–Kirchhoff diffraction operations at the end face with a curvature radius of R, once going and once returning, resulting in the final electric field distribution matrix E 2 of the first optical field oscillation.
Step 11: Return to steps 2 through 10 and repeat the calculations in a loop until the entire laser pulse formation process is complete.
To provide an effective comparison, simulations were conducted without considering the influence of lower-level particles. The algorithm is similar to the one that considers lower-level particles, except that in step 3, the lower-level particle number distribution need not be calculated. Instead, it is assumed the number of lower-level particles is negligible, represented by the distribution matrix N d 1 = 0 . For convenience, this algorithm is referred to as the no-lower-energy-level algorithm (NLELA).

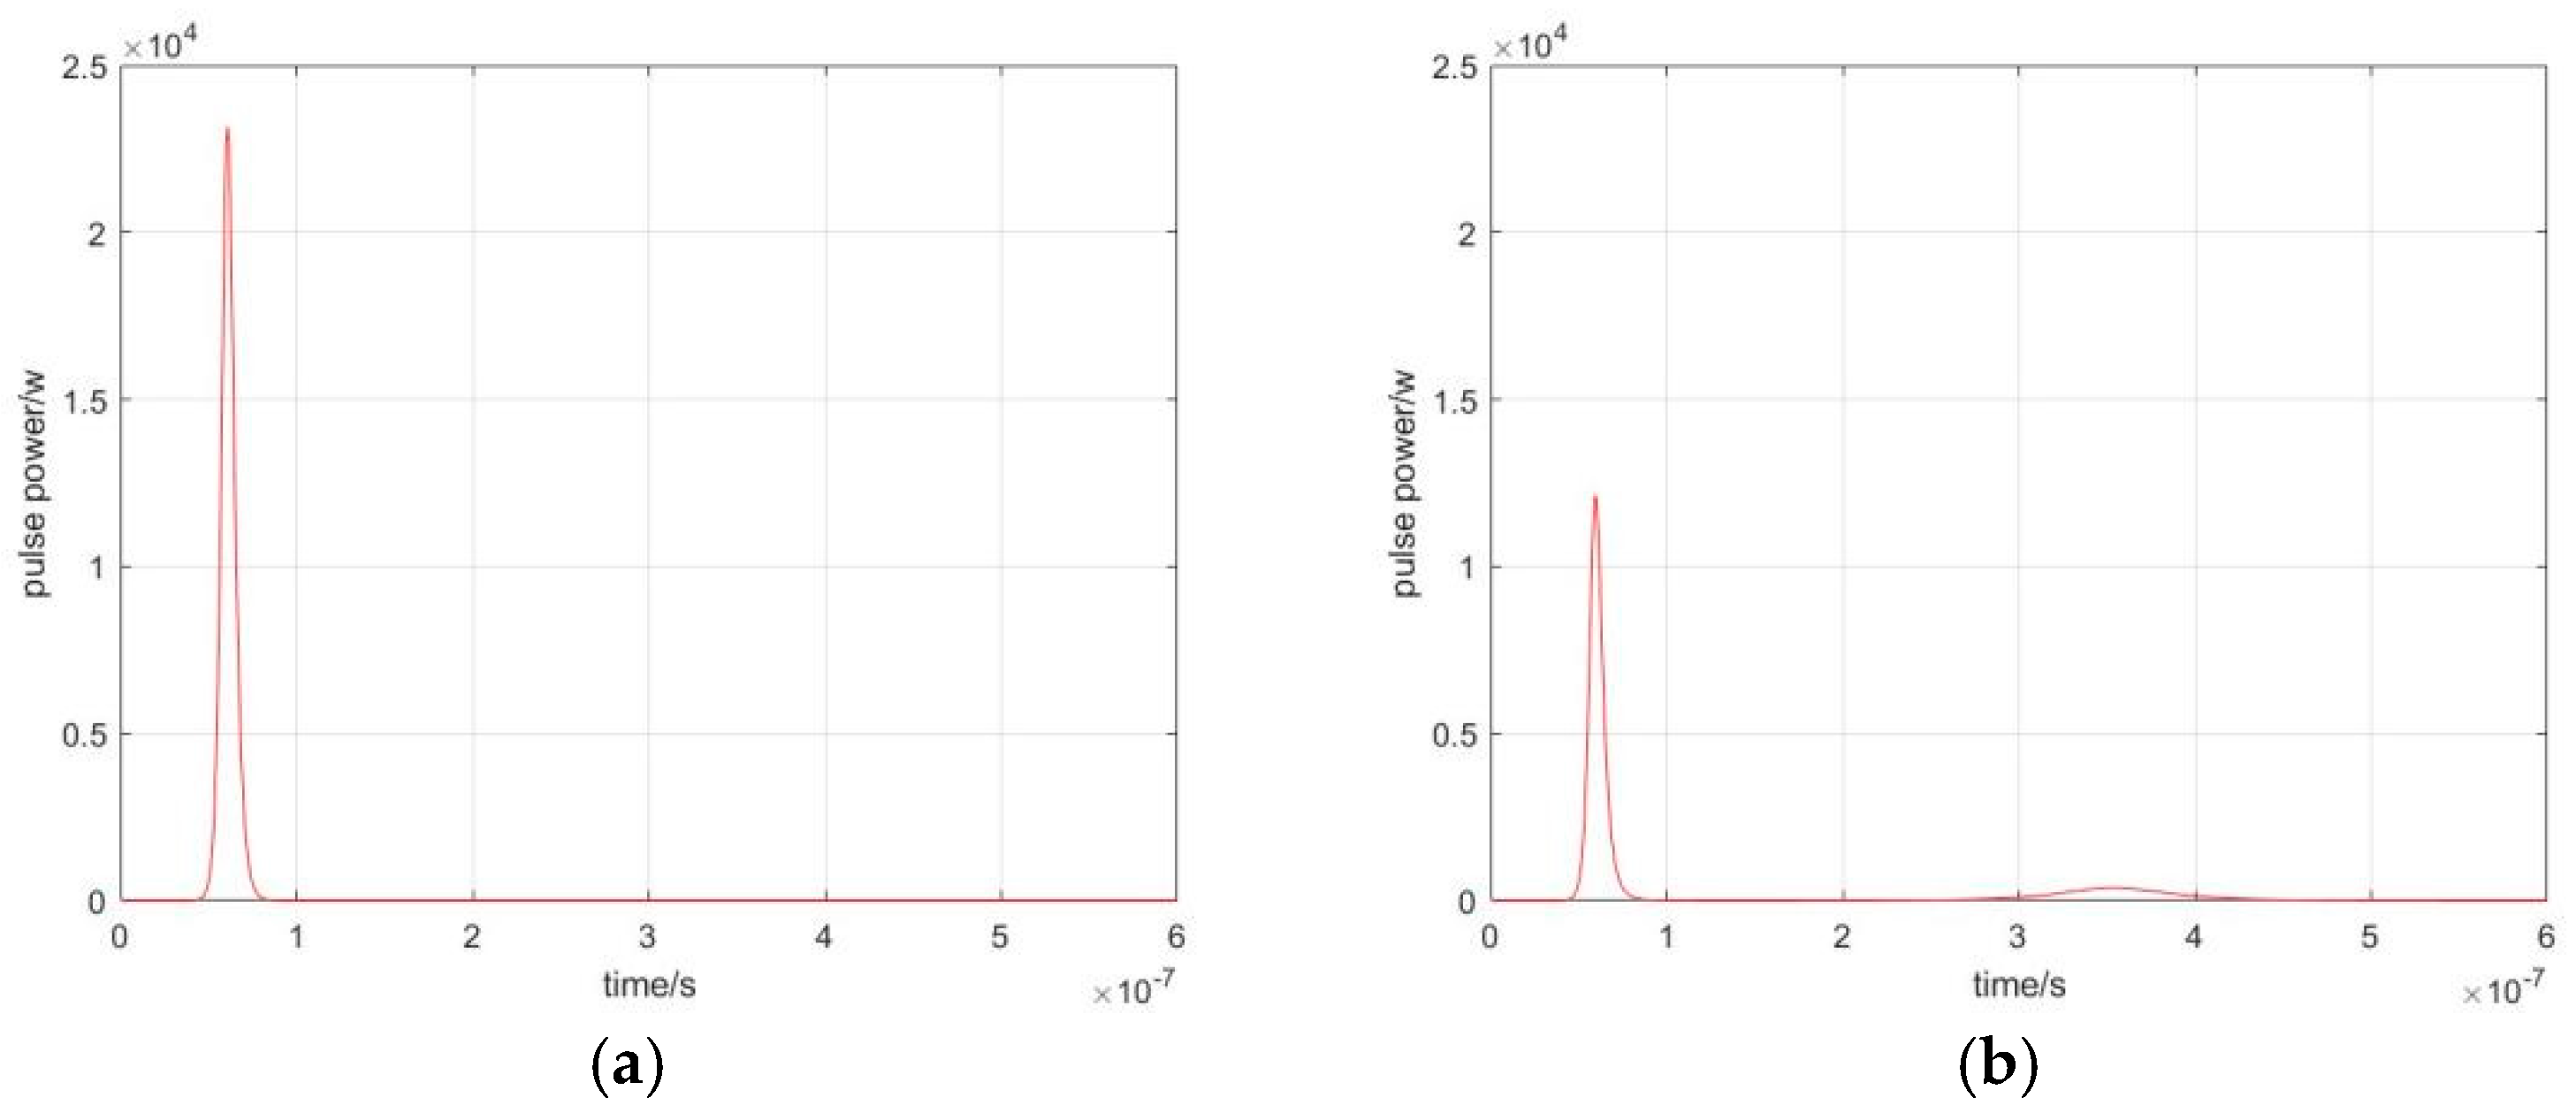
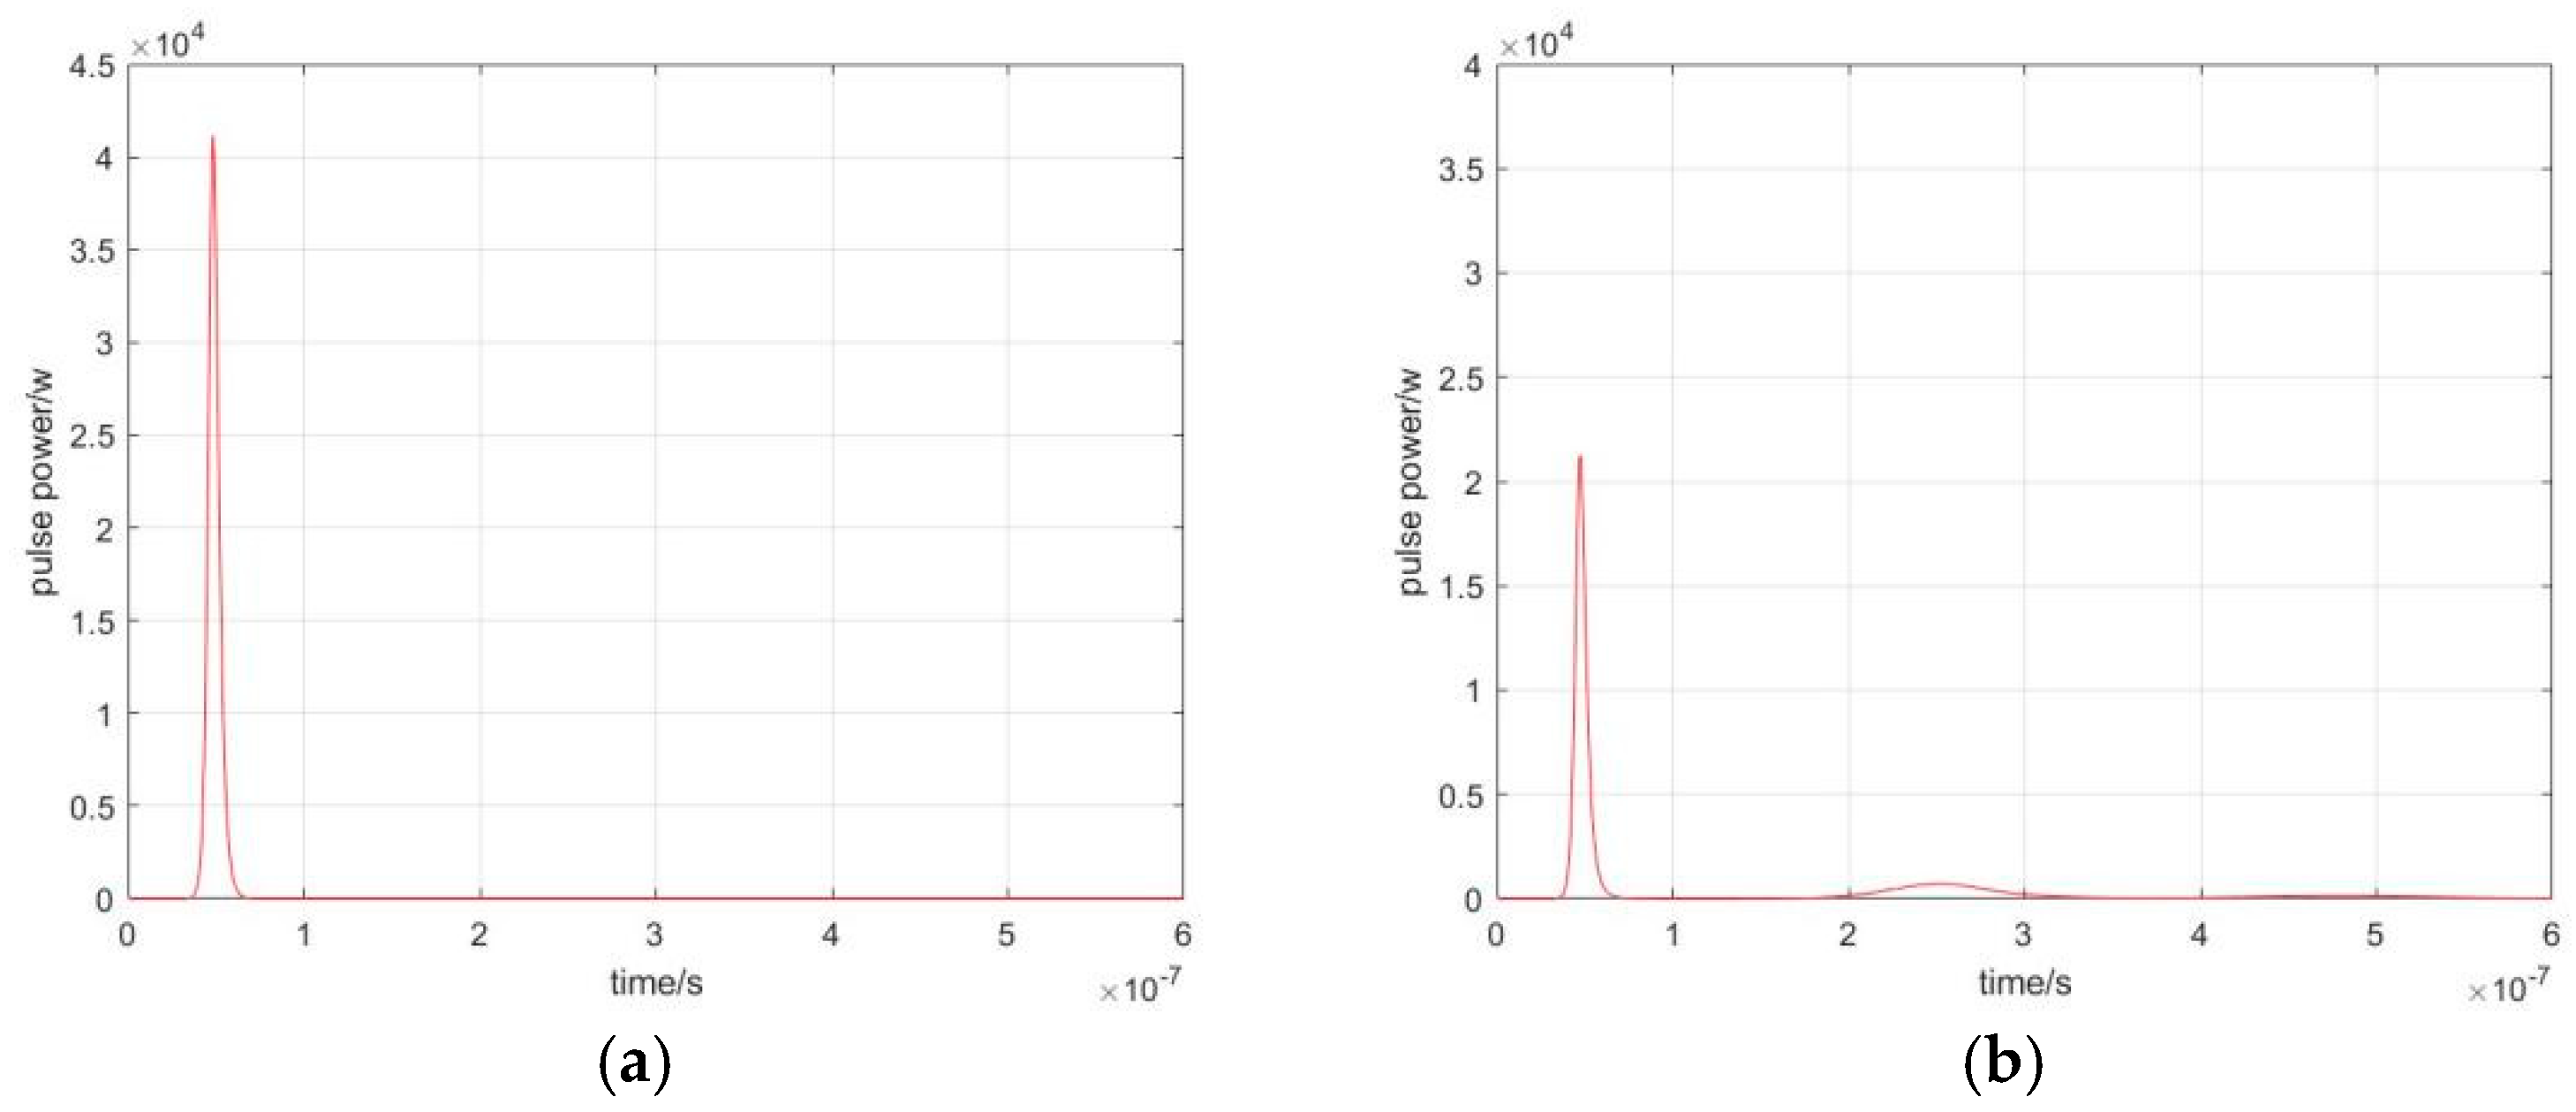
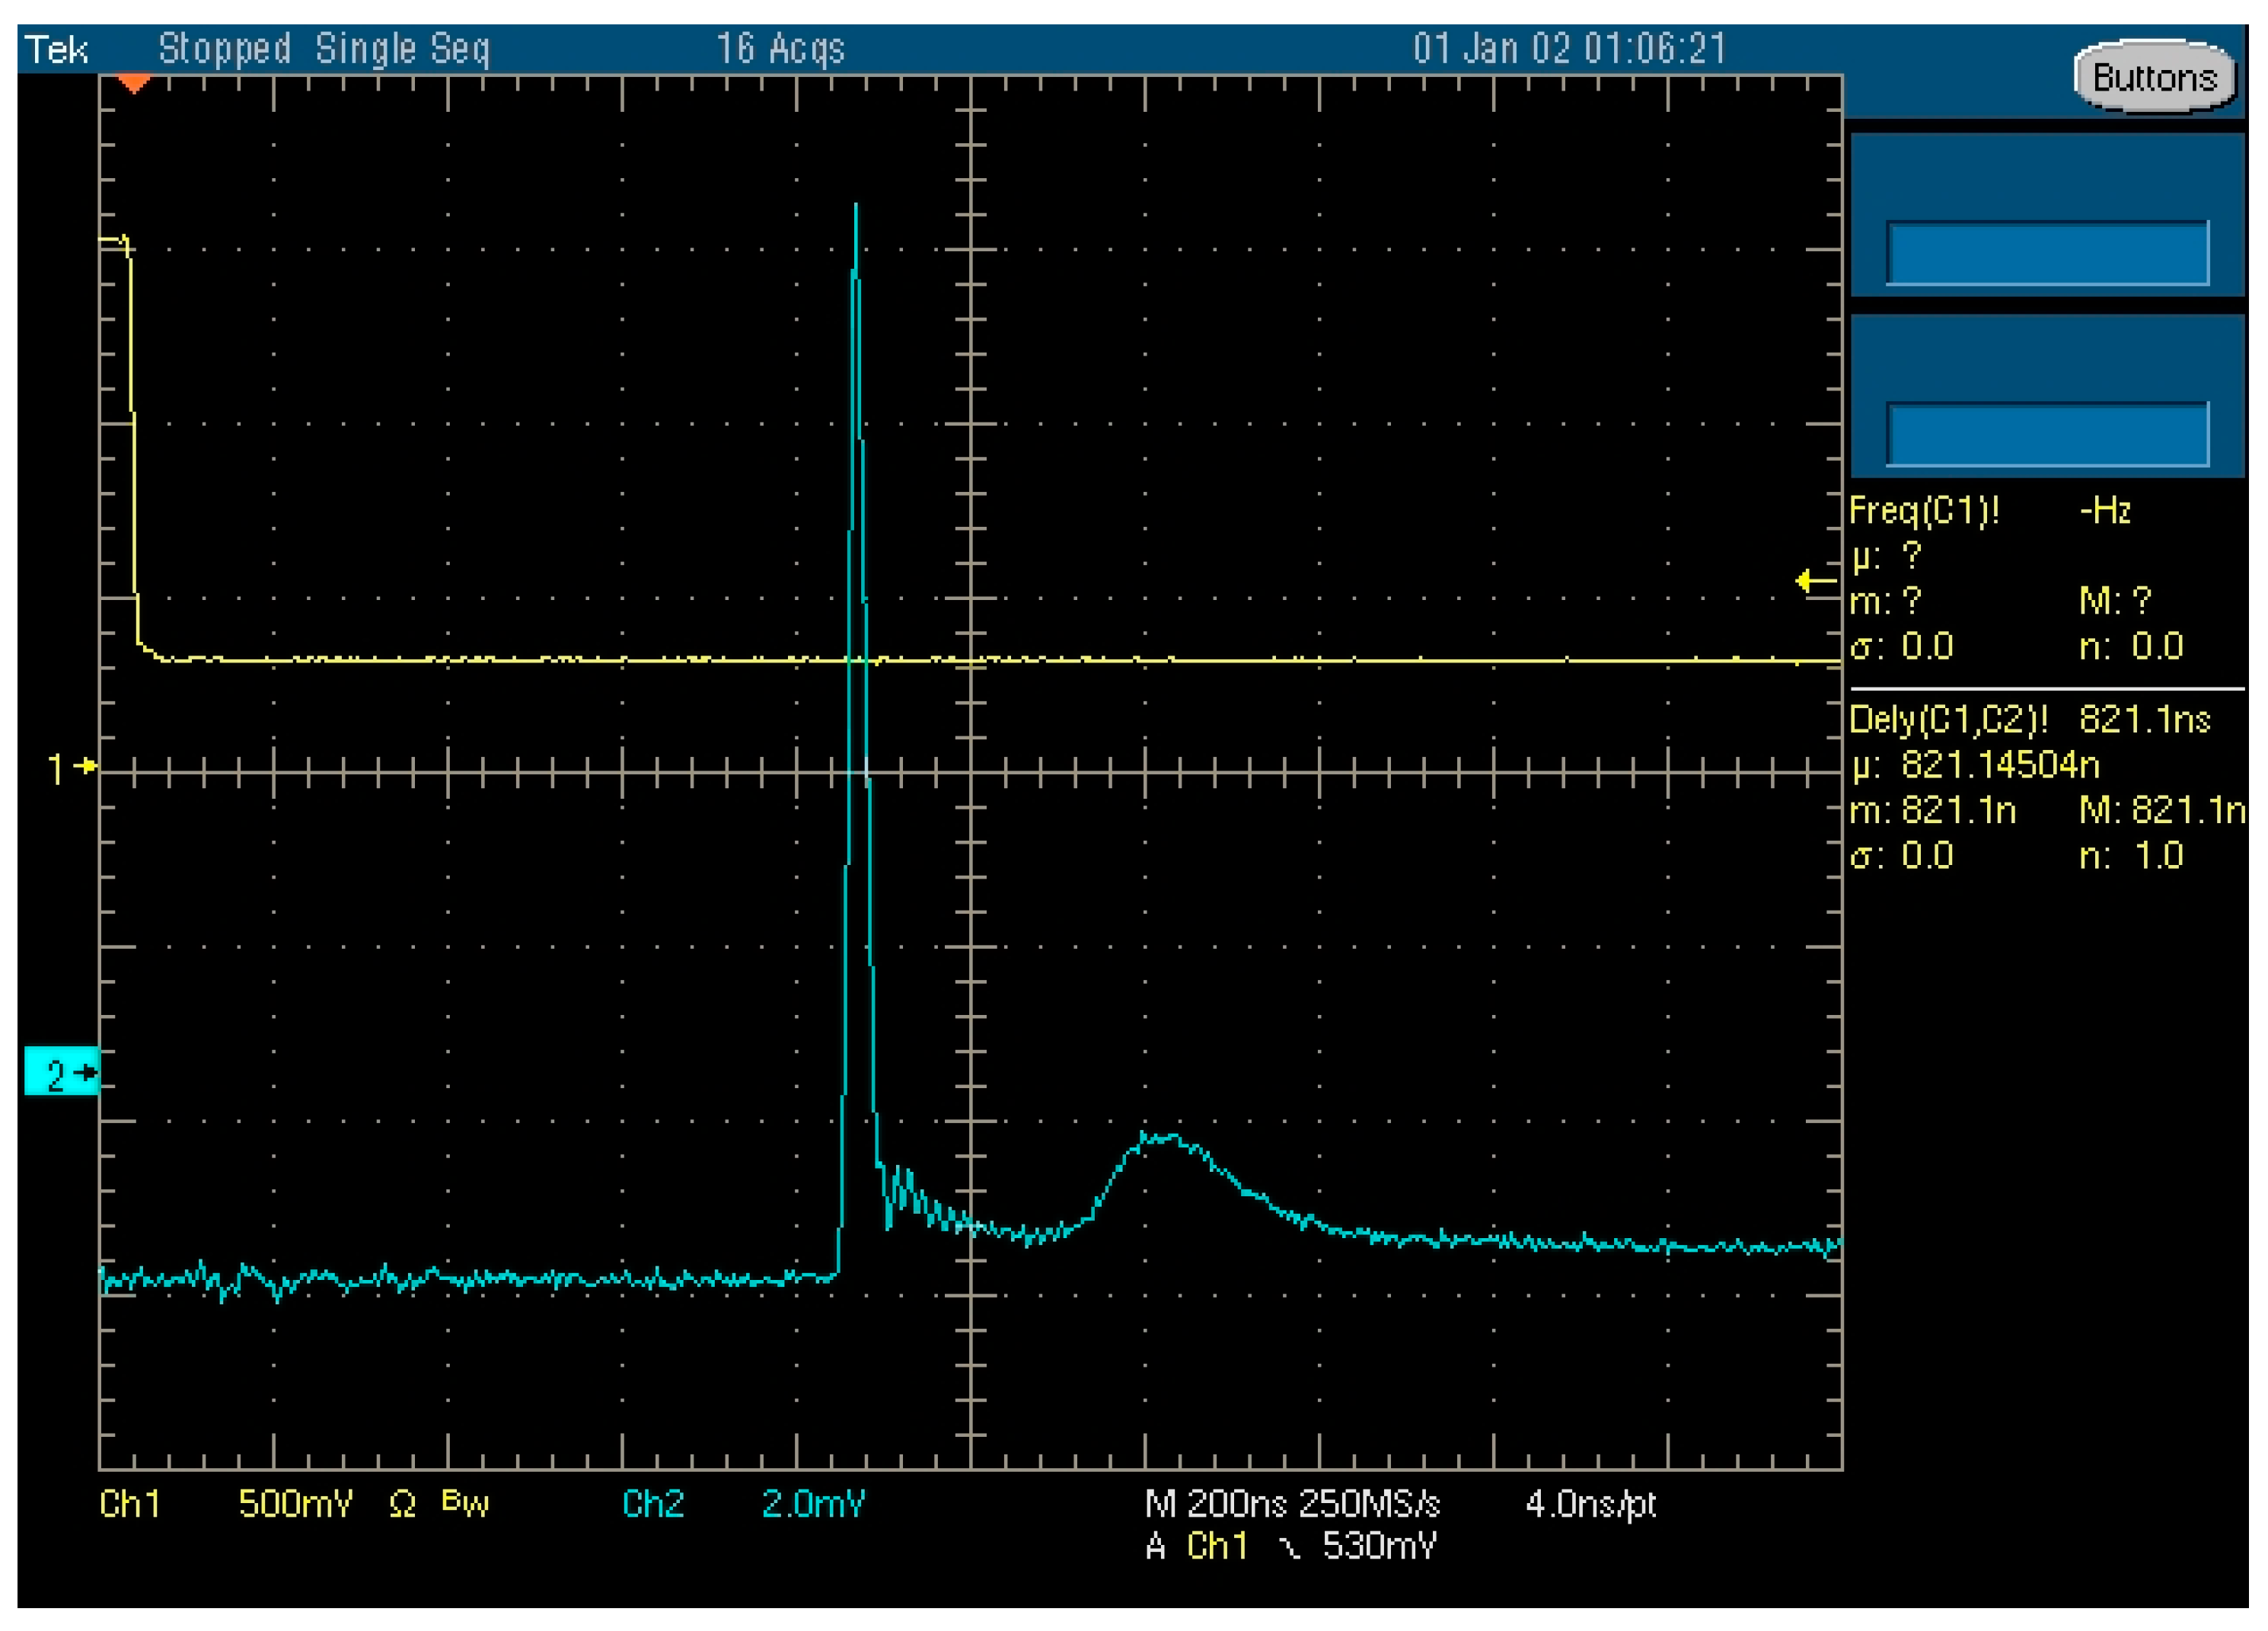
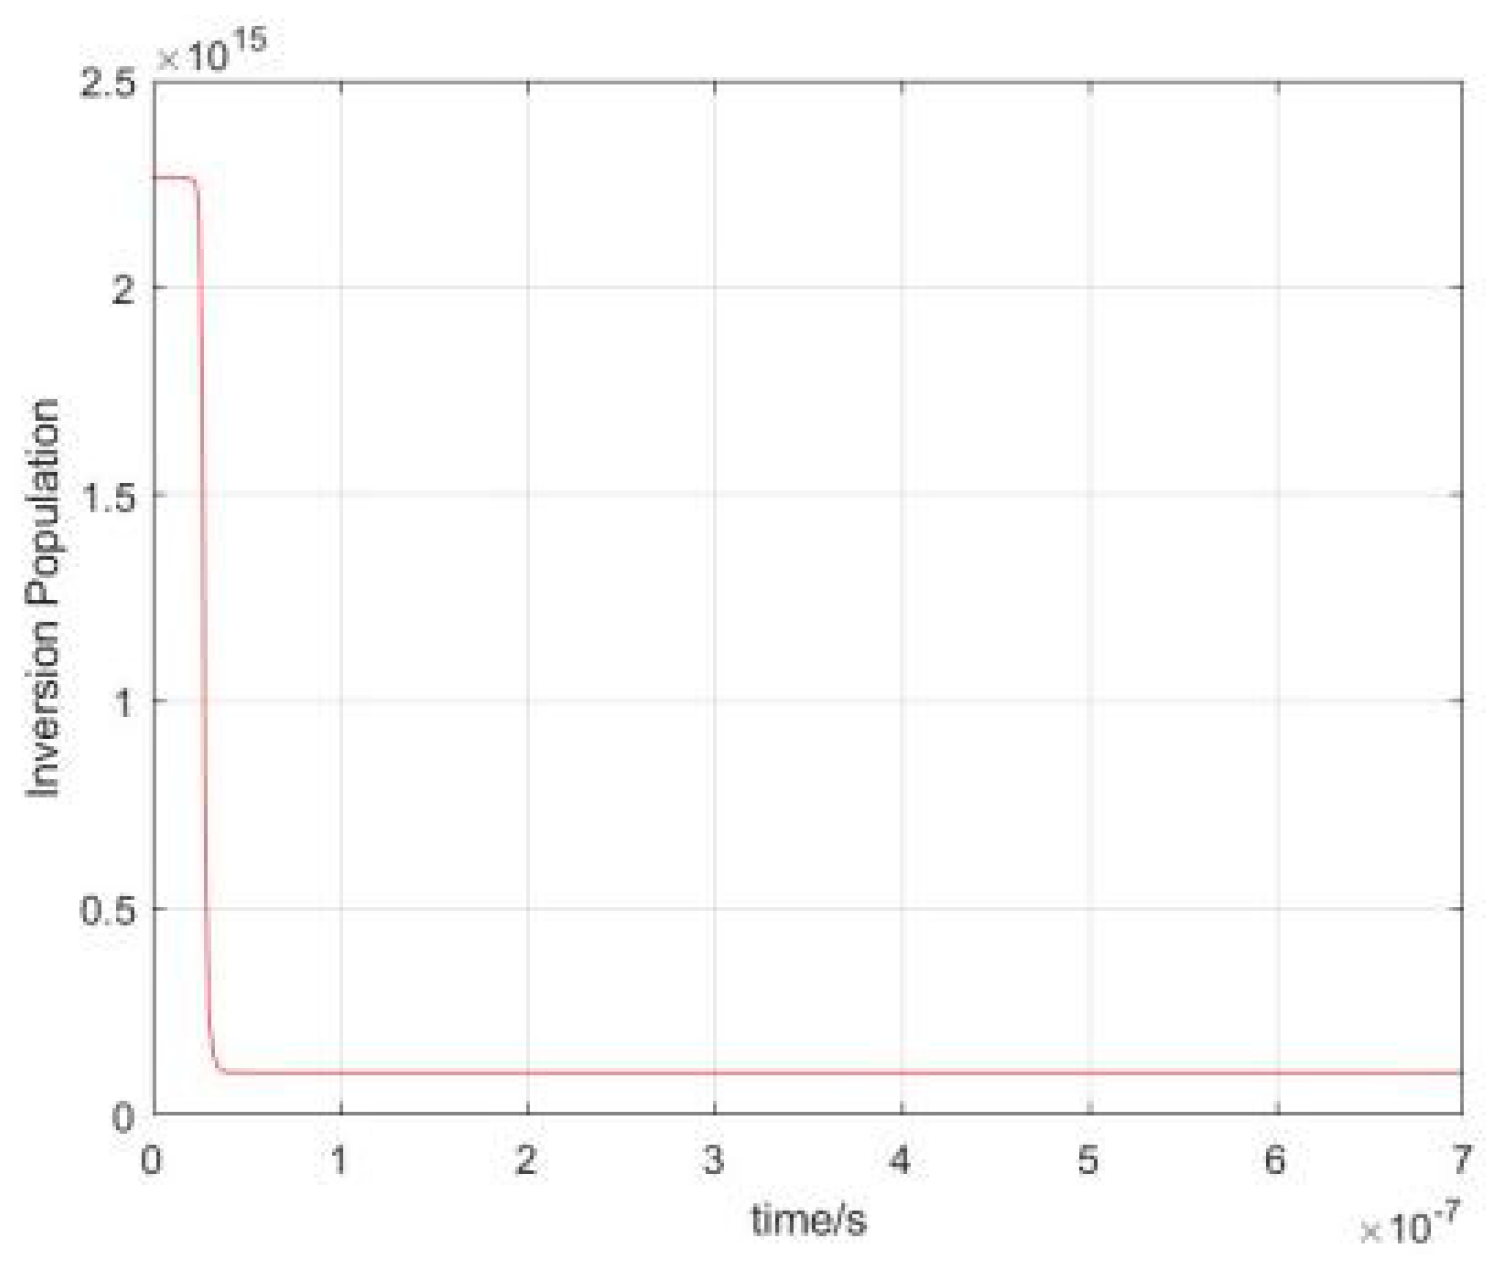
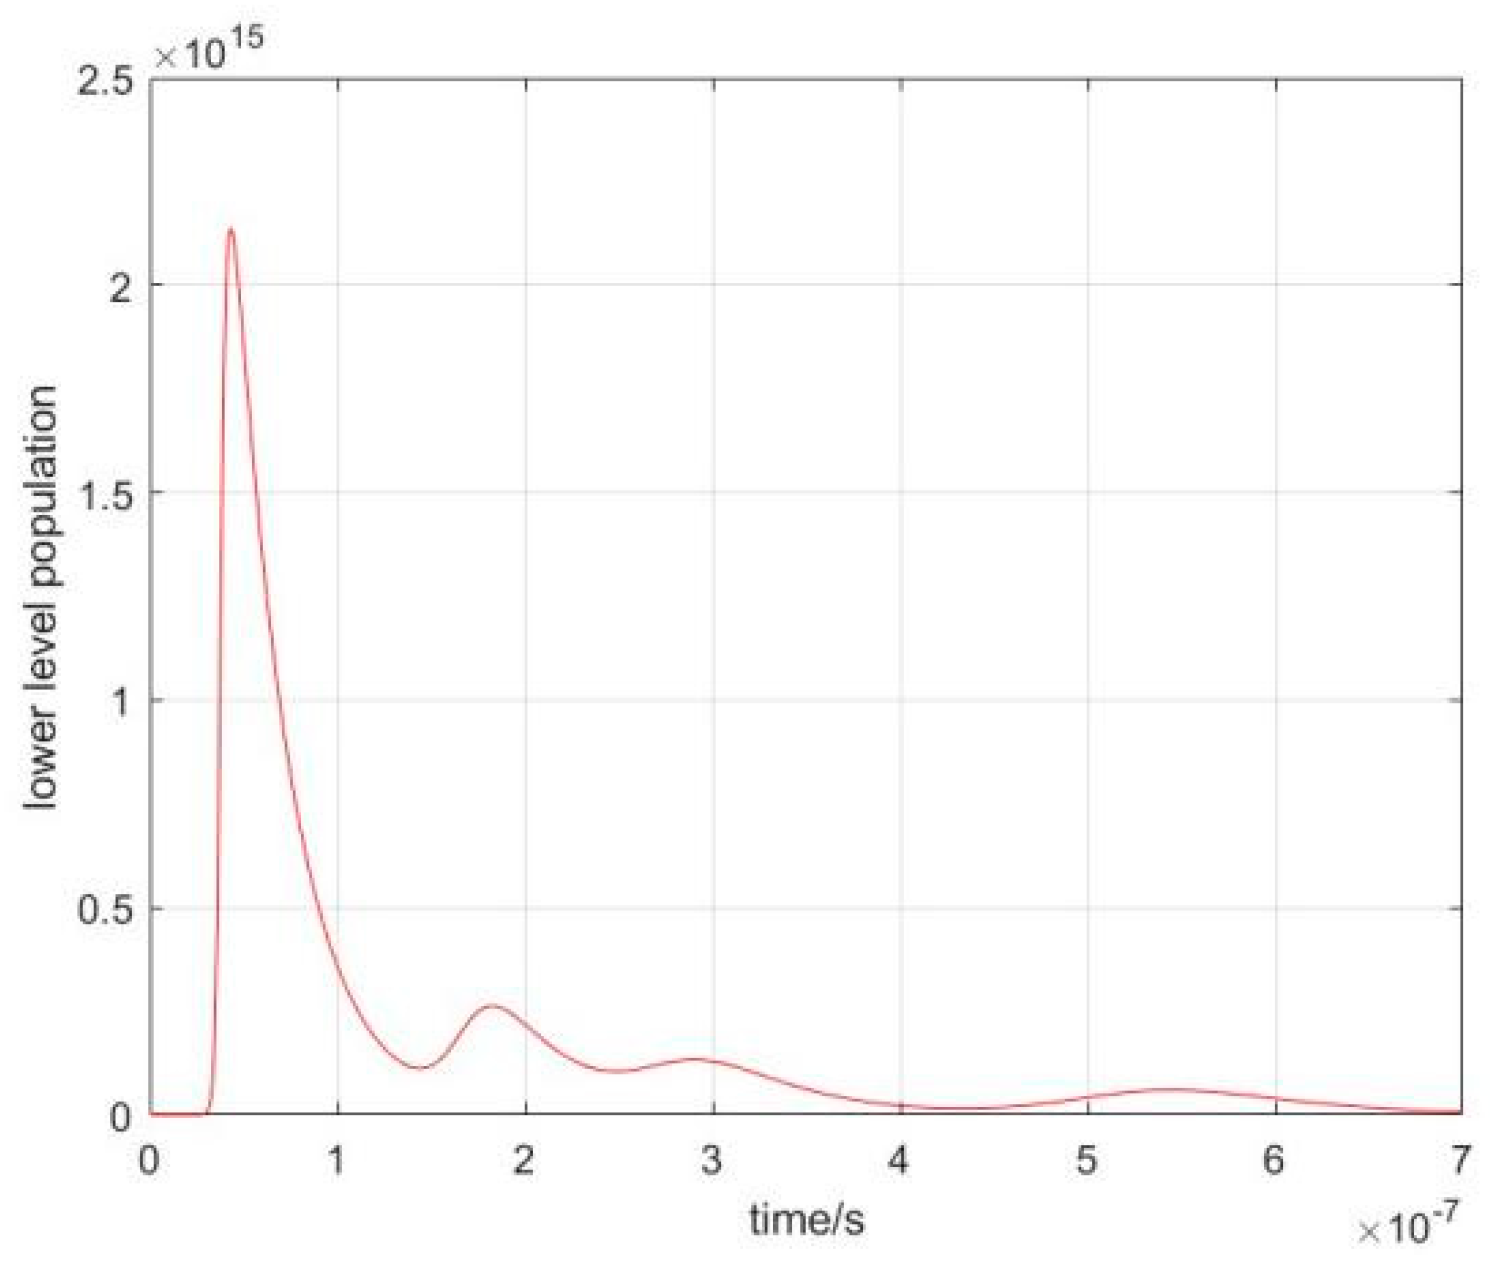
3. Simulation Results and Experimental Validation

Taking the fiber-coupled, end-pumped LD, acousto-optic Q-switched Nd:YAG laser as an example, theoretical analysis was performed using the Q-switching rate equations in two forms: NLELA and LELA. The Nd:YAG crystal rod had dimensions of φ 3 mm × 30 mm, and the pump end face was coated with a 1064 nm laser high-reflection film and an 808 nm laser antireflection film. The repetition frequency of the acousto-optic Q-switch was set to 10 kHz. The output mirror was a plane mirror with a transmittance of 30%, and the cavity length was 110 mm. The pump light absorption efficiency is set to 90%. The beam radius incident on the crystal end face after pump light coupling is set to 0.58 mm. Figure 3, Figure 4 and Figure 5 present a comparison of the energy pulse waveforms obtained using the two algorithms, with and without considering the lower level, under different pump powers.
According to the simulated pulse waveforms based on the two algorithms in Figure 3, Figure 4 and Figure 5, it is evident that the primary difference between the two algorithms is that after the main pulse is completed, LELA exhibits a sub-pulse with a peak value lower than that of the main pulse. By contrast, NLELA shows no such waveform distortion.
Table 1 presents a comparison of the main pulse parameters obtained using NLELA and LELA. For pump powers between 80 and 100 W, the peak value as well as the pulse energy in NLELA are approximately twice those in LELA, but the difference in pulse width between the two algorithms is not significant. Table 2 compares the main pulse and sub-pulse parameters of LELA. The peak power of the main pulse is several times greater than that of the sub-pulse, with the pulse width of the main pulse being approximately one-tenth of the sub-pulse width. Additionally, the pulse energy of the main pulse is three to five times that of the sub-pulse.
The experimental setup was constructed based on the simulation model shown in Figure 1, using the same structural parameters as those in the numerical simulation. The pump source is a semiconductor laser system model EB-LFCS-A-200 manufactured by Suzhou Chang Guang Hua Xin Photoelectric Technology Co., Ltd. (Suzhou, China). An oscilloscope model TDS5104B and an APEX65 photodiode with a response time less than 1 ns were used as the pulse detector. The measured pulse power waveform at a pump power of 100 W is shown in Figure 6.
It is clear from Figure 6 that the experimental results are consistent with the simulation results obtained using LELA. After the main pulse ends, a distinct sub-pulse appears, with its peak power significantly lower than that of the main pulse, and its pulse width is several times that of the main pulse; the time interval between the main pulse and the sub-pulse is also relatively similar, at around 80–100 ns. By contrast, NLELA does not exhibit this sub-pulse phenomenon.
Figure 7 illustrates the variation trends of the upper-level particle population and the inversion particle population in LELA at a pump power of 100 W. Figure 8 shows the variation trend of the inversion particle population in NLELA at the same pump power. Compared with NLELA, where the number of inversion particles decreases in a single obvious step-like manner, LELA exhibits multiple step-like decreases. This multiple step-like decrease in the number of inversion particles leads to the appearance of multiple pulses in the laser output.
This multiple step-like decrease phenomenon occurs because a large number of upper-level particles transition to the lower level after stimulated emission, leading to a significant accumulation of particles in the lower level within a short time. Although several particles still remain in the upper level, the stimulated absorption of the lower-level particles counteracts the stimulated emission from the upper level, resulting in a rapid decrease in the inversion particle population and the laser gain. As the loss exceeds the gain, the number of photons in the cavity decreases sharply. However, a large number of particles remain in the upper laser level, and as the lower-level population rapidly decays, the inversion particle population increases again, restoring the gain. Thus, the gain becomes larger than the loss, resulting in an increase in the number of photons in the cavity. This cycle generates a second laser pulse.
It can be seen in Figure 7 that during the pulse decay stage, although the decrease in the density of inversion particles causes the resonant cavity gain to drop below 1, a large number of particles still remain in the upper level. Thus, the laser gain caused by stimulated emission becomes insufficient to overcome the losses from both the resonant cavity and the stimulated absorption by lower-level particles. As a result, the pulse energy decreases. However, once the optical field energy in the resonant cavity falls below a certain threshold, the rate of decrease in the number of lower-level particles due to spontaneous emission becomes significantly greater than the sum of the rates of decrease in the number of upper-level particles from both stimulated emission and spontaneous emission. As a result, a second population inversion occurs, leading to the formation of a second pulse or a stepped pulse waveform.
It is clear from Figure 7 and Figure 9 that the peak value of the lower-level particle population is approximately 2.1 × 10¹⁵, which is an order of magnitude smaller than the maximum value of the inversion particle population of 1.78 × 10¹⁶. In addition, the spontaneous emission time of the lower level is relatively short (around 30 ns), making the change in the number of inversion particles caused by spontaneous emission sufficient to generate a new pulse.
By contrast, as shown in Figure 8, NLELA does not consider the influence of lower-level particles, so the number of inversion particles is the same as the number of upper-level particles. Consequently, the energy stored in the inversion particles is released only once to reach the threshold, and no sub-pulse phenomenon occurs. This process can be seen as a delayed release of a portion of the energy stored in the upper-level particles. This energy release process occurs multiple times according to the changes in the parameters of the resonant cavity, which determine the duration of the release and in turn govern the interval between the main pulse and the sub-pulse.

4. Conclusions

A theoretical model was established to examine the influence of lower-energy-level relaxation on the output pulse waveform of an Nd:YAG laser, and its feasibility was verified through experimental tests. Based on the simulation and experimental results, the following conclusions can be drawn: In simulations, when lower-level relaxation (LELA) was considered, the resulting pulse waveform exhibited noticeable distortion, particularly in the latter part of the pulse, which manifested as a distinct tail peak. Although the peak value of the tail pulse was significantly lower than that of the main pulse, its energy was not negligible; in fact, it exceeded the main pulse energy by more than double. The experimental results showed similar pulse distortion, corroborating the simulation findings. These results confirm that in Q-switched Nd:YAG lasers, lower-level relaxation has a significant impact on high-peak-power, narrow-pulse waveforms.

5. Discussion

This study on the acousto-optic Q-switched Nd:YAG laser under high-power pumping conditions clearly demonstrates that the lower-level relaxation process significantly impacts pulse waveform characteristics. These findings align with the conclusions drawn by S. P. Ng et al. in their investigation of sub-pulse phenomena in diode-pumped passively Q-switched Nd:GdVO4 lasers using Cr4+:YAG saturable absorbers. The results emphasize that the lower-level persistence effect must be rigorously accounted for in the analysis of four-level laser systems; otherwise, distortions or sub-pulse features in the output waveform cannot be properly interpreted. Furthermore, the sub-pulse phenomenon challenges conventional methods for estimating single-pulse energy in high-repetition-rate pulsed lasers. Specifically, the widely used approach of indirectly calculating average single-pulse energy by dividing the laser’s average power by its repetition rate introduces substantial errors. This underscores the urgent need for further research to refine such methodologies and develop more accurate models for determining single-pulse energy in practical scenarios.

Author Contributions

Methodology, F.M. and S.W.; Software, F.M. and P.S.; Validation, F.M., S.W. and J.L.; Formal analysis, F.M., P.S. and J.L.; Investigation, F.M., J.L. and Z.L.; Resources, F.M., B.L., P.S. and Z.L.; Data curation, F.M. and B.L.; Writing—original draft, F.M. All authors have read and agreed to the published version of the manuscript.

Funding

Basic Research Fund Project (Solid-State Laser Technology) (2021110B179).

Institutional Review Board Statement

Not applicable.

Informed Consent Statement

Informed consent was obtained from all subjects involved in the study.

Data Availability Statement

Data underlying the results presented in this paper are not publicly available at this time but may be obtained from the authors upon reasonable request.

Acknowledgments

The authors thank the compact solid-state laser team of Xidian University for their help.

Conflicts of Interest

The authors declare no conflicts of interest.

References

  1. Su, W.; Zhong, J.; Zhang, L.; Cen, X.; Li, L.; Zhao, Y. Numerical Simulation Study on Field of Temperature During the Growth of Nd:YAG Crystal. Chin. J. Lasers 2003, 30, 334. [Google Scholar]
  2. Yao, G.; Zhang, L.; Li, J.; Gu, Y.; Bai, R. Study on application of doped colour center Nd: YAG crystals. Chin. J. Lasers 1990, 17, 141. [Google Scholar]
  3. Zhou, J.; Qiao, J.; Deng, P. Investigation of damage and dislocation structure in LiF crystals by 1.06μm Nd:YAG pulsed laser radiation. Chin. J. Lasers 1989, 16, 432. [Google Scholar]
  4. Jiang, B.; Xu, J.; Li, J. Temperature Gradient Technique Grown Nd:YAG Crystal for Heat Capacity Laser with Laser Output of 1200 W. Chin. J. Lasers 2006, 33, 973. [Google Scholar]
  5. Su, W.; Zhong, J.; Zhang, L.; Cen, X.; Li, L.; Zhao, Y. Numerical Simulation Study on Field of NdNd3+ Concentration during the Growth of Nd: YAG Crystal. Chin. J. Lasers 2003, 30, 435. [Google Scholar]
  6. Cheng, H.; Ma, X.; Liu, R.; Xu, X.; Gui, Y. Growth study of φ80 mm Nd:YAG Crystals by Czochralski Method. Chin. J. Lasers 2004, 31, 510. [Google Scholar]
  7. Sun, X.; Yu, Y.; Pei, B. High Power Diode-Pumped Nd:YAG 1.319 μm TEM00 Laser. Chin. J. Lasers 2004, 31, 55. [Google Scholar]
  8. Jiang, D.; Zhao, H.; Wang, J.; Zhou, S. LD Pumped Nd:YAG Laser with Output Power of 300 W. Chin. J. Lasers 2004, 31, 8. [Google Scholar]
  9. Li, R.; Yu, J.; Lai, Y.; Ma, X. LD Pumped Nd: YAG/LBO Blue Laser. Chin. J. Lasers 2002, 29, 105. [Google Scholar]
  10. Zhou, S.; Jiang, D.; Zhao, H.; Wang, J.; Zhao, H. LD Pumped Hectowatt Nd: YAG Laser. Chin. J. Lasers 2002, 29, 119. [Google Scholar]
  11. Ning, J.; Ni, W.; Yang, T.; Zhan, Y.; Lu, X.; Yao, J. Study of Diode-pumped Multi-wavelength Nd:YAG Laser. Chin. J. Lasers 2002, 29, 123. [Google Scholar]
  12. Wang, J.; Zhang, W. Investigation on Nd:YAG/KTP/Cr4+ YAG Picosecond Green Laser. Chin. J. Lasers 2002, 29, 56. [Google Scholar]
  13. Siegman, A.E. Lasers; University Sciences Books: Mill Valley, CA, USA, 1986; Chapter 26. [Google Scholar]
  14. Bartschke, J.; Boller, K.J.; Wallenstein, R.; Klimov, I.V.; Tsvetkov, V.B.; Shcherbakov, I.A. Diode-pumped passively Q-switched self-frequency-doubling Nd:YAB laser. J. Opt. Soc. Am. B 1997, 14, 3452–3456. [Google Scholar] [CrossRef]
  15. Ng, S.P.; Tang, D.Y.; Qian, L.J.; Qin, L.J. Satellite Pulse Generation in Diode-Pumped Passively Q-Switched Nd:GdVO4 Lasers. IEEE J. Quantum Electron. 2006, 42, 625–632. [Google Scholar] [CrossRef]
  16. Li, S.; Huang, W. Principles and Design of Laser Devices; National Defense Industry Press: Beijing, China, 1998. [Google Scholar]
  17. Zhou, B. Laser Principle; National Defense Industry Press: Beijing, China, 2007; Volume 11, pp. 145–149. [Google Scholar]
  18. Qu, P. Research on Key Technologies of Compact High-Energy Solid-State Laser. Ph.D. Thesis, Xi’an University of Electronic Science and Technology, Xi’an, China, 2017. [Google Scholar]
  19. Li, Q.; Wang, Z.; Wang, Z.; Fang, M. Thermal Lens Focal Length Measurement of High Power Lamp Pumped CW Nd:YAG Laser. Chin. J. Lasers 2004, 31, 1117. [Google Scholar]
  20. Chang, R.; Shi, P.; Zhang, Y.; Xin, Y.; Bai, B. Influence of Air Heat Transfer Coefficient on Thermal Distortion Analysis of Nd:YAG Microchip Laser. Chin. J. Lasers 2010, 37, 1708. [Google Scholar] [CrossRef]
Figure 1. Schematic diagram of the laser structure used in simulations.
Photonics 12 00408 g001
Figure 2. Flowchart of lower-energy-level algorithm (LELA).
Photonics 12 00408 g002
Figure 3. Simulation results of the two algorithms at a pump power of 80 W. (a) No--lower-energy-level algorithm. (b) Lower-energy-level algorithm.
Photonics 12 00408 g003
Figure 4. Simulation results of two algorithms at pump power of 90 W. (a) No-lower-energy-level algorithm. (b) Lower-energy-level algorithm.
Photonics 12 00408 g004
Figure 5. Simulation results of two algorithms at pump power of 100 W. (a) No-lower-energy-level algorithm. (b) Lower-energy-level algorithm.
Photonics 12 00408 g005
Figure 6. Experimentally measured pulse power waveform at a pump power of 100 W.
Photonics 12 00408 g006
Figure 7. Variation in the upper-level population and inversion population in LELA under a pump power of 100 W.
Photonics 12 00408 g007
Figure 8. Variation trend of the inversion population in NLELA under a pump power of 100 W.
Photonics 12 00408 g008
Figure 9. Variation trend of lower-level population in NLELA under a pump power of 100 W.
Photonics 12 00408 g009
Table 1. Comparison of pulse parameters between the two algorithms (LELA and NLELA) with and without considering the lower energy level.
NLELALELAPeak Power RatioPulse Energy Ratio
Pump Power (W)Peak Pulse Power (kW)Pulse Width (ns)Pulse Energy (μJ)Peak Pulse Power (kW)Pulse Width (ns)Pulse Energy (μJ)
80238184128.8105.61.921.74
90416.6270.6216.6138.61.951.95
100666.5429345.9200.61.942.14
Table 2. Comparison between the main pulse and sub-pulse parameters in LELA (accounting for the lower energy level).
Main PulseSub-PulsePeak Power RatioPulse Energy Ratio
Pump Power (W)Peak Pulse Power (kW)Pulse Width (ns)Pulse Energy (μJ)Peak Pulse Power (kW)Pulse Width (ns)Pulse Energy (μJ)
80128.8105.60.3837227.5831.333.83
90216.6138.60.7036847.8029.872.90
100345.9200.60.9044439.7837.615.04
Disclaimer/Publisher’s Note: The statements, opinions and data contained in all publications are solely those of the individual author(s) and contributor(s) and not of MDPI and/or the editor(s). MDPI and/or the editor(s) disclaim responsibility for any injury to people or property resulting from any ideas, methods, instructions or products referred to in the content.

