1. Introduction
Topological nanophotonics offers a path towards efficient and robust control over light on the nanoscale [
1]. Concepts borrowed from topological insulators, materials which host protected surface states for electrons, can also be applied to photonic systems. Following theoretical proposals [
2,
3], protected photonic modes, reliant on a explicit time-reversal symmetry breaking component, have been demonstrated experimentally [
4]. However, these require strong magnetic fields or complex materials with a large magneto-optical response, which makes such systems difficult to miniaturise. More recently, these effects have been proposed using graphene [
5,
6], which naturally has a large magneto-optical response. This is limited to the infrared regime, however, which restricts potential applications. Methods of achieving topological protection through the crystalline symmetry of a system whilst preserving time-reversal symmetry are therefore appealing, since they do not require complex setups and are not restricted to a specific frequency regime. These effects fall into two main categories: valley effects, which rely on extrema in the band structures of materials [
7,
8,
9], and pseudospin-dependent effects, which rely on the spin angular momentum texture of the electromagnetic fields [
10,
11].
First proposed in [
12], the pseudospin-dependent effect relies on a triangular lattice of hexamers to produce states reminiscent of the quantum spin Hall effect (QSHE) in topological insulators. This breathing honeycomb lattice has two gapped phases: the shrunken phase, where the hexamers are perturbed inwards, and the expanded phase, where they are perturbed outwards. Despite both having a trivial
index, the phases of the breathing honeycomb are topologically distinct—while the shrunken phase is a trivial insulator, the expanded one is an instance of an ”obstructed atomic limit” phase [
13,
14], and edge states will appear between regions in either phase. A direct analogy of the QSHE would produce purely unidirectional edge states, in the absence of spin-mixing impurities. However, as we showed in a previous work [
15], the edge mode directionality for near-field sources is source-position-dependent and is determined by the spin angular momentum of the modes: it is the local handedness of the elliptical field polarisation which determines the propagation direction of the edge modes, rather than an absolute pseudospin quantity as in the QSHE [
15]. This result is true for any bosonic breathing honeycomb lattice [
16], since it is rooted in time-reversal symmetry and the absence of Kramer’s degeneracy for bosons as opposed to fermions. There have been a range of experimental investigations on the breathing honeycomb photonic crystal [
17,
18,
19,
20], including the observation of edge modes in the visible regime [
21,
22]. Despite this, comprehensive theoretical studies of the directional excitation of pseudospin edge modes in the breathing honeycomb lattice based on an analysis of their inhomogeneous electromagnetic angular momentum are scarce; in particular, modelling with a circularly polarised incident beam, as used in recent experiments [
17,
21,
22] are needed.
In this article, we consider a plasmonic metasurface consisting of a two-dimensional array of metallic nanoparticles with a breathing honeycomb lattice. We first characterise the optical response of the bulk modes and then investigate the propagation properties of edge states which emerge at the interface between trivial and and non-trivial regions. We go beyond our previous work and extend the understanding of excitation by near-field sources by probing edge states with sources out of the plane. Furthermore, for the first time we theoretically characterise the directionality behaviour with far-field beams. We show that, for this regime, the propagation direction of the edge mode is determined by the interplay between beam polarisation and the electric field phase of the edge eigenmodes. With this, we unambiguously show that the position of the source or beam is critical in exciting a unidirectional mode with the breathing honeycomb lattice.
Whilst the results we present are in the plasmonic metasurface, we emphasise that the properties and behaviour of the edge states are valid for any classical wave system.
2. Methods
We model the system of subwavelength metallic nanoparticles (NPs) using the coupled dipole method. When the nearest neighbour spacing
R and NP radius
r satisfied
, each NP can be treated as a point dipole [
23,
24]. To model nanorods, we use spheroidal NPs with a radius
nm and height
nm. For NPs of this size and shape, it is necessary to include depolarization and radiative effects, so we use the Meier–Wokaun long wavelength approximation (MWLWA) to describe the the dipolar optical response of an individual NP [
25,
26]. The MWLWA polarisability
for spheroids is,
with the static polarisability
,
is the wave number and the environment is a homogeneous vacuum with
.
V is the NP volume and
D and
L are dynamic and static geometrical factors, and
is the spheroid half-axis;
,
and
for a sphere. The dielectric function
is given by the Drude model,
We use silver NPs, with
,
eV and
fs
meV [
27]. For a system of multiple NPs, we write a self-consistent coupled dipole equation, which describes the dipole moment of a NP due to neighbouring NPs as well as an incident electric field
,
The interactions between dipoles are characterised by the dyadic Green’s function [
28],
where
is the separation between dipole
i and
j,
and
. (The
represents a dyadic operator.) We only take the
-component of the Green’s function, which corresponds to interactions between dipole moments perpendicular to the separation between the NPs (i.e., out-of-plane). This is a valid approximation since we use spheroidal NPs, causing the in-plane modes to become well separated in frequency from the out-of-plane modes [
29]. For a periodic array of NPs in a plasmonic metasurface, we can apply Bloch’s theorem and write the following system of equations,
The vector
contains the out-of-plane dipole moments
of all NPs in the unit cell. The interaction matrix
has elements,
where
p,
q are unit cell indices. The summations run over the lattice sites
, with lattice vectors
and
. The interaction matrix has dimension
where
N is the number of NPs in the unit cell. Since the lattice sums are slowly converging, we use Ewald’s method to calculate them [
30,
31]. When modelling plasmonic metasurfaces, it is necessary to include the long range, retarded interactions in the Green’s function in Equation (
5). Whilst the quasistatic approximation can be used to model very subwavelength plasmonic chains and arrays [
32,
33], it fails to accurately capture the behaviour of modes at the light line and the radiative broadening and redshifting of modes, which becomes apparent in NPs with
nm. Additionally, retarded interactions can affect the topological properties of some plasmonic systems [
34,
35].
We calculate dipole moments by varying
and
for an incident field
using Equation (
6). We then calculate the extinction cross section
using the optical theorem,
The incident field satisfies Maxwell’s equations,
(we assume
and harmonic time dependence
). When the field is propagating, above the light line,
and when it is evanescent, below the light line,
. We can also solve Equation (
6) as an eigenvalue problem and calculate the spectral function, by letting
and again varying
and
, which allows us to probe modes whether they are bright or dark. The spectral function
is,
with the effective polarisability
for eigenvalues
[
33]. Finally, the coupled dipole method can also be applied to finite systems to model electromagnetic scattering [
36].
3. Optical Response of Bulk and Edge States
We begin by characterising the optical response of the periodic system, in order to later excite the finite system at the correct frequencies. The breathing honeycomb lattice setup is shown in
Figure 1a, with a unit cell with six NPs [
12]. In a honeycomb lattice,
, where
R is the nearest neighbour spacing, and
is the lattice constant. We let
nm, so the lattice constant
nm. The larger unit cell (compared to the rhombic Wigner–Seitz unit cell) folds the Brillouin zone and results in a double Dirac cone at
(as shown in
Appendix A,
Figure A1). We note that the Dirac cone lies below the localised surface plasmon frequency
due to chiral symmetry breaking and long-range interactions [
15]. By perturbing the nearest neighbour separation with a scale factor
s, such that
, a band gap is opened at
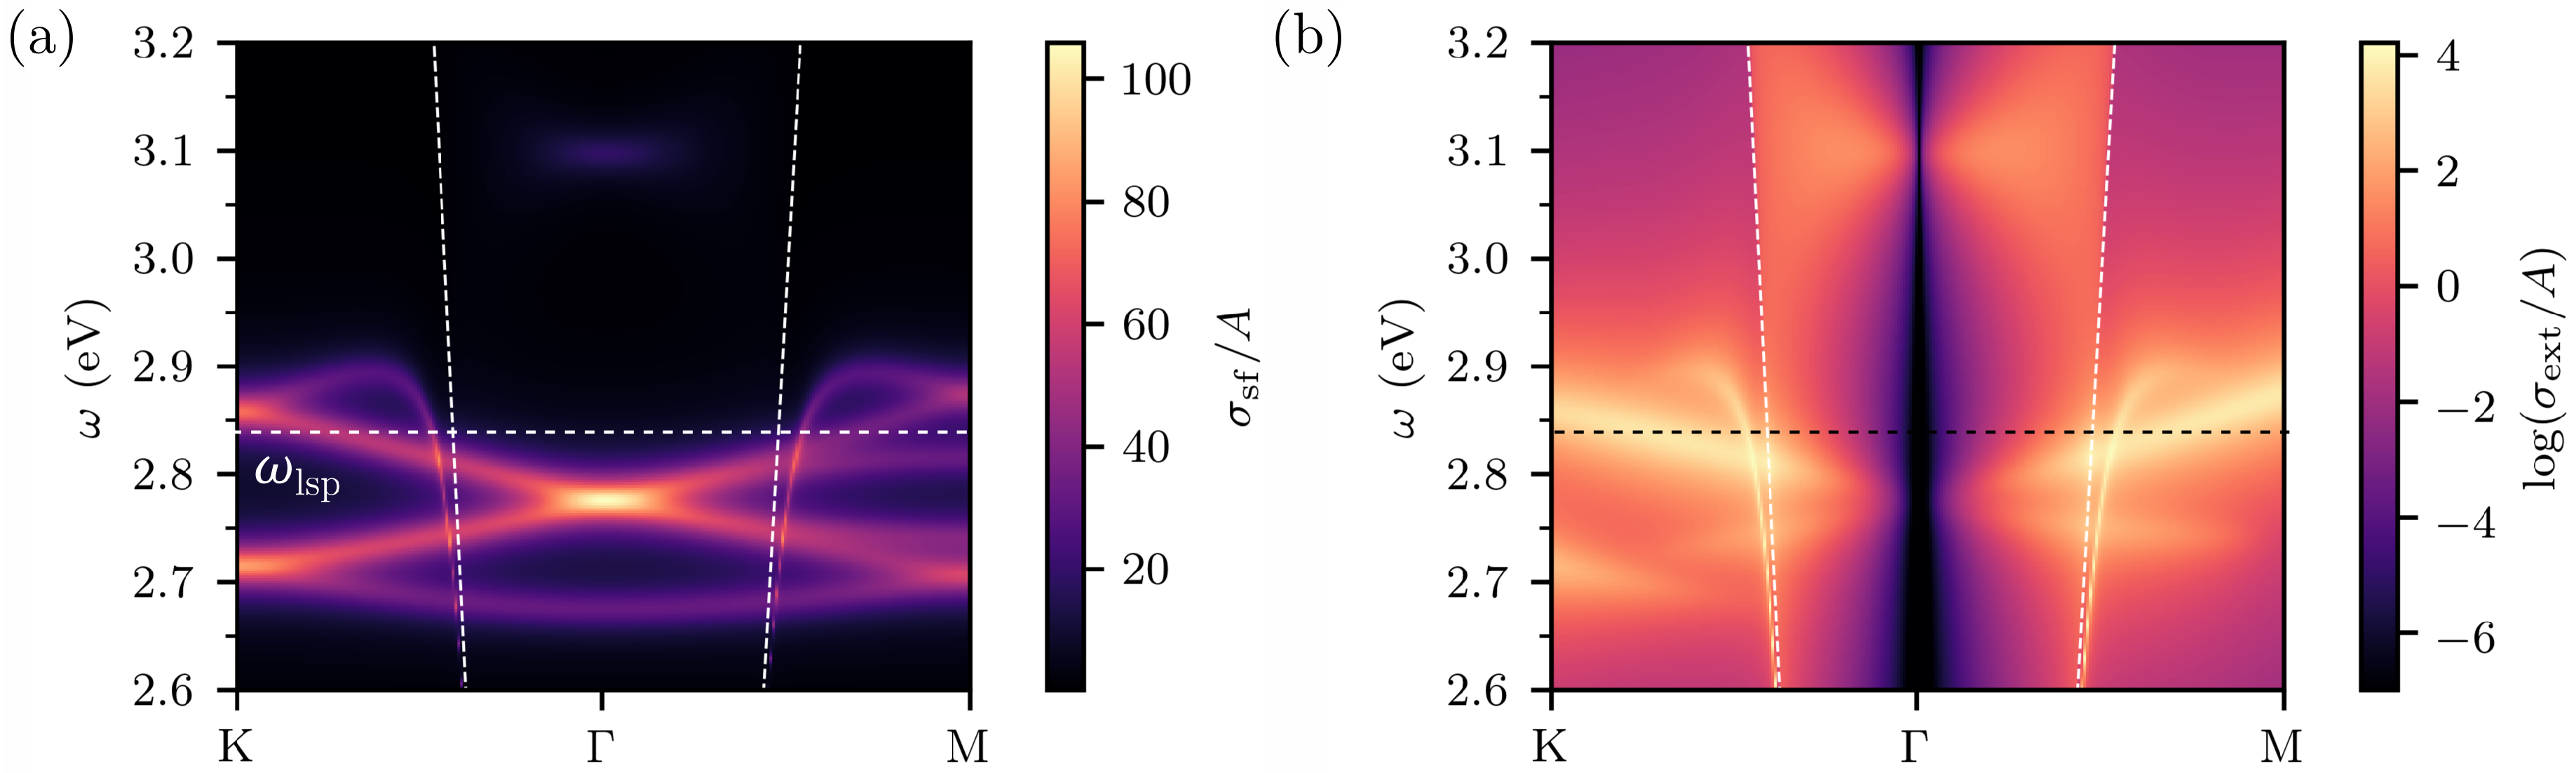
. In
Figure 1c,d we plot the extinction cross section
across the Brillouin zone for the shrunken (
) and expanded (
) lattices. The scale factors are chosen to ensure that the size of the band gaps for the two lattices are approximately equal. We plot the bands from the spectral function as blue dots on top of the extinction cross section as a guide. Below the light line (white dotted line), where modes are confined, the modes have high quality factors, whereas above the light line the modes are very broad, corresponding to larger radiative losses.
In the shrunken lattice, for
close to
, the NPs in the unit cell hybridise to form hexapoles, quadrupoles, dipoles and monopoles (from lowest energy to highest energy). The monopolar mode has dipole moments in phase, forming a bonding mode in the out-of-plane dipole moments across the whole lattice. As a result, it couples very strongly with the light line and exhibits a polariton-like splitting. We note that the ordering in this plasmonic metasurface is opposite to the photonic crystal due to the metallic nature of the NPs [
15]. A band inversion occurs around
between the shrunken and expanded phases, causing the dipolar and quadrupolar bands to flip. This is similar to the band inversion process in the QSHE. Although the bands become much broader above the light line, there is still a clear signature between shrunken and expanded phases, which is observable in the far-field, as has been shown previously [
15,
37]. We plot
for a fixed wavevector
in
Figure 1e, showing how the dipolar peak shifts between the two phases. The broad peak at the top corresponding to the monopolar mode does not shift. Unlike the QSHE, neither the shrunken or expanded lattices have a non-trivial
-invariant. Whilst it is possible to define an invariant by taking applying a perturbation theory about
[
12], when characterising the topological properties of the system, it is important to analyse all connected bands in a system. One way of doing this is with the application of topological quantum chemistry. The two phases of the system are still topologically distinct and are distinguishable by their Wilson loops [
38]. The shrunken lattice is topologically trivial, whilst the expanded lattice is in an photonic “obstructed atomic limit” phase [
13]; it is the
symmetry which provides the topological character.
Despite having trivial
-invariants, when regions in the shrunken phase are placed next to regions in the expanded phase, edge states will appear in the band gap due to the topological origin of the band inversion [
15]. These edge states are not topologically protected but do have a pseudospin character, which allows directional modes to be excited through a similar mechanism to the chiral light matter interactions in photonic crystals [
39]. We model the edge states of the system by setting up a ribbon with an interface between the two phases, as shown in
Figure 1b. The ribbon supercell is
unit cells along the
direction, with 10 unit cells in the expanded and shrunken phases, respectively. In
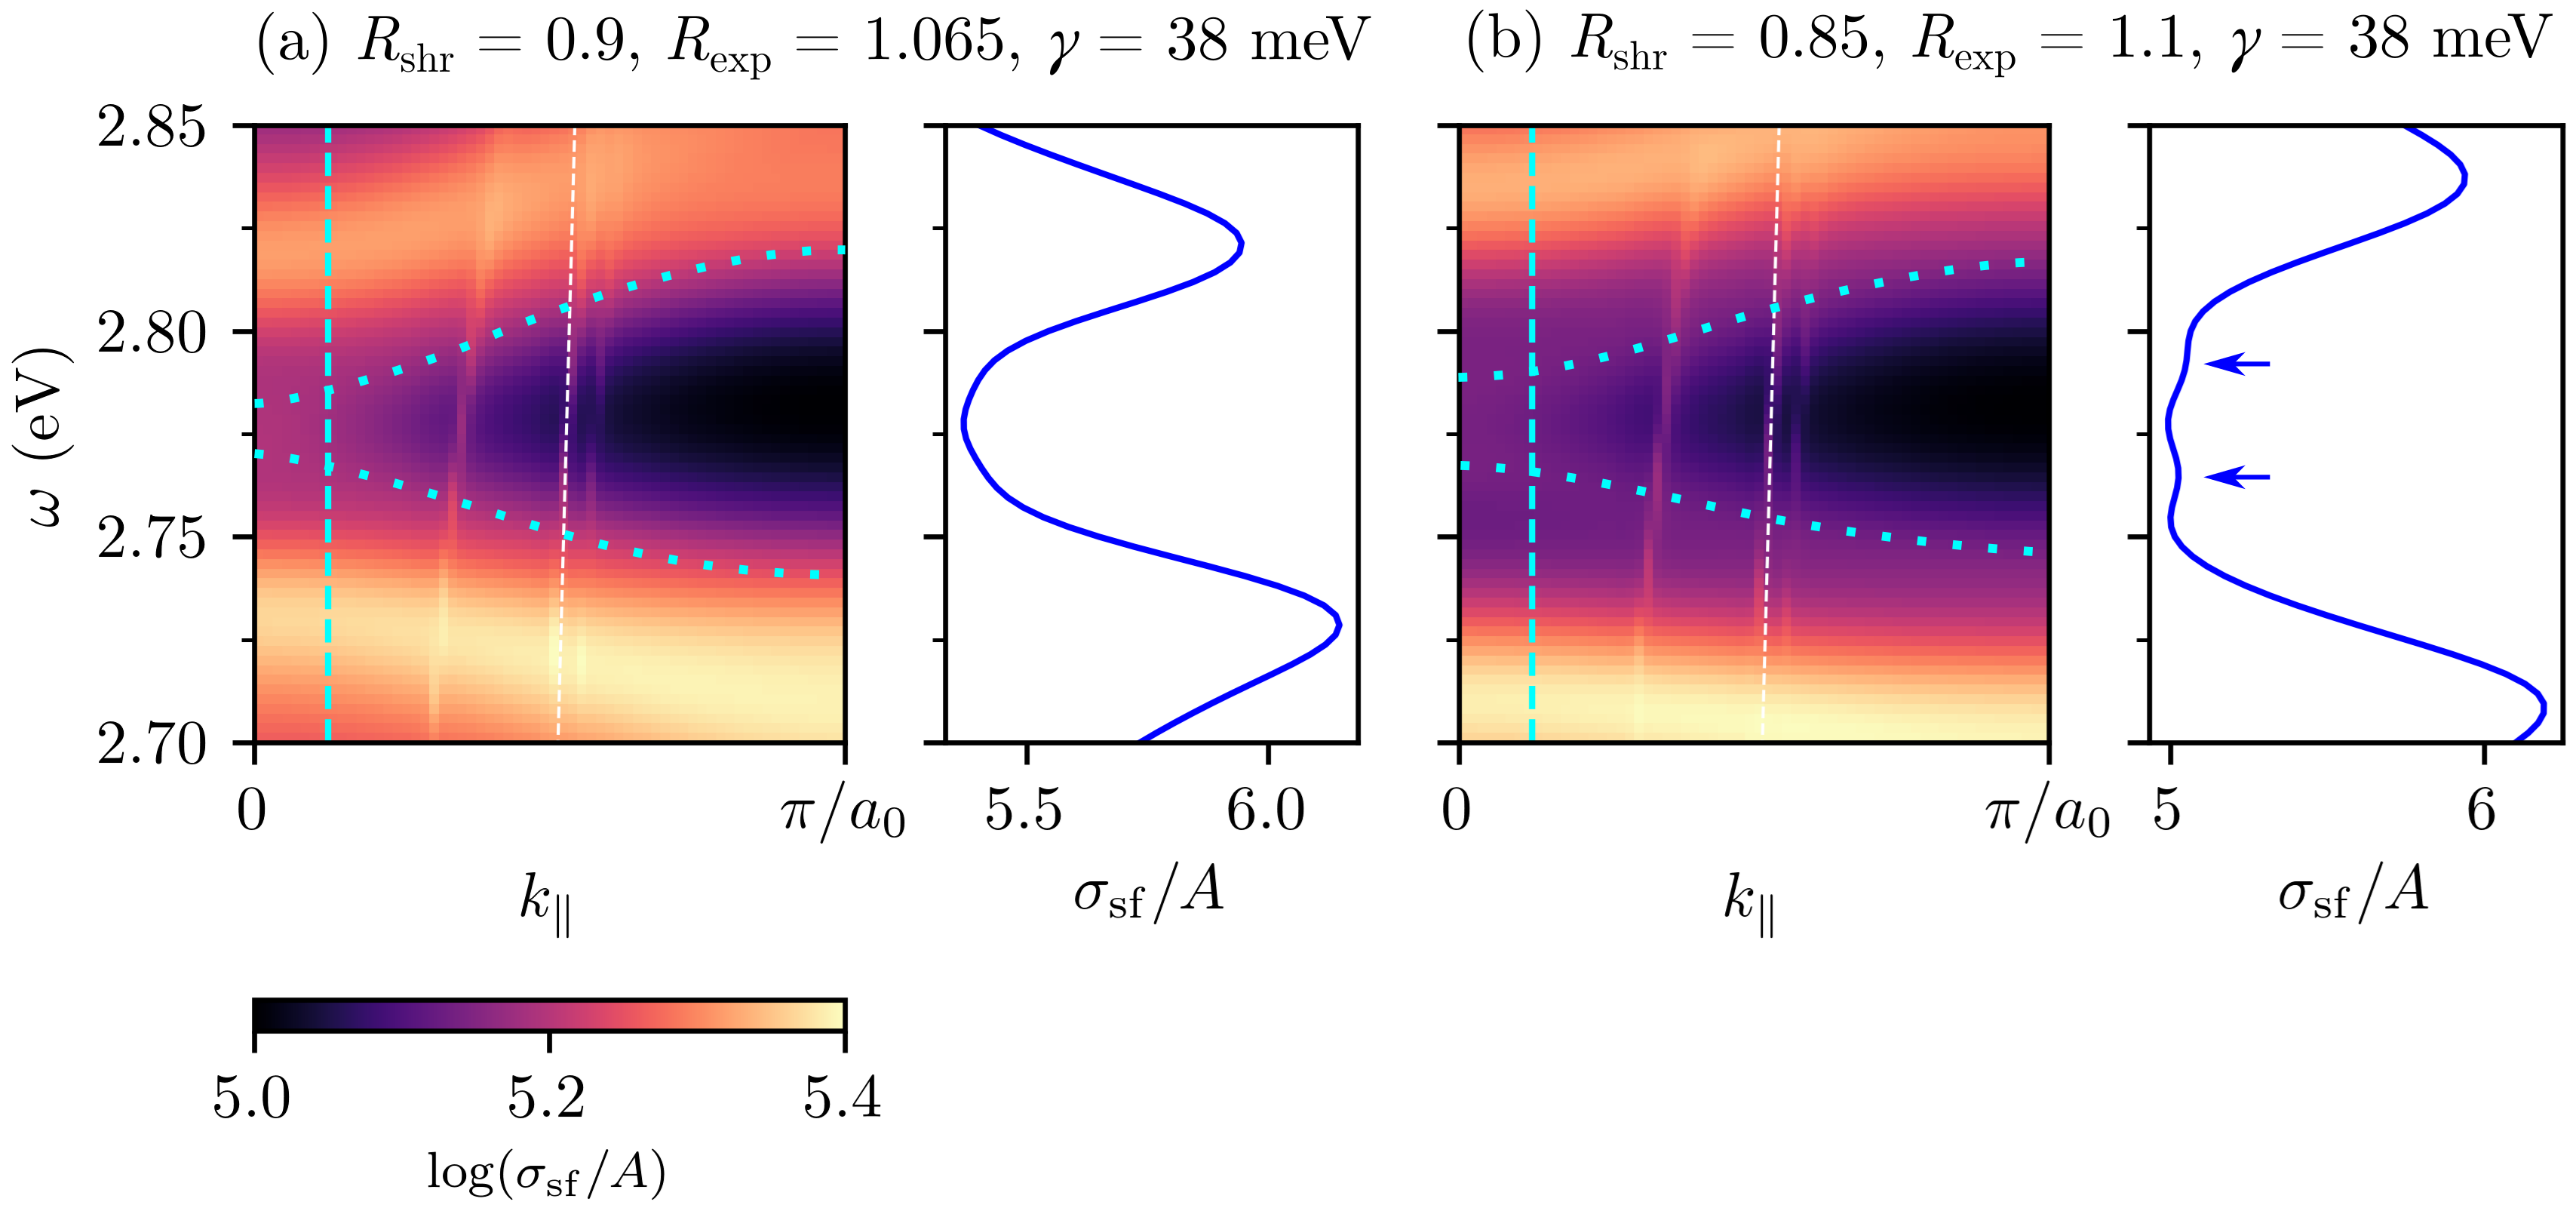
Figure 1f, we plot the spectral function
for the ribbon for
to
, with
meV, and we include plots for
meV in
Appendix B,
Figure A2. (The spectral function from
to
is identical.) Edge states appear in the band gap from
eV to
eV and a small minigap appears between
eV to
eV. The mini-gap appears due to the interface breaking
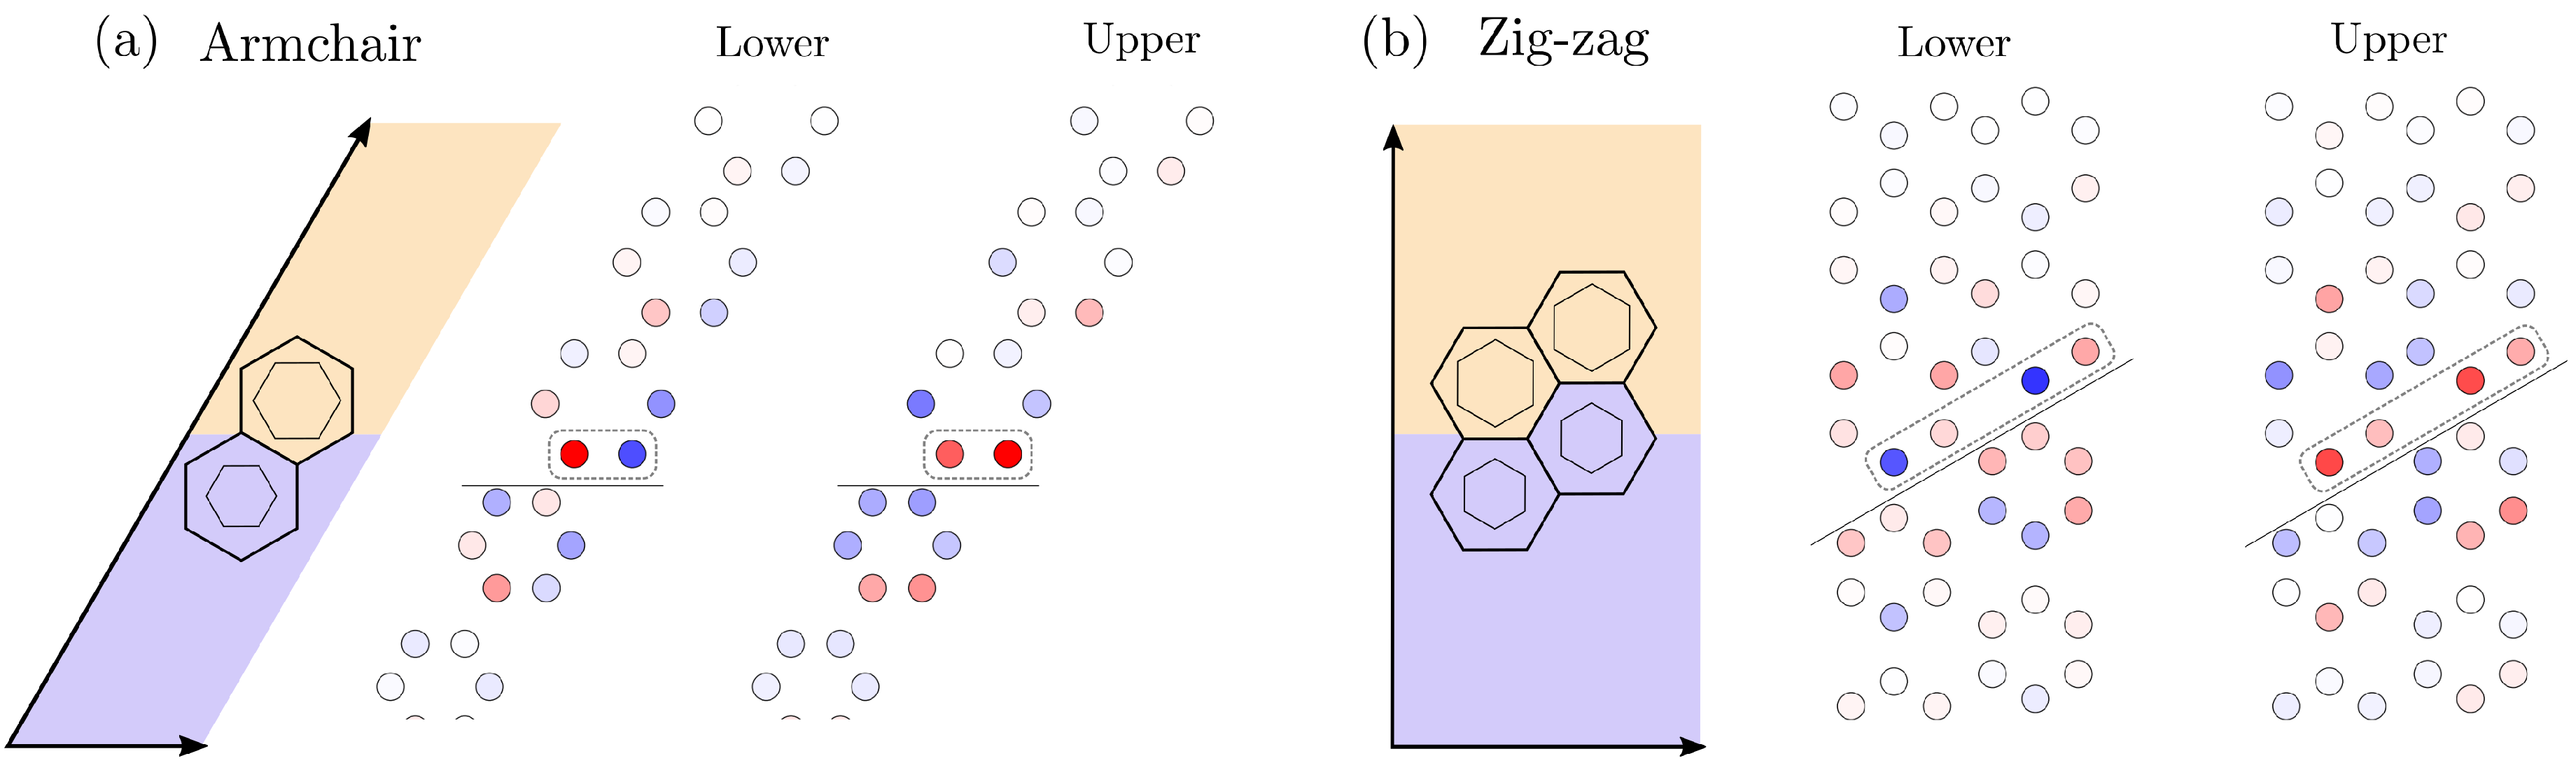
symmetry, which is the symmetry that protects the topological phase. We note that we use an “armchair” interface here but it is also possible to define other terminations for this lattice [
40], including the “zig-zag” interface [
11]. In the latter case, the
symmetry breaking across the interface is slightly smaller and results in a smaller mini-gap, but otherwise the behaviour of the edge states is qualitatively similar. This is evident in the hybridisation of NPs close to the interface: the lower band has an anti-bonding character whilst the upper band has a bonding character (we show these in
Appendix C,
Figure A3). Due to doubly-periodic supercell, we see multiple narrow bands bending down and crossing the band gap in
Figure 1f. This is due to diffraction orders above the light line (white dotted line) [
41] and does not affect the investigation of edge states, which follows.
4. Circularly-Polarized Point Sources
We begin by extending the investigation of our previous work [
15] by exciting the system with point sources with circularly-polarized magnetic fields,
. The directionality of modes is well understood for sources in the plane of the metasurface,
: The inhomogeneous spin angular momentum of the edge eigenmode determines the direction of propagation, rather than the polarization of the source. This means it is possible to selectively couple to either of the counter-propagating edge states by moving the source in the plane of the metasurface; a result which holds for any bosonic system with this lattice, including photonic crystals [
16] (we show this explicitly in
Appendix D). In an experimental setup, it would be difficult to place sources in the plane of the metasurface. For example, a setup may have quantum dots or emitters, or a 2D material, placed on top of a spacing layer above the NPs in the metasurface. Therefore, it is important to characterise the coupling and directionality into the edge modes of sources that are outside of the metasurface place.
Experimentally, it is challenging to realise circularly-polarized magnetic dipoles at optical frequencies and in nanoscale setups, which would be required to excite directional modes in our metasurface by near-field sources. Previous experiments showed the coupling of Zeeman-induced circularly-polarized excited states of quantum dots to the directional edge modes in a photonic crystal [
19]. However, the directionality in our metasurface is related to the circular polarisation of the in-plane magnetic field, meaning a magnetic rather than electric point source is required. At low frequencies, these sources have been realized by means of coaxial cables [
20,
42]. On the other hand, magnetic transitions in the optical regime can be realized with rare earth ions [
43], although these are usually linearly-polarized transitions. A recent proposal makes use of two anti-parallel atomic dipoles to generate a magnetic dipole at optical frequencies [
44,
45], which could be extended to circular polarization, and possibly realized with quantum dots. Alternatively, the magnetic resonance of split-ring resonators could be engineered to provide the required source. In the following section, we assume a simple model and use a dielectric NP as source, given that they support a magnetic dipole mode [
46], which could be excited with a circularly polarised wave. Provided the system can be modelled in the dipole approximation with subwavelength resonators and point dipole sources, the following results are valid regardless of the physical nature of the source or frequency regime. Therefore, our main conclusions also apply to metasurfaces made of microwave [
20,
42] or Mie resonators [
47].
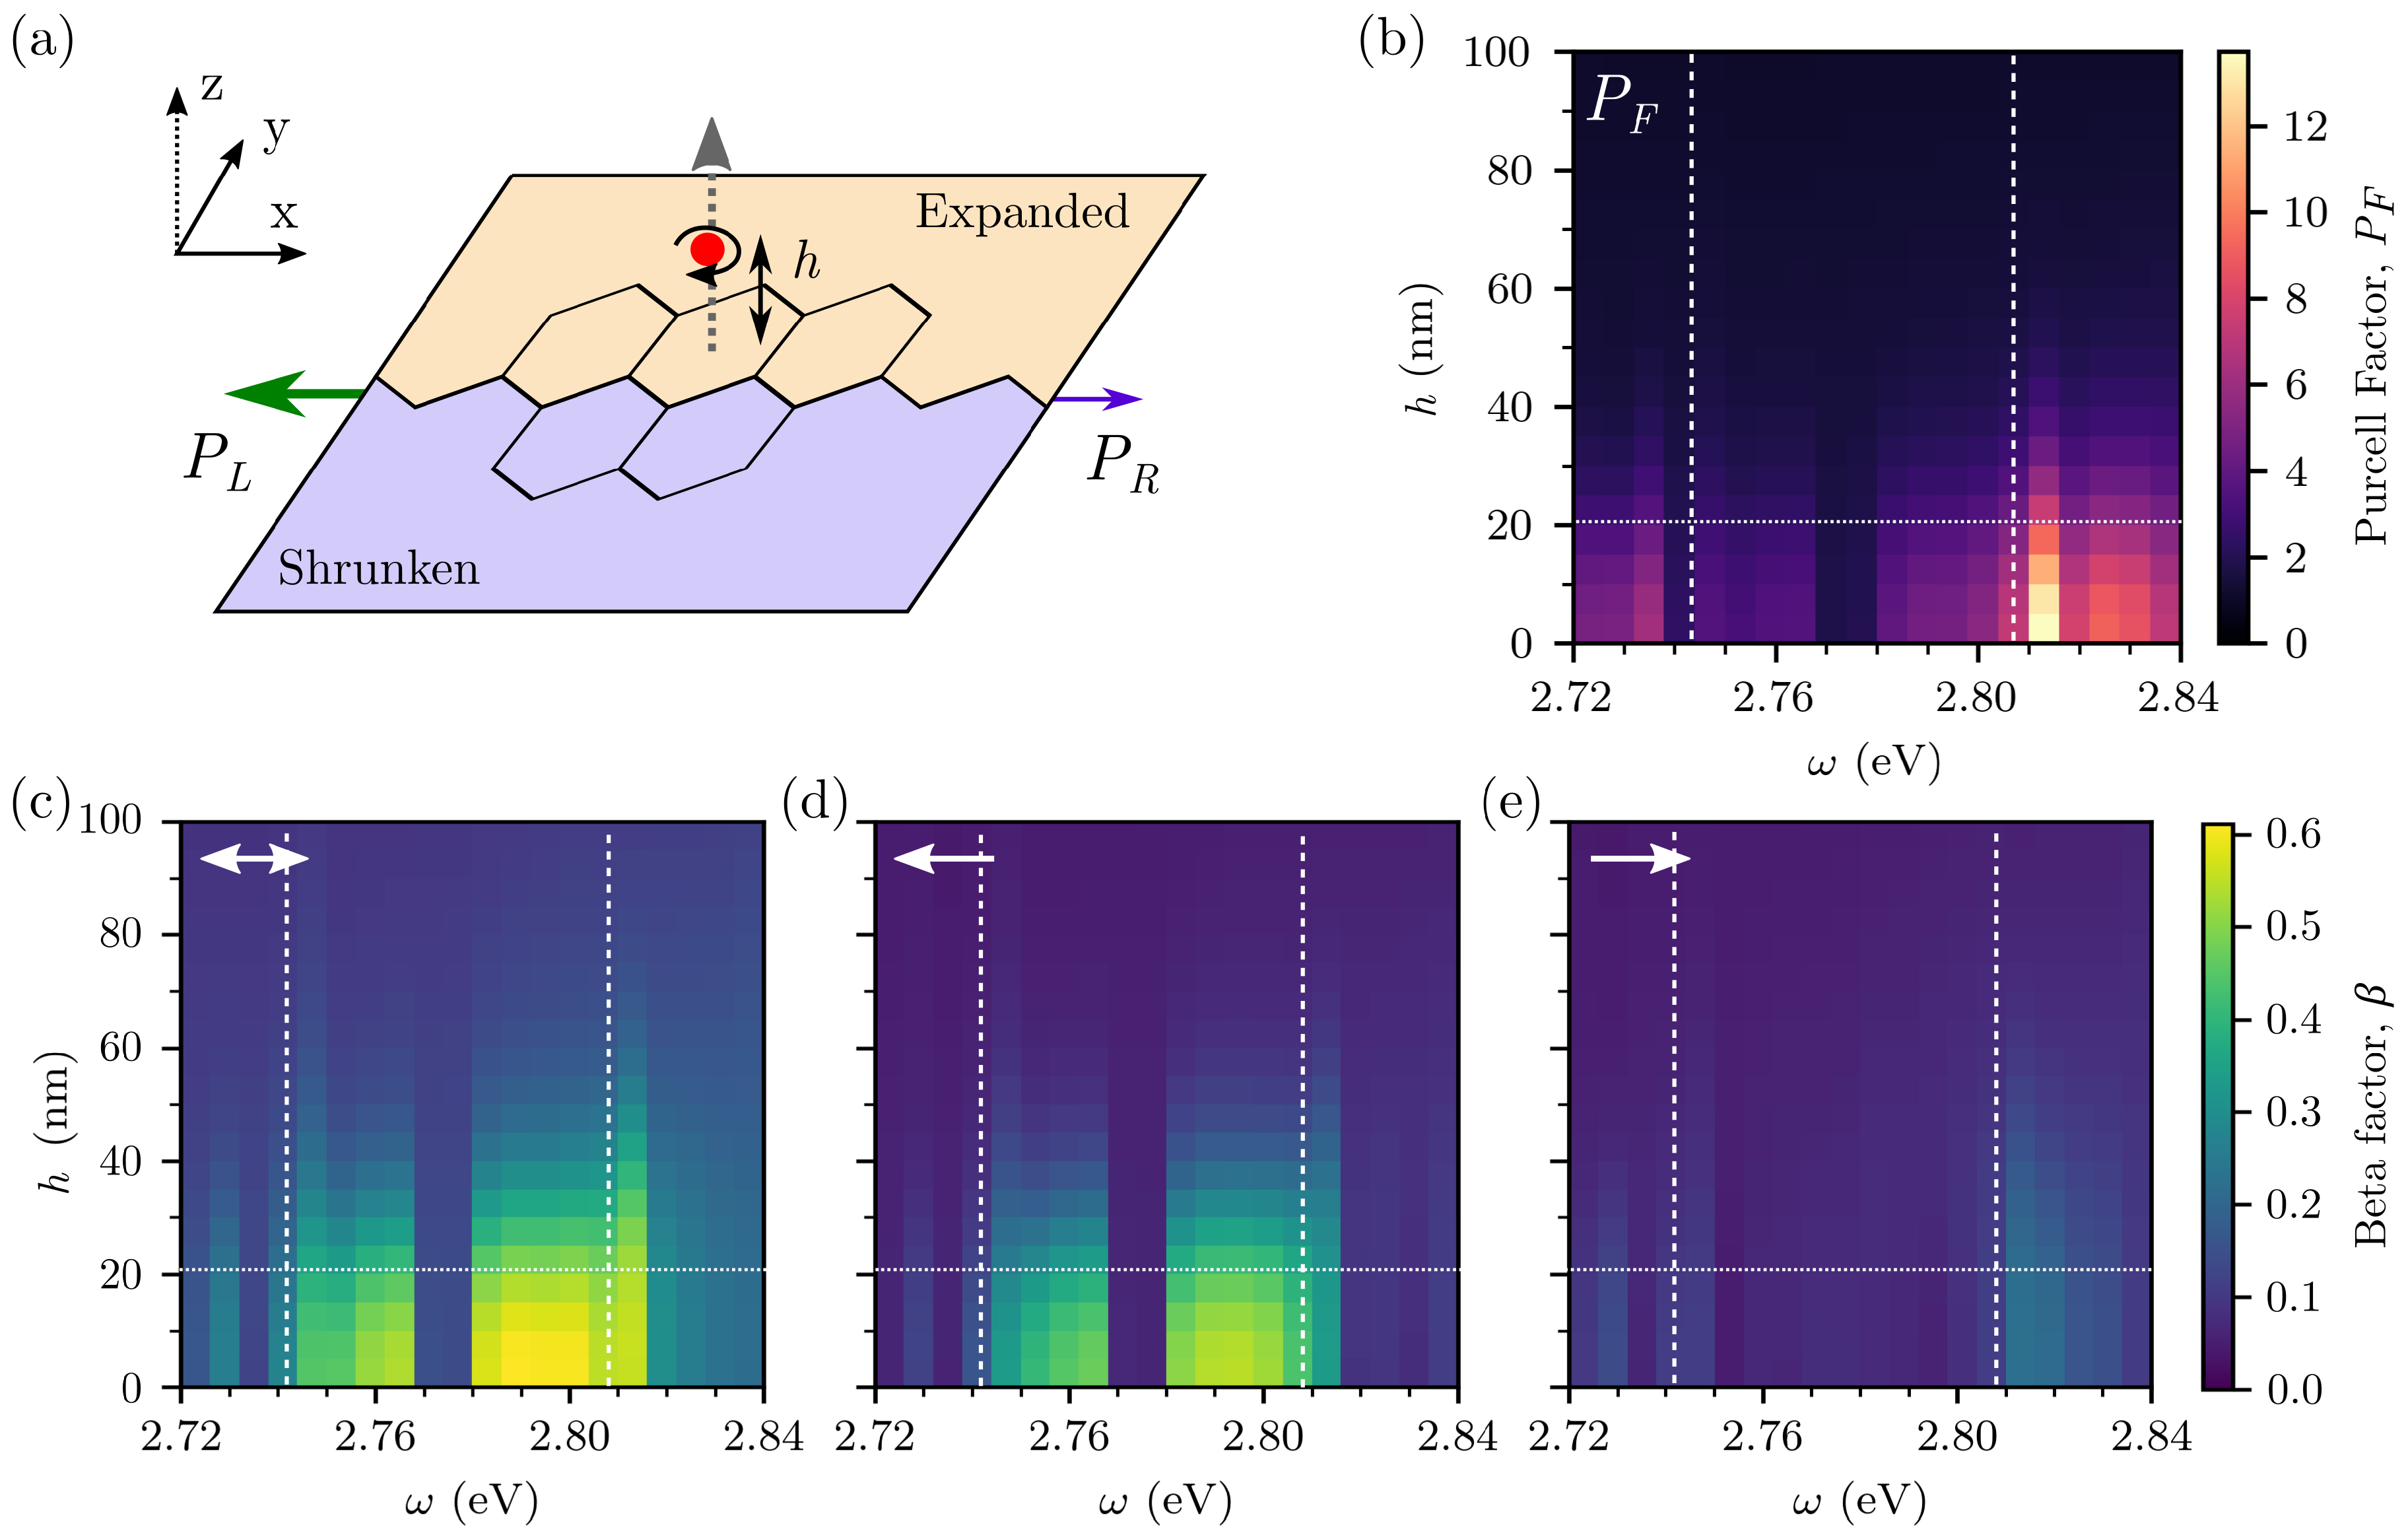
The scattering setup is shown in
Figure 2a. The source position is moved to various heights
h in the
z-direction and the
-position is fixed at the centre of the expanded unit cell, as shown in
Figure 2a. The power through the left (
) and right (
) channels is calculated, as well as the power radiated by the source. The material losses along the interface are set to zero to test the directionality behaviour and they are gradually increased at the edge of the sample to prevent backscattering. Increasing material losses will not affect the directionality behaviour, but will affect how far the mode propagates. We show this explicitly in
Appendix E,
Figure A5.
We define a
-factor to characterise the amount of power coupling into edge modes compared to the total power radiated by the source,
where
corresponds to power through the left or right channel, respectively.
is the power radiated by the source and
is the Purcell factor. The total power coupling into the edge is then
. If
, none of the energy radiated from the source couples into the edge mode, whereas if
all of the energy couples into the edge.
accounts for the enhancement of the emission of the source due to the environment through the Purcell factor [
43]. For a magnetic dipole, the emitted power in free space,
with vacuum permeability
and magnetic dipole moment
.
The source is placed initially at
nm and then moved upwards to
nm. We use a left circularly-polarized dipole throughout (
); which, in combination with the
-position at the centre of the expanded unit cell, means we expect it to couple to the left propagating edge mode. Additionally, we scan over the frequency range of the band gap to investigate whether exciting in the upper or lower band has an effect on the directionality. We measure the normalised power through
-planes perpendicular to both the metasurface and the interface. First, in
Figure 2b we plot the Purcell factor. (A horizontal white dashed line serves as a guide to the height of the NPs in the metasurface and the band gap is highlighted with vertical dashed lines). We see that the Purcell factor is greatest near the metasurface, since the array of NPs enhances the emission of the source by increasing the available local density of states (LDOS). For
nm, there is almost no coupling to the metasurface and
. Scanning across frequencies at
h close to zero, we can clearly see the minigap near
eV, where no NPs are excited, which causes
to decrease. Lastly,
is largest at
eV where the source begins to excite bulk modes.
Next, in
Figure 2c we plot
where it is clear that it is greatest for the edge state frequencies and smallest in the minigap and for bulk frequencies; in agreement with the spectral function of the edge states in
Figure 1f. A maximum of approximately
of the power emitted by the source couples into the metasurface at
, and the rest radiates into free space as the source emits in all directions and the bulk of the metasurface is gapped. As the source is moved upwards,
decreases and follows the same relationship as
, such that, for
nm, very little energy couples into the edge state. This confirms that the increase in
is due to the source coupling to the edge. Finally, in
Figure 2d,e we plot the beta factors for the left
and right
edge channels. As explained previously, since we use a left circularly-polarized source, which is initially placed at the centre of the unit cell, we expect and observe power flow predominantly through the left channel [
15]—i.e.,
. This pattern of directionality holds as the source is moved upwards.
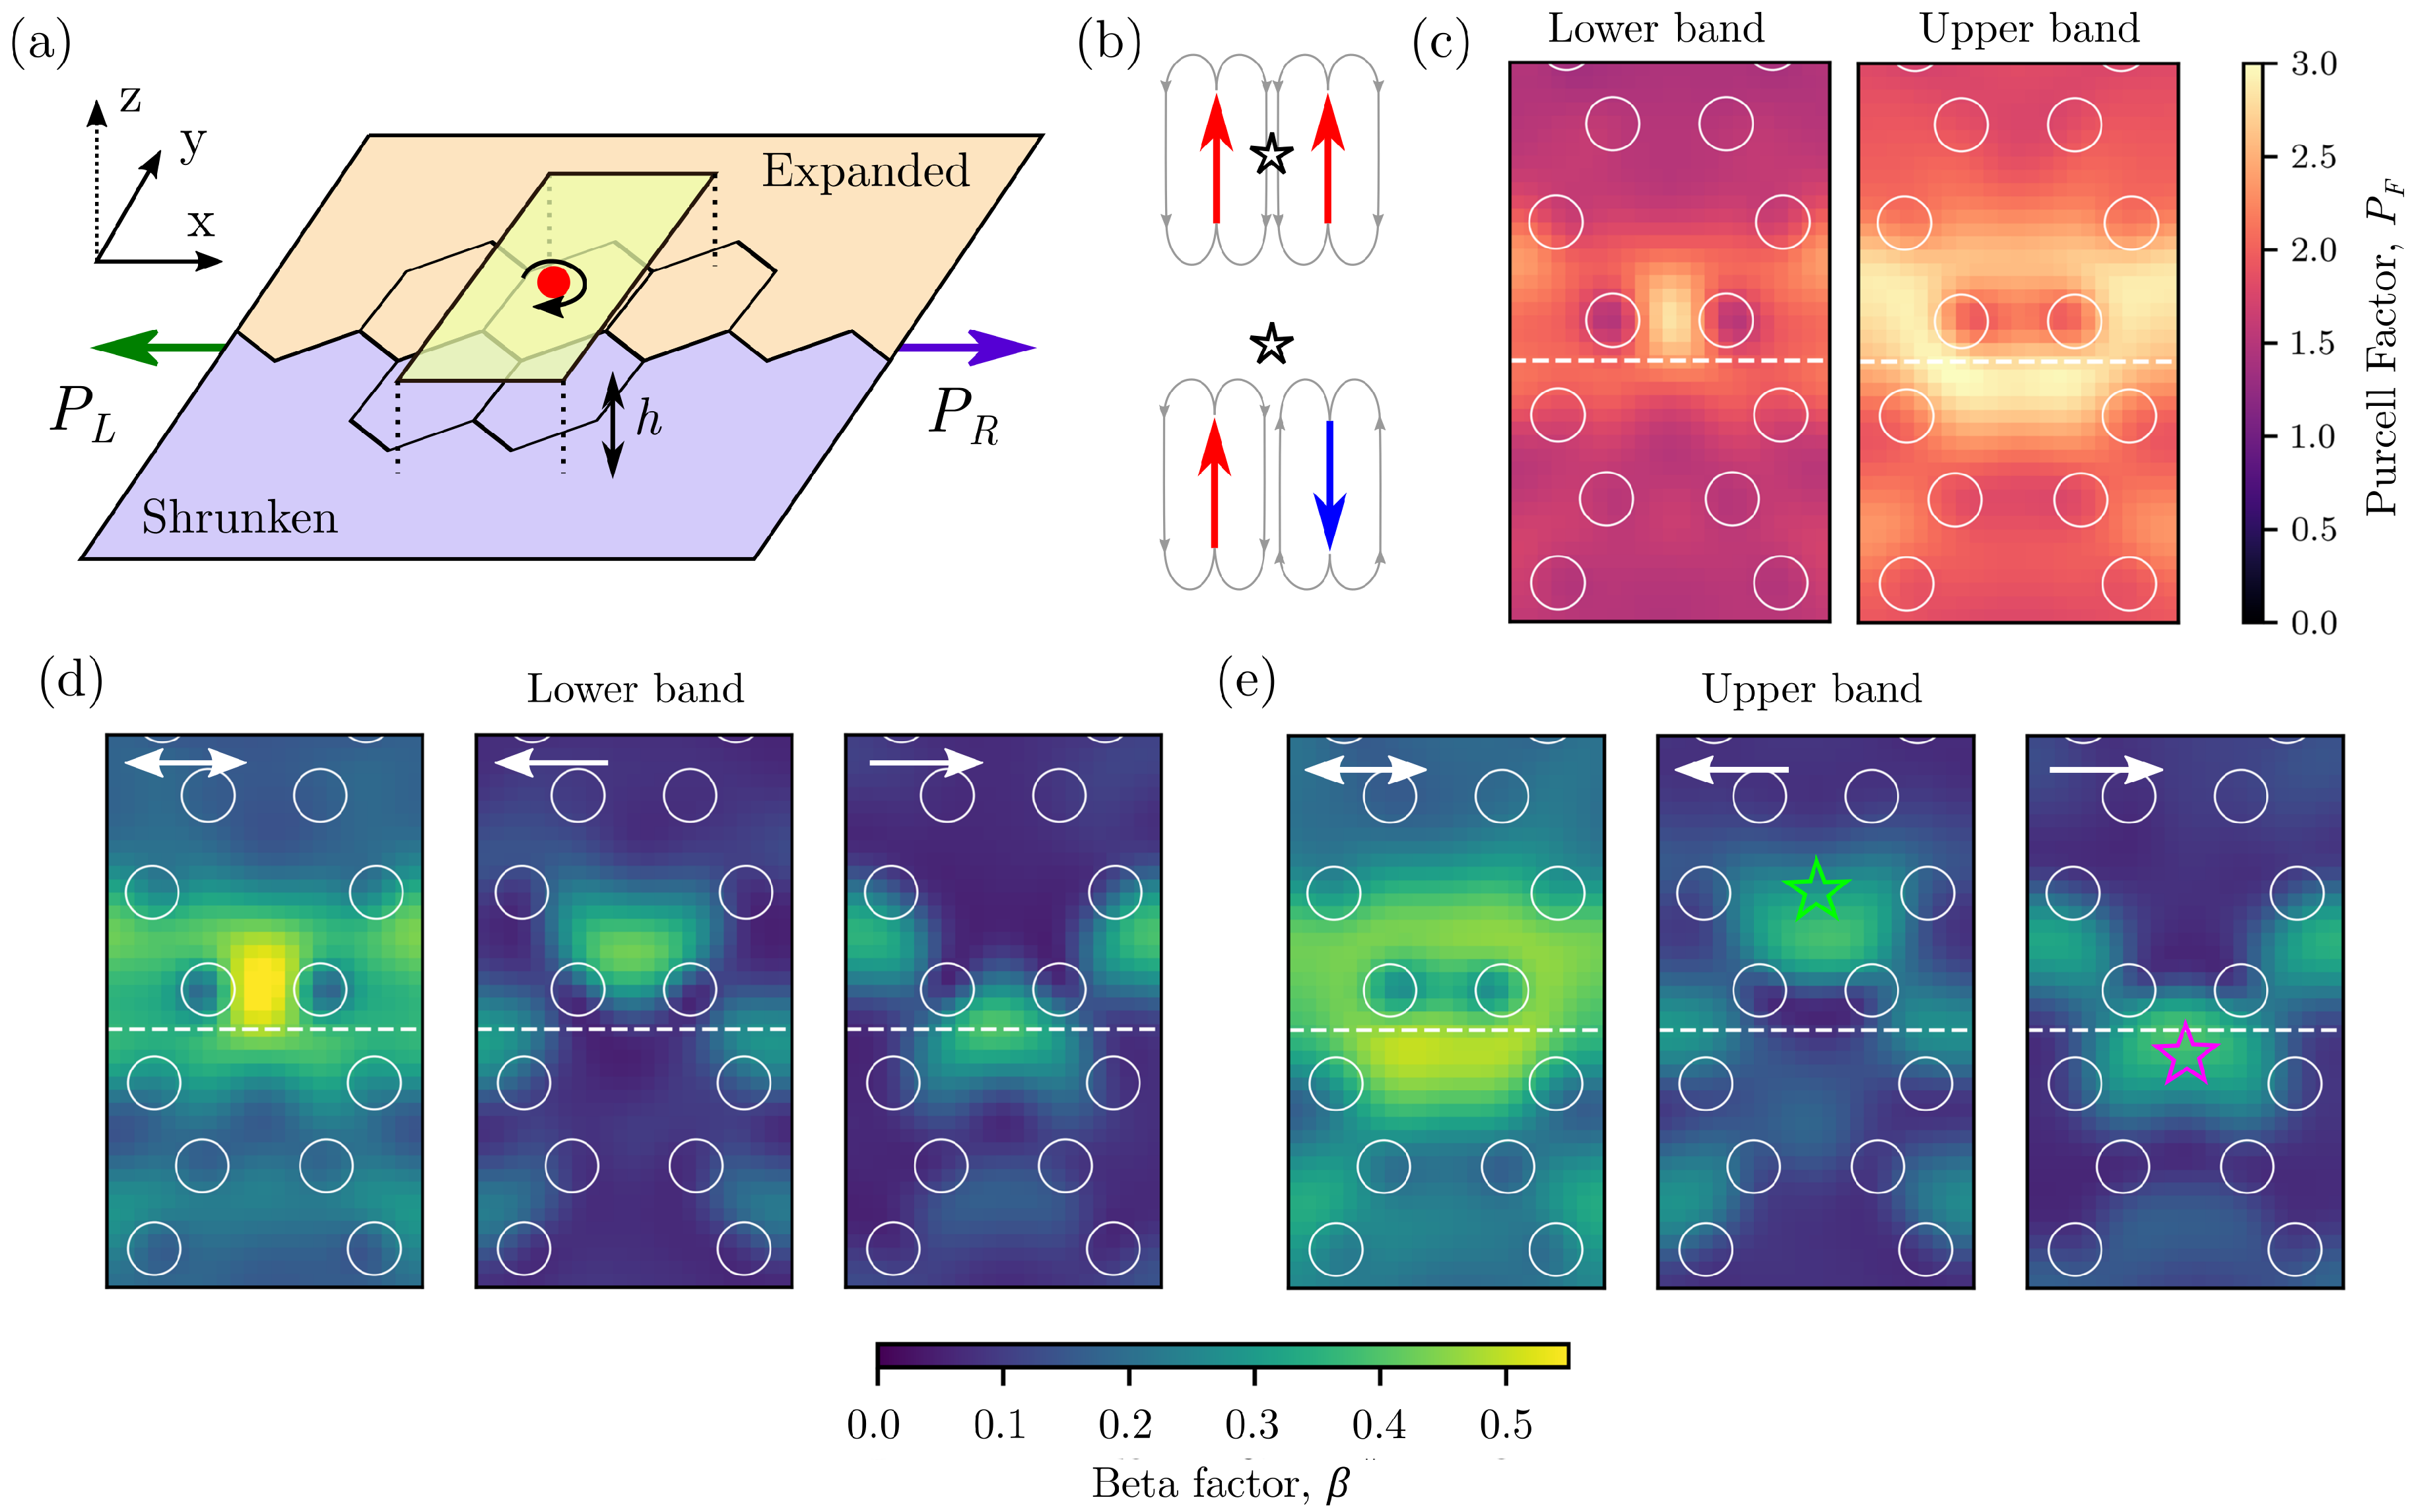
Following the understanding of directionality for sources at different heights, we now investigate the position dependence in a plane parallel to the metasurface. The sources are placed in a range of positions in the
plane at a fixed height,
nm, close to the interface, as shown in
Figure 3a. We choose this height to ensure a
nm gap between the top of the NPs and the excitation layer, and to ensure enough power couples into the edge. In an experimental setup, this gap will be dependent on the type of source used. We will excite the system at
eV and at
eV, and will refer to these from now on as the "upper band" and "lower band".
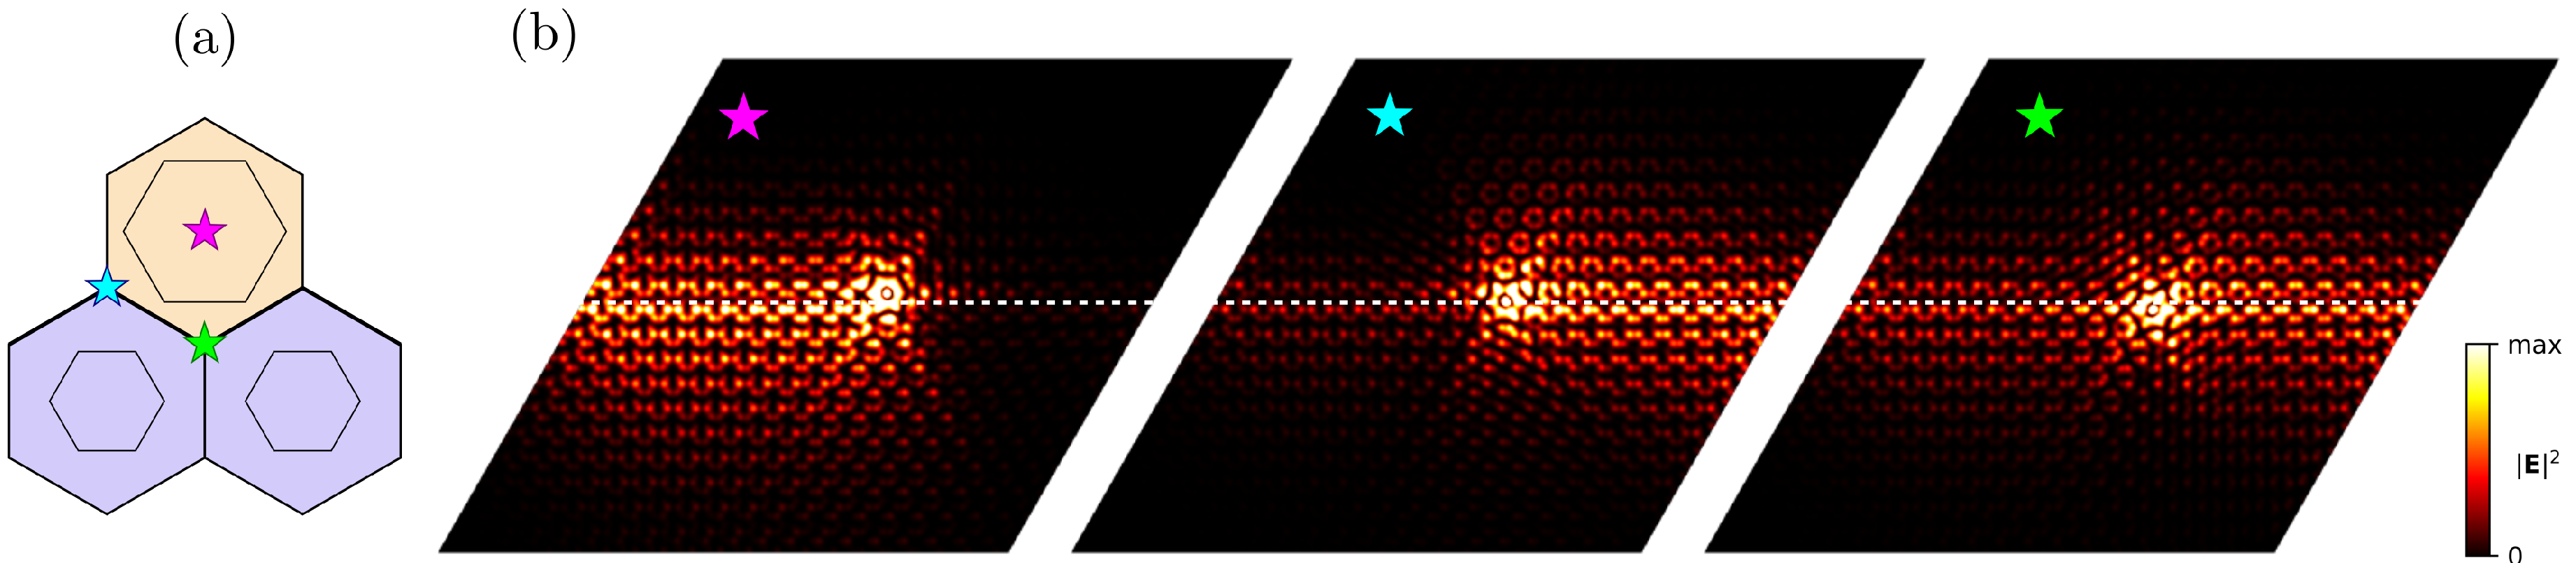
In
Figure 3c we plot the Purcell factor for the lower (left) and upper (right) bands: The pattern of each band is very different. From the ribbon eigenmodes in
Figure 1f (and
Appendix C,
Figure A3), we showed that the upper and lower bands have a bonding and anti-bonding character, respectively. In
Figure 3b we sketch the out-of-plane dipole moments for the two NPs closest to the edge. This shows how the electric field maxima and minima will be in different positions. For the anti-bonding mode, there is a maximum (star) at some position above the NPs and for the bonding mode, the maximum is between the NPs. This is reflected in the peaks of the Purcell factor. Furthermore, for both bands, the Purcell factor is the greatest at the interface which, again, is due to the LDOS being the greatest here. Away from the interface, it approaches unity, but there is still some emission enhancement due to the proximity to the metasurface. However, this means that sources placed far from the interface will not excite edge modes.
Finally, in
Figure 3d,e we plot the beta factors for the chosen frequencies in the lower and upper bands.
follows the same pattern as the Purcell factor. However, it is interesting to note that, despite the upper and lower bands having different
patterns, the position dependent directionality can still be seen in
(middle panels) and
(right panels). Specifically, for both bands, the coupling to the left propagating channel for a left circularly-polarized source is maximum when the source is above the centre of an expanded unit cell (lime star). As soon as the source is moved outside the hexamer of NPs (magenta star), it couples to the mode travelling in the opposite direction. For larger
h, this pattern will eventually be lost as the source couples less and less to the edge state.
5. Far-Field Circularly-Polarized Excitations
A number of experimental works have investigated the directionality of these edge states under far-field excitation in a range of frequency regimes [
17,
21,
22]. In each of these experiments, purely unidirectional modes are observed. Herein, we provide a detailed theoretical investigation of the directionality of edge modes with far-field excitations. We show that the position-dependent directionality also holds for far-field beams and that careful beam placement explains the unidrectionality observed in experiments. We investigate this behaviour by mimicking a circularly-polarized far-field Gaussian beam excitation with non-zero orbital angular momentum (OAM) incident on the metasurface. The NPs are excited with an incident electric field with a Gaussian intensity profile,
with,
where
r is centre of the beam,
w is the full width at half maximum (FWHM), and
is the angle in radians from the centre. The phase vortex in
corresponds to a left or right circular polarization.
In
Figure 4a, we plot the phase of the
z-component of the electric field of the edge eigenmodes: for the lower band, at
, and for the upper band, at
. A phase vortex structure is present across the interface, with clearly distinct regions at the centres of unit cells and at the edge of unit cells. Mode matching and maximum directionality occurs when the phase vortex of the beam rotates in the the same direction as the phase vortex of the edge eigenmode [
48]. These positions are highlighted as clockwise arrows. Mode mismatch occurs when the beam and eigenmode have vortices rotating in opposite directions, and these positions are shown as anti-clockwise arrows. When there is a complete mode mismatch, the beam will excite a mode travelling in the opposite direction. The phase vortex behaviour of directional edge states has previously been studied in the context of valley modes [
49,
50,
51,
52], where valleys at
K and
have vortices rotating in opposite directions.
To confirm this behaviour we will probe the finite system with the beam in Equation (
12). We let
nm, meaning the beam covers approximately one unit cell and the centre of the beam is moved over the red and blue paths, shown in
Figure 4b. As in the previous section, we excite the system at frequencies in the lower and upper bands at
eV and
eV. In
Figure 4c,d we plot the fraction of power through the left (
) and right (
) channels for the two bands (plots of the total power coupling to the edge modes in each case are shown in
Appendix F). Importantly, when the centre of the beam is at the centre of the expanded unit cell (
nm), the majority of power is through the left channel
, as was the case with point sources. Similarly, when the beam moves across the interface (
nm) the majority of power switches to the right channel
. Although we have only demonstrated this for two specific frequencies here, the position dependent directionality holds for frequencies across the band gap (as we show in
Appendix F,
Figure A6). The vortex map in
Figure 4a shows that it is possible to choose a path which maximises directionality, by avoiding traversing over phase singularities. In
Figure 4d we plot the power for the blue path shown in
Figure 4a. This path is similar to scanning perpendicularly across a zig-zag interface, as in [
21]. Compared to the red path, there is wider range of
y-values that yield the expected directionality. Finally, we emphasise that it is the relationship between the FWHM and the lattice constant, rather than the FWHM value itself, which is important. For beams with a FWHM which is much larger than the lattice constant, directionality is mostly lost since the beam expands to cover and excite the majority of the interface.
In an experimental setup, edge modes in the metasurface could be excited with a combination of a 2D layer and far-field beam. For example, valley-selective modes can be excited using a transition metal dichalcogenide on top of plasmonic metasurface [
53,
54,
55]. Along with the results from
Section 4, the directionality observed for far-field excitations suggests that a similar method could be employed to excite directional modes in the breathing honeycomb lattice.

 ,
, 


