Article

Comparison of the Non-Invasive Monitoring of Fresh-Cut Lettuce Condition with Imaging Reflectance Hyperspectrometer and Imaging PAM-Fluorimeter

1
Michurin Federal Scientific Center, 393766 Michurinsk, Russia
2
Faculty of Biology, Lomonosov Moscow State University, 119234 Moscow, Russia
3
Federal Scientific Agroengineering Center VIM, 109428 Moscow, Russia
4
Prokhorov General Physics Institute of the Russian Academy of Sciences, 38 Vavilova St., 119991 Moscow, Russia
*
Author to whom correspondence should be addressed.
Photonics 2021, 8(10), 425; https://doi.org/10.3390/photonics8100425
Submission received: 2 September 2021 / Revised: 25 September 2021 / Accepted: 1 October 2021 / Published: 3 October 2021

Abstract

:
We compared two approaches to non-invasive proximal sensing of the early changes in fresh-cut lettuce leaf quality: hyperspectral imaging and imaging of variable chlorophyll fluorescence contained in the leaves. The estimations made by the imaging techniques were confronted with the quality assessments made by traditional biochemical assays (i.e., relative water content and foliar pigment (chlorophyll and carotenoid) composition. The hyperspectral imaging-based approach provided the highest sensitivity to the decline of fresh-cut lettuce leaf quality taking place within 24 h from cutting. Using of the imaging pulse-amplitude modulated PAM chlorophyll fluorometer was complicated by (i) weak correlation of the spatial distribution pattern of the Qy parameter with the actual physiological condition of the plant object and (ii) its high degree of heterogeneity. Accordingly, the imaging PAM-based approach was sensitive only to the manifestations of leaf quality degradation at advanced stages of the process. Sealing the leaves in polyethylene bags slowed down the leaf quality degradation at the initial stages (<three days) but promoted its rate at more advanced stages, likely due to build-up of ethylene in the bags. An approach was developed to the processing of hyperspectral data for non-invasive monitoring of the lettuce leaves with a potential for implementation in greenhouses and packing lines.

1. Introduction

Producing high-quality vegetables for the consumer is a priority goal of any grower regardless of the company size and the farm setup. The highest quality of production needs to be assured at all stages of the production chain, from farm to table. This goal calls for the development of affordable and efficient, and preferably non-invasive techniques, for monitoring the quality of vegetable produce. A wide array of methods has been proposed for this task; currently the most widespread approaches are based on recording of light reflected by or chlorophyll (Chl) fluorescence emitted from leaf and/or fruits [1,2].
Light reflected by plant carries ample information about its biochemical composition, tissue architecture, and physiological condition [3]. Developmental changes in pigment composition as well as those induced by environmental stresses and attacks of phytopathogens manifest themselves as specific changes in plant reflection properties [4,5,6] linked with changes in pigment content and composition. Chlorophylls are central to capture and transform light energy in photosynthesis. Carotenoids (Car) are important for light harvesting and photoprotection [7]. Attempts to apply optical reflectance spectroscopy for the assessment of fruit and vegetable quality and their physiological state have been undertaken for decades [2]. The current understanding of plant spectral features stems mostly from the “point-type” measurements with conventional spectroradiometers and spectrophotometers [8]. Recent technical progress has paved the way for affordable imaging hyperspectrometers, providing spatially resolved spectral information on plants at different scales, from plant organs (leaves and fruits) to individual plants and ecosystems. In the past two decades, the hyperspectral reflectance image (HRI)-based technology has evolved into a powerful noninvasive inspection tool commercially available as instrumentation for packing lines [9,10]. Among the Chl fluorescence-based methods, measurements of the induction of Chl fluorescence and calculation of its derived parameter known as pulse-amplitude modulation (PAM) is the most widespread approach [11,12,13]. With the advent of imaging spectrometers and PAM fluorometers, a breakthrough was made in this field empowered by the devices of these type capable of capturing spatially resolved information about the object [14].
Nevertheless, the relationship between the changes in the parameters constituting what is perceived as the ‘quality’ of vegetable produce and the spectral reflectance or fluorescent data remains, in many cases, uncertain. This is exacerbated by a significant heterogeneity of the monitored parameter exhibited by plants even within a single leaf. There were also doubts that imaging hyperspectrometers can be useful for monitoring plant physiological responses [15]. These uncertainties and limitations stem from insufficient understanding of the relationships between biochemistry and morphology of plant tissues and their measured optical properties. Solving these problems is a prerequisite for a confident interpretation of reflectance images, development of computer vision and robotic systems for automated crop harvesting and grading [8].
In view of the challenges outlined above, we have compared two approaches to the monitoring of early changes in physiological condition and quality of freshly cut lettuce leaves. The first approach was based on imaging PAM, specifically the maximal photochemical quantum yield (Qy) of photosystem II was monitored [12,13]. This approach is focused on the functional diagnostics of the photosynthetic apparatus and is considered to be the most sensitive to rapid changes in the condition of photosynthetic organs and tissues of plants [12,16]. The second approach employed an imaging hyperspectral reflectometer and reflectance-based vegetation indices previously developed for monitoring of plant objects ([17,18]; the details on the vegetation indices used are given below in the Materials and Methods section). This approach is frequently used in remote sensing of plants. It has a significant potential for assessing the productivity of green parts of plants, biomass assessment, chlorophyll content and damage development [1]. We confronted the data acquired using both techniques with the results of traditional biochemical analyses (leaf tissue water content and pigment composition). We have proposed an original approach to process the image data and tested it in the experiment with stored fresh-cut lettuce leaves.

2. Materials and Methods

2.1. Plant Material and Cultivation

Lettuce (cvr. Revolution) plants were grown from commercially available seeds (Bayer, Nunhems) in two stages. The first stage was carried for 15 d out in a nursery on a turf substrate. The second stage was carried out in 1.2-L vessels in the same substrate for 20 d in vertical greenhouses (Panasonic, Japan). The fresh-cut plants were divided into two equal-sized groups: one was stored in conventional air atmosphere (another one was stored in the resealable polyethylene bags). Both sample groups were kept in a climatic chamber (Liebherr, Germany) at a constant temperature of 15 °C, relative humidity of 45%, and illuminated by white fluorescent tubes with PAR photon flux density of 50 µmol quanta m−2 s−1 as measured by LI-850 quantum meter (LiCOR, USA) at the leaf surface level. The plant parameters (see below) were measured at 0, 1, 4, 7, and 11 days of storage non-destructively. At the same time leaf samples were taken for the destructive relative water content (RWC), total chlorophyll (Chl) and carotenoid (Car) content, and fatty acid assays. The corresponding methods are described below. Three experiments, each made in triplicate, have been conducted (n = 9).

2.2. Relative Water Content Measurement and Pigment Analysis

Leaf RWC was assessed gravimetrically as described in [19]. Leaf samples were transferred to a glass-glass homogenizer with a chloroform-methanol (10 mL, 2:1, v/v) mixture and extracted to remove all pigment. The lipid fraction including Chl was separated according to Folch, et al. [20] according to the method of Solovchenko, et al. [21]. The chloroform phase was used for pigment analysis. Chl a and b were quantified using absorption coefficients for chloroform [22]. Average values with corresponding standard error values are presented in the figures and tables below. The significance of the average differences was tested using Student’s t-test in Origin Pro 2019 software (OriginLabs, Northampton, MA, USA).

2.3. Imaging PAM Measurements

The spatially resolved data on Chl fluorescence containing the induction curves of Chl fluorescence and their derived parameters were recorded and analyzed using a FluorCAM 800 imaging Pulse Amplitude Modulated (PAM) fluorometer (Photon Systems Instruments, Drasov, Czech Republic). The following setup was used in this work: a red (630 nm) LED light source, super pulse intensity of 6000 µmol quanta m−2 s−1, a high-sensitivity TOMI-1 CCD detector (spatial resolution 720 × 560 pixels; spectral range 400–1000 nm, PSI, Drasov, Čzech Republic). The measurements were carried out according to the protocol supplied with the manufacturer of the device essentially as described earlier [23]. Briefly, each plant was dark acclimated for 15 min and the chlorophyll fluorescence images were taken immediately after that.
The maximum potential photochemical quantum yield of photosystem II (Qy) was calculated as Qy = (Fm − Fo)/Fm = Fv/Fm [16]. The images were then masked, and non-fluorescing background was excluded by manual thresholding in the PAM imager software (Figure 1). The thresholding parameters were adjusting to exclude the Fv/Fm values below 0.2 representing the photosynthetically inactive background. The statistic treatment of the Qy and reflectance data (see Section 2.4), including the histogram analysis, has been carried in the Origin Pro 2019 software.

2.4. Hyperspectral Reflectance Image Recording and Analysis

The hyperspectral reflectance data-containing images of the lettuce plants were captured with a frame-based imaging hyperspectrometer IQ (SPECIM, Finland; Figure 2). For each pixel of the hyperspectral image, a reflectance spectrum (spectral range 400–1000 nm; spectral resolution 1 nm; 500 × 500 pixels/frame) was recorded against a reflectivity standard made of Spectralon under illumination with two 150 W cold daylight fluorescent lamps mounted in softboxes and supplemented with one 100 W incandescent lamp (Figure 2).
For each pixel of the hyperspectral images, two indices were computed. The first index, CI678, is among the most sensitive spectral indices indicative of Chl content, [Chl], of the sample [17]. It was calculated as follows:
CI 678 = R 800 R 678 ,
where R800 is the reflectance in a band in the near infra-red (NIR) region unaffected by pigment absorption of light and R678 is the reflectance in the band of the red Chl absorption maximum [24].
The second spectral index was PSRI, an index tightly related with [Car]/[Chl] ratio in the samples and, ultimately, indicative of the rate and stage of senescence of plant objects [17,18,25]:
PSRI = R 678 R 480 R 800 ,
where R800 is the reflectance in a band in the near infra-red (NIR) region unaffected by pigment absorption of light, R480 is the reflectance in a band affected by both [Car] and [Chl], and R678 is the reflectance in the band of the red Chl absorption maximum.
For each index and each hyperspectral image, histograms were calculated (Figures S2 and S4). The histograms were re-binned (integrated) over specific ranges, normalized to the total pixel number in the corresponding image and the time-courses of changes of the corresponding integral values (Figures S3 and S5) were analyzed using Origin Pro 2019 software (OriginLab, Northampton, MA, USA). As a result of the analysis, two combined hyperspectral indexes were developed. The first one is the CI678-based index HCI678 (hyperspectral chlorophyll index based on 678 nm band):
HCI 678 = 6 10 CI 678 ( 2 4 CI 678 ) 1
This index is essentially a ratio of the hyperspectral image area corresponding to the leaf surface with a high [Chl] (CI678 values above 6) to the area the leaf surface with a low [Chl] (CI678 values below 4).
The second one was the PSRI-based index HPSRI (hyperspectral plant senescence reflectance index):
HPSRI = 0.2 0.5 PSRI ( 0 0.1 PSRI ) 1
This index represents a ratio of the hyperspectral image area corresponding to the leaf surface with a high [Car]/[Chl] ratio (PSRI values above 0.2) to the area the leaf surface with a low [Car]/[Chl] content (PSRI values below 0.1). The indices HCI678 and HPSRI were used as non-invasively monitored markers of leaf quality to be confronted with the results of traditional biochemical assay and destructive RWC measurements. A more detailed discussion of the indexes and rationale for their construction is presented below.

3. Results

3.1. Changes in Water Content and Pigment Composition of the Leaves

The non-sealed lettuce leaves lost, under our experimental conditions, approximately a half of their water within one day of storage (Figure 3, closed symbols). Later, the dehydration of the leaves continued but at slower rate. By the end of the experiment the average RWC of the non-sealed leaves was around 0.2 i.e., the leaves lost 80% of their maximum water capacity. The leaves were visually wilted. By contrast, the leaves contained in PE bags retained most of their water content (Figure 3, open symbols) and remained turgescent throughout the observation period. Notably, the studied leaves exhibited a high degree of heterogeneity in their RWC content resulting in high SE values, especially in the case of non-sealed leaves at the advanced stages of the experiment.
The storage of the fresh-cut lettuce leaves was accompanied by characteristic changes in their content and composition (Figure 4). The fresh lettuce leaves were characterized by a [Chl] of 1000–1500 µg/g FW and a correspondingly high [Car] (Figure 4c). By contrast, the decline in quality of the stored leaves was accompanied by a decline in [Chl] but the decline in [Car] was slower resulting in the increase of [Car]/[Chl] (Figure 4d). The stored leaves exhibited a decline in their [Chl] regardless of storage conditions. In the non-sealed lettuce leaves, Chl degradation occurred at a slightly faster rate (Figure 4a). The changes in [Car] recorded during the experiment followed a more complex pattern (Figure 4b). [Car] increased by 30% for the first four to seven days of the experiment and underwent a sharp decline during the remaining time of the experiment. Notably, in the PE-sealed leaves the transient increase in [Car] took place later and its magnitude was lower than that observed in the non-sealed leaves. The same patterns of pigment transformation were revealed when the leaf [Car] was plotted vs. [Chl] (Figure 4c).
In frame of a more advanced approach allowing to estimate the rate of plant senescence [18], we also analyzed the trend of [Car]/[Chl] ratio plotted vs. leaf [Chl] (Figure 4d). In this approach, an increase in [Car] over that of [Chl] visually manifesting itself as yellowing of leaves is used as a marker of plant tissue senescence [18,26]. Overall, the studied leaves demonstrated a close rate of pigment transformation typical for senescence, but the magnitude of these changes was smaller in the PE-sealed leaves (Figure 4d, open symbols).

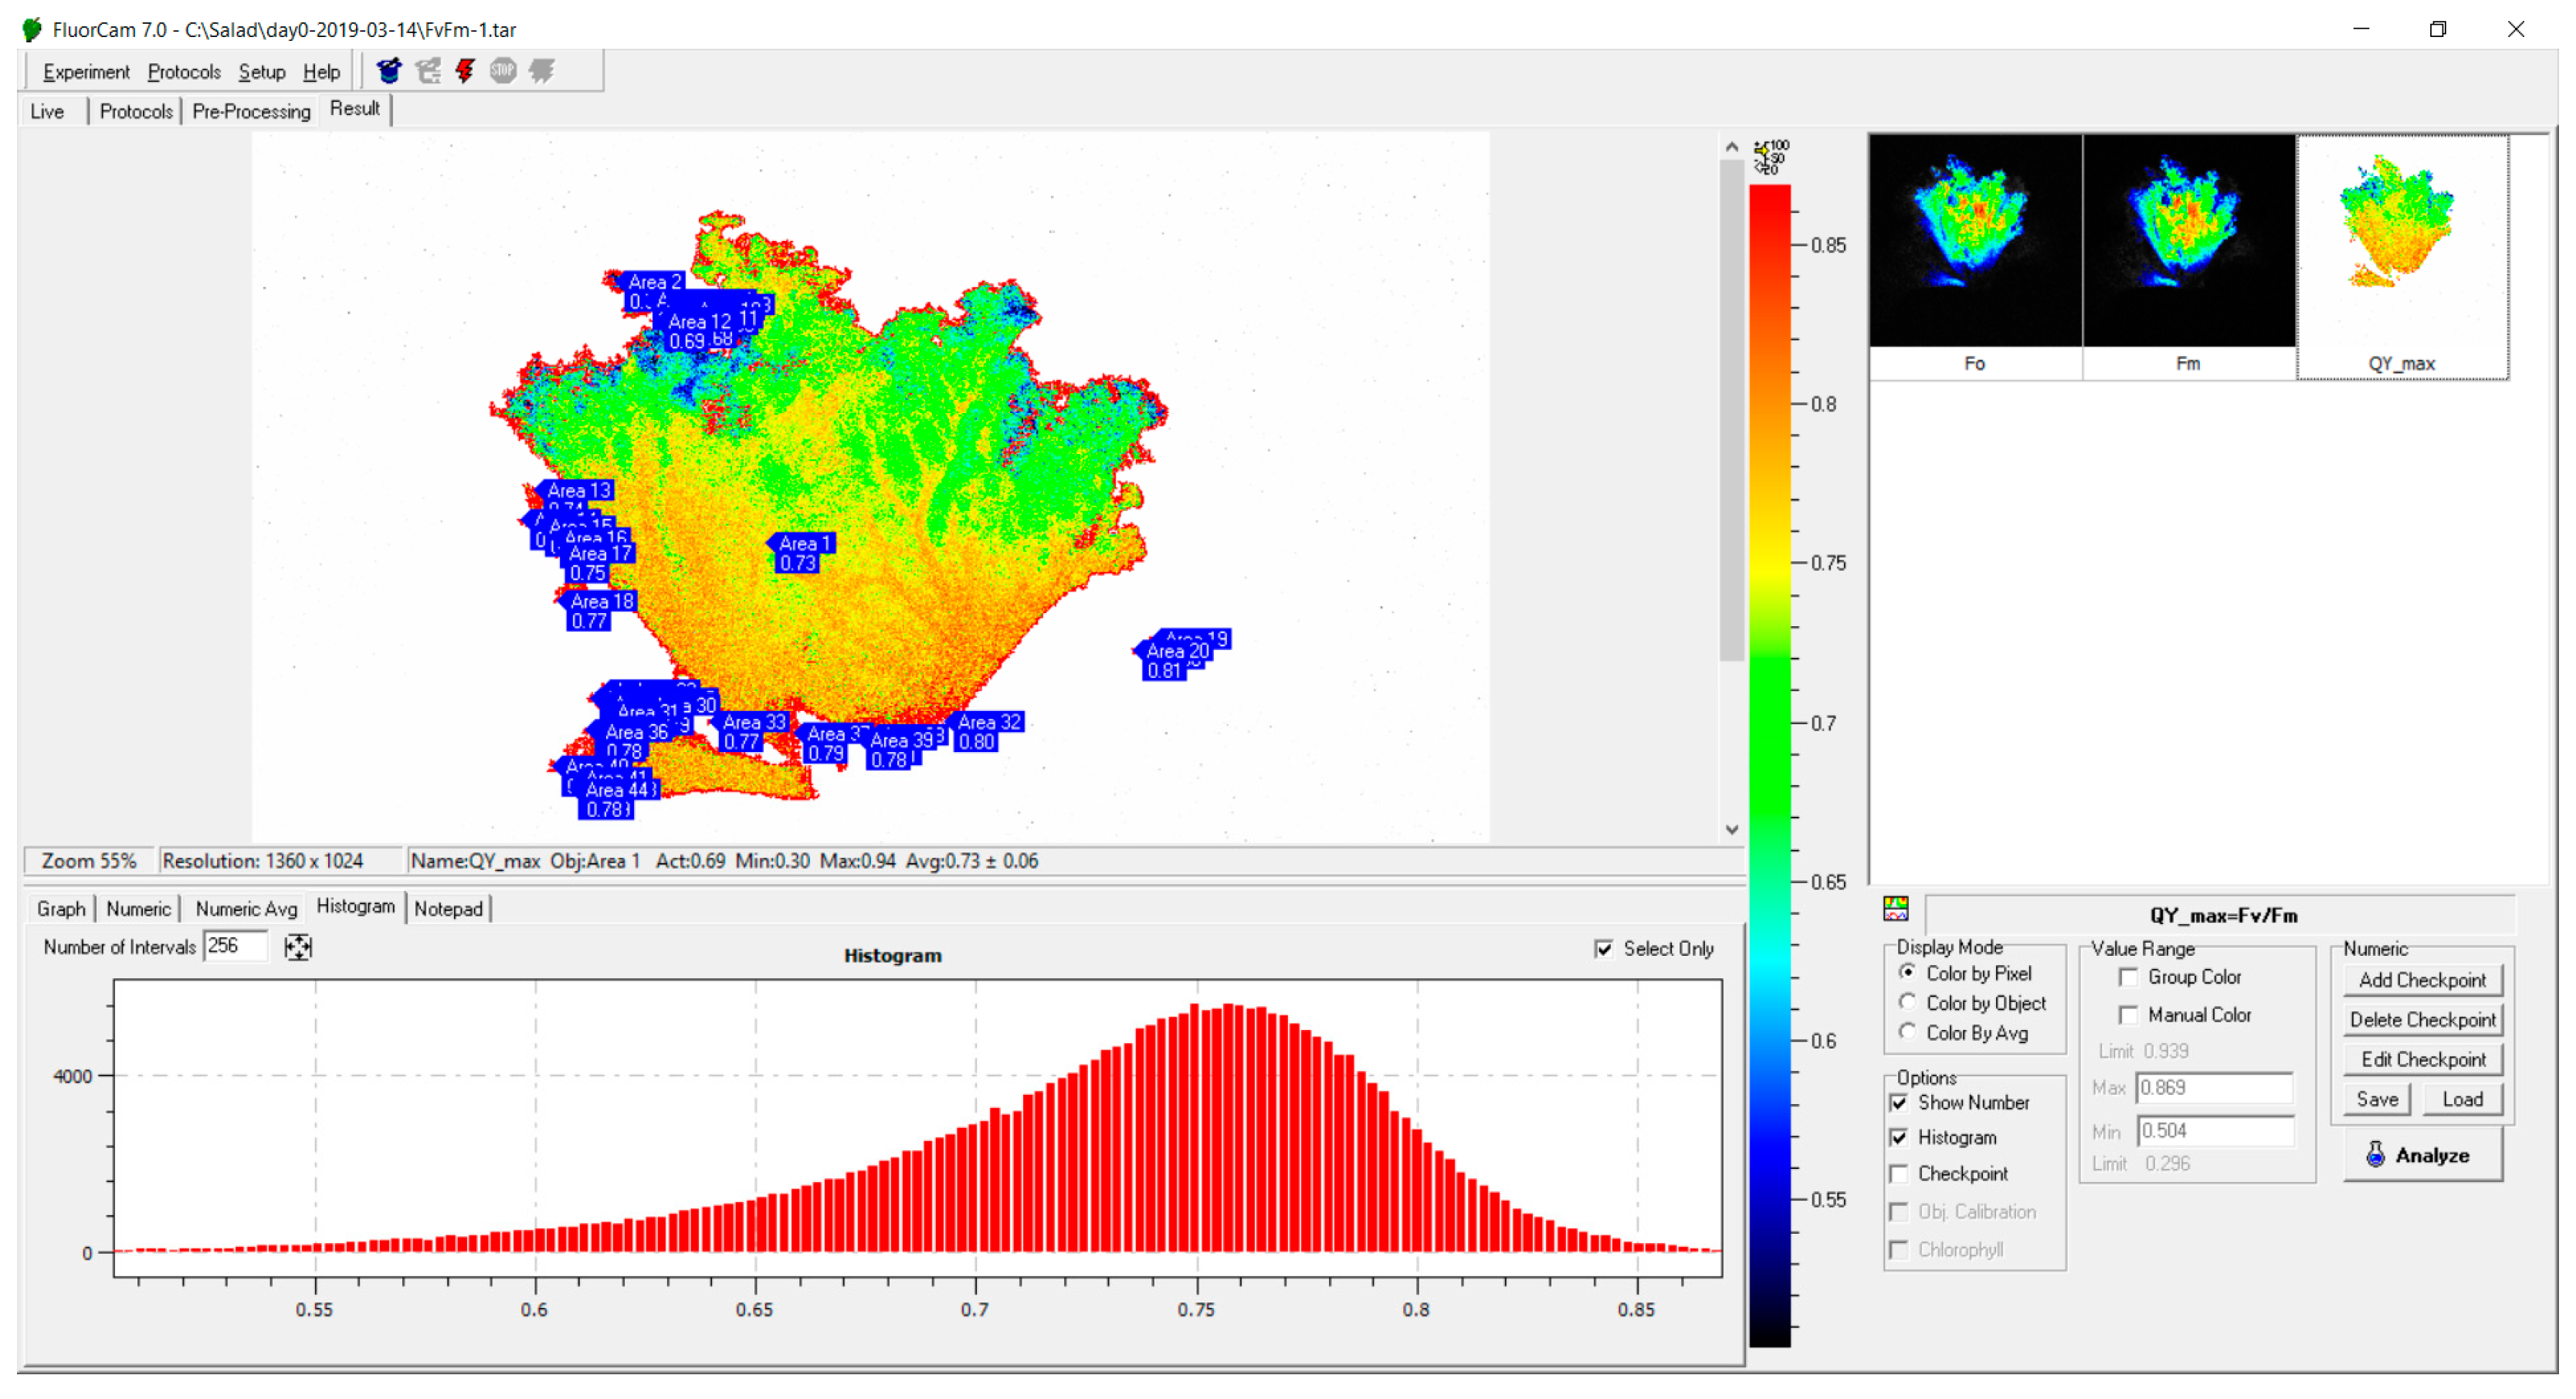
3.2. Assessment of Leaf Condition using Imaging PAM Fluorometry of Chl

In parallel with the changes in RWC and pigment content, we studied the changes in photosynthetic activity of the leaves as a possible non-invasively measured indicator of the leaf physiological condition and hence its quality [27,28]. Towards this end, we measured the parameters of the induction of Chl fluorescence in and calculated the quantum yield of photosystem II, Qy for the whole plants using the imaging PAM fluorometer (Figure 5; see also Methods). This parameter is related with potential efficiency of photosynthetic apparatus and, indirectly, with physiological condition and metabolic status of plants but not with absolute amount of Chl.
As a result, the images were obtained whose pixels represented the Qy values of the leaves at different stages of their storage. The calculated Qy values were divided into three arbitrary chosen ranges according to the level of photosynthetic activity of the leaves [29]: 0.4–0.6 (low-to moderate photosynthetic activity, senescent/damaged leaves), 0.6–0.7 (moderate-to-high photosynthetic activity), and 0.7–0.8 (high photosynthetic activity, intact leaves). Afterwards, the relative are of the leaf image occupied by the pixels in each of the ranges defined above was calculated and plotted as a function of storage time (Figure 5).
Although one can expect an increase of the relative area of leaf surface with declined photosynthetic activity during storage of fresh-cut plants, the analysis of PAM images did not reveal distinct trends of changes in photosynthetic activity of stored leaves (Figure 5). Thus, the PE-sealed leaves demonstrated a considerable increase in the number of pixels corresponding to the expansion of leaf regions with a low photosynthetic activity (Figure 5a, open symbols). Surprisingly, the non-sealed samples showed the opposite trend (Figure 5a, closed symbols). Both experimental sets demonstrated a decline in the leaf area with a high photosynthetic activity. In most cases the trends shown by sealed and non-sealed leaves did not differ significantly (Figure 5b). Unexpectedly, the regions with a high photosynthetic activity remained the same or tended to expand both in the sealed and non-sealed stored leaves throughout the observation period (Figure 5c). Only at advanced stages of leaf dehydration we documented a sizeable decline in Qy. None of the parameters derived from the PAM images of the stored leaves showed a significant correlation with any of the analytically determined parameters associated with leaf condition and/or perceived quality (not shown).

3.3. Assessment of Leaf Condition using Hyperspectral Reflectance Imaging

As an alternative approach to non-invasive monitoring of the stored leafy vegetables, the hyperspectral reflectance images (HRI) of the plants have been recorded. To find the approach to extract quantitative information about the leaf condition from the HRI, the distribution of CI678 index indicative of [Chl] [4,17] for each pixel corresponding to leaf surface were analyzed in different leaf samples as a function of time (Figure 6 and Figure S2). Overall, the HRI of the stored leaves exhibited a decline in the number of pixels corresponding to the leaf regions with a high [Chl] along with an increase in the number of pixels corresponding to the leaf regions with a lower [Chl]. This process manifested itself by the shift of the maximum of the distribution of the CI678 values to the left (Figure 6). Our first attempts to analyze the histograms to find simple metrics such as median, moda, or skewness suitable for the assessment of leaf conditions were unsuccessful (data not shown). Likely, the reason was in a high degree of heterogeneity in the leaf properties resulting in bi- or even multimodal distributions.
To further analyze the nature of the changes and diversity of the pigment content recorded for the entire plant (leaf) surface, the observed range of the CI678 variation (0–10 encompassing > 99% of all values of the index) was divided into five equal intervals. Then the changes of the number of HRI pixels in these intervals were analyzed (Figure S3). The upper limit of the underlying index CI678 was set to 10 (see the integral in the numerator of the Equation (3)) since higher values of the index would not give an adequate assessment of the [Chl] due to saturation of the R678 vs. [Chl] relationships and non-linearity resulting from it [24]. The lower limit of the CI678 index was set to 2 (see the integral in the numerator of the Equation (3)) since the index values of 2 and below are typical for damaged and/or senescent plant tissues or tissues inherently low on [Chl] [18,30]. Accordingly, the most conspicuous changes were comprised by a decline of the number of pixels with CI678 values in the 6–10 range taking place along with an increase of the number of pixels with CI678 in the 2–4 range. These changes were ascribed to degradation of Chl manifesting itself as expansion of the leaf area with a low [Chl] at the expense of the leaf area featuring a high content of the pigment. As a result, the index for monitoring of changes in [Chl] via reflectance data incorporated in HRI was suggested in the form of the HCI678 index taking into account the changes in the relative leaf areas with a higher and lower [Chl]. Indeed, the HCI678 index demonstrated the kinetics close to that of analytically measured leaf [Chl] (Figure 7a). Moreover, this index was closely related to actual leaf [Chl] in a wide range of its variation regardless of the storage mode (sealed vs. non-sealed) as shown in Figure 7b.
A similar approach was taken to test the applicability of PSRI, a reflectance index previously developed for the assessment of plant development and senescence [18,31], to gauge the pigment transformation taking place during storage of the cut lettuce leaves. As in the case of development of an index suitable for monitoring of [Chl] via HRI, the analysis of the HRI pixel distribution according to the value of their corresponding PSRI values was carried out (Figures S4 and S5). After that, sub-ranges with the largest amplitude of PSRI index variation in the stored leaves were suggested (Figure S5). The upper limit of the underlying index PSRI was set to 0.5 (see the integral in the numerator of the Equation (4)) since higher values of the index would belong to deeply senescent and/or damaged leaf areas non-relevant for the monitoring of fresh-cut leaf vegetables quality. The lower limit of the CI678 index was set to 0.1 (see the integral in the numerator of the Equation (3)) since the index values below 0.1 are typical for green tissues with a high [Chl] and do not allow for discerning the regions with a high [Chl]. As a result, the HPSRI index suitable for monitoring of pigment transformation in storing leaves via HRI data was suggested (see Materials and Methods).
Further analysis revealed that the kinetic of HPSRI changes was similar to that of [Car]/[Chl] ratio (Figure 4d and Figure 8a). Expectedly, HPSRI was found to be closely related with analytically determined [Car]/[Chl] ratio in a broad range of its variation although the relationship HPSRI vs. [Car]/[Chl] tended to saturate at high [Car]/[Chl] values (Figure 8b). Nevertheless, HPSRI was capable of revealing even a slight difference in the rate of the pigment transformation in the differently stored leaves (cf. open and closed symbols in Figure 8).

4. Discussion

In this study we attempted to comparatively assess the two techniques based on Chl fluorescence PAM or optical reflectance imaging as non-invasive gauges for physiological condition and pigment composition of plants [13] using fresh-cut lettuce leaves as a model. A prerequisite for achieving this goal is finding suitable “benchmark” parameters connected with the condition of plant objects and their perceived quality [32]. Such parameters are normally assessed analytically (destructively) by “wet” analytical methods yielding objective information about plants and the degree of their degradation. These parameters comprise the “ground truth” essential for calibration and/or interpretation with confidence of any non-invasively measured parameter yielding the same information about plant object [8,33].
We tested, as such, the relative water content (RWC) and pigment (Chl and Car) content of the leaves. Although RWC is an easily measured, straightforward parameter, its usage for monitoring of lettuce leaf condition under our experimental conditions was complicated by its essentially non-linear behavior. Thus, the major changes in RWC occurred very rapidly within the first 24 h of the experiment; afterwards RWC changed quite slowly (Figure 3). At the same time, visual inspection of the leaves did not reveal a pronounced dehydration. In our experiment, it became readily observable only at advanced stages of leaf storage without packaging (after the 7th day). On the contrary, in the PE-sealed leaves the symptoms of water deficiency were not pronounced until the end of storage period.
By contrast, pigment composition exhibited directional changes gradually taking place throughout the observation period (see e.g., Figure 4a). Thus, [Chl] content was suggested as a suitable internal marker of physiological condition and developmental changes of plant objects including leaves and fruit taking into account possible irregularities of environmental conditions [26,34]. The ratio of [Car] and [Chl] is a more specific marker of stress and senescence in plants reflecting (i) retention of Car pigments and (ii) accelerated degradation of [Chl] under adverse conditions [25].
For the purpose of this study, we also considered photosynthetic activity (specifically, potential maximal photochemical quantum yield of photosystem II, Qy) as a potential marker of the physiological condition of the studied plant objects [12,13,29]. This parameter reflects the proportion of the absorbed light energy that can be potentially channeled into photochemical reactions of light reactions of photosynthesis. In our pilot assessments, the lettuce leaves exhibited a broad range of Qy variation (0.2–0.75) in response to dehydration. However, monitoring of Qy-based images of the lettuce leaves under our experimental conditions demonstrated a large degree of heterogeneity of the Chl fluorescence signal and hence Qy over the leaf surface (see e.g., Figure 5). Overall, the analysis of PAM Qy images recorded in the present study did not reveal a sensible pattern relating spatially resolved Qy with changes of the leaf pigment content measured during storage. It can be explained, on one hand, by loose relationship of the variable Chl fluorescence parameters with biochemically assayed content of the pigment. On the other hand, plants often demonstrate a high physiological plasticity under limited water availability allowing them to maintain the functionality of their photosynthetic apparatus [27]. Thus, even completely desiccated lichen thalli demonstrate a considerable photochemical activity [35]. Therefore, one can observe a high efficiency of photochemical reaction and hence a sizeable Qy until advanced stages of drought stress, as was the case in the present study. On average, more than half of leaf surface exhibited a high Qy values up to the advanced stages of the experiment (Figure 5c) regardless of a significant loss of water. In addition to that, even the intact lettuce leaves featured a high degree of spatial heterogeneity of Qy (see e.g., Figure 1) which increased during storage of fresh-cut plants. Likely, the changes in Qy spatial distribution, at least during the initial period of observations, were “masked” by this high heterogeneity. This suggestion is supported by the fact that the differences in Qy between the non-sealed and the PE-sealed leaves were mostly statistically insignificant (Figure 5b,c).
In contrast to Chl fluorescence-based parameters, the optical reflectance-based indexes related with [Chl] and [Car] as well to their ratio (Equations (1)–(4); Figure 7) conveyed more consistent information about the condition of the studied lettuce leaves. It might be due to (i) induction of gradual degradation of Chl and (ii) coordinated degradation or retention of Car pigments [18,30,34]. These processes are well-known manifestations of other biochemical and physiological changes accompanying senescence and storage of detached fruits and leaves [34]. Interestingly, [Car] demonstrated a bi-phasic pattern of changes in our experiments (Figure 4c), although [Chl] declined stepwise. Since Car serve for the protection of plants against oxidative stress, one may speculate that a slower degradation of Car reflects acclimation of the leaf photosynthetic apparatus to the stress caused by cutting the plants. At more advanced stages of storage, a synchronous degradation of Car and Chl was observed typical for the senescence of certain plant species [18,34].
To gain a deeper insight into the patterns of pigment transformation in the stored leaves and to estimate the applicability of the indexes developed in this work to extract the relevant information from the HRI, we used the approach previously developed by our group for monitoring of senescence of leaves and ripening of apple fruits. An approach with a similar measurement setup was previously employed for the detection of worms and slugs on lettuce leaves [9].
Still, the leaves exhibited a broad variation in their optical properties due to their structural complexity and physiological heterogeneity. To overcome these constrains, we used an approach based on [Car]/[Chl] ratio as an internally normalized robust senescence marker influenced by environmental factors per se [26]. As a result, we were able to monitor non-invasively the characteristic changes of pigment transformation accompanying the loss of perceived quality in stored leafy vegetables regardless of leaf water content. Moreover, this approach was sufficiently sensitive to pinpoint the differences in timing of storage-associated changes in PE-sealed vs. non-sealed leaves (Figure 8). These differences can be tentatively associated with the buildup of ethylene, the senescence hormone, inside the PE packaging.
Collectively, our results also support the applicability of the spectral indexes CI and PSRI indicative of leaf development and senescence [18] initially suggested for “point-based” measurements with conventional spectroradiometers for the processing and subsequent interpretation of the hyperspectral data obtained in our experiments. The advent of low-cost hyperspectrometers [36] makes this approach promising not only for basic research but for practitioners as well.

5. Conclusions

We compared the two approaches to monitoring the condition of plants, using leafy vegetables as a model, via spatially resolved techniques based on imaging PAM and hyperspectral reflectance. Using of the imaging PAM was complicated by (i) weak correlation of the spatial distribution pattern of the Qy parameter with the actual physiological condition of the plant object and (ii) its high degree of heterogeneity inherent to the lettuce leaves. On the contrary, the indexes HCI678 and HPSRI based on the earlier developed “point-based” indexes CI678 and PSRI, were able to extract consistent information about the changes in the condition of and pigment transformation in fresh-cut lettuce plants. In view of the obtained findings, hyperspectral reflectance imaging can be suggested for monitoring of plant objects such as fresh-cut vegetable produce in greenhouses and packinghouses. More research is needed to find an approach to harness imaging PAM for the same purpose.
In particular, the indices HCI678 and HPSRI were found to be suitable for the non-invasive proximal sensing of the fresh-cut lettuce leaf quality. Although further studies are needed to optimize the spectral bands used for these indices, they can be potentially used in sorting lines and packinghouses for the detection and elimination of contaminated, degraded, and damaged leafy vegetables.

Supplementary Materials

The following are available online at https://www.mdpi.com/article/10.3390/photonics8100425/s1. Figure S1: Changes in (A) [Chl] and (B) [Car]/[Chl] ratios during storage of the non-sealed (closed symbols) and sealed (open symbols) fresh-cut lettuce leaves; Figure S2: Changes in leaf area exhibiting different values of CI678 index (the color-coded images) indicative of [Chl] and (histograms immediately below the corresponding images) the corresponding distribution of the pixel values of the color-coded images in the stored non-sealed fresh-cut lettuce leave. For details, see Materials and Methods; Figure S3: Time-course of changes in the relative area of (top graph) non-sealed and (bottom graph) exhibiting the values of the CI678 index in the ranges indicated in the graph annotation; Figure S4: Changes in leaf area exhibiting different values of PSRI index (the color-coded images) indicative of [Chl] and (histograms immediately below the corresponding images) the corresponding distribution of the pixel values of the color-coded images in the stored non-sealed fresh-cut lettuce leave. For details, see Materials and Methods; Figure S5: Time-course of changes in the relative area of (top graph) non-sealed and (bottom graph) exhibiting the values of the PSRI index in the ranges indicated in the graph annotation.

Author Contributions

Conceptualization, B.S. and A.S.; methodology, B.S.; software, B.S.; validation, O.C., O.S., and D.K.; formal analysis, I.S.; investigation, A.S.; resources, A.D.; data curation, O.C.; writing—original draft preparation, A.S.; writing—review and editing, all the authors; visualization, A.S.; funding acquisition, I.S. All authors have read and agreed to the published version of the manuscript.

Funding

This research (the index development) was supported by a grant of the Ministry of Science and Higher Education of the Russian Federation for large scientific projects in priority areas of scientific and technological development (grant number 075-15-2020-774).

Data Availability Statement

The data presented in this study are available on request from the corresponding author on reasonable request.

Acknowledgments

The generous supply of the lettuce plants by LLC Panasonic Rus is gratefully acknowledged. The results were obtained using the equipment of the Center for Collective Use of Scientific Equipment of TSU named after G.R. Derzhavin.

Conflicts of Interest

The authors declare no conflict of interest. The funders had no role in the design of the study; in the collection, analyses, or interpretation of data; in the writing of the manuscript; or in the decision to publish the results.

References

  1. Gamon, J.A.; Somers, B.; Malenovský, Z.; Middleton, E.M.; Rascher, U.; Schaepman, M.E. Assessing Vegetation Function with Imaging Spectroscopy. Surv. Geophys. 2019, 40, 489–513. [Google Scholar] [CrossRef] [Green Version]
  2. Lu, R.; Van Beers, R.; Saeys, W.; Li, C.; Cen, H. Measurement of optical properties of fruits and vegetables: A review. Postharvest Biol. Technol. 2020, 159. [Google Scholar] [CrossRef]
  3. Gudkov, S.; Andreev, S.; Barmina, E.; Bunkin, N.; Kartabaeva, B.; Nesvat, A.; Stepanov, E.; Taranda, N.; Khramov, R.; Glinushkin, A. Effect of visible light on biological objects: Physiological and pathophysiological aspects. Phys. Wave Phenom. 2017, 25, 207–213. [Google Scholar] [CrossRef]
  4. Gitelson, A.; Arkebauer, T.; Viña, A.; Skakun, S.; Inoue, Y. Evaluating plant photosynthetic traits via absorption coefficient in the photosynthetically active radiation region. Remote Sens. Environ. 2021, 258. [Google Scholar] [CrossRef]
  5. Gitelson, A.; Solovchenko, A.; Viña, A. Foliar absorption coefficient derived from reflectance spectra: A gauge of the efficiency of in situ light-capture by different pigment groups. J. Plant Physiol. 2020, 254, 153277. [Google Scholar] [CrossRef] [PubMed]
  6. Solovchenko, A.; Dorokhov, A.; Shurygin, B.; Nikolenko, A.; Velichko, V.; Smirnov, I.; Khort, D.; Aksenov, A.; Kuzin, A. Linking tissue damage to hyperspectral reflectance for non-invasive monitoring of apple fruit in orchards. Plants 2021, 10, 310. [Google Scholar] [CrossRef] [PubMed]
  7. Takaichi, S. Tetraterpenes: Carotenoids. In Natural Products; Ramawat, K.G., Mérillon, J.-M., Eds.; Springer: Berlin/Heidelberg, Germany, 2013; pp. 3251–3283. [Google Scholar] [CrossRef]
  8. Walsh, K.B.; Blasco, J.; Zude-Sasse, M.; Sun, X. Visible-NIR ‘point’ spectroscopy in postharvest fruit and vegetable assessment: The science behind three decades of commercial use. Postharvest Biol. Technol. 2020, 168. [Google Scholar] [CrossRef]
  9. Lu, Y.; Saeys, W.; Kim, M.; Peng, Y.; Lu, R. Hyperspectral imaging technology for quality and safety evaluation of horticultural products: A review and celebration of the past 20-year progress. Postharvest Biol. Technol. 2020, 170. [Google Scholar] [CrossRef]
  10. Saeys, W.; Nguyen Do Trong, N.; Van Beers, R.; Nicolaï, B.M. Multivariate calibration of spectroscopic sensors for postharvest quality evaluation: A review. Postharvest Biol. Technol. 2019, 158. [Google Scholar] [CrossRef]
  11. Herritt, M.T.; Pauli, D.; Mockler, T.C.; Thompson, A.L. Chlorophyll fluorescence imaging captures photochemical efficiency of grain sorghum (Sorghum bicolor) in a field setting. Plant Methods 2020, 16, 109. [Google Scholar] [CrossRef]
  12. Kalaji, H.M.; Schansker, G.; Brestic, M.; Bussotti, F.; Calatayud, A.; Ferroni, L.; Goltsev, V.; Guidi, L.; Jajoo, A.; Li, P.; et al. Frequently asked questions about chlorophyll fluorescence, the sequel. Photosynth Res. 2017, 132, 13–66. [Google Scholar] [CrossRef] [PubMed] [Green Version]
  13. Valcke, R. Can chlorophyll fluorescence imaging make the invisible visible? Photosynthetica 2021, 59, 381–398. [Google Scholar] [CrossRef]
  14. Perez-Bueno, M.L.; Pineda, M.; Baron, M. Phenotyping Plant Responses to Biotic Stress by Chlorophyll Fluorescence Imaging. Front. Plant. Sci. 2019, 10, 1135. [Google Scholar] [CrossRef]
  15. Pieters, O.; De Swaef, T.; Lootens, P.; Stock, M.; Roldán-Ruiz, I.; Wyffels, F. Limitations of snapshot hyperspectral cameras to monitor plant response dynamics in stress-free conditions. Comput. Electron. Agric. 2020, 179. [Google Scholar] [CrossRef]
  16. Maxwell, K.; Johnson, G. Chlorophyll fluorescence-a practical guide. J. Exp. Bot. 2000, 51, 659–668. [Google Scholar] [CrossRef] [PubMed]
  17. Merzlyak, M.; Solovchenko, A.; Gitelson, A. Reflectance spectral features and non-destructive estimation of chlorophyll, carotenoid and anthocyanin content in apple fruit. Postharvest Biol. Technol. 2003, 27, 197–212. [Google Scholar] [CrossRef]
  18. Merzlyak, M.; Gitelson, A.; Chivkunova, O.; Rakitin, V. Non-destructive optical detection of pigment changes during leaf senescence and fruit ripening. Plant Physiol. 1999, 106, 135–141. [Google Scholar] [CrossRef] [Green Version]
  19. Ceccato, P.; Flasse, S.; Tarantola, S.; Jacquemoud, S.; Grégoire, J.-M. Detecting vegetation leaf water content using reflectance in the optical domain. Remote Sens. Environ. 2001, 77, 22–33. [Google Scholar] [CrossRef]
  20. Folch, J.; Lees, M.; Sloane-Stanley, G. A simple method for the isolation and purification of total lipids from animal tissues. J. Biol. Chem. 1957, 226, 497–509. [Google Scholar] [CrossRef]
  21. Solovchenko, A.; Chivkunova, O.; Merzlyak, M.; Reshetnikova, I. A spectrophotometric analysis of pigments in apples. Rus. J. Plant Physiol. 2001, 48, 693–700. [Google Scholar] [CrossRef]
  22. Wellburn, A. The spectral determination of chlorophyll a and chlorophyll b, as well as total carotenoids, using various solvents with spectrophotometers of different resolution. J. Plant Physiol. 1994, 144, 307–313. [Google Scholar] [CrossRef]
  23. Solovchenko, A.; Solovchenko, O.; Khozin-Goldberg, I.; Didi-Cohen, S.; Pal, D.; Cohen, Z.; Boussiba, S. Probing the effects of high-light stress on pigment and lipid metabolism in nitrogen-starving microalgae by measuring chlorophyll fluorescence transients: Studies with a Δ5 desaturase mutant of Parietochloris incisa (Chlorophyta, Trebouxiophyceae). Algal Res. 2013, 2, 175–182. [Google Scholar] [CrossRef]
  24. Gitelson, A.; Solovchenko, A. Non-invasive quantification of foliar pigments: Possibilities and limitations of reflectance-and absorbance-based approaches. J. Photochem. Photobiol. B Biol. 2018, 178, 537–544. [Google Scholar] [CrossRef] [PubMed]
  25. Merzlyak, M.; Gitelson, A.; Chivkunova, O.; Solovchenko, A.; Pogosyan, S. Application of reflectance spectroscopy for analysis of higher plant pigments. Rus. J. Plant Physiol. 2003, 50, 704–710. [Google Scholar] [CrossRef]
  26. Solovchenko, A.; Chivkunova, O.; Merzlyak, M.; Gudkovsky, V. Relationships between chlorophyll and carotenoid pigments during on-and off-tree ripening of apple fruit as revealed non-destructively with reflectance spectroscopy. Postharvest Biol. Technol. 2005, 38, 9–17. [Google Scholar] [CrossRef]
  27. Kirnak, H.; Kaya, C.; Tas, I.; Higgs, D. The influence of water deficit on vegetative growth, physiology, fruit yield and quality in eggplants. Bulg. J. Plant Physiol. 2001, 27, 34–46. [Google Scholar]
  28. Pascoal, C.; Cássio, F.; Gomes, P. Leaf breakdown rates: A measure of water quality? Int. Rev. Hydrobiol. 2001, 86, 407–416. [Google Scholar] [CrossRef]
  29. Keller, B.; Vass, I.; Matsubara, S.; Paul, K.; Jedmowski, C.; Pieruschka, R.; Nedbal, L.; Rascher, U.; Muller, O. Maximum fluorescence and electron transport kinetics determined by light-induced fluorescence transients (LIFT) for photosynthesis phenotyping. Photosynth. Res. 2019, 140, 221–233. [Google Scholar] [CrossRef] [Green Version]
  30. Merzlyak, M.; Gitelson, A.; Pogosyan, S.; Lekhimena, L.; Chivkunova, O. Light-induced pigment degradation in leaves and ripening fruits studied in situ with reflectance spectroscopy. Physiol. Plant. 1998, 104, 661–667. [Google Scholar] [CrossRef]
  31. Solovchenko, A.E.; Chivkunova, O.B.; Gitelson, A.A.; Merzlyak, M.N. Non-Destructive Estimation Pigment Content Ripening Quality and Damage in Apple Fruit with Spectral Reflectance in the Visible Range. Fresh Produce 2010, 4, 91–102. [Google Scholar]
  32. Abbott, J. Quality measurement of fruits and vegetables. Postharvest Biol. Technol. 1999, 15, 207–225. [Google Scholar] [CrossRef]
  33. Zude, M.; Birlouez-Aragon, I.; Paschold, P.; Rutledge, D. Non-invasive spectrophotometric sensing of carrot quality from harvest to consumption. Postharvest Biol. Technol. 2007, 45, 30–37. [Google Scholar] [CrossRef]
  34. Solovchenko, A.; Yahia, E.M.; Chen, C. Pigments. In Postharvest Physiology and Biochemistry of Fruits and Vegetables; Elsevier: Amsterdam, The Netherlands, 2019; pp. 225–252. [Google Scholar]
  35. Heber, U.; Bilger, W.; Türk, R.; Lange, O.L. Photoprotection of reaction centres in photosynthetic organisms: Mechanisms of thermal energy dissipation in desiccated thalli of the lichen Lobaria pulmonaria. New Phytol. 2010, 185, 459–470. [Google Scholar] [CrossRef] [PubMed]
  36. Stuart, M.B.; Stanger, L.R.; Hobbs, M.J.; Pering, T.D.; Thio, D.; McGonigle, A.J.S.; Willmott, J.R. Low-Cost Hyperspectral Imaging System: Design and Testing for Laboratory-Based Environmental Applications. Sensors 2020, 20, 3293. [Google Scholar] [CrossRef] [PubMed]
Figure 1. A representative measurement of the spatial distribution of Qy over the lettuce leaf surface with the imaging PAM fluorometer Fluorcam 800. For each image containing the Qy values as pixel values, a histogram was generated and exported for further analysis in Excel spreadsheet software (Microsoft, Redmond, WA, USA). The histograms were then re-binned (i.e., integrated within the selected intervals, see text).
Photonics 08 00425 g001
Figure 2. Hyperspectral recording of the fresh-cut lettuce leaves/plants with the SPECIM IQ camera (Spectral Images, Finland).
Photonics 08 00425 g002
Figure 3. Changes in the relative water content during storage of the non-sealed (closed symbols) and sealed (open symbols) fresh-cut lettuce leaves. Average ± SE values are presented (n = 9).
Photonics 08 00425 g003
Figure 4. Changes in pigment composition during storage of the non-sealed (closed symbols) and sealed (open symbols) fresh-cut lettuce leaves. (a) Time-course of [Chl]. (b) Time-course of [Car] changes. (c) Relationship between total and [Chl] changes. (d) Changes of [Car]/[Chl] mass ratio plotted vs. changes in [Chl]. Average ± SE values are presented (n = 9).
Photonics 08 00425 g004
Figure 5. Changes in the relative area of the stored non-sealed (closed symbols) and sealed (open symbols) fresh-cut lettuce leaves possessing PS II Qy values in the range (a) 0.4–0.6, (b) 0.6–0.7, and (c) 0.7–0.8. Average ± SE values are presented (n = 9). For details, see Materials and Methods.
Photonics 08 00425 g005
Figure 6. Representative changes in (a) leaf area exhibiting different values of CI678 index (color-coded) indicative of Chl content and (b) the corresponding distribution of the pixel values of the color-coded images in the stored non-sealed fresh-cut lettuce leaves. The complete dataset presented in Figure S2 of the Appendix. For details, see Materials and Methods.
Photonics 08 00425 g006
Figure 7. Changes in the average values of the index HCI678 during (a) storage of and (b) decline of Chl (indicative of leaf bleaching) in the stored non-sealed (closed symbols) and sealed (open symbols) fresh-cut lettuce leaves. See also Figures S2 and S3.
Photonics 08 00425 g007
Figure 8. Changes in the average values of the indicative of leaf tissue senescence index PSRI during (a) storage of and (b) decline of [Chl] (indicative of leaf discoloration) in the stored non-sealed (closed symbols) and sealed (open symbols) fresh-cut lettuce leaves. See also Figures S4 and S5.
Photonics 08 00425 g008
Publisher’s Note: MDPI stays neutral with regard to jurisdictional claims in published maps and institutional affiliations.

