Abstract
In this study, we propose a method of evaluating the spectral resolution of crossed-asymmetric Czerny-Turner spectrometers by comparing the impact of different slit functions on the optical transfer function, and different slit widths, through simulation and experiments. The results show that, the Gaussian function is suitable for narrower slit widths, such as 25 μm, and the rectangle function or convolution of slit-scattering function with rectangle function is suitable for wider slit widths, such as 50 μm, 150 μm, and 200 μm. The proposed method can provide guidance in the evaluation of spectral resolution in the preliminary optical design process of spectrometers.
1. Introduction
The Czerny-Turner (C-T) optical structure offers many advantages, such as being lightweight, having a small size, and being low cost. As a result, it has been widely adopted in diffraction grating-based micro-spectrometers, which have been used in many fields for quick and accurate measurement of spectra in recent years [1,2,3,4]. Spectral resolution (hereafter referred to as resolution) is the fundamental performance and primary technical parameter of a spectrometer. It quantifies the amount of light spectrum collected by each spectral element. Therefore, its evaluation is crucial for the optical design of a spectrometer.
It is well known that resolution can be defined using the Rayleigh criterion [5], that is, its ability to identify two adjacent spectral lines. Slit width, diffraction order, grating period, and focal distance of the spherical mirror are vital factors that affect the resolution of spectrometers under design [6]. For completely produced spectrometers, the use of different detector types and the errors generated during the assembly process affect the final resolution. The resolution of an actual spectrometer can be accurately calculated by measuring the nominal fringe spacing of an interferogram [7] or measurement spectrum, but for the spectrometer being designed, these methods are obviously not applicable. A spot diagram is often used for a quick qualitative analysis of resolution in the optical design process of spectrometers [8,9,10,11,12]. Although a spot diagram can achieve quantitative analysis of resolution to a certain extent, it does not take into account the slit width and sensor pixel size, so the results obtained have large errors. For a quantitative approach, a simple and quick approach involves obtaining the distribution of wavelength using the optical transfer function (OTF) model and then measuring its full width at half maximum (FWHM). The OTF is a function based on the global modeling and analysis of a spectrometer. The spectrometer can be divided into several modules, such as optical imaging module, detecting module, reconstructing module, and displaying module, where each module has an effect on the final output spectrum and the OTF, that is, different functions that characterize the influence of each module in the spectrometer on the output spectrum [13]. The model based on OTF (hereafter referred to as OTF model) is often used for predicting resolution in an optical linear system. For example, P. Mouroulis et al. [14,15] evaluated resolution through the spectrum distribution obtained by the convolution of a slit image with the pixel response function. Kye-Sung Lee et al. [16] used the convolution of a pixel and the line spread function (LSF) of each pixel to characterize the wavelength distribution in the object plane, and then calculated FWHM. John F. Silny [17] used a similar method to analyze resolution in the study. Although they all achieve the purpose of evaluating resolution by using OTF in the process of optical design, there are two main problems with the process of using the OTF model in these studies. One is that the modules included in the model are not uniform, and the other is that the validity of this method, that is, the consistency with the actual results, remains to be verified. In addition, the variation of slit size on the actual resolution is usually overlooked when OTF model is used.
As mentioned above, OTF is capable of achieving rapid quantitative analysis resolution in optical design. In this study, we investigated the adaptability of using the OTF model to evaluate the resolution of the designed spectrometer with an asymmetrical crossed C-T optical structure. For this purpose, we first established the unified OTF model, which includes slit module, optical path transmission module, and detector module, and then used the model to calculate the resolution of spectrometer with different slit widths and compared the results with the measurements of actual spectrometers. Meanwhile, in order to explore the impact of slit size on resolution evaluation, we used the Gaussian function, Lorentzian function, rectangle function, and the convolution of slit-scattering function (SSF) with rectangle function as slit functions to characterize the role of the slit module in the OTF model, and compared the effectiveness of different slit functions for the resolution evaluation of spectrometers with different slit widths.
The remainder of this paper has been divided as follows: Section 2 describes the theoretical formulation of the experiment. Section 3 first describes the optical design model of the spectrometer used for the experiment and the actual completed-for-production instrument, and then presents the comparison of the results of the actual measured resolution and that of the resolution calculated by different methods. The results of the comparison are discussed in this part as well. Section 4 presents the conclusion of this study.
2. Theoretical and Method
In the optical linear system, the acquisition of spectrum can be summarized in three parts: the original spectrum of light passing through the slit, the spectrum after the action of the module of the optical path transmission (including parts other than slits and detectors), and the final spectrum detected by the detector. This implies that any spectrum analyzed by the spectrometer is a result of the convolution of the real spectrum with a spectral instrumental line profile [15]. In this study, we divide the spectrometer into three modules (the slit module, the optical path transmission module, and the detector module) and use different OTFs to characterize the influence of each module in the spectrometer on the output spectrum, so as to obtain a unified OTF model, which can be defined as follows:
where represents convolution, represents the spectral line distribution of wavelength that observed finally. and respectively denote the OTFs of slit module and detector module; the OTF of slit module is referred to as slit function in the following. and respectively represent the width of the slit and detector pixel in microns; together, they form the spectral instrumental line profile. is the OTF of the optical path transmission module, which stands for the line distribution at the focal plane as a function of wavelength, that is, LSF. The LSF can represent the radiation intensity distribution in the image of an infinitely narrow and infinitely long slit (line source) of unit intensity [18], which can be regarded as an ideal spectral line distribution without the influence of slit and detector, and can be computed from optical ray tracing software quickly.
It is generally assumed that slit width is the main factor that affects the slit function , which can be given by the rectangle function:
where represents the slit width along with the spectral direction and indicates the position of the wavelength in the center of the image plane. Practically, the slit complicates the computation of the response functions, since it acts as an intermediate diffractive aperture, the effects of which are typically ignored by ray-tracing software. Kostkowski HJ described a triangular SSF [19], which is the relative response of a spectrometer at a given wavelength position to pure monochromatic light, as a function of the wavelength of the monochromatic light. SSF can approximately describe the scattering characteristics of light passing through a slit. Herein, we used SSF convolved with Equation (2) to characterize the spectral line distribution through the slit, as given below:
where
where is a constant related to slit width.
The Gaussian function and Lorentzian function also provide good approximations for many spectral shapes. For more accurate computation and comparison, the Gaussian and the Lorentzian functions are also used to describe the distribution of the spectral line through the slit, using Equations (3) and (4), respectively:
where , , , and are constants. In this study, we used the standard Gaussian function and Lorentz function.
is generally related to the parameters of the detector itself. In this study, we used a linear charge coupled device (CCD) as the detector and assumed that is only affected by the detector pixel width. Therefore, can be expressed similarly to Equation (2):
where is the pixel width of the detector in microns.
3. Experiment
3.1. Experiment Setup
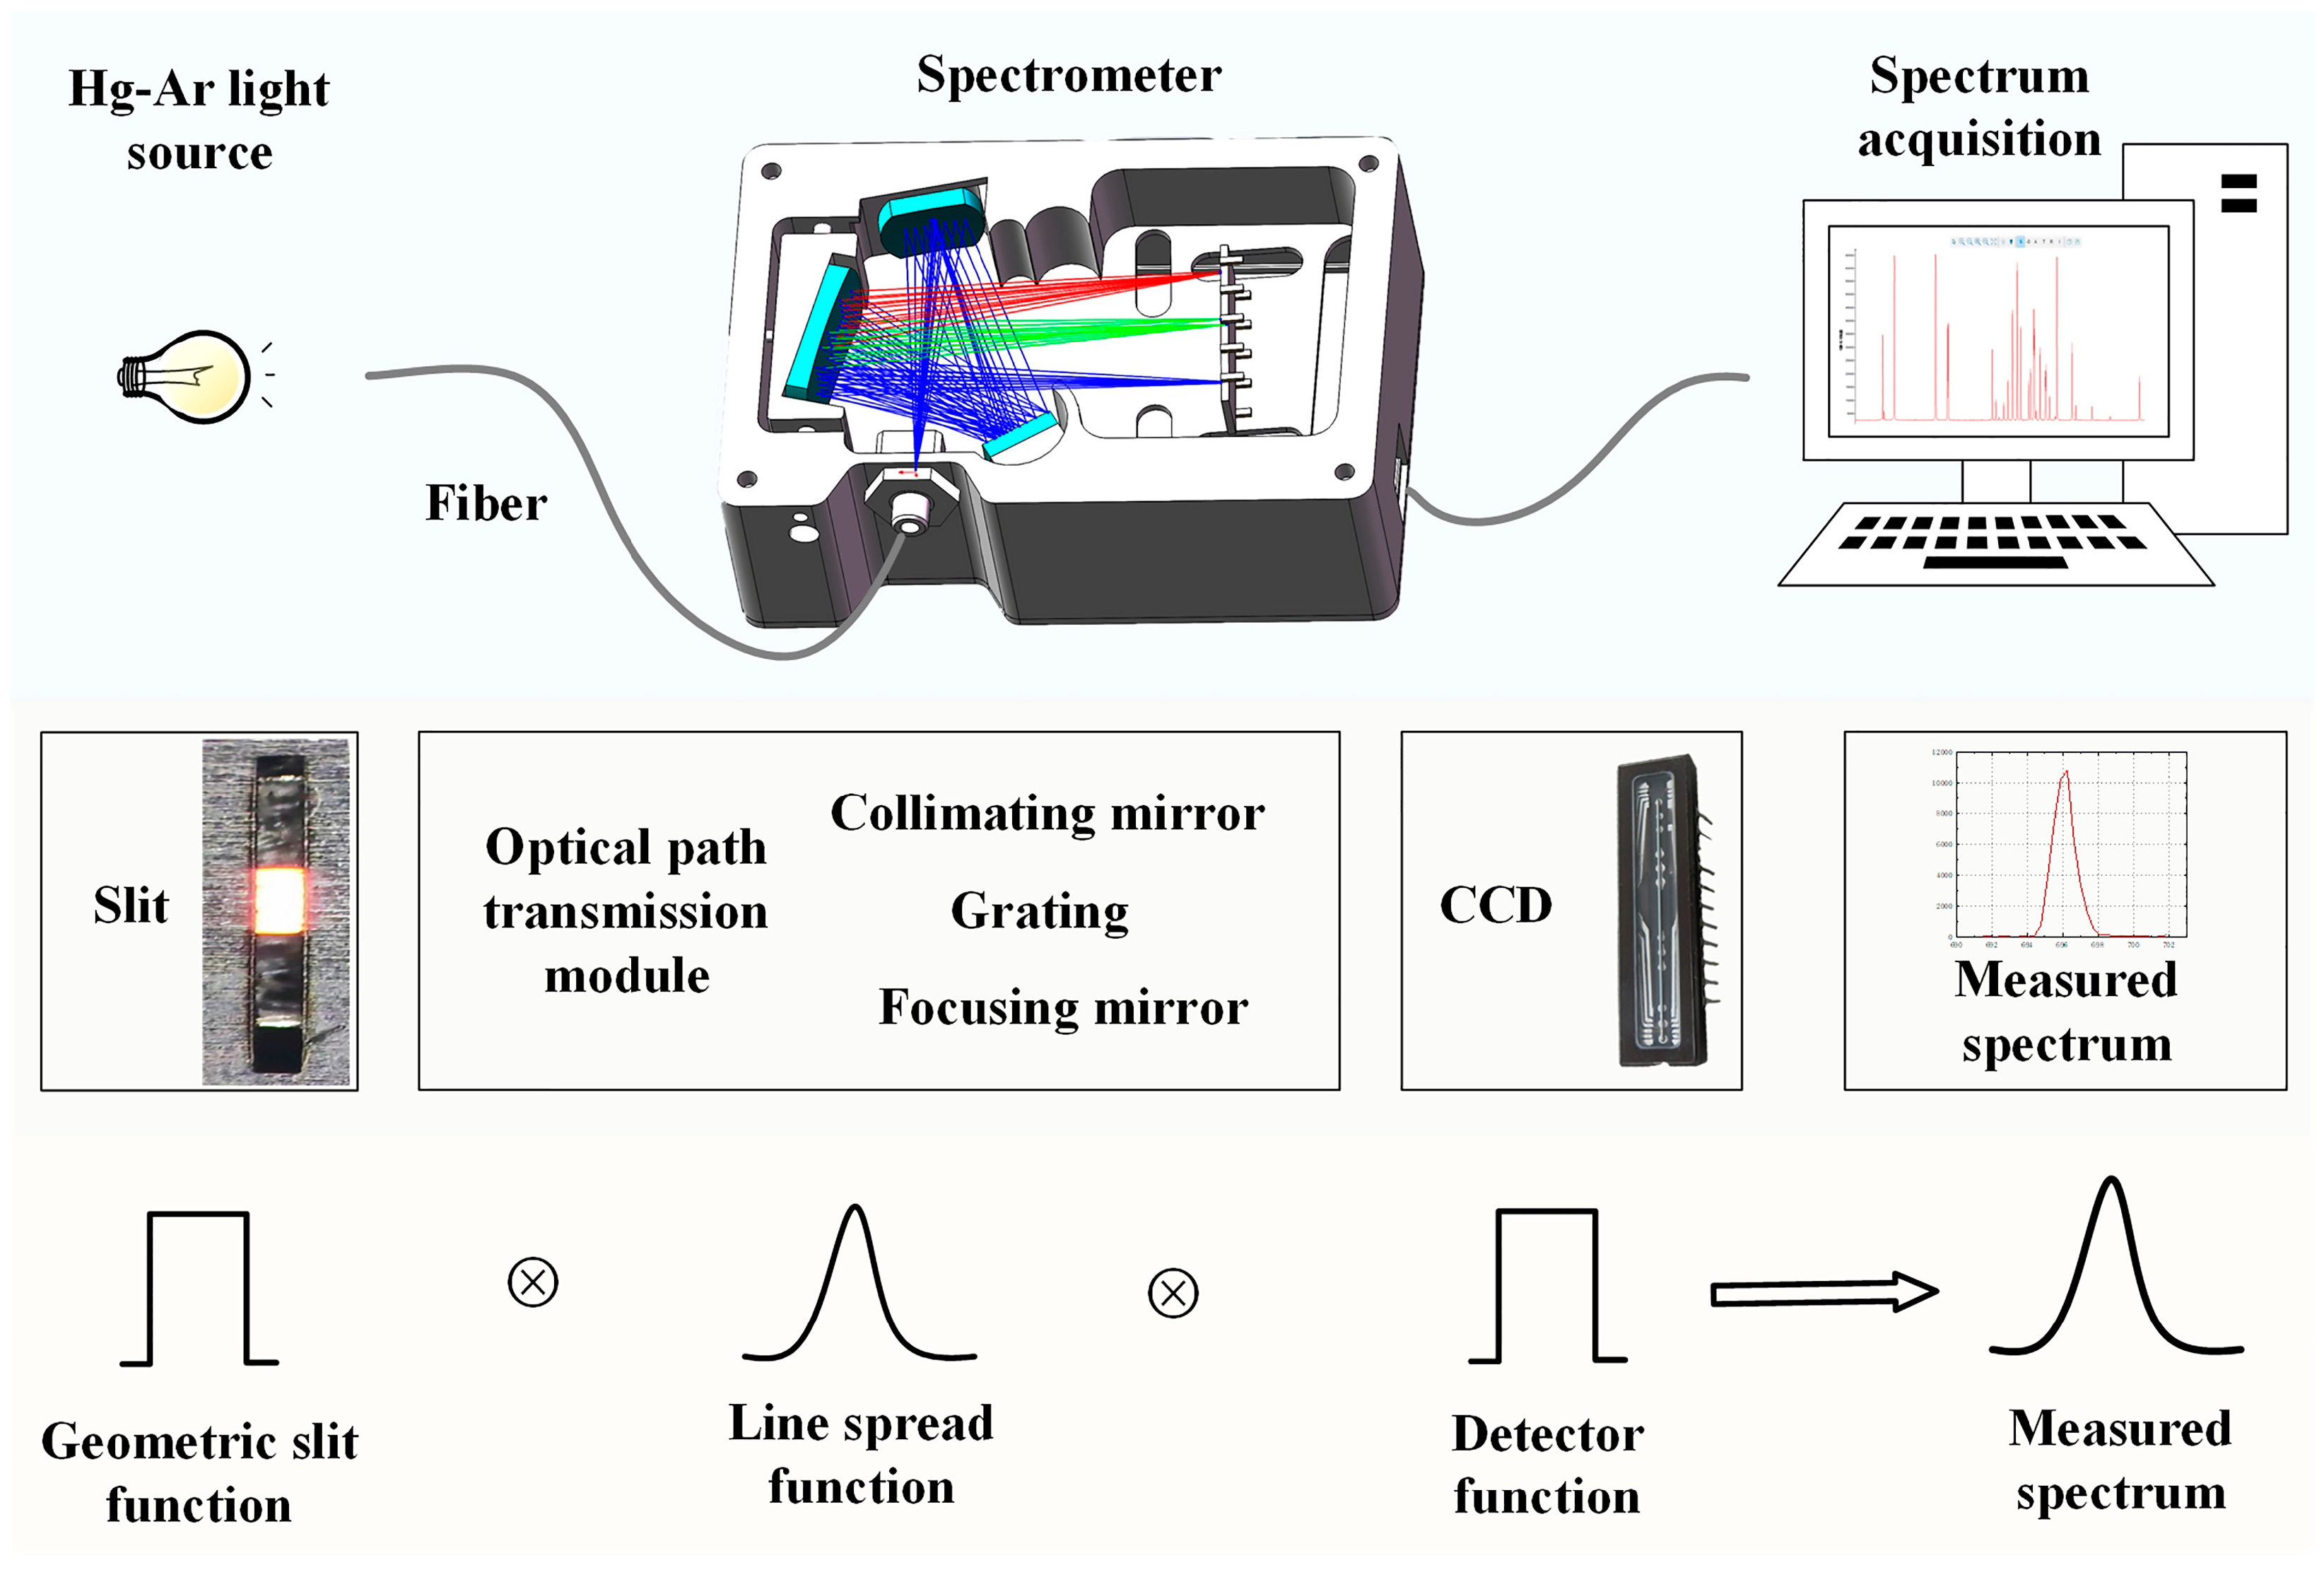
The details of a typical crossed-asymmetric C-T spectrometer optical system are as follows. First, a divergent light from an entrance slit is collimated by a collimating mirror. Thereafter, it is diffracted by a planar grating in the tangential plane. Finally, the diffracted light is focused on the detector through a focusing mirror. The three main factors that affect the resolution of a grating spectrometer are slit width, design of the optical system, and type of detector used, as displayed in Figure 1.
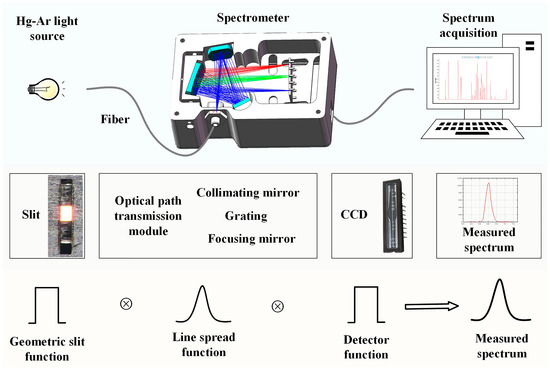
Figure 1.
Influence of slit width, optical path transmission module, and detector on the C-T spectrometer and convolution model. CCD—charge coupled device.
In this study, we designed a crossed-asymmetric C-T optical structure with a spectral range of 350–1100 nm. In addition, based on this optical structure, five more spectrometers with the same configuration were assembled and calibrated. The grating of the spectrometer was 600 mm−1. The spectrum was captured by a CCD linear image sensor (Sony ILX554B, 2048 pixels) with 14 μm pixel width. The light source was the Ocean Insight calibration source, which mainly mixes Hg and Ar gas light sources. To verify the effectiveness of the method with the different slit functions mentioned in Section 1 and Section 2, the effect of four slit functions for OTF model were compared with actual measurement results of different slit widths, namely 25 μm, 50 μm, 150 μm, and 200 μm. Figure 2 displays the experimental platform and the four slit sizes used in experiment.
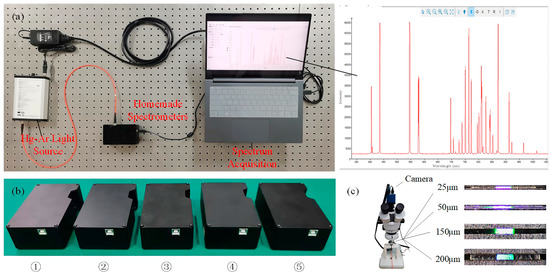
Figure 2.
(a) Experimental platform. (b) Homemade Spectrometers. (c) Four sizes of slits used for the experiment.
3.2. Comparative Experiments and Discussion
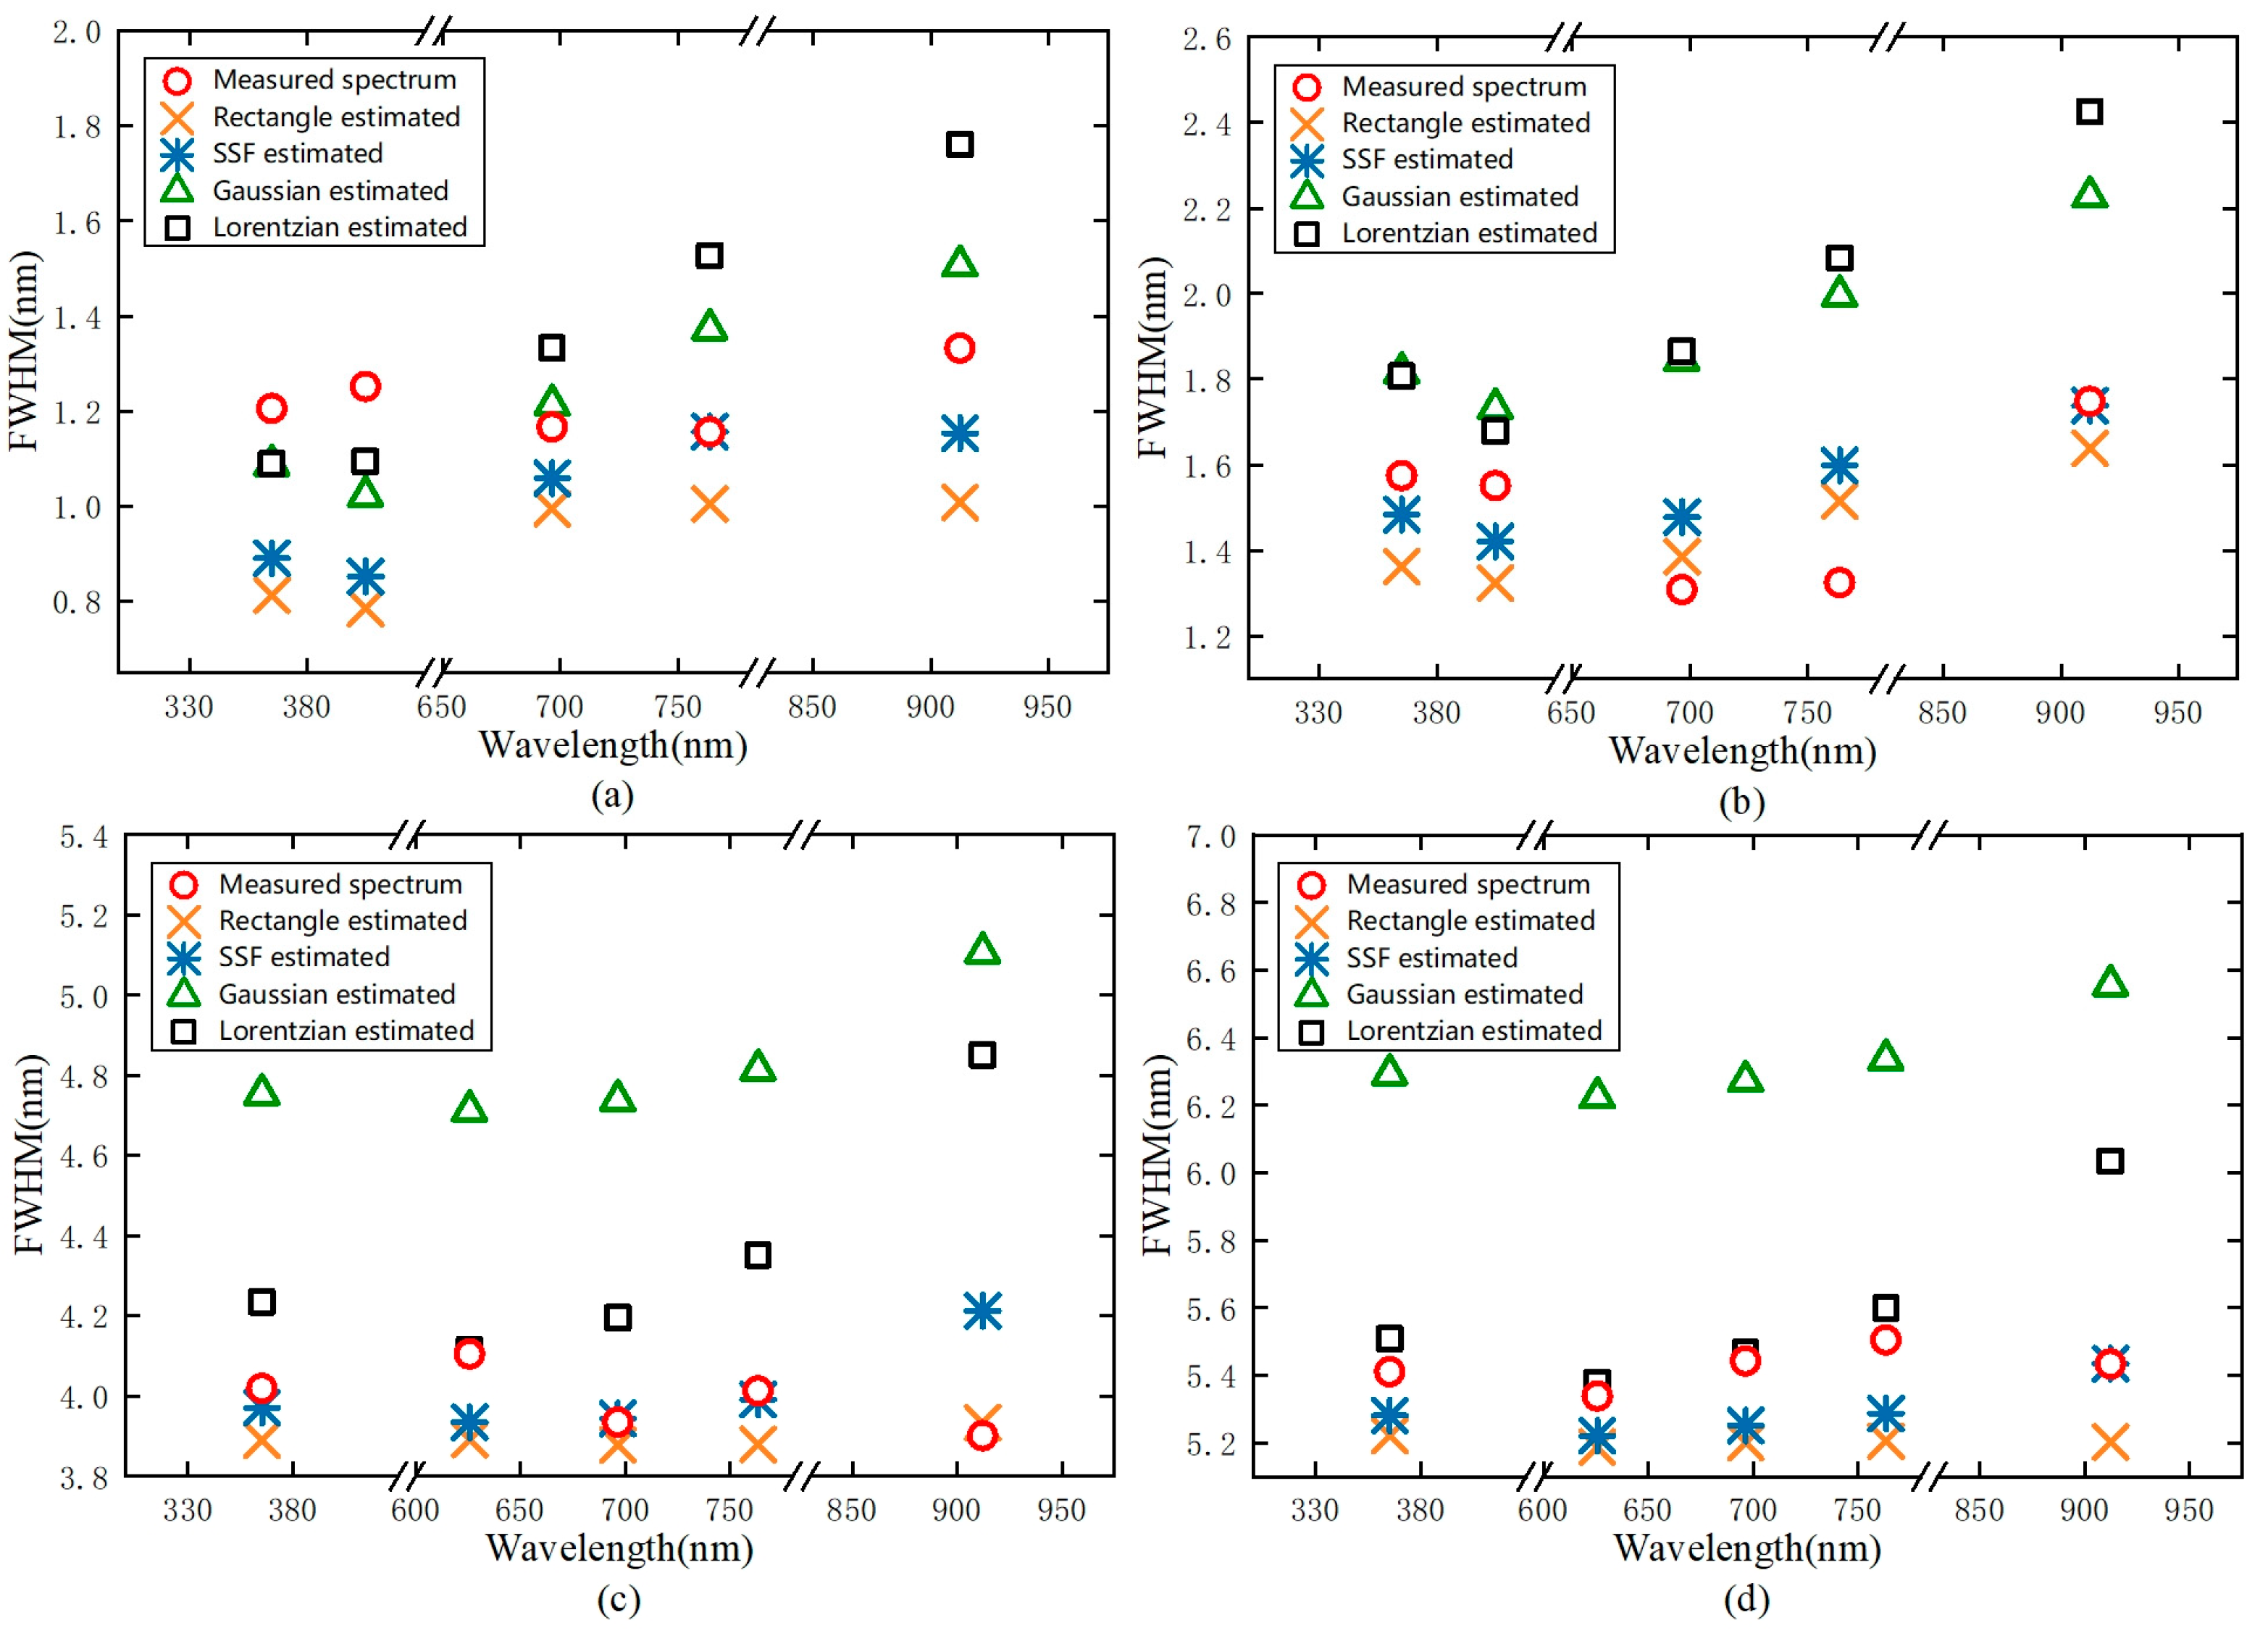
To find the differences between the simulated and actual results, we first calculated the simulated resolution by OTF model with four slit functions, namely the rectangle functions, convolution of SSF with the rectangle function, Gaussian function, and Lorentzian function. Thereafter, a standard Hg-Ar light source was used to calibrate for each optical spectrometer and obtain the spectra with different slits. Next, we used the spectral data to measure the FWHM of the wavelength and compare it with the simulation results. For a more concise and accurate comparison, we averaged the spectral data of five spectrometers. Considering the wavelength range for spectrometer detection and intensity, we analyzed the five wavelengths at the edge and near the center for each slit width. The results are displayed in Figure 3.
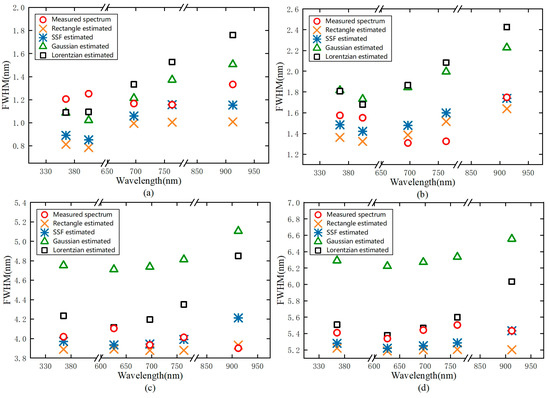
Figure 3.
Wavelength resolutions at slits widths of (a) 25 μm, (b) 50 μm, (c) 150 μm, and (d) 200 μm. The circle represents the measured spectrum, and the cross, asterisk, triangle, and square represent the estimation results of rectangle function, convolution of SSF with rectangle function, Gaussian function, and Lorentzian function, respectively.
For spectrometers of 25 μm and 50 μm slit width, the wavelengths chosen for comparison were 365.010 nm, 404.656 nm, 696.543 nm, 763.511 nm, and 912.297 nm, as displayed in Figure 2a,b. For spectrometers with 25 μm slit width, the simulation resolution obtained by the OTF model with the Gaussian function was closest to the actual resolution compared to that of the other three slit functions. For spectrometers with 50 μm slit width, the simulation result obtained by OTF model with rectangle function and convolution of SSF with rectangle function were closer to the actual resolution than that of the other two methods.
For spectrometers with 150 μm and 200 μm slit width, the wavelengths chosen for comparison were 365.010 nm, 625.890 nm, 696.543 nm, 763.511 nm, and 912.297 nm. For spectrometers of these two slit widths, the simulation results calculated by the OTF model with the rectangle slit function and SSF convolved with rectangle slit function were nearly consistent with the actual measured data. In addition, the average error of SSF convolved with rectangle slit function was less than 0.2 nm. Furthermore, the resolution of some wavelengths simulated by OTF model with the Lorentzian slit function was nearly identical to the actual measured data for the slit width of 200 μm.
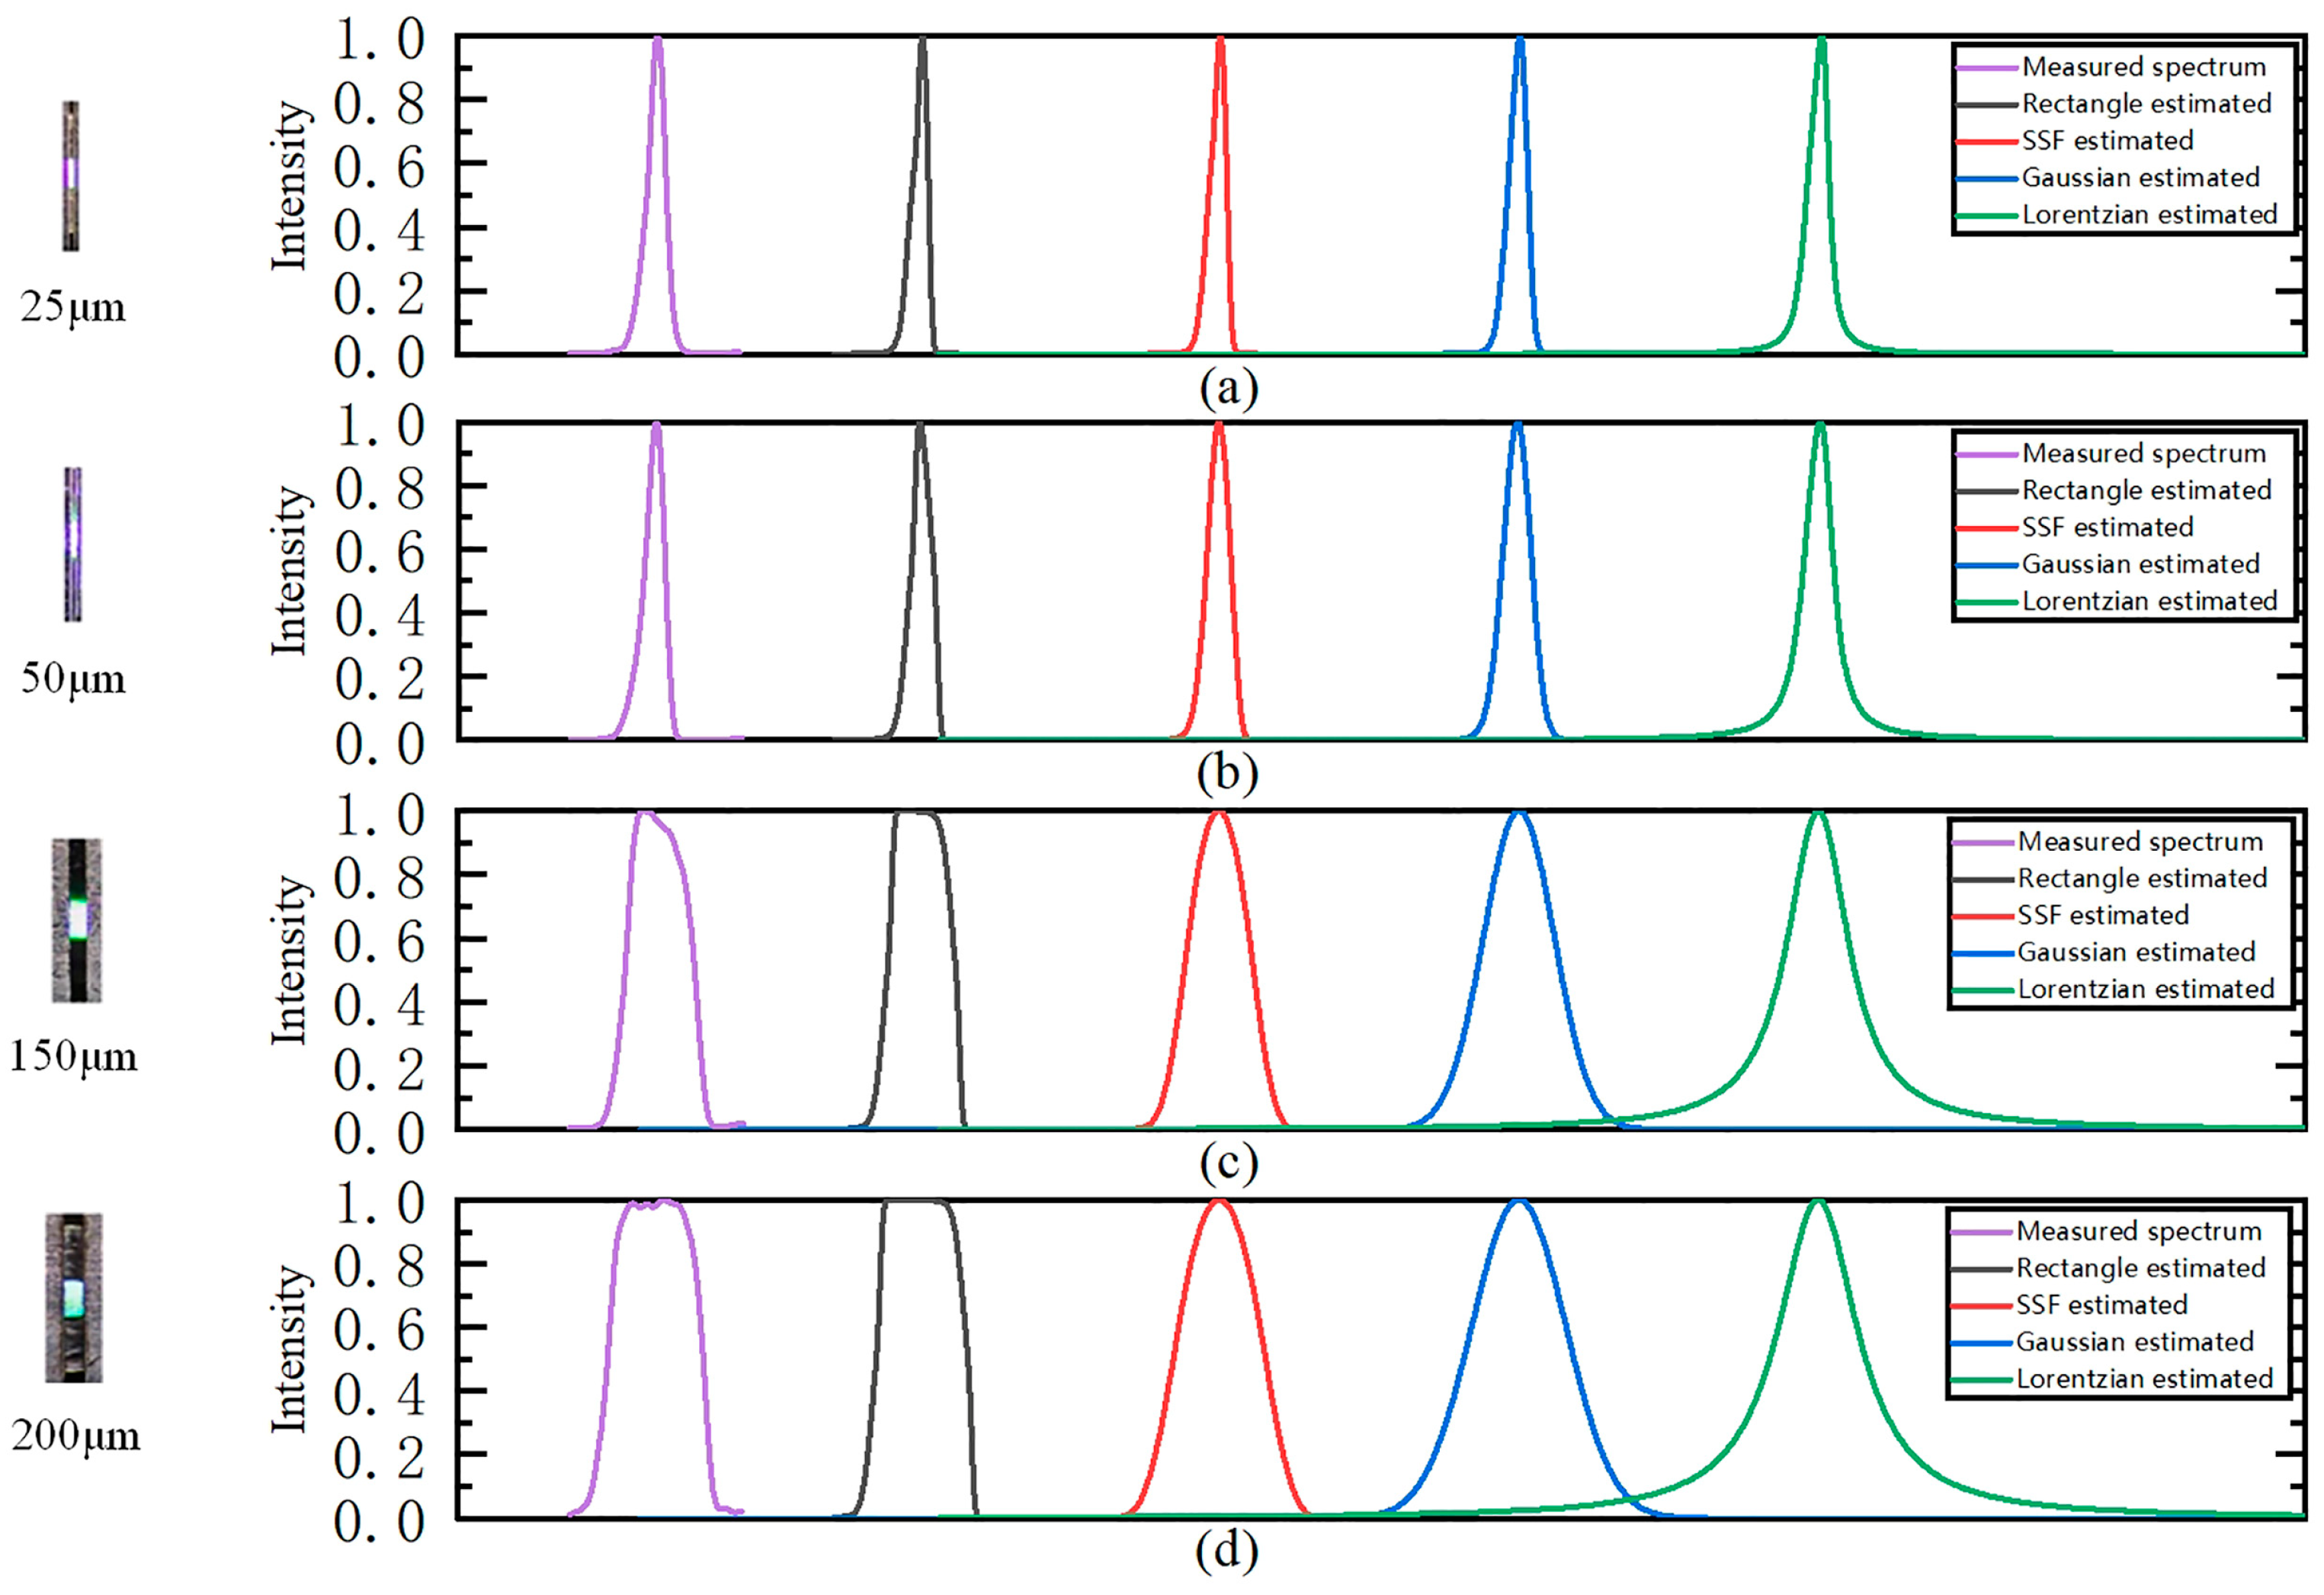
To further compare the simulation effects of the four slit functions, we then compared measured and simulated wavelength distribution of 696.543 nm at different slit widths, as displayed in Figure 4.
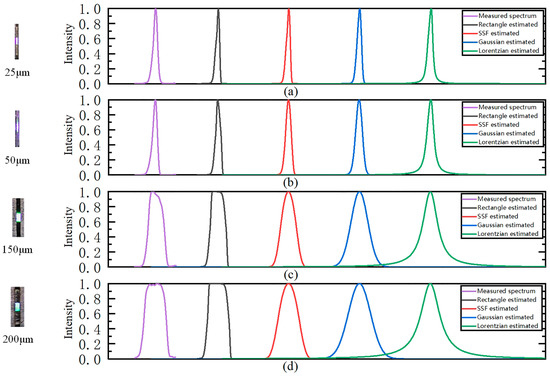
Figure 4.
Measured and simulated wavelength distribution of 696.543 nm at f slit width of (a) 25 μm, (b) 50 μm, (c) 150 μm, and (d) 200 μm.
As per the figure, the OTF model with rectangle function, convolution of SSF rectangle function, and Gaussian function can simulate the wavelength distribution well when the slit width is relatively narrow, such as 25 μm and 50 μm.
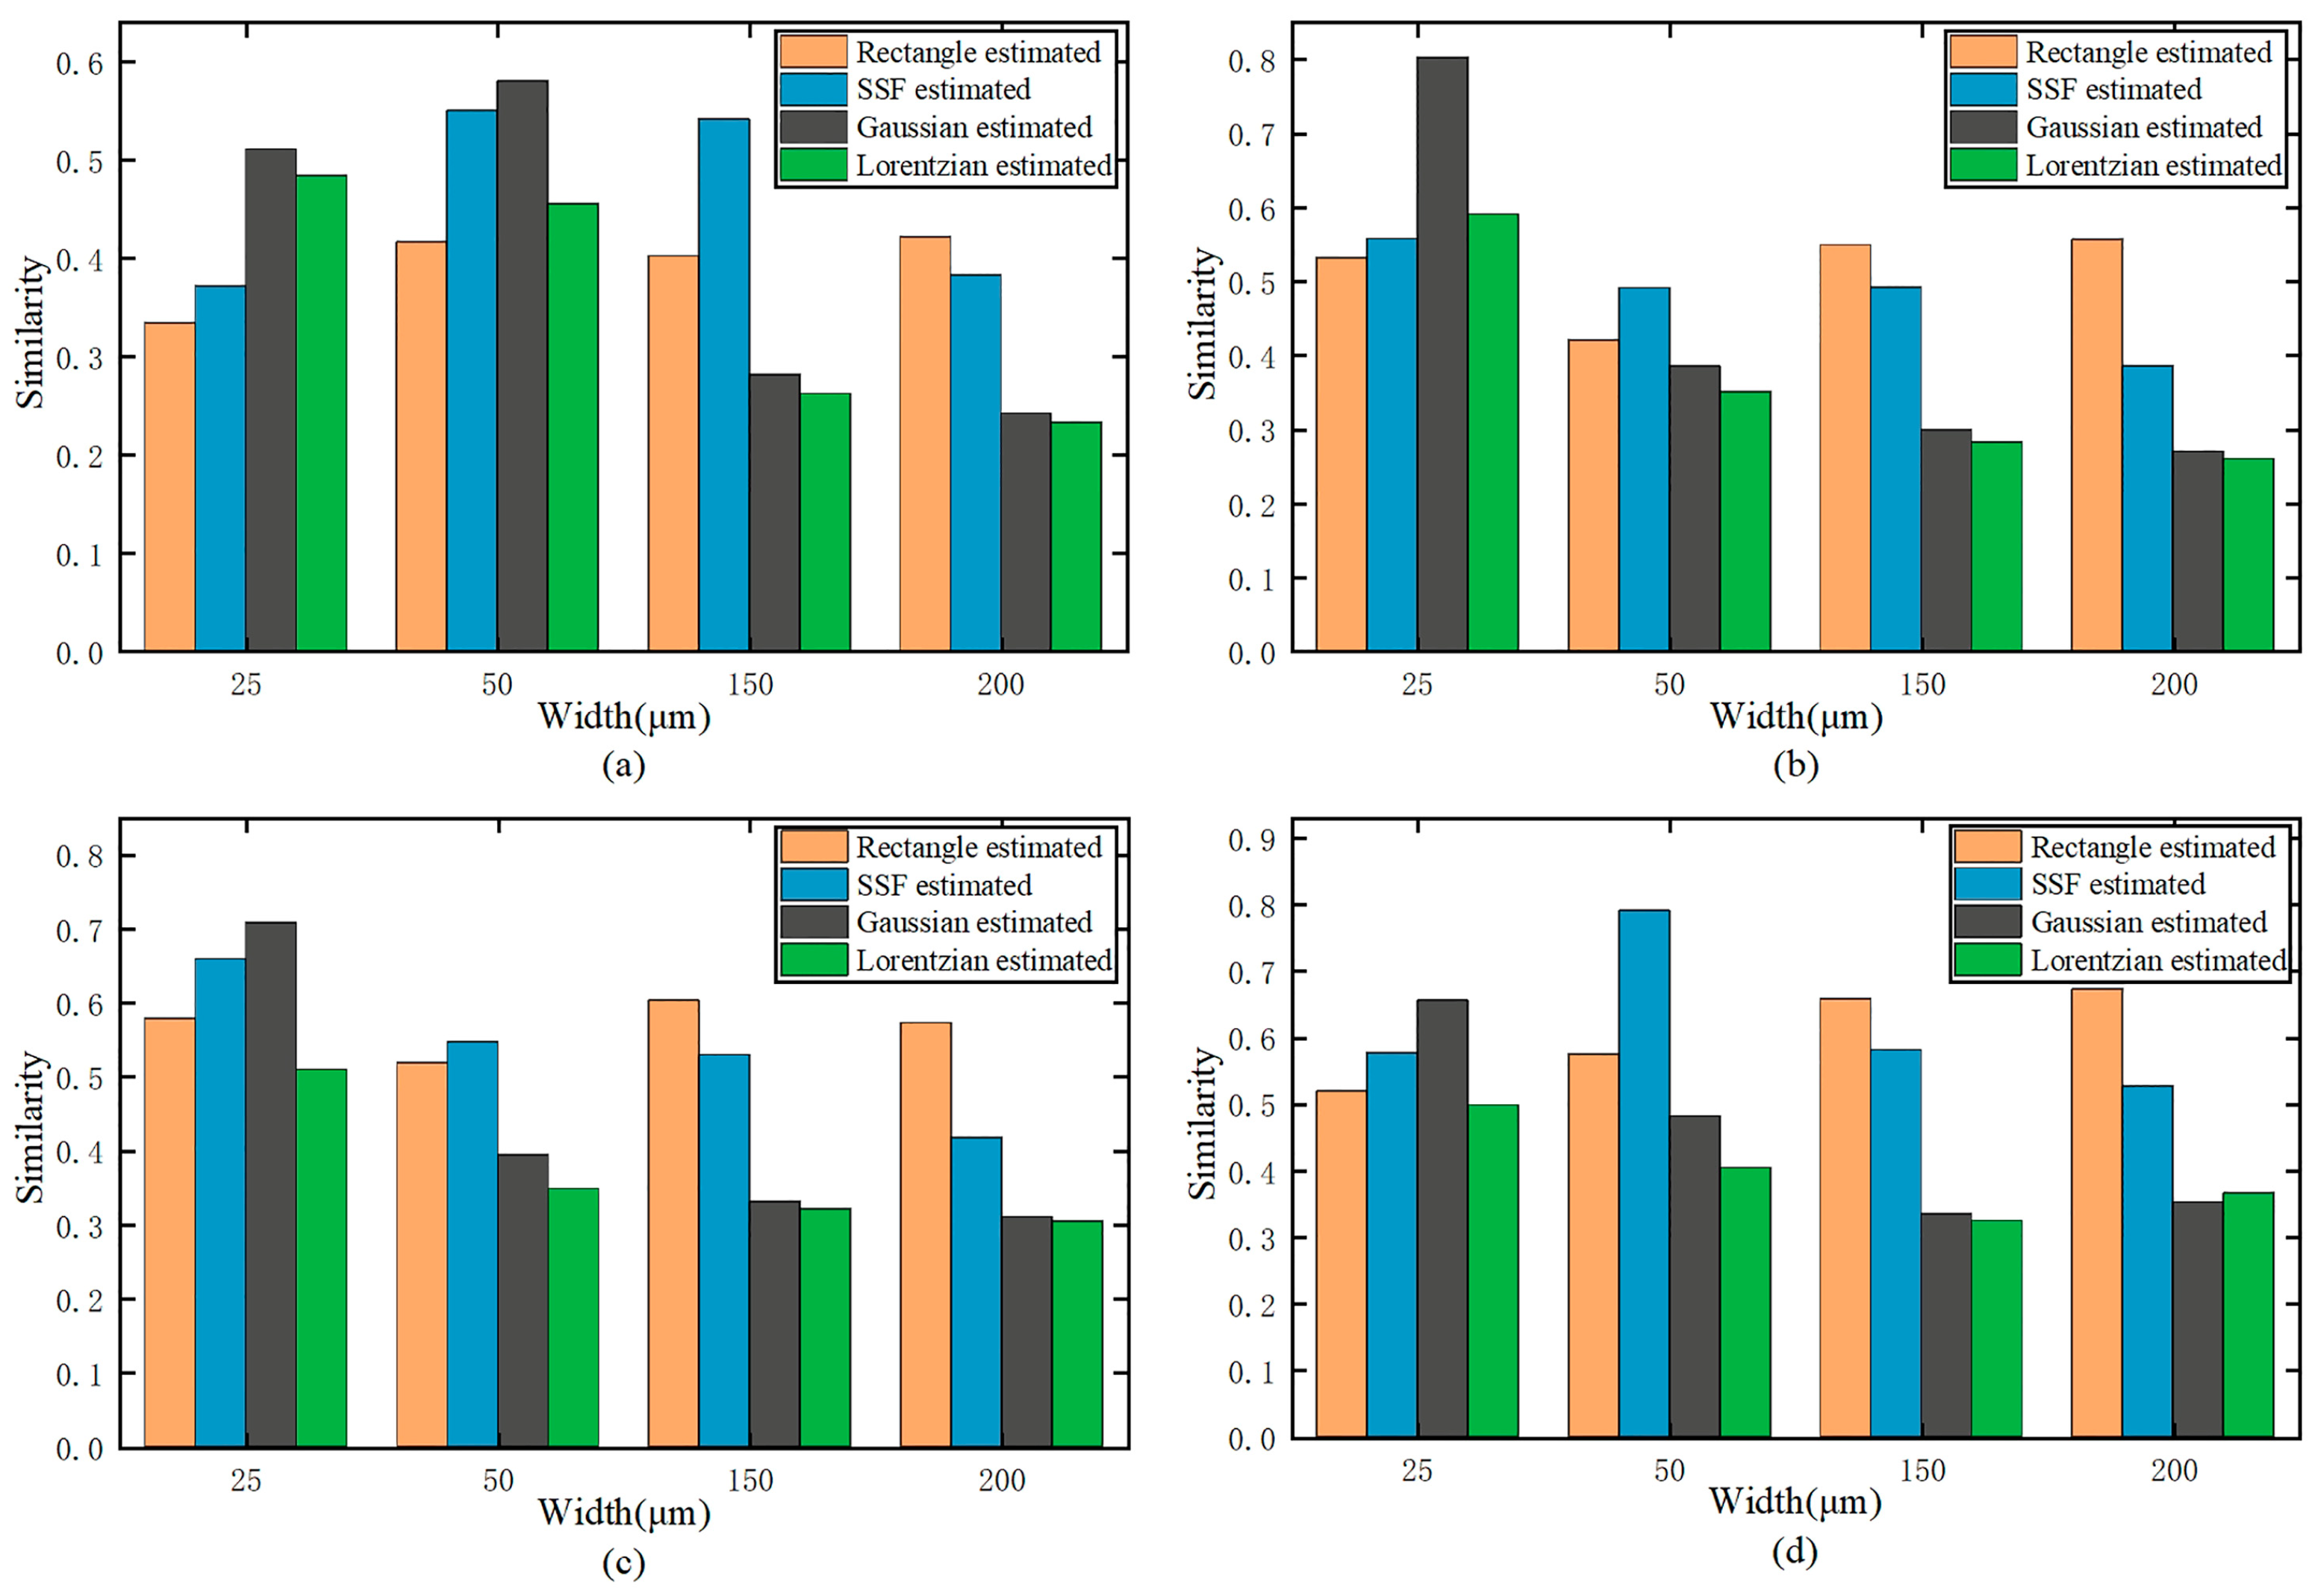
To further demonstrate the difference between simulated waveforms with different slit functions and measured waveforms, we used the Euclidean distance to calculate the similarity between the simulation and actual waveform of four wavelengths, as displayed in Figure 5. As per the figure, the Gaussian and Lorentz functions, particularly the Gaussian function, are more similar to the measured waveform when the slit width is relatively narrow. The average similarity between the waveform of the four wavelengths obtained by the OTF model with Gaussian function evaluation and the corresponding wavelength waveform measured in practice is about 0.67. However, they lose their advantages when the slit width increases, and the waveform simulated using the other two slit functions, namely rectangle function and the convolution of SSF with rectangle function, resembles the actual measurement more closely. For example, for a spectrometer with a 200 μm width slit, the average similarity between the four wavelength waveforms obtained and the actual results are 0.55 and 0.54 when using the OTF model with rectangle function and the convolution of SSF with rectangle function, respectively.
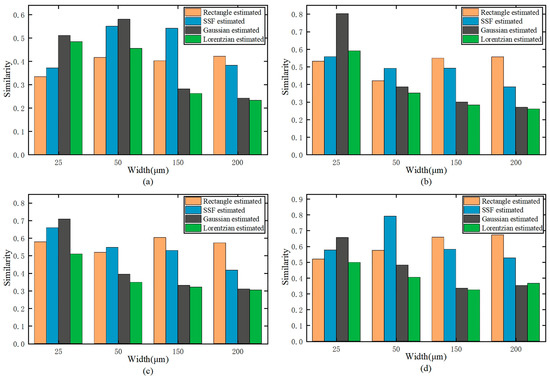
Figure 5.
Similarity between simulated waveform and measured waveform with different slit functions for wavelengths of (a) 365. 010 nm, (b) 696.543 nm, (c) 763.511 nm, and (d) 912.297 nm.
3.3. Discussion
The final image obtained by the detector of the spectrometer is the slit image processed by the optical system; thus, the size of the slit directly affects the resolution of the spectrometer. An ideal slit is made of infinitely thin, infinitely absorbing material. Real slits have finite thickness, and protons can interact with them, losing energy and changing direction without actually stopping. When the other components of the spectrometer remain unchanged, the smaller the slit width in a certain range, the better the spectral resolution of the spectrometer; this can be seen in Figure 3. However, the decrease in slit width is accompanied by a decrease in the luminous flux of the spectrometer, and the diffraction effect will be stronger. In order to accurately evaluate the spectral resolution under different slit widths and describe the influence of slit widths on spectral resolution, we introduced slit function into the experiment.
In this study, we used an OTF model with four different slit functions to evaluate the resolution of the spectrometer. When the slit width of the spectrometer is narrow, the resolution value obtained by using the OTF model with Gaussian function evaluation is closest to the actual measured resolution (Figure 3a). However, as the slit width increases, the Gaussian slit function becomes inapplicable (see Figure 3b–d). These results may have been obtained because light produces a strong diffraction when it passes through a narrow slit, which the Gaussian function can describe effectively. However, as the slit width increases, the diffraction decreases, which renders the Gaussian function unsuitable. Meanwhile, we compared the spectral lines calculated by the OTF model with the actual measured spectrograms (Figure 4 and Figure 5) at different wavelengths, and it can be seen that when the slit of the spectrometer is narrow, the similarity between the spectral line obtained by the OTF model with Gaussian function and the actual measured spectral line is the highest, and when the slit is wider, the similarity decreases, which also proves this point. In the case of a large slit width of the spectrometer, the OTF model with rectangular function or the convolution of SSF with rectangle function have a better evaluation effect (Figure 3 and Figure 5), and it can also be seen from Figure 3 and Figure 5 that the resolution evaluation effect and waveform similarity of the OTF model with convolution of SSF with rectangle function are higher than that of the OTF model with rectangle function when the slit is relatively narrow, which can indicate that the convolution of SSF with rectangle function also reflects the possible diffraction effect of light passing through the slit to some extent as well. In addition, although OTF model with Lorentzian function can be used to obtain a resolution similar to that of the actual spectra obtained at the 200 μm slit width, the simulated wavelength distribution has a large deviation from the actual results; therefore, it is not suitable for the resolution evaluation of spectrometers of large slit widths.
4. Conclusions
In this study, we proposed an OTF-based resolution evaluation method in the optical design process of crossed-asymmetric Czerny-Turner spectrometers, and studied the effect of slit width of a spectrometer on resolution. To explore the impact of slit widths, we selected four kinds of slit functions: rectangle function, convolution of SSF with rectangle function, Gaussian function, and Lorentzian function. The resolution of the simulation was calculated using OTF model with different slit functions, and the results were compared with actual measurements performed using homemade spectrometers. In addition, we investigated the adaptability of different slit functions at different slit widths. The simulation and experimental results indicated that for a relatively narrow slit, such as 25 μm, the Gaussian function can describe the distribution of light well, and the corresponding resolution results obtained are closer to reality. As the slit becomes wider, such as 50 μm, 150 μm, and 200 μm, the rectangle function or convolution of SSF with rectangle function are more suitable. Therefore, considering the possible diffraction effect from slits, the OTF model with Gaussian function may be preferred for the evaluation of spectral resolution of spectrometers with narrow slit widths, and OTF model with rectangle slit function or the convolution of SSF with rectangle function may be more suitable for the evaluation of spectral resolution of spectrometers with wider slit widths.
For spectrometers with different slit widths, using the OTF model with different slit functions, the resolution evaluation results approximating the actual spectral resolution can be obtained preliminarily at the optical design stage through simulation and calculation. Theoretically, the proposed method is applicable to the evaluation of spectral resolution of all optical structure spectrometers. However, due to the experimental conditions, only a crossed-asymmetric Czerny-Turner optical structure was used as an example in this paper. We hope this study can provide guidance for the evaluation of spectral resolution in the optical design process.
Author Contributions
Conceptualization, G.X.; validation, L.Z. and F.F.; visualization, L.G.; writing—review and editing, Z.F.; methodology and writing—original draft prep, W.S. All authors have read and agreed to the published version of the manuscript.
Funding
This research received no external funding.
Conflicts of Interest
The authors declare no conflict of interest.
References
- Chen, L.; Gao, Z.; Ye, J.; Cao, X.; Xu, N.; Yuan, Q. Construction method through multiple off-axis parabolic surfaces expansion and mixing to design an easy-aligned freeform spectrometer. Opt. Express 2019, 27, 25994–26013. [Google Scholar] [CrossRef] [PubMed]
- Wang, X.; Zhang, Z.; Wang, S.; Huang, Y.; Lin, G.; Li, Z.; Yang, X. Atmospheric Aerosol Multiband Synthesis Imaging Spectrometer. Appl. Spectrosc. 2019, 73, 221–228. [Google Scholar] [CrossRef] [PubMed]
- Jiang, A.Q.; Zang, K.Y.; Tu, H.T.; Chen, J.K.; Lu, W.J.; Yoshie, O.; Wang, X.P.; Xiang, X.D.; Lee, Y.P.; Chen, B.; et al. Ultrahigh-resolution spectrometer based on 19 integrated gratings. Sci. Rep. 2019, 9, 10211. [Google Scholar] [CrossRef] [PubMed]
- Lu, Q.; Yan, C.L.; Fu, N.; Yang, Y.; Chen, C.Y.; Xiao, J.; Wang, K.; Zou, Y. Measurement and identification of visible lines from W10+. J. Quant. Spectrosc. Radiat. Transf. 2021, 262, 107533. [Google Scholar] [CrossRef]
- Boschetti, A.; Taschin, A.; Bartolini, P.; Tiwari, A.K.; Pattelli, L.; Torre, R.; Wiersma, D.S. Spectral super-resolution spectroscopy using a random laser. Nat. Photonics 2020, 14, 177–182. [Google Scholar] [CrossRef]
- Tang, M.; Fan, X.; Wang, X.; Xu, Y.; Que, J.; He, J. General study of asymmetrical crossed Czerny-Turner spectrometer. Appl. Opt. 2015, 54, 9966–9975. [Google Scholar] [CrossRef] [PubMed]
- Martínez, R.; Mejía, J.; Aguilar, M.; Moreno, C. Spectral resolution measurement technique for Czerny-Turner spectrometers based on spectral interferometry. In Proceedings of the Interferometry XVIII, San Diego, CA, USA, 30 August–1 September 2016; International Society for Optics and Photonics: San Diego, CA, USA, 2016. [Google Scholar]
- Zeng, C.; Han, Y.; Liu, B.; Sun, P.; Li, X.J.; Chen, P. Optical design of a high-resolution spectrometer with a wide field of view. Opt. Lasers Eng. 2021, 140, 106547. [Google Scholar] [CrossRef]
- Li, S.; Zhao, W.; Xu, H.; Qiu, L.; Wang, Y. Optical system design of aberration-corrected Czerny-Turner imaging spectrometer with high resolution. Opt. Commun. 2020, 459, 125015. [Google Scholar] [CrossRef]
- Wang, C.; Chen, H.; Zhang, Y.; Chen, S.; Guo, P.; Wang, L. Optical design of a crossed Czerny-Turner spectrometer with a linear array photomultiplier tube. Appl. Opt. 2019, 58, 7789–7794. [Google Scholar] [CrossRef] [PubMed]
- Zhang, G.; Lin, H. Analysis of spectral resolution of a portable cross Czerny-Turner spectrometer. In Applied Mechanics and Materials; Trans Tech Publications Ltd.: Zurich, Switzerland, 2013; Volume 241–244, pp. 449–456. [Google Scholar]
- Xia, G.; Wu, S.; Wang, G.; Hu, M.; Xing, J. Astigmatism-free Czerny-Turner compact spectrometer with cylindrical mirrors. Appl. Opt. 2017, 56, 9069–9073. [Google Scholar] [CrossRef] [PubMed]
- Yang, H.; Chen, K.; Huang, X.; He, Q.; Jin, G. Global Modeling and Analyzing of Grating Spectrometers. Spectrosc. Spectr. Anal. 2009, 29, 281–284. [Google Scholar]
- Mouroulis, P.; Green, R.O.; Chrien, T.G. Design of pushbroom imaging spectrometers for optimum recovery of spectroscopic and spatial information. Appl. Opt. 2000, 39, 2210–2220. [Google Scholar] [CrossRef] [PubMed]
- Mouroulis, P.; Green, R.O. Review of high fidelity imaging spectrometer design for remote sensing. Opt. Eng. 2018, 57, 040901. [Google Scholar] [CrossRef]
- Lee, K.-S.; Thompson, K.P.; Rolland, J.P. Broadband astigmatism-corrected Czerny-Turner spectrometer. Opt. Express 2010, 18, 23378–23384. [Google Scholar] [CrossRef] [PubMed]
- Silny, J.F. Resolution modeling of dispersive imaging spectrometers. In Proceedings of the SPIE Imaging Spectrometry XXI, San Diego, CA, USA, 29–30 August 2016; Volume 9976, p. 99760A. [Google Scholar]
- Rossmann, K. Point spread-function, line spread-function, and modulation transfer function: Tools for the study of imaging systems. Radiology 1969, 93, 257–272. [Google Scholar] [CrossRef]
- Nicodemus, F.E. (Ed.) Self-Study Manual on Optical Radiation Measurements: Part I—Concepts; National Bureau of Standards; U.S. Department of Commerce: Washington, DC, USA, 1979; Chapters 7–9. [Google Scholar]

Publisher’s Note: MDPI stays neutral with regard to jurisdictional claims in published maps and institutional affiliations. |
© 2022 by the authors. Licensee MDPI, Basel, Switzerland. This article is an open access article distributed under the terms and conditions of the Creative Commons Attribution (CC BY) license (https://creativecommons.org/licenses/by/4.0/).