Article

Correction of Spatial Nonuniformity in Spectroradiometer Field-of-View Using a Concentric-Circles Method

Aviation Engineering School, Air Force Engineering University, Xi’an 710043, China
*
Author to whom correspondence should be addressed.
Photonics 2022, 9(2), 56; https://doi.org/10.3390/photonics9020056
Submission received: 11 December 2021 / Revised: 13 January 2022 / Accepted: 17 January 2022 / Published: 21 January 2022

Abstract

:
Spectroradiometers exhibit the smallest aberration and the optimum response at the field-of-view (FOV) center. The aberration increases and the response deteriorates at positions further away from the FOV center, which leads to nonuniformity in the spectroradiometer FOV. In this study, a concentric-circles method for correcting the spectroradiometer FOV nonuniformity was developed. The calibration experiment for FOV nonuniformity was conducted by establishing the experimental platform. The nonuniformity correction coefficients were obtained and then used to fit the correction function curve within the whole FOV, allowing for correction of measurement targets with an arbitrary shape. The radiation intensity of the blackbody at different temperatures was obtained by measurement, and the nonuniformity coefficient was used to correct it. After correction, the error was within 1.84% for the spectrally integrated radiant intensity in the non-absorption band. Using this correction method, efficient calibration of spectroradiometer nonuniformity can be achieved, thereby enhancing the measurement accuracy of the spectroradiometer.

1. Introduction

Fourier-transform infrared (FTIR) spectroscopy has found increasingly extensive applications in environment monitoring, pollution prevention and control [1,2,3], infrared target detection for the military [4,5,6,7], atmospheric transmittance measurement, and other fields [8,9,10,11]. A Fourier infrared spectroradiometer can obtain the spectral radiation characteristics of a source, but its measurement results generally differ considerably from those calculated under ideal conditions. The causes of the errors include issues with the repeatability of spectroradiometer measurements, detector nonlinearity, interference from infrared background radiation, atmospheric transmission attenuation, and human errors in experimental apparatus testing. The nonuniformity of the spectroradiometer’s field-of-view (FOV) response caused by off-axis aberration also significantly impacts measurements. At the center of the spectroradiometer FOV, the aberration is the smallest and the best response can be obtained. At long distances from the FOV center, the aberration increases and the response deteriorates. Therefore, when the target to be measured deviates from the FOV center or occupies a major part of the spectroradiometer FOV, the radiation measurement results contain considerable errors compared to the theoretical values.
The spectroradiometer consists of four parts: an optical system, a detection system, a signal processing module, and a computer module [12,13]. The optical system receives and collects the energy of the target radiation source. The detection system then transforms the collected energy into physical quantities, such as voltage and resistance. The signal processing module amplifies the physical quantities, which are ultimately transmitted to the computer module for data visualization by supporting software.
Among the modules in the spectroradiometer, the off-axis parabolic mirror in the optical system constitutes the fundamental cause of FOV nonuniformity. For the off-axis parabolic mirror, the aberration can be ignored on its optical axis, but it increases rapidly when the deviation from the optical axis exceeds a certain value. Therefore, the target light can be recovered well at positions close to the optical axis. However, at positions further away from the optical axis, aberration may result in different responses from the spectroradiometer for the same target at different FOV positions. The greater the deviation from the optical axis, the worse the response of the spectroradiometer is. Furthermore, aberration is a complex function related to the structure of an optical system that cannot be directly expressed as a specific function.
References [14,15] studied the response nonuniformity of the spectral testing apparatus in the theoretical measurement regions. They evaluated the practical spectroradiometer FOV range and the responses at different positions within the FOV range and obtained the directional response function, which is of far-reaching significance for accurate spectroradiometer measurements.
In 2015, Huang, W.; Ji, H.H.; Si, R. [16] corrected the nonuniformity in the results measured by an FTIR spectroradiometer. By studying the effects of FOV and field area on spectral radiant intensity, they concluded that measurements for the same target varied with the relative target position in the FOV. Furthermore, by integrating the theoretical spectral radiant intensities in the band from 3.5~4.0 μm and comparing the integral with the test value, a correction coefficient was obtained, which was then used for uniformity correction. With this approach, the error between the corrected test result and the spectral radiant intensity calculated under ideal conditions was reduced. However, this method requires the acquisition of the target radiation source’s test and theoretical radiation values, which are then used to obtain the correction coefficient. Furthermore, it does not explain the specific law of nonuniformity.
In 2018, Wang, X.X.; Yang, H.R.; Yu, B. et al. [17] corrected the nonuniformity of the spectroradiometer FOV using equal-solid-angle calibration. First, by studying the nonuniformity of spectroradiometer FOV, the voltage responses at different FOV positions were obtained, revealing that the response at the edge was approximately 50% lower than that at the center. For the nonuniformity of the FOV, an equal-solid-angle calibration method was proposed. As the distance between the spectroradiometer and the blackbody was set reasonably, the solid angle when the spectroradiometer measured the target was the same as the solid angle when the blackbody was measured. In this way, the optical paths of the spectroradiometer when measuring the blackbody and the target to be measured were the same, eliminating the influence of the nonuniformity of the FOV. The final results revealed that the measurement error was less than 2%. This method requires that the blackbody and the target have substantially the same shape. The spectroradiometer has the same optical path when measuring both objects. However, it is difficult to find blackbodies with similar shapes for equal-solid-angle calibration for irregular target radiation sources. There are certain limitations present.
There have been in-depth reports about the suppression techniques that can be used for background radiation and the spectroradiometer response function, with the aim of improving the measurement accuracy of the spectroradiometer. However, few studies have focused on correcting the spatial nonuniformity of the spectroradiometer FOV. With the existing methods, the inversion is performed with the help of the theoretical value of the radiation intensity of the target radiation source. However, the theoretical value of the radiation intensity of the target radiation source is generally difficult to obtain in practical tests. Alternatively, it is necessary to use a blackbody with a similar shape as the target radiation source to achieve better operation. However, this method cannot be applied when the target radiation source has an irregular shape; for example, when measuring an engine tail jet. In general, the existing processing methods still have limitations. Therefore, a concentric-circles method for correcting the nonuniformity of spectroradiometer FOV was developed in this study. It can be applied to target radiation sources of any shape and with unknown theoretical radiation intensities.

2. Calibration Scheme for FOV Nonuniformity

2.1. Correction Using Concentric-Circles Method

Spectroradiometers exhibit minor aberration and an optimum response at the FOV center. The aberration increases and the response deteriorates further away from the FOV center, which leads to phase nonuniformity in the spectroradiometer FOV. The axisymmetric aberration of the optical system, which causes the nonuniform response of the FOV, is circularly symmetric and gradually increases along the FOV, taking the center of the FOV spectroradiometer as the center of the circle. This indicates a centrosymmetric distribution. Therefore, a correction scheme using a concentric-circles method for the nonuniformity of the FOV of the spectroradiometer can be proposed.
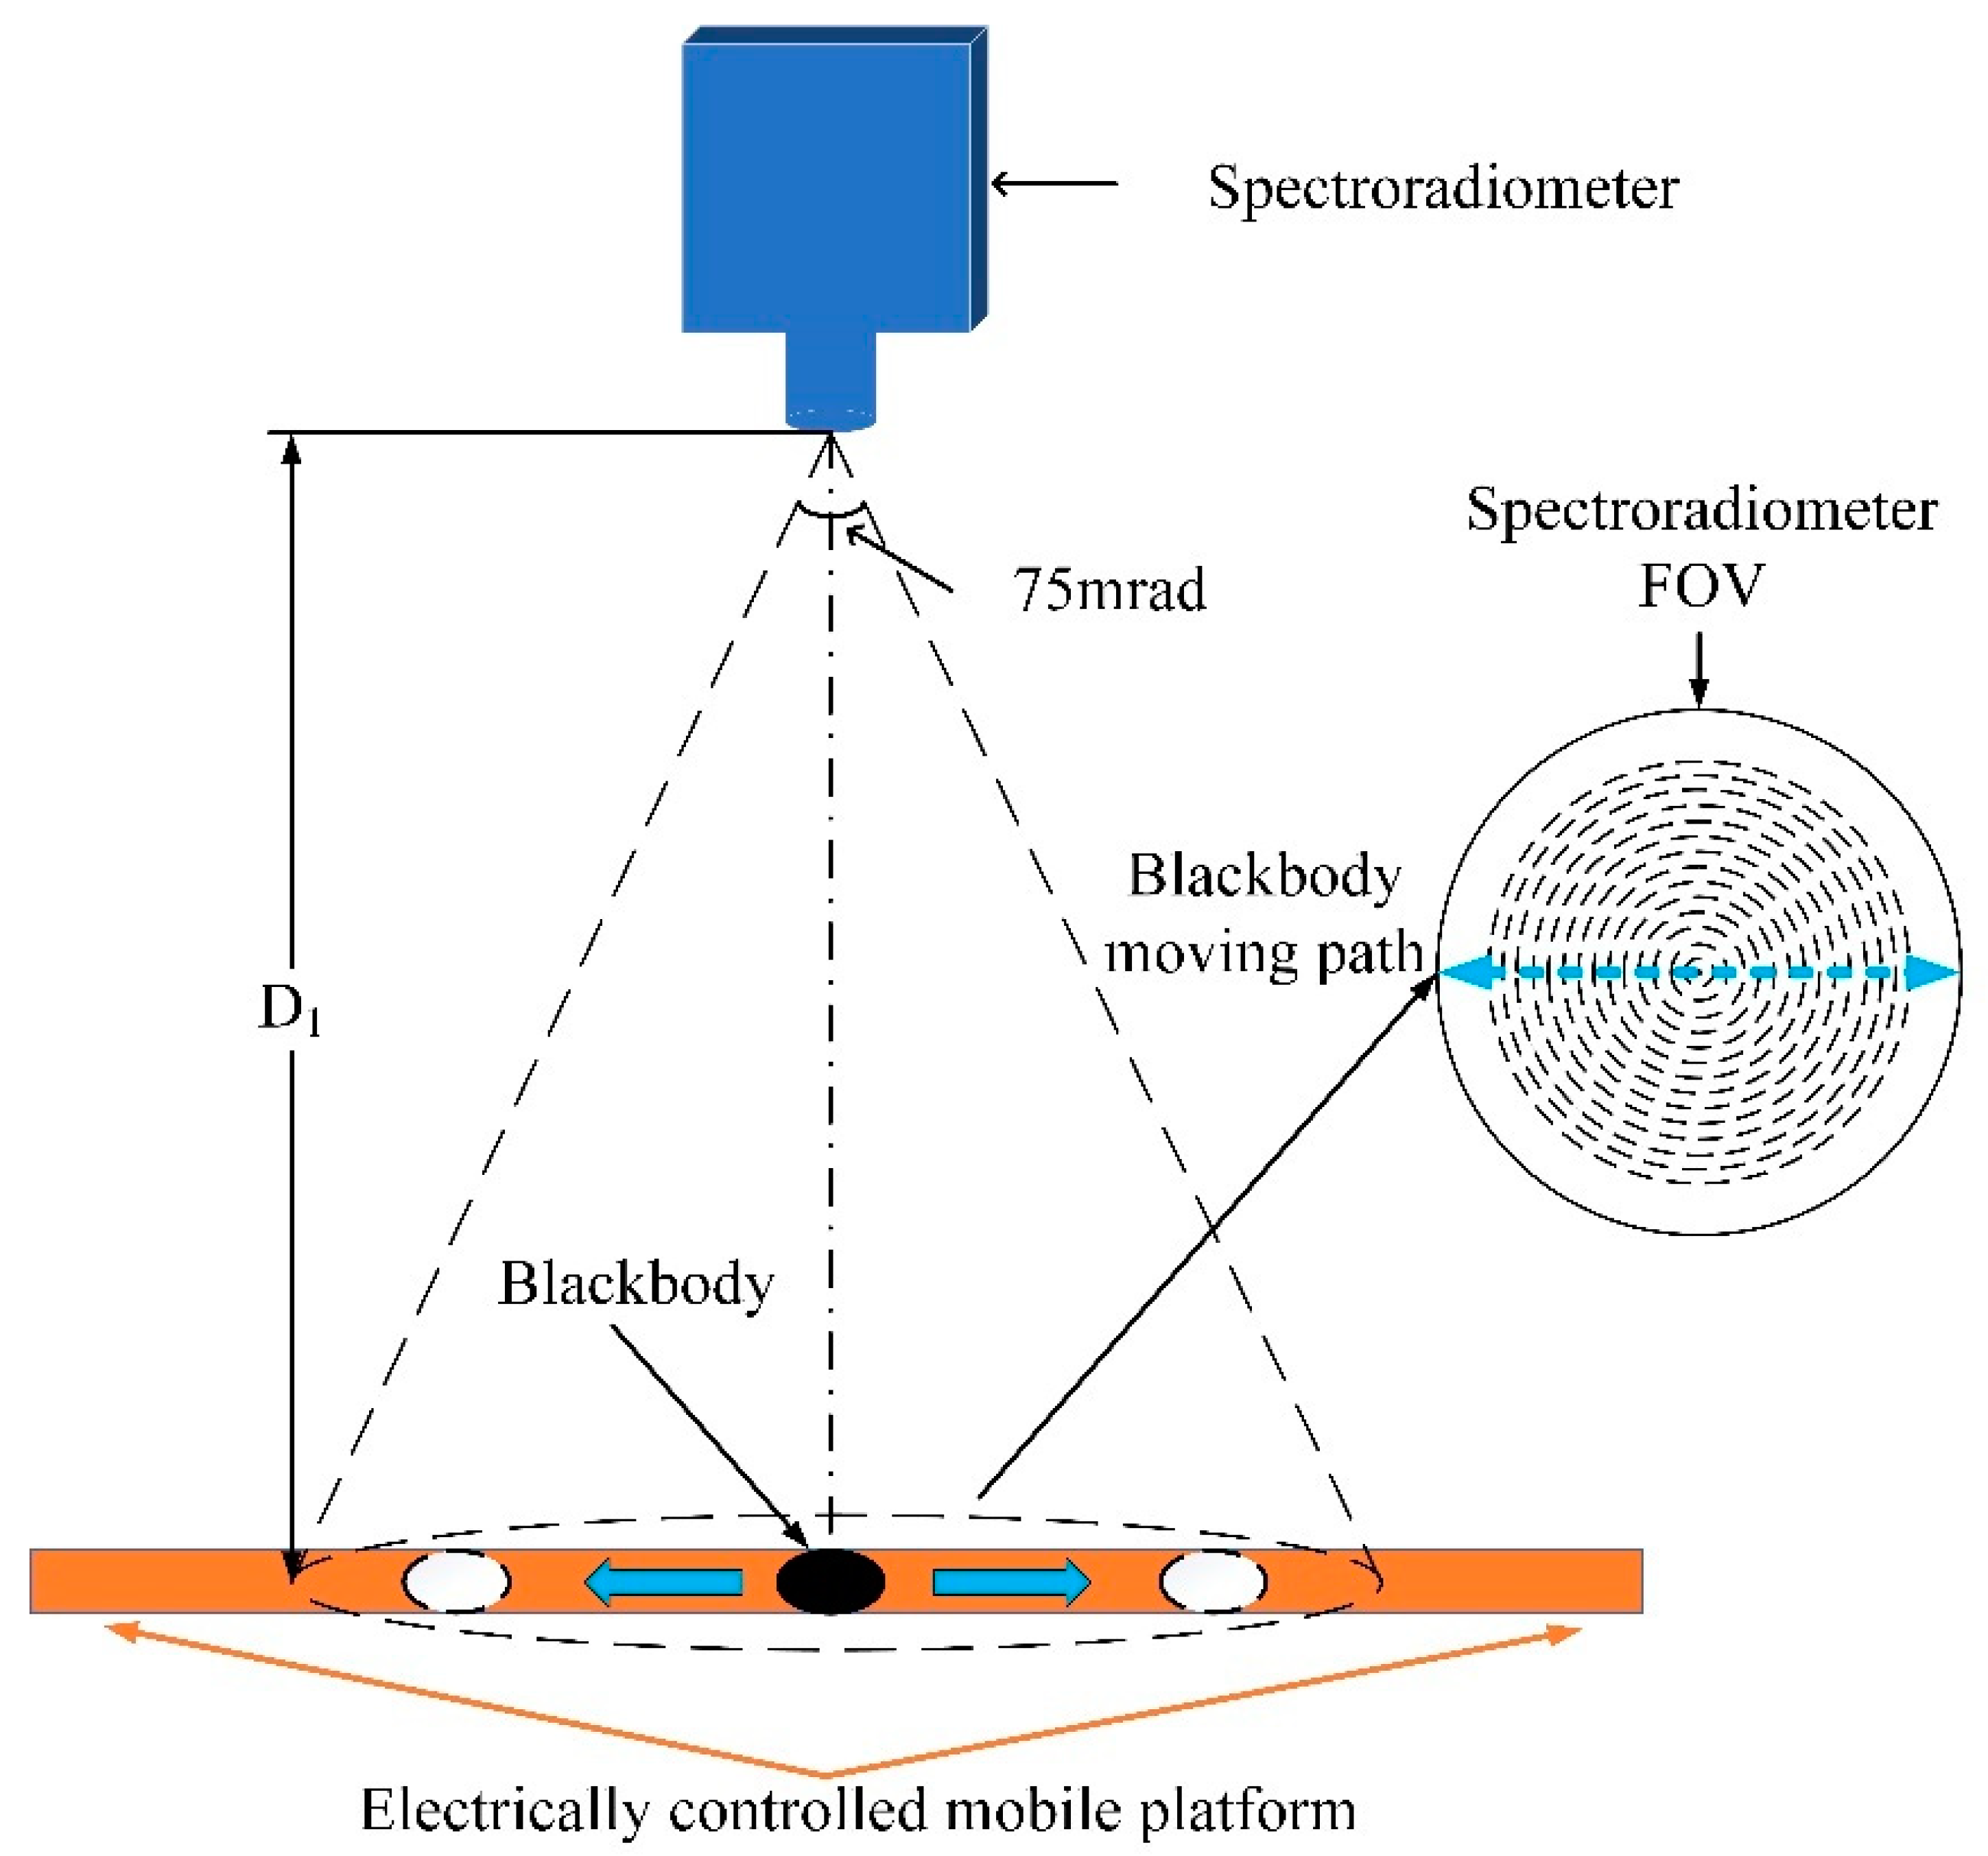
The center of the FOV of the spectroradiometer was taken as the concentric center of the circle. Moreover, the FOV was divided into concentric rings. The nonuniformity of the FOV along the same ring was the same. The blackbody to be calibrated moved on different rings along the red line, as shown in Figure 1. For the entirety of the moving process, the blackbody was always completely located in the FOV of the spectroradiometer. At this time, the radiation value received by the spectroradiometer did not change, and the theoretical output response remained unchanged. However, due to the nonuniformity of the FOV, the output response value of the spectroradiometer changed when the blackbody was in different positions. Using the test results for spectroradiometers with blackbodies in different rings, the nonuniformity of the FOV of the spectroradiometers was calibrated.
In the calibration process, in order to reduce the measurement error, two measurements were made on the left and right sides of the same ring. The measurement numbers on the left were marked as −1, −2, …, −i, …, −n, and the measurement numbers on the right were marked as 1, 2, …, i, …, n. The average of the two measurements of i and -i was calculated in order to replace the measured response value for the entire ring. When the number of ring divisions increases infinitely, a correction coefficient curve can be obtained. In this way, a more accurate response value at each position in the FOV of the spectroradiometer can be obtained, and the nonuniformity coefficient at all positions of the FOV can be calibrated.

2.2. Experimental Scheme

The experiment setup included a spectroradiometer, an electrically controlled mobile platform, and standard-surface blackbodies. The spectroradiometer was a model MR170 produced by ABB, with a spectral range of 2~15 μm and optional lenses of 75 mrad, 28 mrad, and 4.9 mrad. Two types of HT2M and B-500HE-20 blackbodies produced by DEMEI and LR Tech respectively, with uniform and stable surface temperature distributions, were used: blackbody I, with a diameter of 100 mm, and blackbody II, with a size of 200 mm × 200 mm and blackbody emissivity of 0.95. The electronically controlled mobile platform was a model FZVAC1200 produced by Fuzhou Vacuum Electromechanical Equipment, and the moving accuracy was ±0.05 mm. Driven by the electrically controlled mobile platform, the blackbody moved the given distance along the direction perpendicular to the optical axis of the spectroradiometer. Thus, the blackbody radiance at each given position on the mobile platform could be measured. According to the characteristics and purpose of this experiment, and considering the need to reduce the influence of the signal-to-noise ratio, when the output of the spectroradiometer was unsaturated, the blackbody temperature was maximized. After fully considering the temperature range of the blackbody and the responsiveness of the spectroradiometer, the following experiment scheme was configured.
The spectroradiometer had to be calibrated before use so as to facilitate convenient test operations while guaranteeing the accuracy requirements. As this experiment was conducted in the laboratory, the measurement distance was short, and the temperature variations of the target radiation source were small. Under these conditions, the response function of the spectroradiometer was considered to be linear, so the two-point calibration method was selected [18,19,20]. Specifically, two different temperatures were configured for the blackbody to calibrate the spectroradiometer. To eliminate the influence of background radiation and improve the calibration accuracy, the blackbody filled the spectroradiometer FOV during calibration. The theoretical formulae for the two-point calibration method are:
V ( λ , T H ) = R ( λ ) · L ( λ , T H ) + O ( λ )
V ( λ , T C ) = R ( λ ) · L ( λ , T C ) + O ( λ )
where TH is high temperature, TC is low temperature, V(λ,TH) is the output voltage of the spectroradiometer when testing the high-temperature blackbody, L(λ,TH) is the radiance of the high-temperature blackbody, V(λ,TC) is the output voltage of the spectroradiometer when testing the low-temperature blackbody, L(λ,TC) is the radiance of the low-temperature blackbody, R(λ) is the response of the spectroradiometer, and O(λ) is the error of the radiation measurement, which does not change when the temperature of the blackbody changes.
By combining Equations (1) and (2), the response R(λ) and radiation measurement error O(λ) can be obtained as follows:
R ( λ ) = V ( λ , T H ) V ( λ , T C ) L ( λ , T H ) L ( λ , T C )
O ( λ ) = V ( λ , T C ) L ( λ , T H ) V ( λ , T H ) L ( λ , T C ) L ( λ , T H ) L ( λ , T C )
After two-point calibration, the response and measurement error of the spectroradiometer could be determined, and the linear relationship between the voltage and the spectral radiance could be obtained as follows:
V ( λ , T ) = R ( λ ) · L ( λ , T ) + O ( λ )
Thus, the voltage measured by the spectroradiometer was matched with the spectral radiance of the target, and the response function between the two was obtained.
The schematic diagram of the experimental setup for measuring the spatial nonuniformity of the spectroradiometer FOV is shown in Figure 2. The blackbody was placed on the electronically controlled mobile platform and in the center of the spectroradiometer FOV. It could be moved to the left and right under the control of the electronically controlled mobile platform. The blackbody moving path is shown in the figure. A 75 mrad lens was selected, and the test distance D1 was set to 5.33 m. The temperature of the blackbody was set to 533 K. In the specific test, the FOV nonuniformity calibration was performed by first measuring the spectrum radiance of blackbody I at the central axial position of the spectroradiometer FOV. Then, starting from the center measurement point, the blackbody was moved to the left of the center position 1 cm at a time to perform each measurement, with 15 measurements taken in total across 15 cm. The same measurements were recorded on the right side of the center of the FOV, and a total of 31 measurements were performed.
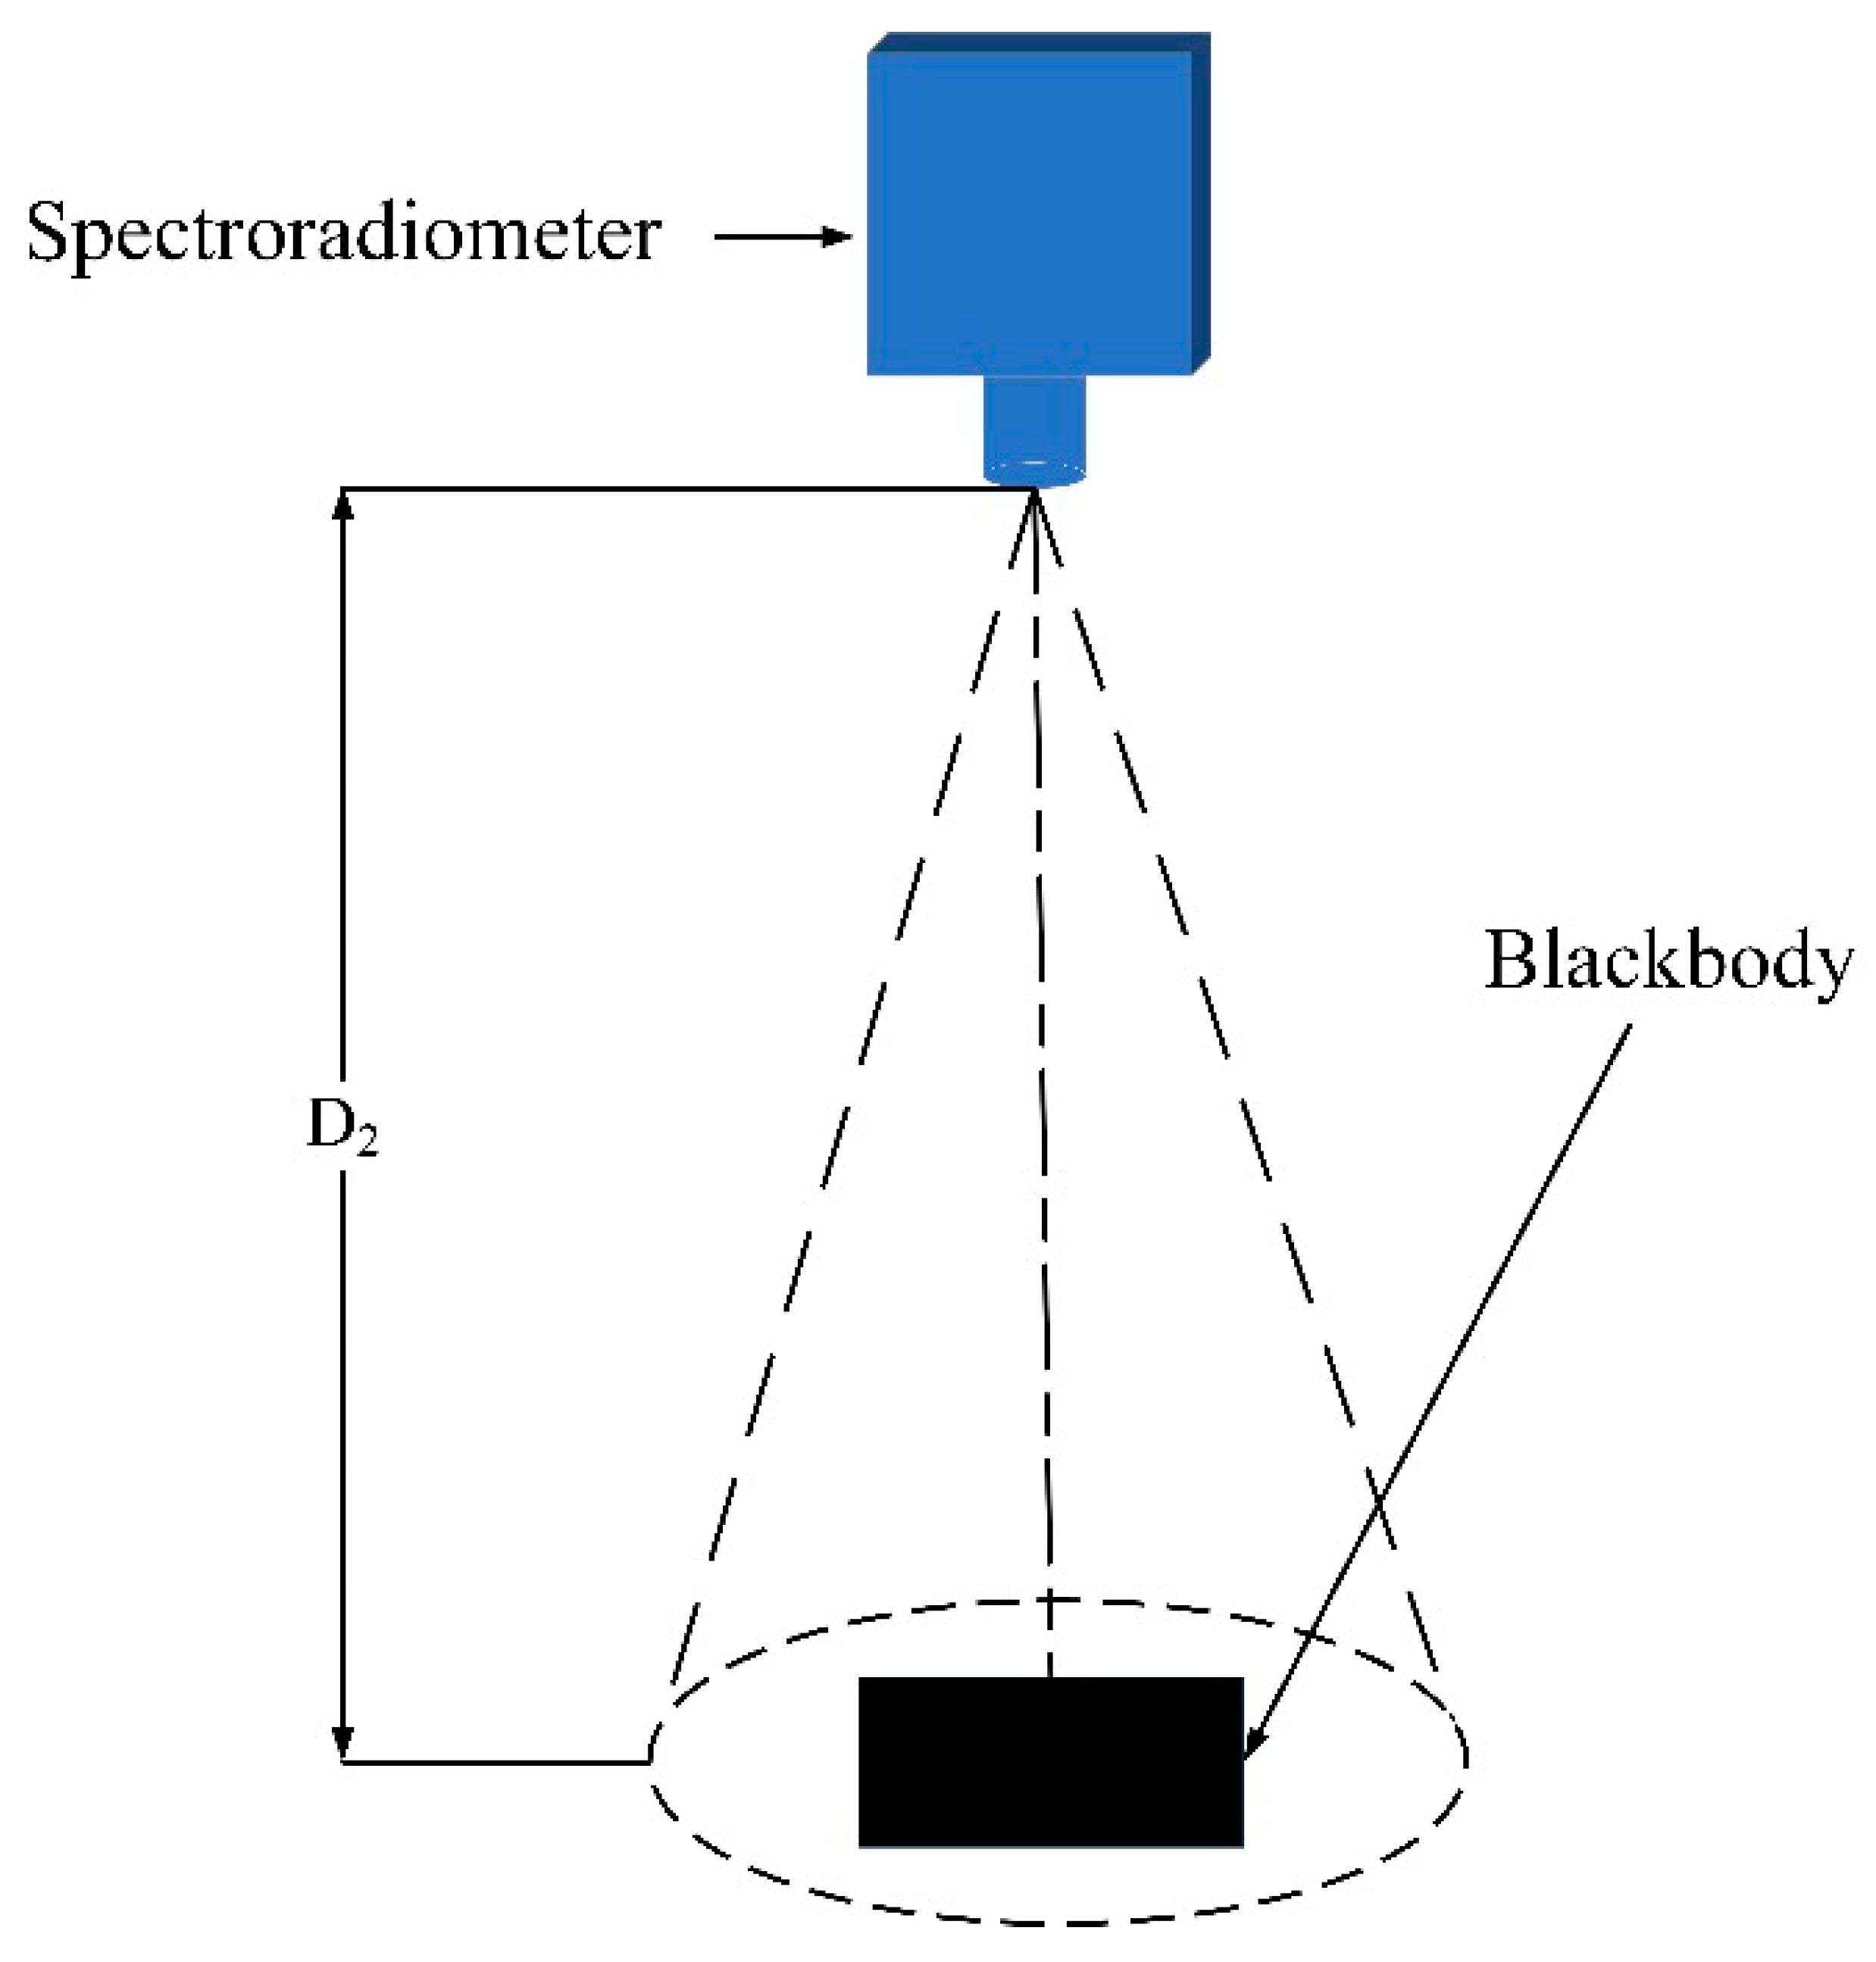
Afterward, as shown in Figure 3, the FOV nonuniformity calibration result was verified by placing blackbody II at the spectroradiometer FOV center and measuring its spectral radiation.
The measurement scheme is shown in Table 1. A total of two sets of tests were carried out. When the distance D2 between the blackbody and the spectroradiometer was set reasonably, the blackbody accounted for 50.11% of the spectroradiometer’s FOV. Here, D2 was 4.25 m; the blackbody temperatures were set as 547 K and 557 K, respectively.

3. Results

3.1. FOV Nonuniformity Correction Coefficient

The distance i between each measurement point and the FOV center was divided by the FOV radius for normalization and the ratio was denoted as β. In this study, the FOV radius Q of the spectroradiometer was 200 mm.
β i = i Q
The radiance measured by the spectroradiometer was transformed into the radiant intensity at different wavelengths by averaging the spectral test data from two measurements on the same ring. Meanwhile, the theoretical radiant intensity value of the blackbody was obtained by the following Equations [21].
L ( λ 1 λ 2 ) = ε π λ 1 λ 2 a 1 λ 5 ( e a 2 / λ T 1 ) · d λ
I ( λ 1 λ 2 ) = L ( λ 1 λ 2 ) · A
Here, L ( λ 1 λ 2 ) is the radiance within the λ 1 λ 2 band; I ( λ 1 - λ 2 ) is the radiant intensity within the λ 1 λ 2 band; A is the effective radiation area of the target; ε is the emissivity of the blackbody; a 1 and a 2 are radiation constants, with values of 3.7415 ± 0.0003 × 10⁸ (W·μm4/m2) and 1.43879 ± 0.00019 × 10⁴ (μm·K), respectively; and T is the temperature of the blackbody.
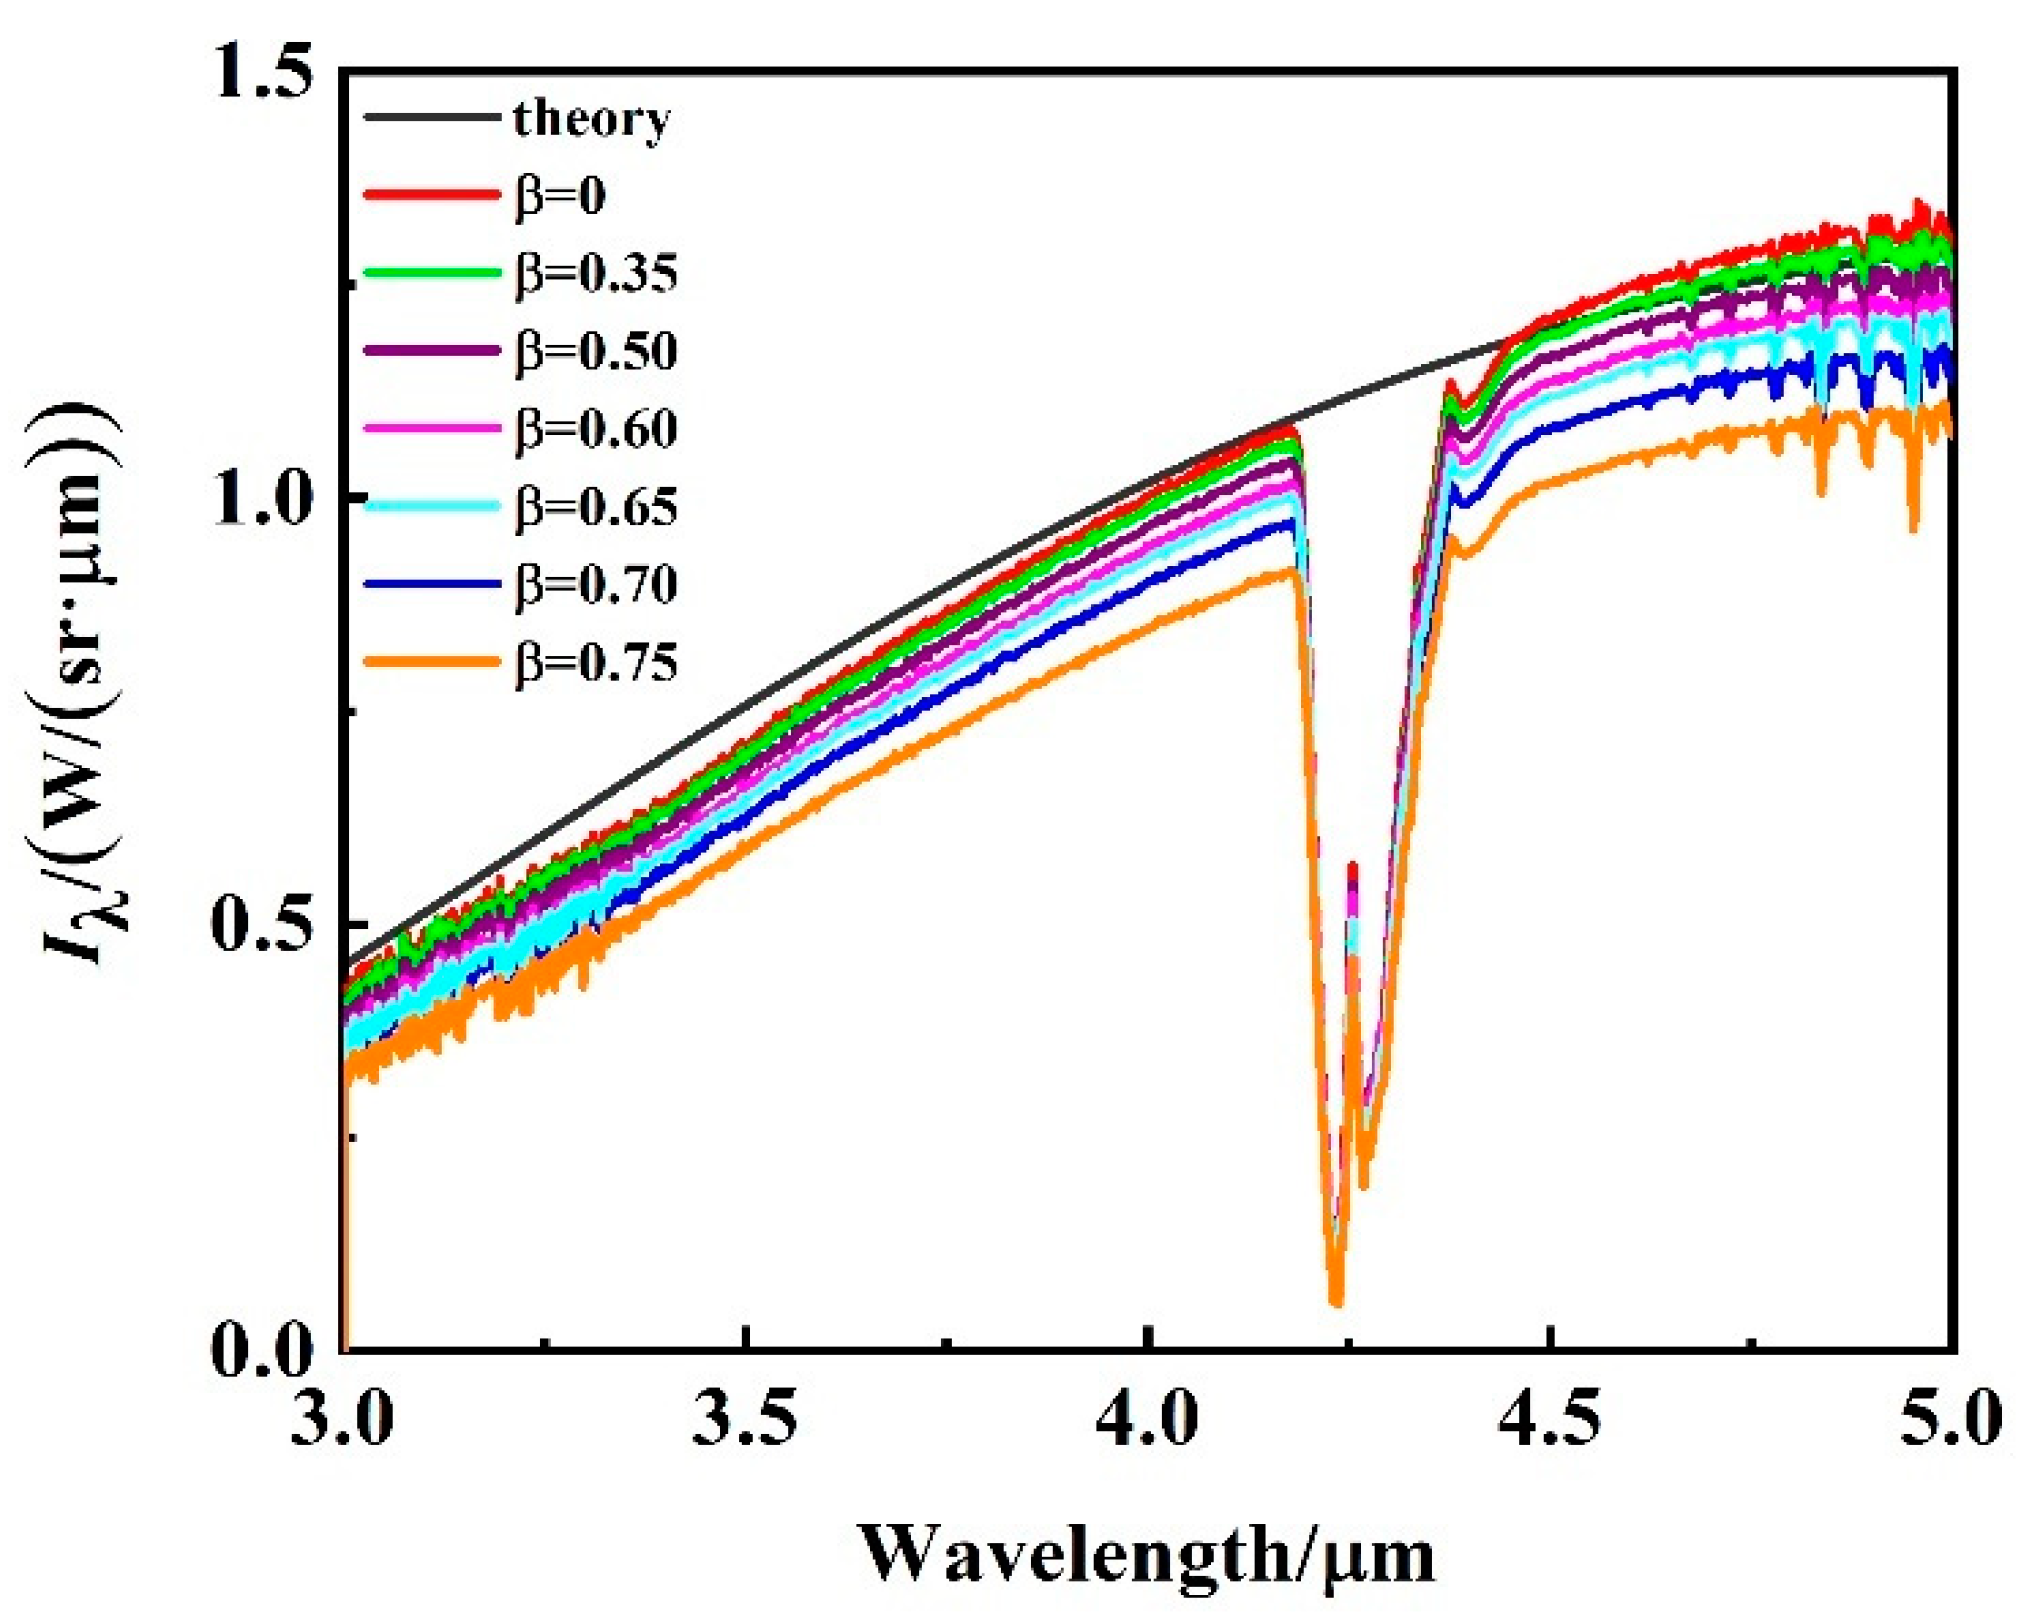
The measured data were processed according to Equations (7) and (8). First, the relationship curve between the wavelength and the radiant intensity at different measurement positions was obtained for blackbody I, as shown in Figure 4.
The variation curve of the radiant intensity with the wavelength measured at different positions and the theoretical radiant intensity curves at the two temperatures are given in Figure 4. As can be seen, the spectral radiant intensity curves of 3~5 μm obtained for the same target varied at different positions. Basically, the smaller β was—i.e., the closer it was to the FOV center—the greater the measured spectral radiant intensity was and the closer to the theoretical value.
Furthermore, as can be observed in Figure 4, the practical spectral radiant intensity curve fluctuated obviously at wavelengths of 3~3.4 μm,4.2~4.4 μm, and 4.5~5 μm. Specifically, the curve decreased rapidly at approximately 4.2 μm and then rose at around 4.4 μm. These changes were due to energy attenuation during atmospheric transmission. The wavelengths of the infrared absorption bands for the main atmospheric components at 3~5 μm are shown in Table 2, in which CO2 and H2O exhibited the highest absorptions. Therefore, these two components should be the focus when discussing atmospheric transmittance in the range of 3~5 μm. The fluctuations near 3.2 μm were due to the influence of H2O in the atmosphere, and the significant fluctuations at 4.2~4.4 μm were due to atmospheric CO2, which had a strong absorption band at 4.3 μm, causing an evident drop in the curve [21].
Overall, the influence of atmospheric absorption was minor within the range from 3.4~4.15 μm, so the curve was generally smooth, exhibiting a trend similar to that of the theoretical curve. To eliminate the influence of atmospheric transmission attenuation on the experiment when correcting the FOV nonuniformity, the band from 3.5~4.15 μm was selected for calibration in the data processing.
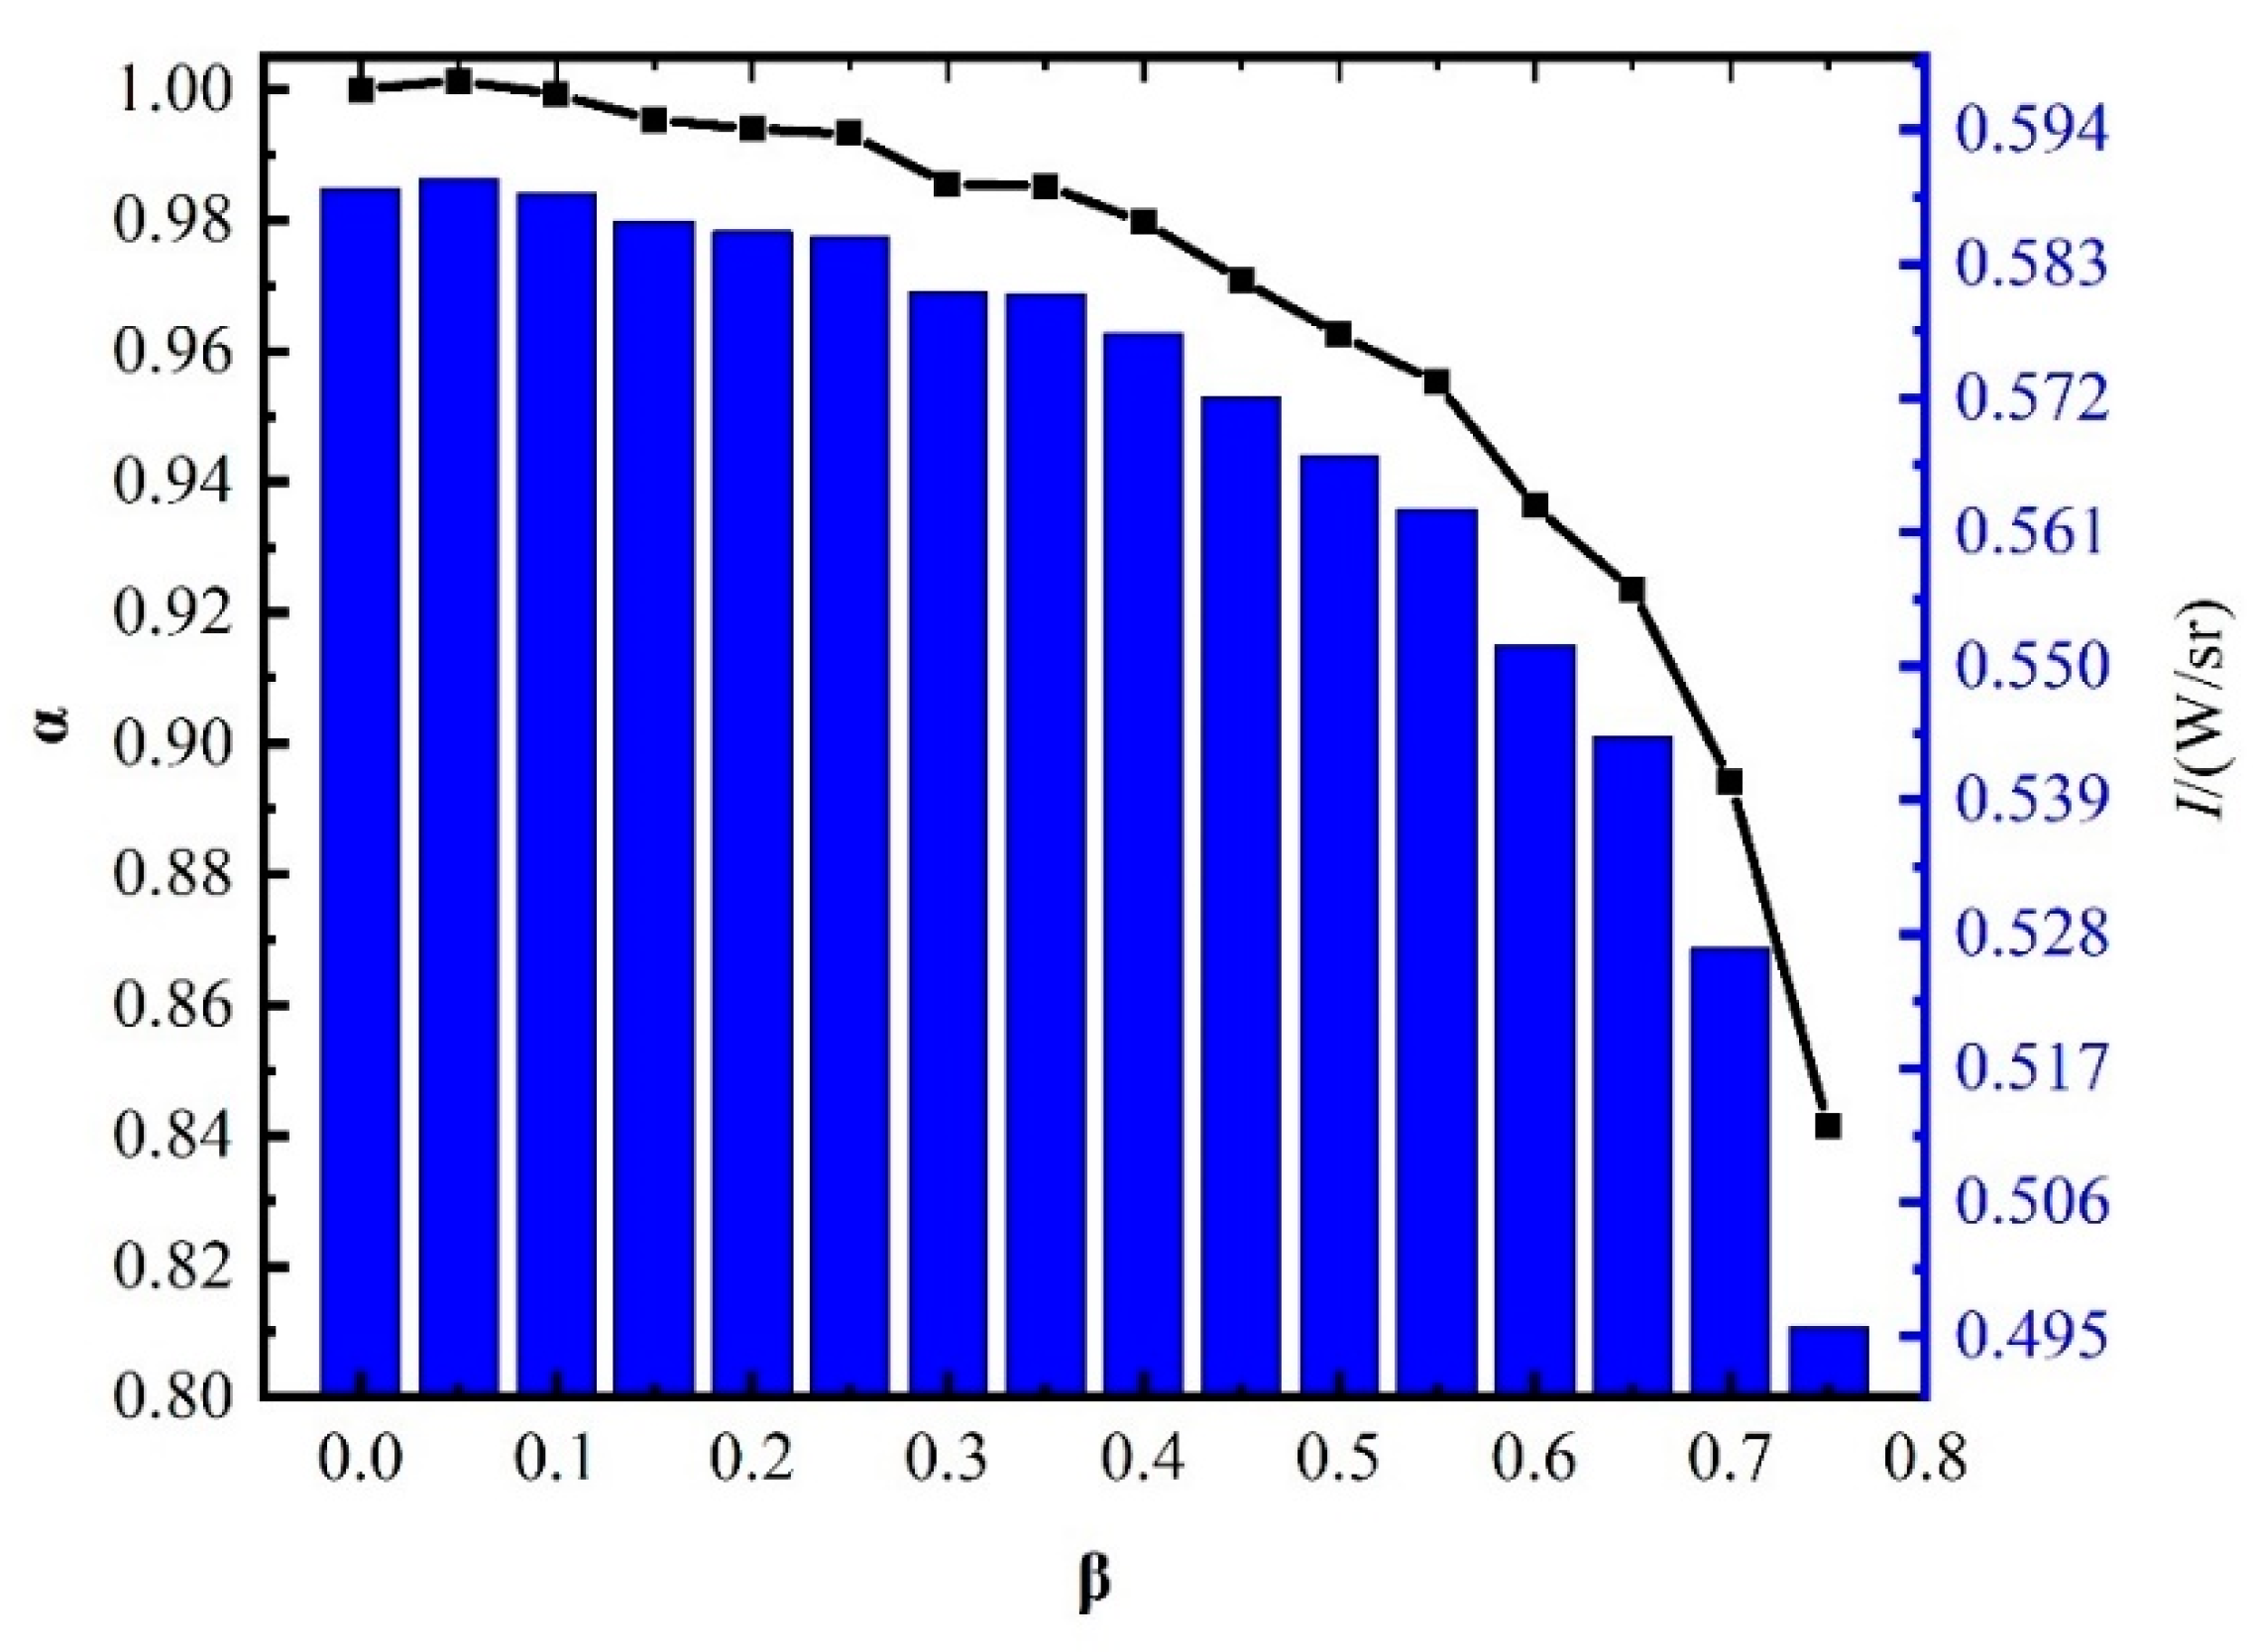
The spectral radiation data measured at the FOV center was closest to the theoretical value. After obtaining the total radiant intensity at 3.5~4.15 μm for each measurement point, the correction coefficient α was calculated by taking the radiant intensity at β = 0 as the reference value.
α i = I i I 0                   i = 0 ,   1 ,   2     15 .
where I i is the 3.5~4.15 μm radiant intensity at βi and I 0 is the 3.5~4.15 μm radiant intensity at β0.
Figure 5 presents the correction coefficient α at different values of β at 533 K and the spectrally integrated radiant intensity in the 3.5~4.15 μm band. Specifically, the correction coefficient changed gently near the FOV center. The correction coefficient dropped significantly when β became larger than 0.35.
The correction coefficient α at different values of β was obtained using the above test. The distance β from the center of the FOV of the spectroradiometer was taken as the abscissa and the nonuniformity correction coefficient α as the ordinate. The quartic polynomial function was used for fitting, and the correction function α = f(β) was obtained, as shown in the corresponding curve in Figure 6a.
The FOV of the spectroradiometer was represented in the X-Y coordinate system, with the center of the FOV of the spectroradiometer as the origin, the normalized horizontal distance as X, and the normalized vertical distance as Y.
The distance from any point (xi, yi) in the coordinate system to the center of the FOV was x i 2 + y i 2 , so the correction coefficient at (xi, yi) was α i = f ( x i 2 + y i 2 ) , and it was recorded as α i = f ( x i , y i ) . From this, the correction coefficient α at any position of the FOV of the spectroradiometer could be obtained. The correction coefficient cloud image for the whole FOV is shown in Figure 6b.
As can be seen in Figure 6, the nonuniformity reached 0.55 at the edge of the FOV of the spectroradiometer. When the target occupied a large area in the spectroradiometer, the effect of the spatial nonuniformity of the spectroradiometer FOV was very large and needed to be corrected.

3.2. Correction of FOV Nonuniformity

When testing the target radiation source with the spectroradiometer, the distance from the edge of the FOV of the spectroradiometer to the center of the FOV was regarded as 1 to normalize the area of the target radiation source. The area was denoted as S. When correcting the target radiation source, there was a correction coefficient for each concentric ring in the FOV of the spectroradiometer, and the correction coefficients were different for different rings.
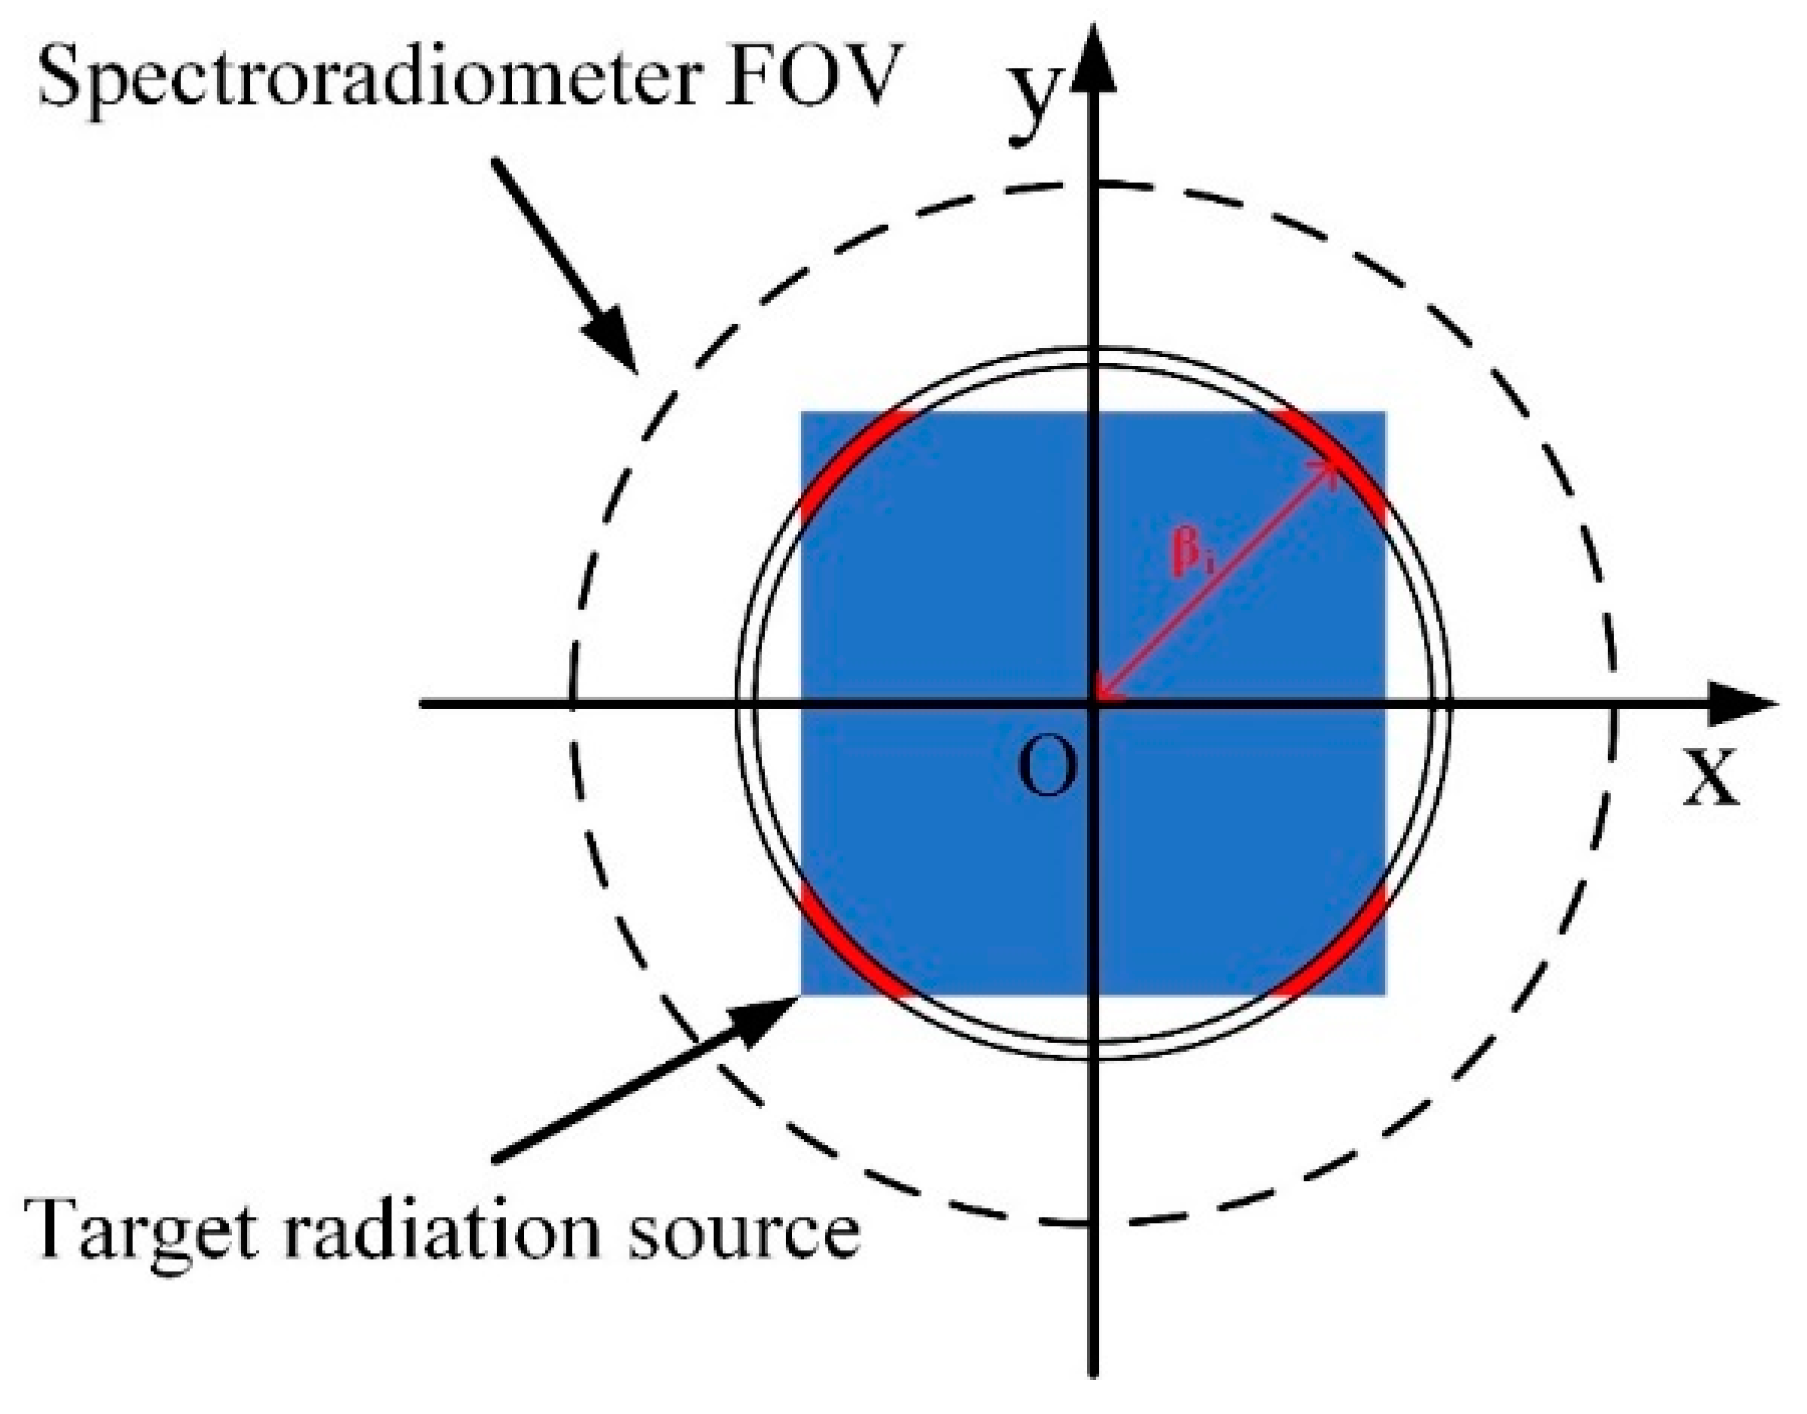
For the i-th circle, the correction coefficient at the distance x i 2 + y i 2 = βi from the center of the FOV of the spectroradiometer was αi. As shown in the Figure 7, the target radiation source was in this red area. The correction coefficient was αi.
From this, it can be seen that every position of the target radiation source in the FOV had a certain correction coefficient. For the calculation of radiation intensity correction, the method of splitting, approximating, summing, and taking the limit was used to derive the formula.
The area of the target radiation source was arbitrarily divided into n area elements. For the FOV area with position coordinates (εj, μj), the area element of this area was Δσj and the radiation intensity was:
Δ I j L · Δ σ j · 1 f ( ε j , μ j )
where f ( ε j , μ j ) = f ( ε j 2 + μ j 2 ) and L is the measured radiance of the target radiation source.
The total radiation intensity of the target radiation source was:
I = j = 1 n Δ I j
When the largest area η in all n area elements tends to 0, the limit can be expressed as a double integral, namely:
I = lim η 0 j = 1 n L · Δ σ j · 1 f ( ε j , μ j ) = L · S 1 f ( x , y ) d σ
I = L · S 1 f ( x , y ) d x d y
where S is the normalized total area of the target radiation source.
Considering the response of the spectroradiometer and the experimental test conditions, blackbody II was selected to verify the correction results. The measurements were performed when the blackbody temperatures were 547 K and 557 K. In accordance with the shape characteristic of the blackbody square, the square area located in the 0– π 4 range of the first quadrant was taken for integral calculation. Then, the radiation was multiply by eight, so that Equation (13) could be derived as Equation (14).
I = 8 L · 0 b d x 0 x 1 f ( x 2 + y 2 ) d y
where b is the normalized maximum distance of the target radiation source in the horizontal direction, which was 0.6274 in this verification.
These data can also be converted to polar coordinates as follows:
I = 8 L · 0 π 4 d θ 0 b cos θ 1 f ( r ) r d r
Here, the value of r equals the distance β from any point to the center of the FOV, f(r) = f(β).
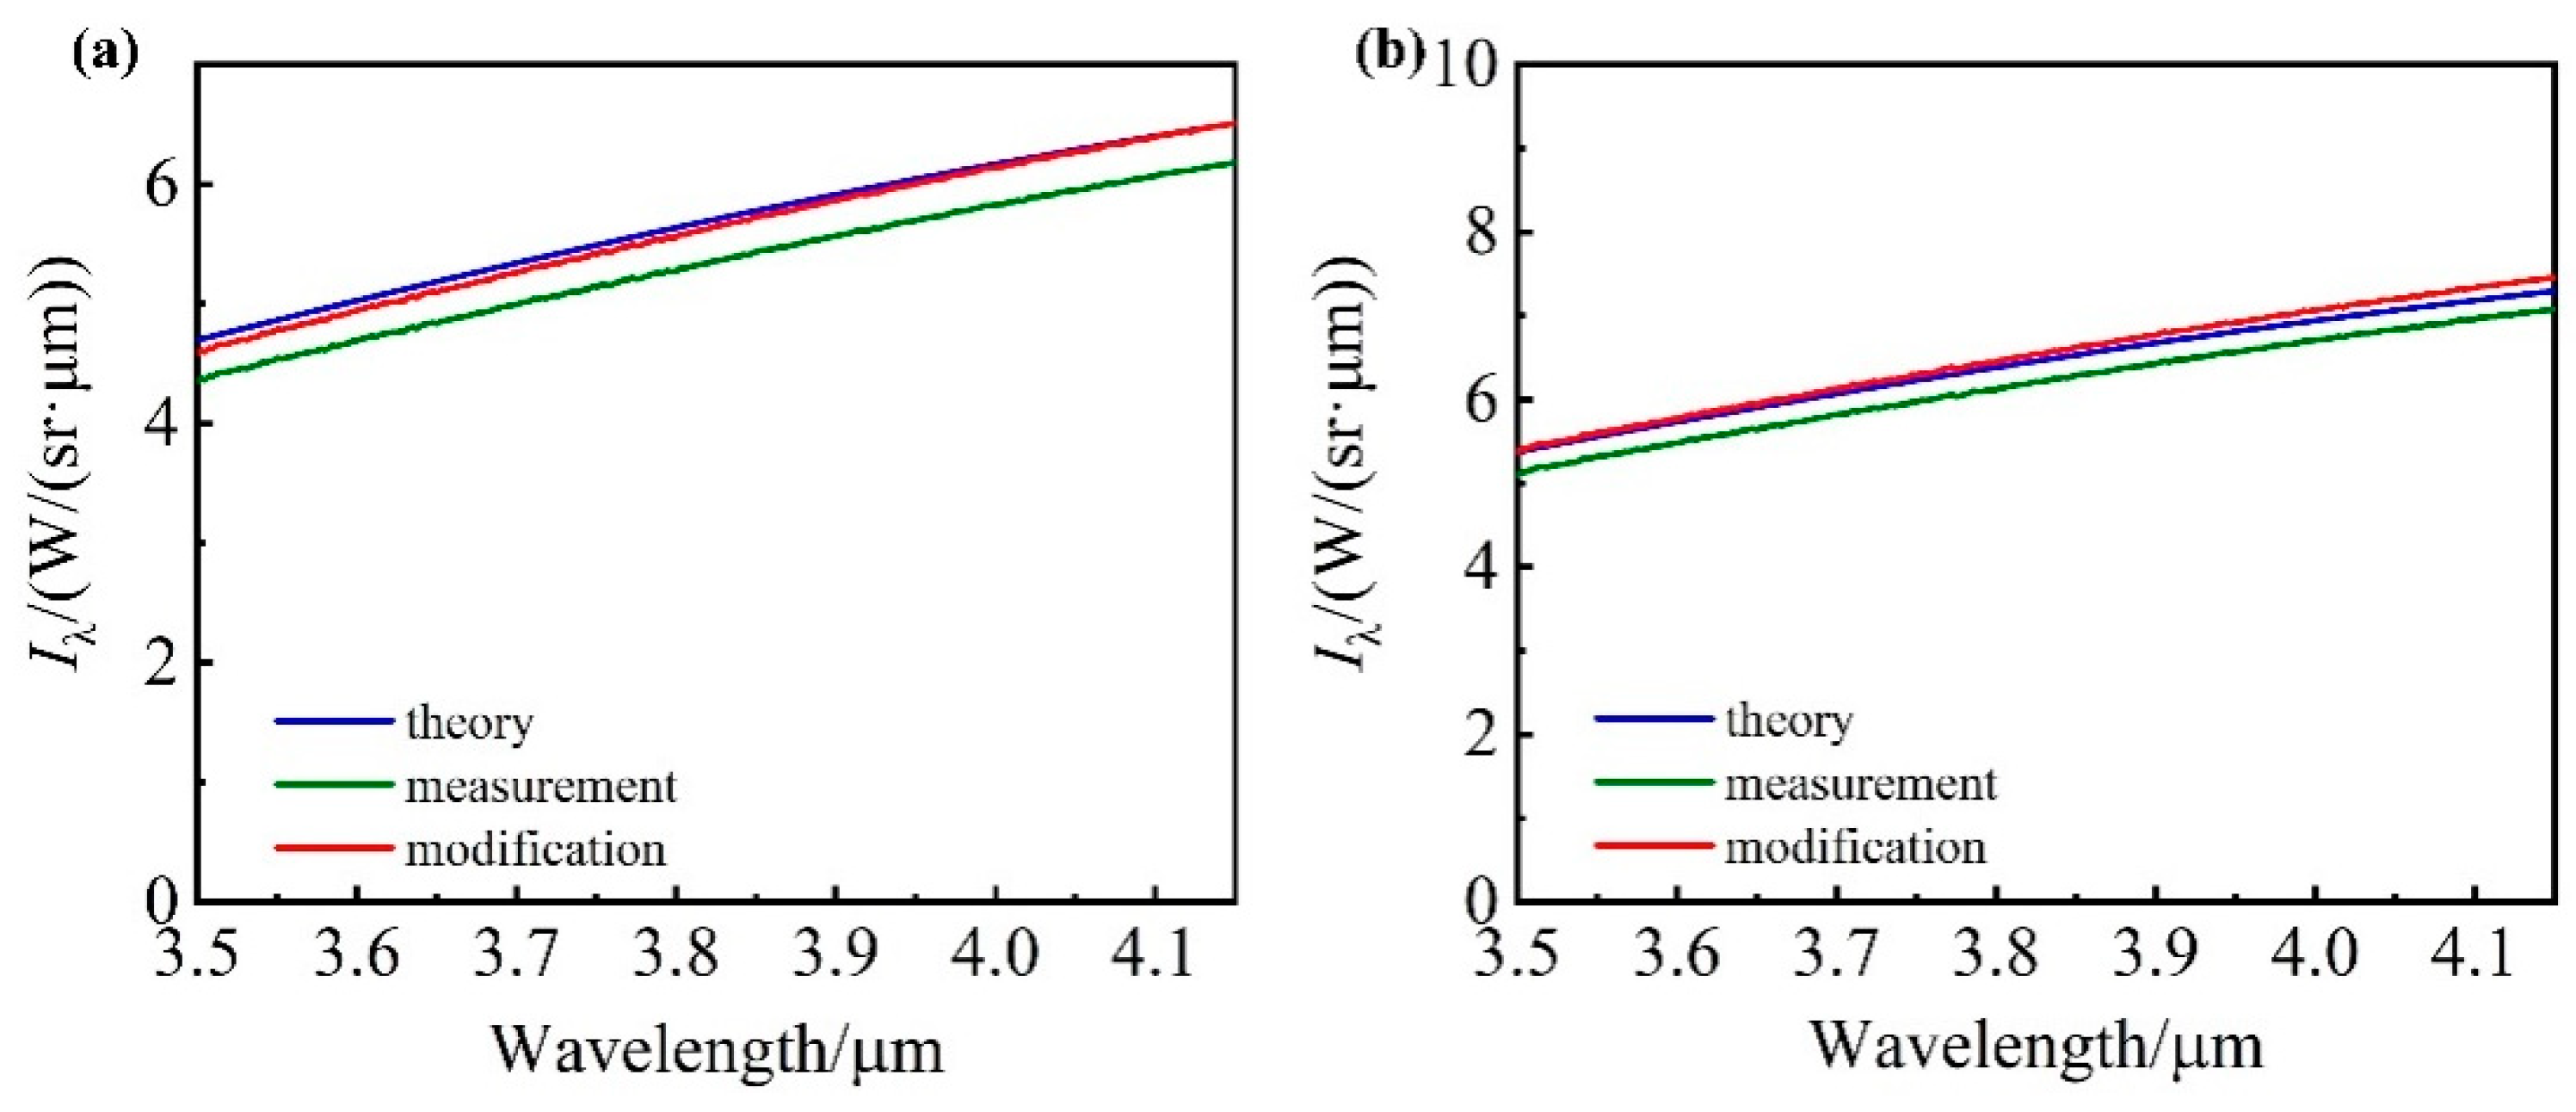
The radiation intensity curves of the corrected value, the measured value, and the theoretical value in the 3.5~4.15 μm band are shown in Figure 8. It can be seen from the figure that the spectral radiant intensity curve after correction of the FOV nonuniformity was, as a whole, closer to the theoretical value. In the 3.5~4.15 μm band, the theoretical radiant intensity curve and the corrected radiant intensity curve almost overlapped, indicating that the error was small. This shows the excellent effect of nonuniformity correction.
The spectrally integrated radiant intensity in the 3.5~4.15 μm band was calculated, and the results are given in Figure 9. The maximum error compared to the theoretical value within the 3.5~4.15 μm band was 1.84% after correction, exhibiting improved measurement accuracy and verifying the effectiveness of the correction method.

3.3. Uncertainty Analysis

The uncertainty of the spectrally integrated radiant intensity in the non-absorption band existed across three aspects: the measurement instrument, the object, and the conditions [22,23,24].
  • Measurement instrument
According to the type A evaluation of measurement uncertainty, the error N1 introduced by issues with measurement repeatability was approximately 1.0%.
The uncertainty component N2 due to inaccurate spectroradiometer measurements was approximately 0.3%.
2.
Measurement object
Following calibration, the blackbody temperature stability was ±0.5 °C. The uncertainty caused by the inaccurate temperature of the blackbody was 0.5 °C. Assuming that it followed a normal distribution, the confidence probability was 0.95, and the k was 2 [25]. According to the type B evaluation of measurement uncertainty, the uncertainty of the blackbody was highest at 50 °C, so N3 was:
N 3 = 0.5 2 × 50 × 100 % = 0.5 %
Following calibration, when the temperature was below 673 K, the emissivity of the blackbody was 0.950 ± 0.005. Assuming that it followed a normal distribution, the confidence probability was 0.95, and the k was 2. According to the type B evaluation of measurement uncertainty, the blackbody emissivity causing the uncertainty N4 was:
N 4 = 0.005 2 × 0.95 × 100 % = 0.26 %
3.
Measurement conditions
According to the type B evaluation of measurement uncertainty, the uncertainty owing to the inaccurate distance and angle between the spectroradiometer and the blackbody (N5) was approximately 0.1%.
The change in ambient temperature was less than 2 K. According to the type B evaluation of measurement uncertainty, the influence resulted in an uncertainty (N6) of approximately 0.2%.
In acquiring the correction coefficient, the spectral radiant intensity measurements on both sides of the same ring were averaged. Errors accrued at this point. Similarly, in the fitting of the calibration curve, the use of different fitting functions also led to errors. Moreover, in the part of the method where β was less than 0.75, the obtained fitting coefficients were more accurate. In summary, the uncertainty of the correction factor N7 was about 2.5%.
The above uncertainty components were independent of each other, so the combined uncertainty N was:
N = N 1 2 + N 2 2 + N 3 2 + N 4 2 + N 5 2 + N 6 2 + N 7 2 = 2.78 %

4. Conclusions

In an experiment examining practical spectral radiation characteristics, a concentric-circles method was used to obtain the nonuniformity fitting function. A correction formula was used to correct the measured results of the spectroradiometer. In this context, it is useful to attend to the influence of the spatial phase nonuniformity of the spectroradiometer FOV on the actual measurement.
After correcting the spatial nonuniformity of the spectroradiometer FOV using the concentric-circles method, for the blackbody occupying 50.11% of the spectroradiometer FOV, the corrected spectrally integrated radiation in the 3.5~4.15 μm band was close to the theoretical value, with an error less than 1.84%, demonstrating an improved FOV nonuniformity and verifying the effectiveness of the correction method.

Author Contributions

Conceptualization, Z.J. and G.C.; methodology, Z.J. and Y.L.(Yiwen Li); software, Z.J., Y.L. (Yao Li) and P.Z.; validation, P.Z.; formal analysis, Z.J. and S.C.; investigation, Z.J.; resources, G.C.; data curation, Z.J. and Y.L.(Yiwen Li); writing—original draft preparation, Z.J.; writing—review and editing, Z.J., G.C. and Y.L. (Yao Li); visualization, Z.J. and P.Z.; supervision, G.C. and S.C.; project administration, Y.L.(Yiwen Li); funding acquisition, Y.L. (Yao Li) and Y.L.(Yiwen Li) All authors have read and agreed to the published version of the manuscript.

Funding

This research was funded by the National Science and Technology Major Project of China (Grant No. J2019-V-0008-0102) and the China Postdoctoral Science Foundation (No. BX2021370).

Conflicts of Interest

The authors declare no conflict of interest.

References

  1. Che, K.; Liu, Y.; Cai, Z.N.; Yang, D.X.; Wang, H.B.; Zhu, S.H. Review of Atmospheric Greenhouse Gas Observation and Application based on Portable Fourier Transform Infrared Spectrometer. Remote Sens. Technol. Appl. 2021, 36, 44–54. [Google Scholar]
  2. Veerasingam, S.; Ranjani, M.; Venkatachalapathy, R.; Bagaev, A.; Mukhanov, V.; Litvinyuk, D.; Mugilarasan, M.; Gurumoorthi, K.; Guganathan, L.; Aboobacker, V.M. Contributions of Fourier transform infrared spectroscopy in microplastic pollution research: A review. Crit. Rev. Environ. Sci. Technol. 2021, 51, 2681–2743. [Google Scholar] [CrossRef]
  3. Wang, L.; Cheng, Y.; Lamb, D.; Naidu, R. The application of rapid handheld FTIR petroleum hydrocarbon-contaminant measurement with transport models for site assessment: A case study. Geoderma 2019, 361, 114017. [Google Scholar] [CrossRef]
  4. Luo, M.D.; Ji, H.H.; Huang, W.; Cai, X.; Gao, C. Research on measurement method of mid—IR spectral radiant intensity of exhaust system with FTIR spectrometer. J. Aerosp. Power 2007, 22, 1423–1429. [Google Scholar]
  5. Wang, C.Z.; Tong, Z.X.; Lu, Y.L.; Chai, D. Study on the airplane’s infrared radiation characteristics. Laser Infrared 2011, 41, 996–1001. [Google Scholar]
  6. Yao, K.K.; Wang, H.; Xu, F.; Zhang, R.J.; Wang, H.F. Application research of spectrometer in evaluation of infrared stealth effect of aero-engine. Laser Infrared 2020, 50, 975–980. [Google Scholar]
  7. Pang, X.T. Research on the Measuring Technology of Infrared Radiation Character of Aircraft Skin. Master’s Thesis, Shenyang Aerospace University, Shenyang, China, 2016. [Google Scholar]
  8. Zhu, J.; Liu, W.Q.; Lu, Y.H.; Gao, M.G.; Zhao, X.S.; Zhang, T.S.; Xu, L. Analysis of atmospheric transmittance based on FTIR spectra measurements. Opt. Tech. 2005, 31, 627–629. [Google Scholar]
  9. Wei, H.L.; Chen, X.H.; Dai, C.M.; Du, R.Q. Ground-based measurements of infrared atmospheric background spectral radiances. Infrared Laser Eng. 2012, 41, 284–290. [Google Scholar]
  10. Tan, H.; Xuan, Y.M.; Han, Y.G.; Li, Q. Experimental Research on the Spectral Emissivity Measurement Based on FTIR. J. Eng. Thermophys. 2012, 33, 1771–1773. [Google Scholar]
  11. Zhu, J.; Liu, W.Q.; Lu, Y.H.; Gao, M.G. Research on Radiance Measurements of Target and Background Based on FTIR. Infrared Technol. 2004, 26, 52–55. [Google Scholar]
  12. Yang, Z.J. Space optical instrument and its calibration and testing technology the third to speak spectroradiometer. J. Appl. Opt. 2008, 29, 1017–1020. [Google Scholar]
  13. Liu, J.M. Research on Infrared Radiation of Target Based on Radiometer. Master’s Thesis, Shenyang Aerospace University, Shenyang, China, 2017. [Google Scholar]
  14. Macarthur, A.; Maclellan, C.J.; Malthus, T. The Fields of View and Directional Response Functions of Two Field Spectroradiometers. IEEE Trans. Geosci. Remote Sens. 2012, 50, 3892–3907. [Google Scholar] [CrossRef]
  15. Macarthur, A.A.; Maclellan, C.J.; Malthus, T.J. The implications of non-uniformity in fields-of-view of commonly used field spectroradiometers. In Proceedings of the 2007 IEEE International Geoscience & Remote Sensing Symposium (IGARSS), Barcelona, Spain, 23–28 July 2007; IEEE: Piscataway, NJ, USA, 2007. [Google Scholar]
  16. Huang, W.; Ji, H.H.; Si, R. Non-uniformity correction for the measurement results of FTIR spectrometer. Laser Infrared 2015, 45, 400–405. [Google Scholar]
  17. Wang, X.X.; Yang, H.R.; Yu, B.; Yan, X.Y.; Hao, S.J.; Xie, Y.; Li, S.W.; Wang, J.G. Calibration and measurement method for IR target under the same solid angle. J. Appl. Opt. 2018, 39, 518–521. [Google Scholar]
  18. Feng, M.C.; Xu, L.; Gao, M.G.; Jiao, Y.; Li, X.-X.; Jin, L.; Cheng, S.-Y.; Tong, J.-J.; Wei, X.-L.; Li, S. Study of Radiometric Calibration Methods on FTIR Spectrometer. Infrared Technol. 2012, 34, 366–370. [Google Scholar]
  19. Liu, Z.M.; Gao, M.G.; Liu, W.Q.; Lu, Y.-H.; Zhang, T.-S.; Xu, L.; Wei, X.-L. The study of instrument Response Function of FTIR Detectors. Spectrosc. Spectr. Anal. 2008, 28, 1786–1789. [Google Scholar]
  20. Tong, J.J.; Liu, W.Q.; Gao, M.G.; Zhang, T.S.; Xu, L.; Wei, X.L. Study of Radiation Calibration Based on Airborne FTIR Spectrometer. Infrared 2010, 31, 12–15, 25. [Google Scholar]
  21. Zhang, J.Q. Infrared Physics, 2nd ed.; Xidian University Press: Xi’an, China, 2013; pp. 27, 66, 148–149. [Google Scholar]
  22. Fan, H. Understanding of the concept of Uncertainty in Measurement. Adv. Meas. Lab. Manag. 2014, 22, 30–32. [Google Scholar]
  23. Efremova, N.Y.; Chunovkina, A.G. Development of the Concept of Uncertainty in Measurement and Revision of Guide to the Expression of Uncertainty in Measurement. Part 1. Reasons and Probability-Theoretical Bases of the Revision. Meas. Tech. 2017, 60, 317–324. [Google Scholar] [CrossRef]
  24. Zhao, C.S. The Theory and Practice Design of The Indetermination Degree of Measure. Master’s Thesis, Changchun University of Science and Technology, Changchun, China, 2007. [Google Scholar]
  25. Zou, M.S. The Sources and Analysis of Common Probability Distribution Coverage Factor k Value in Evaluation and Expression for the Uncertainty of Measurement. Metrol. Meas. Tech. 2014, 41, 84–86. [Google Scholar]
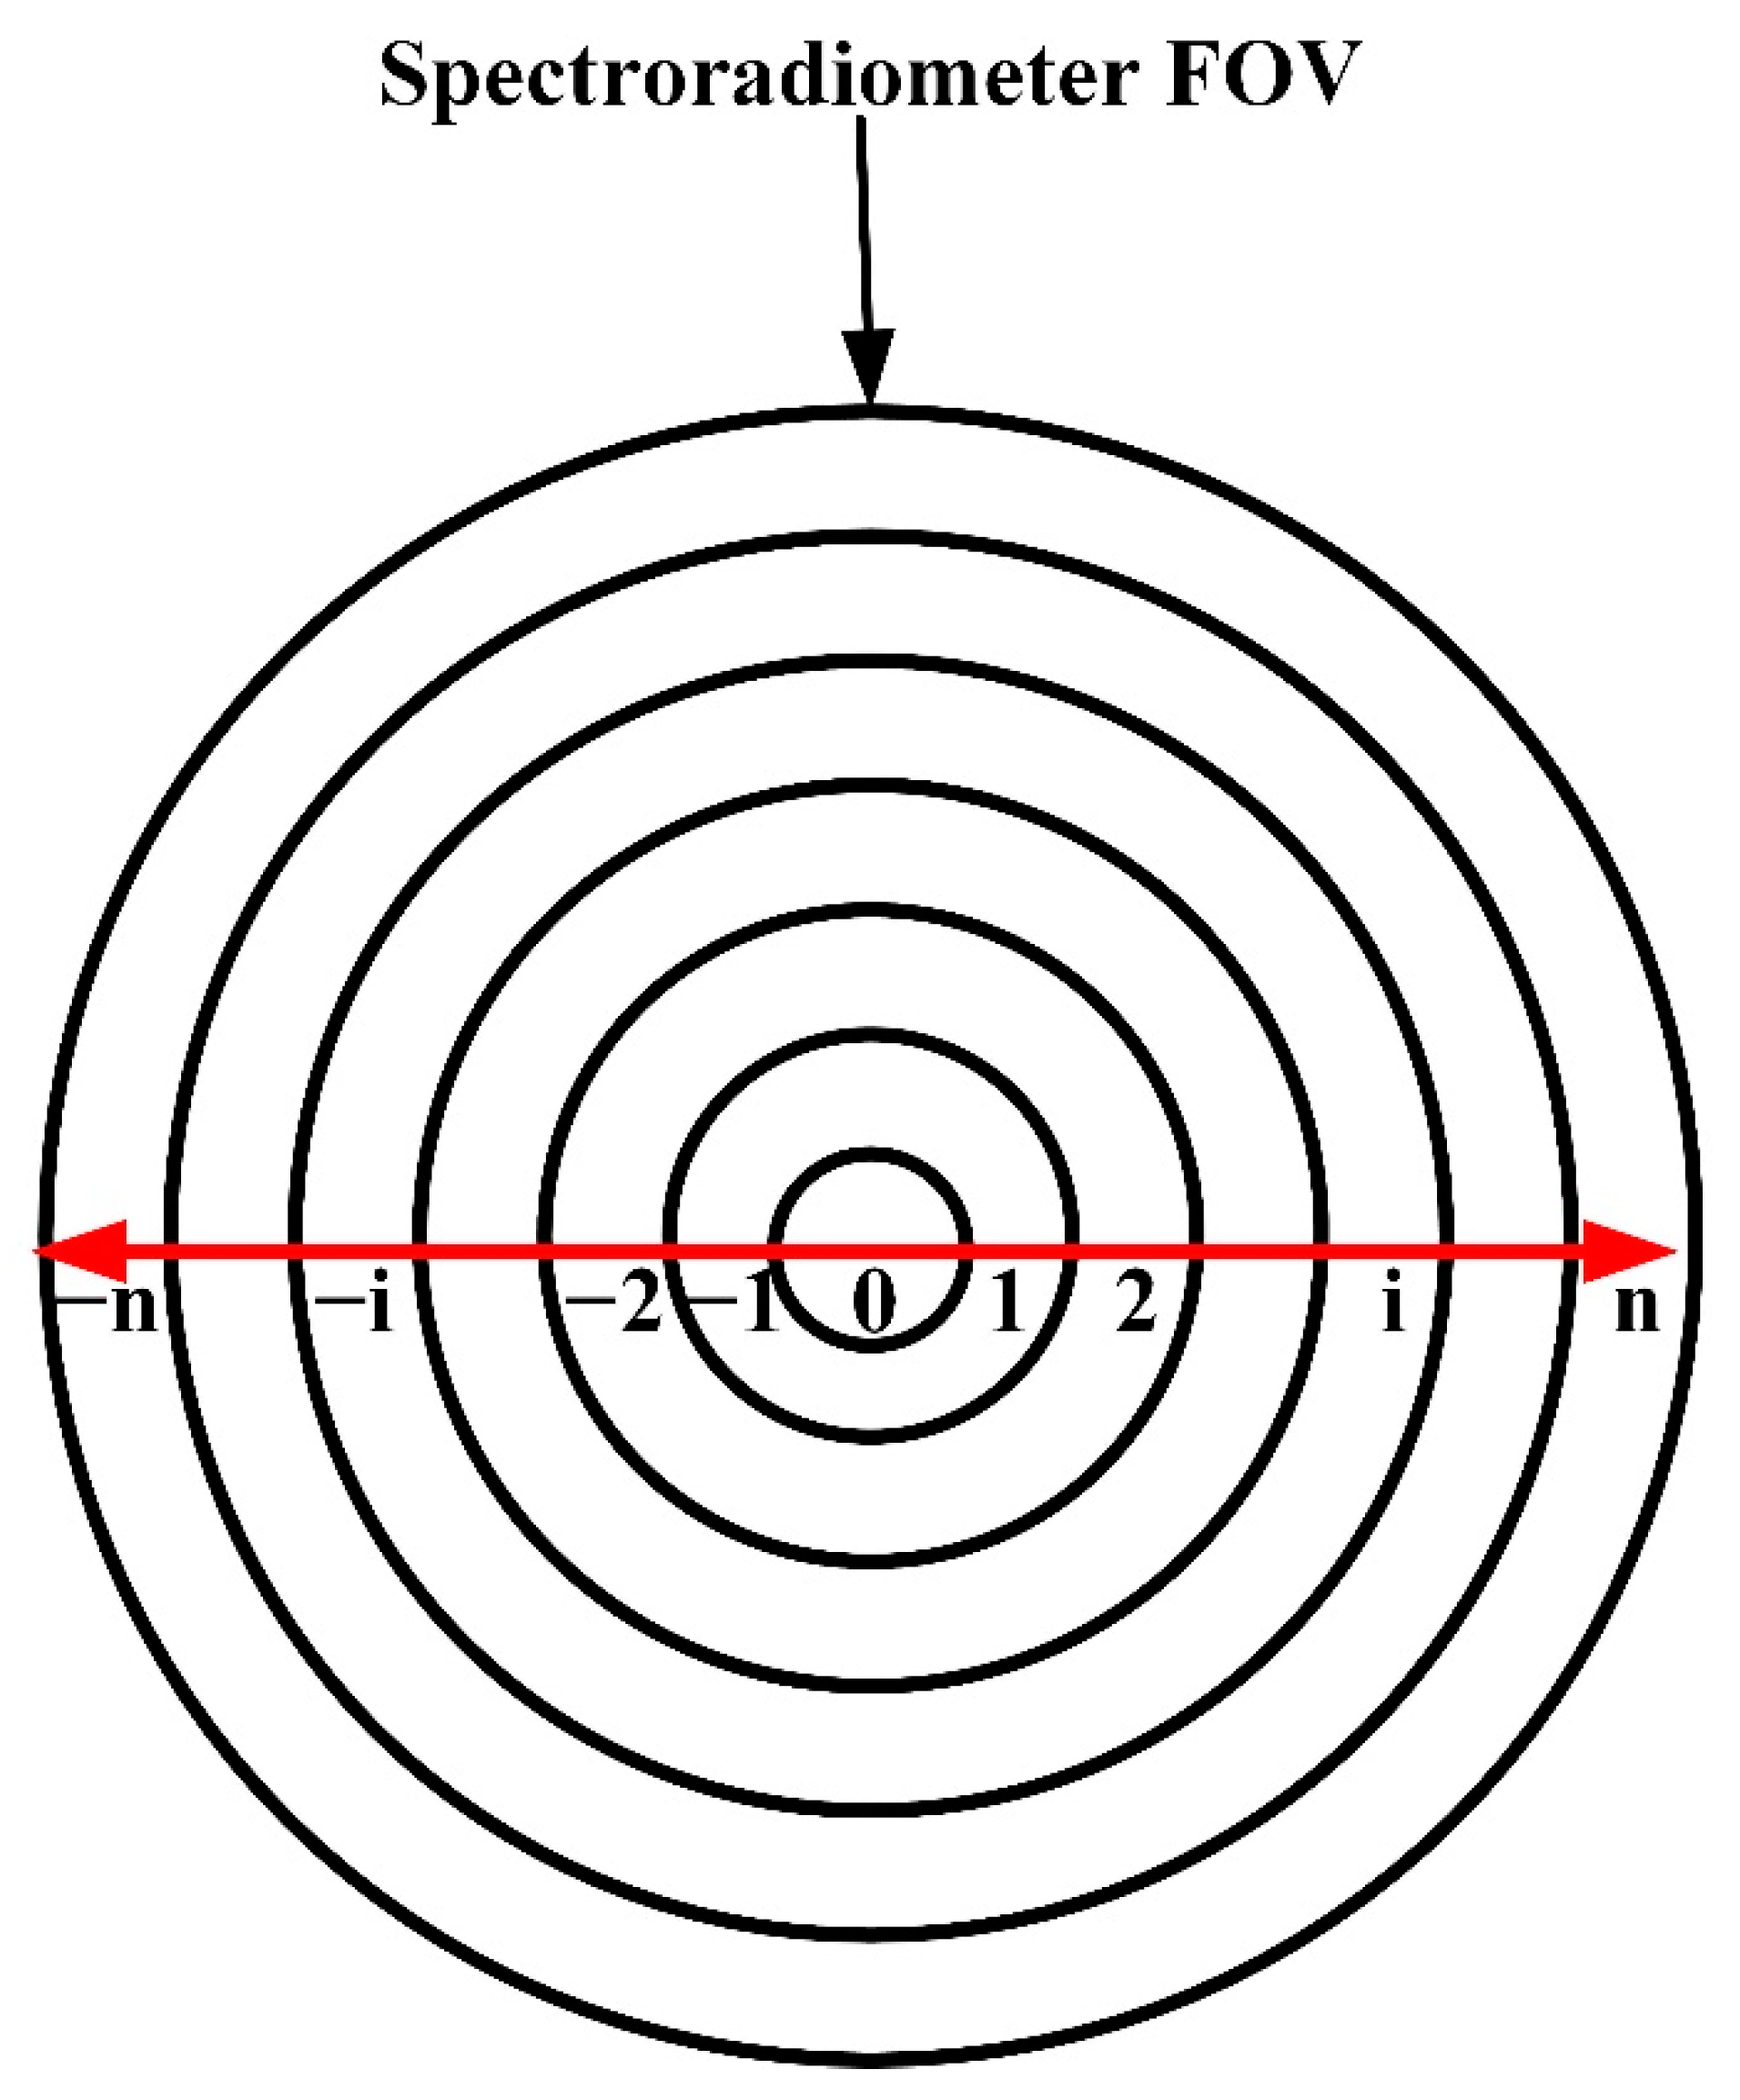
Figure 1. Schematic diagram of the concentric-circles method.
Photonics 09 00056 g001
Figure 2. Schematic diagram of the experimental setup for measuring the spatial nonuniformity of the spectroradiometer FOV.
Photonics 09 00056 g002
Figure 3. Schematic diagram of experiment to verify the effect of the spatial nonuniformity correction of the spectrometer FOV.
Photonics 09 00056 g003
Figure 4. Theoretical and measured values of spectral radiant intensity at T = 533 K.
Photonics 09 00056 g004
Figure 5. The correction coefficient α at different values of β and the spectrally integrated radiant intensity in the 3.5~4.15 μm band.
Photonics 09 00056 g005
Figure 6. (a) The FOV nonuniformity correction coefficient fitting curve; (b) the correction coefficient cloud image.
Photonics 09 00056 g006
Figure 7. Correction coefficient for the target radiation source in the FOV.
Photonics 09 00056 g007
Figure 8. The theoretical curve, the experimental measurement curve, and the corrected curve of the spectral radiation intensity of the blackbody in the 3.5~4.15 μm band with different test temperatures. (a) L = 4.25 m, T = 547 K; (b) L = 4.25 m, T = 557 K.
Photonics 09 00056 g008
Figure 9. Theoretical, measured, and corrected spectrally integrated radiation intensity values and corrected errors in the 3.5~4.15 μm band.
Photonics 09 00056 g009
Table 1. FOV nonuniformity correction verification scheme.
D2 (m)Temperature (K)Percentage in the FOV of the Spectroradiometer (%)
4.2554750.11
4.2555750.11
Table 2. Center wavelengths of infrared absorption bands for main atmospheric components at 3~5 μm.
CompositionCenter Wavelength of Absorption Band (μm)
CO24.3, 4.8
H2O3.2
CO4.7
CH43.3
O34.8
Publisher’s Note: MDPI stays neutral with regard to jurisdictional claims in published maps and institutional affiliations.