Abstract
Cerebral edema is a serious complication of ischemic cerebrovascular disease and mannitol is a commonly used dehydrating agent for relieving cerebral edema. However, the edema state and surrounding vascular perfusion level during mannitol treatment remains unclear, which affects the clinical application of the medicine. In this paper, we demonstrated the role of swept-source optical coherence tomography (OCT) in the evaluation of mannitol efficacy using mouse models. The OCT-based angiography and attenuation imaging technology were used to obtain the cerebral vascular perfusion level and cerebral edema state at different times. Vascular parameters and edema parameters were quantified and compared. Experimental results show that mannitol can significantly reduce the water content in the central region of edema, effectively inhibiting the rapid growth of the edema area, and restoring cerebral blood flow. On average, the edema area decreased by 33% after 2 h, and the vascular perfusion density increased by 12% after 5 h. This work helps to provide a valuable theoretical basis and research ideas for the clinical treatment of cerebral edema.
1. Introduction
Stroke, characterized by high morbidity, mortality and recurrence rate, is a clinically common disease and seriously threatens human health. Ischemic stroke (IS) accounts for approximately 80% of all strokes [1,2]. In the acute period of IS, patients tend to suffer a variety of complications, such as pulmonary infections, stress ulcers, deep venous thrombosis or cerebral edema [3,4]. Among them, cerebral edema is one of the most common complications of IS, and the most significant reason for the deterioration of patients and even leads to death [5]. Once cerebral edema has formed, the volume of the edema tissue will expand. Restricted to the intracranial space, intracranial pressure (IP) will increase significantly. Furthermore, the brain tissues surrounding the lesion will be extruded by the expanded edema tissue, and as a result, the vascular resistance increases, and the local cerebral blood flow will further reduce. In this case, a malignant cycle of “ischemia ~ edema ~ re-ischemia ~ re-edema” will form. If no intervention is taken before cerebral herniation occurs, the patient’s life is at risk [6]. There are two kinds of treatment for intracranial hypertension caused by cerebral edema, dehydrating agents or surgical decompression. Surgical treatment is highly traumatic and can be lethal, and there remain debates about its effect on improving patient outcomes [7]. In contrast, a dehydrating agent such as mannitol is more likely to be received by patients.
Mannitol works by increasing the osmotic pressure of plasma colloid to a level greater than that of cerebrospinal fluid and intracellular fluid. A large volume of water in the brain tissue is drawn into blood vessels to form urine. In this way, the brain volume and IP are temporarily decreased [8]. In addition to the permeability dehydration, mannitol improves cerebral blood flow via reactive cerebral vasoconstriction, cardiac output increase and reduction of blood viscosity [9]. However, if mannitol is used incorrectly, there will be adverse reactions. Studies have shown that if an improper injection dose or excessive injection frequency is used, mannitol will not only fail to achieve the desired effect, but will also aggravate cerebral edema and even lead to death of the patient [10].
Given that the progression of cerebral edema is closely related to the blood flow state surrounding the edema region, the monitoring of vascular parameters and edema parameters in real time during the interventional process is, therefore, of great significance in comprehensively evaluating the interventional effect of mannitol on ischemic cerebral edema. However, these parameters have not been well studied during mannitol treatment, which has limited the clinical application [11]. Basic research using animal models is essential before a medical strategy can be formally applied to the clinic. Therefore, we need an imaging device, which should feature high resolution, real-time and in vivo imaging, and allow simultaneous detection of cerebral blood flow and cerebral edema state.
Micro Computed Tomography (µCT) is specifically designed for small animal imaging. It captures vascular images through injection of a contrast agent, and is also capable of detecting cerebral edema, but its sensitivity is limited [12,13]. Magnetic resonance angiography (MRA), as a type of sequence of Magnetic Resonance Imaging (MRI), is a well-known non-invasive angiography technology. It can detect larger blood vessels without the need for intubation or contrast media. Diffusion-weighted imaging (DWI) is also an MRI sequence, which can detect the diffusion of water molecules in living tissues and indirectly reflects the water content of brain tissue [14,15]. Positron emission tomography (PET) is a powerful and highly sensitive nuclear imaging device that can be used to accurately measure cerebral blood flow in large vessels [16]. However, CT, MRI and PET are limited to low temporal or spatial resolution, which renders them unsuitable for imaging animal cortex microvasculature and local edema. Laser Speckle Contrast Imaging (LSCI) is capable of displaying cerebral capillaries based on the movement of particles (such as red blood cells), but has a shallow imaging depth [17,18]. Optical Diffusion Tomography (ODT) is a three-dimensional functional imaging method that uses near-infrared light (600–900 nm) illumination to simultaneously provide information on changes in oxygenated hemoglobin and reduced hemoglobin. It is mainly used in the early diagnosis of breast tumors [19] and brain imaging applications [20], but has the downside of low spatial resolution.
Optical coherence tomography (OCT), which reconstructs depth information images of biological tissues using backscattered light from the sample, has the advantages of non-contact, non-invasive and a high resolution [21]. OCT technology appeared in the 1990s and gradually transited to frequency domain OCT from time domain OCT [22]. Over the past two decades, various OCT-based technologies have arisen. For example, Doppler OCT combining OCT with Doppler technology captures the axial velocity of blood cells by directly measuring the phase difference between adjacent A-scans [23,24]. OCT-based elastography (OCE) uses imaging to deduce the mechanical properties of the tissue, and has contributed significantly to certain applications including cancer diagnosis and the detailed characterization of arterial wall biomechanics [25,26]. Visible-light OCT is an emerging imaging modality enabling measurement of hemoglobin oxygen saturation (sO2) based on the theory that sO2-dependent hemoglobin light absorption has the strongest spectral contrast within the visible-light wavelength range [27,28]. Polarization Sensitive OCT (PS-OCT) is an extended technology based on traditional OCT. In addition to obtaining intensity information as with traditional OCT, it is also possible to determine the polarization information of samples by detecting the polarization of light [29]. Speckle variance optical coherence tomography (SV-OCT) depends on the intensity variance of continuous acquisition frames, and is a powerful method for separating fluid flow from static tissues [30]. These technologies have pushed the development of OCT to new heights and brought great benefits to basic research and clinical applications such as ophthalmology [31], dermatology [32], and neuroscience [33].
The frequency domain OCT has two modes, spectral domain OCT (SD-OCT) and swept source OCT (SS-OCT). Among the two, SS-OCT is more favored by scholars for its faster acquisition speed and deeper detection depth. OCT based angiography technology measures the movement of blood cells to display cerebral blood vessels (including capillaries) [34]. In addition, by analyzing the attenuation of OCT signal with depth, the optical attenuation coefficient (OAC) of tissues can be extracted to distinguish different tissues or different states of the same tissue. This technology is called OCT attenuation imaging (OCT-AI) [35]. In our previous study, we improved the calculation method of OAC and successfully monitored cerebral edema after cerebral ischemia in mice using SS-OCT [36]. The advantages of high resolution, non-contact, and the ability to simultaneously detect cerebral perfusion and cerebral edema render SS-OCT extremely suitable for the assessment of ischemic brain injury.
In this paper, we demonstrate the interventional effect of mannitol in cerebral edema using SS-OCT. Mouse models of cerebral ischemia induced by photochemistry were established and divided into two groups, a control group and an intervention group. The cerebral blood perfusion level and cerebral edema state within the entire cerebral cortex was monitored for 9 h. Vascular parameters and edema parameters were quantified and compared. This work helps to reveal the effect of mannitol in the pathogenesis of cerebral edema, and provides a valuable theoretical basis and research ideas for the clinical treatment of cerebral edema.
2. System and Methods
2.1. SS-OCT System
A wide-range SS-OCT system was selected for the experiments [37]. The light source used is a swept-source with a center wavelength of 1310 nm and a bandwidth of 100 nm. The system operates at a line scanning speed of 200 kHz and offers an axial resolution of 7.5 μm in air. A 50-mm focal length object lens was adopted to achieve a lateral resolution of 16 μm.
2.2. Quantification of Cerebral Blood Flow and Cerebral Edema
SS-OCT is able to simultaneously detect two physiological states of cerebral blood flow and cerebral edema with a single data acquisition. Figure 1 shows the overall process of the parameter quantification of cerebral blood flow and cerebral edema, which includes: data acquisition (Figure 1A), angiography (Figure 1B), blood vessel segmentation (Figure 1C), distance transformation (Figure 1D), blood vessel skeletonization (Figure 1E), attenuation imaging (Figure 1F), and edema region segmentation (Figure 1D,G).
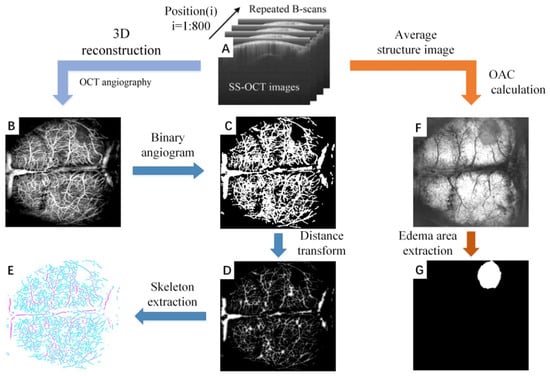
Figure 1.
The overall process of the parameter quantification of cerebral blood flow and cerebral edema based on SS-OCT. (A) The original structural image collected by SS-OCT. The scans were repeated 4 times in each position, for a total of 800 positions. (B) The OCT angiogram reconstructed by (A). (C) Binary angiogram. (D) Distance transform image. The value of each point in the image represents the radius of the current blood vessel. (E) Vascular skeleton. (F) The edema image obtained by (A). (G) The edema area extracted from (F).
2.2.1. Data Acquisition
Figure 1A shows the original B-scan images obtained by SS-OCT. In our system, the rapid scanner (X direction) was driven by a sawtooth waveform with a frame rate of 160 Hz, providing a time interval of 6.25 ms between adjacent repeated B-scan images. Each B-scan image contained 1000 A-lines. The slow scanner (Y direction) was driven by a step function waveform. 4 B-Scans were repeatedly collected at each position and a total of 800 positions were collected. The FOV is 12 mm (X direction) × 10 mm (Y direction), which is sufficient to cover the whole brain cortex of mice. To avoid the effects of breathing and heartbeat, we adopted an image registration method proposed previously to remove the motion artifacts [37].
2.2.2. OCT Angiography
Figure 1B displays an OCT angiogram. OCT angiography is based on motion contrast. The OCT system collects multiple images at the same scanning position, and performs differential operations on these repeated images. As a result, the stationary tissue signal will be eliminated and the blood flow signal will be retained [38]. We extracted the blood vessel at 300 microns below the cortical surface using Amira 3-D visualization software, and the maximum projection method was used to reconstruct the final en face angiogram after all positions were calculated.
2.2.3. Blood Vessels Segmentation
Blood vessels segmentation represents the primary task of vascular parameter quantization. However, due to the differences in diameter and depth, signals of blood vessels are significantly different. Uneven lighting is an additional problem that has to be faced in blood vessel segmentation. We employ the previously proposed “locally adaptive region growing” algorithm to segment blood vessels [39]. This is an improved algorithm based on the traditional region growing The advantage of this method is that it can better adapt to the drastic changes of local blood vessel signal intensity. It does not terminate the algorithm prematurely due to the blood vessel signal being too small, nor does it make segmentation errors due to the background signal being too large. The binarized blood vessel image obtained by the “locally adaptive region growing” algorithm is shown in Figure 1C.
2.2.4. Quantification of Vascular Parameters
Three vascular parameters, including vascular perfusion density (VPD), vascular diameter (VD) and vascular length (VL) were quantified from the binarized OCT angiograms to study the mechanism of mannitol in relieving cerebral edema. VPD is defined as the ratio of “the number of blood vessel pixels” to “the total number of pixels in the angiogram”. VPD can be calculated from the entire brain or a certain localized area. For the calculation of VD, a distance transformation was performed on the binarized OCT angiogram (Figure 1D), and the central axis of vessels was extracted (Figure 1E). The signal value in Figure 1E reflects the minimum distance from the vessel center to the vessel edge, i.e., the radius. VD can be obtained by multiplying the signal value by 2. VL is the length of the vascular skeleton.
2.2.5. OCT Attenuation Imaging
After cerebral edema occurs, acidic substances will generate in the cells and the cell membrane permeability will increase. The transmittance of infrared light will increase with the tissue water content, and the optical attenuation coefficient (OAC) will decrease accordingly. Therefore, OAC can be used to distinguish edema tissue from normal tissue. In our previous work, we introduced the imaging principle and calculation method of OCT attenuation imaging in detail [40]. Briefly, this method is divided into three main steps: (1) confocal interference removal, (2) extracting and flattening the surface, and (3) calculation of the OAC. First, average structural images were obtained by averaging repeated B-scans. The influence of confocal features was eliminated by dividing by the axial spreading of points as proposed by van Leeuwen et al. [41]. Prior to calculating the OAC, we extracted the surface and flattened the image. Next, a 3D matrix was rebuilt from the surface of the cortex, extending a specific number of pixels vertically. Finally, the optimized depth resolution estimation (ODRE) method was used to calculate the OAC [40].
where I[z] is the OCT signal of a pixel and μ[z] is its corresponding OAC, both at depth z, Δ is the pixel size (usually related to the axial resolution of the OCT system). N is the number of the pixels within a limited depth. I[N] is the OCT signal for the last point N. μ[N] in Equation (1) is unknown. To determine it, a piece of data was taken from the end of the imaging depth and then fitted to an exponential curve. By averaging the OAC in a specific depth range, a series of en face OAC images can be calculated (Figure 1F).
2.2.6. Quantization of Edema Parameters
We segment the edema region from the OAC images manually, and calculate the area of the edema region. In order to study effect of mannitol better, we calculated the changes of OAC value in the central and marginal region of the edema over time. The central region of the edema is considered the location with the heaviest brain damage. The green circular region in Figure 2B is the edema central region selected in this paper. It has a radius of 300 microns. The edema marginal region is usually a newly formed edema area due to the aggravation of brain damage, and changes over time. The red ring region in Figure 2C is the edema marginal region. The thickness of the ring is about 160 microns (20 pixels).
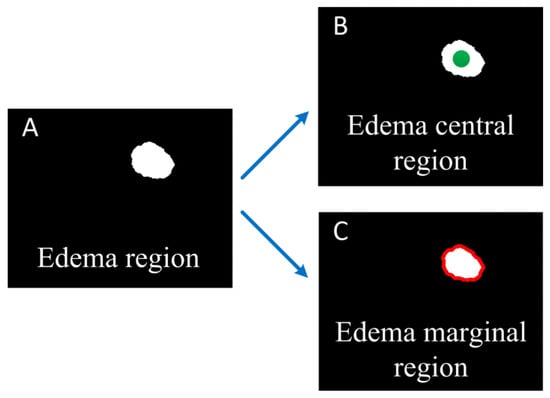
Figure 2.
Schematic diagram of edema central and marginal region. (A) Edema region; (B) The green dot shows the edema central region; (C) The red curve shows the edema marginal region.
So far, we have quantified 3 vascular parameters and 3 edema parameters through only one OCT data collection. Next, we will explore the changes of these parameters over time with or without mannitol intervention through animal experiments, and evaluate the effect of mannitol intervention.
3. Experiments and Results
3.1. Animal Models
Male BALB/C mice aged 5 weeks (body weight 20–30 g) were selected for experiments. This study was approved by the Ethics Committee of Northeastern University (No. Neu-ec2020a009s). Surgical anesthesia was induced with sodium pentobarbital (3%, 5 mg/100 g, IP). The anesthetized mice were fixed on a stereotaxic apparatus with ear bars and a clamping device. The fur on the mice’s heads was shaved, and the skin was cleaned with saline. The skin was cut along the midline of the skull, and the interparietal bone was exposed by retracting the skin to the sides. Next, the subcutaneous tissue and periosteum were cleaned. Mice were placed under the SS-OCT sample arm for baseline data collection. Then, Rose Bengal (RB, Sigma-Aldrich, St Louis, MO, USA) was injected into the tail vein (20 mg/mL saline, 1 mL/kg bodyweight) and photothrombosis was induced using parallel illumination (532 nm, the diameter of ~2 mm, CNI Laser, MGL-III-532-5mW-1.5, Changchun, China) for 30 min. The animal was strictly shielded from light to minimize the diffuse Rose Bengal activation after laser irradiation.
Mice were randomly divided into control group and intervention group, 6 mice per group. The control group was injected with 0.625 mL normal saline 2 h after MCAO induction, while the intervention group was injected with 20% mannitol. The route of administration was intraperitoneal injection. Continuous observation was performed for 9 h using SS-OCT.
3.2. Results
Figure 3 and Figure 4 show the cerebral angiograms of mice in control group and intervention group, respectively. The first row displays the original OCT angiograms. We normalized the images, so the range of signal value was from 0 to 1. The second row shows the corresponding binarized angiograms. The first column is at baseline, and the second to fifth columns are cerebral angiograms at different times. Affected by the thrombus, the blood vessels in both groups decreased over time. However, the degree of loss in cerebral vasculature in the intervention group was significantly less than that in the control group.
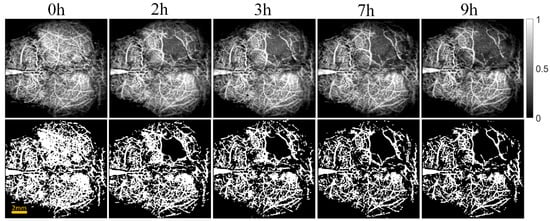
Figure 3.
Original and binarized OCT angiograms in control group of mice (n = 6). The first row shows the original OCT angiograms (normalized). The range of the color bar is from 0 to 1. The second row displays the corresponding binarized angiograms.
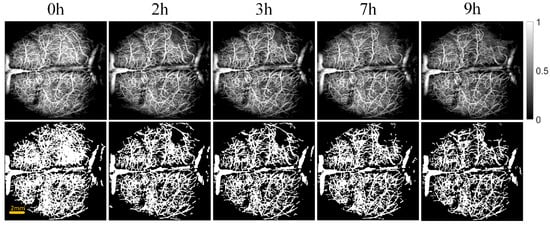
Figure 4.
Original and binarized OCT angiograms in intervention group of mice (n = 6). The first row shows the original OCT angiograms (normalized). The range of color bar is from 0 to 1. The second row displays the corresponding binarized angiograms.
Figure 5 shows the comparison of B-Scan vascular images of the infarct areas in the two groups of mice. The red and blue boxes represent the ischemic areas in the control group and the intervention group, respectively. It can be seen that the ischemic region of the control group is significantly larger than that of the intervention group.
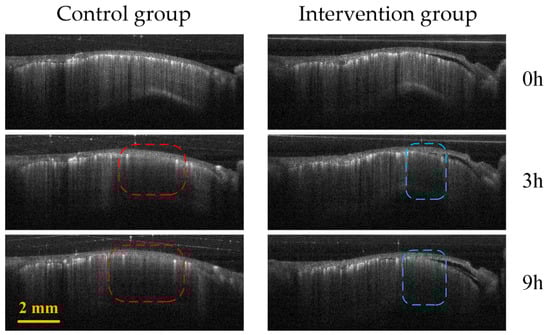
Figure 5.
Control group (first column) and intervention group (second column) B-Scan vascular images at different time points (0 h, 3 h and 9 h) in the infarction region. The red and blue boxes represent the ischemic regions of the control group and the intervention group, respectively.
Figure 6 and Figure 7 show the changes of cerebral blood flow and cerebral edema over time in the control and intervention group, respectively. The first row shows a VPD map, in which each pixel value represents the VPD at the local region around the point (0.6 mm × 0.6 mm). These figures reflect the blood flow supply during cerebral ischemia. The second row displays the vascular skeleton diagram. Each pixel value in the figure represents the radius of the blood vessel, and the number of skeleton pixels represents the length of the blood vessel. The third row shows the OAC image obtained by using Equation (1). OAC value reflects the tissue water content. Notably, the water content of the tissue located in the shadow area was increased, indicating edema formation.
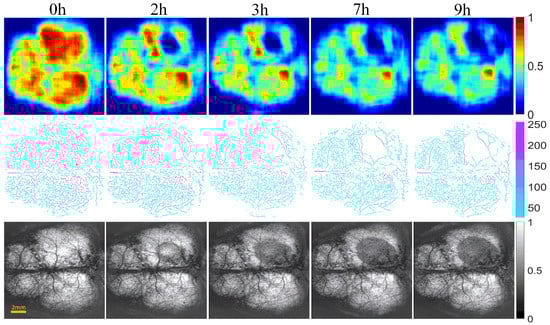
Figure 6.
The progression of cerebral blood flow and cerebral edema with time from 0 to 9 h in control group of mice (n = 6). The first row displays VPD maps; the range of the color bar is from 0 to 1. The second row shows the vascular skeleton diagrams. Each pixel value in the figure represents the radius of the blood vessel (the unit is μm), the range of color bar is 50–250 μm. The third row is the OAC images (The unit is mm−1), the range of color bar is 0–1.
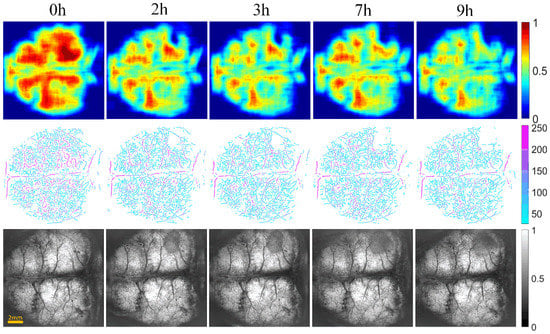
Figure 7.
The progression of cerebral blood flow and cerebral edema with time from 0 to 9 h in intervention group of mice (n = 6). The first row displays VPD maps; the range of color bar is from 0 to 1. The second row shows the vascular skeleton diagrams. Each pixel value in the figure represents the radius of the blood vessel (the unit is μm), the range of color bar is 50–250 μm. The third row is the OAC images (the unit is mm−1), the range of color bar is 0–1.
Figure 8 displays the comparison of B-Scan attenuated images of the infarct area in the two groups of mice. The red arrow and blue arrows represent the edema area in the control group and the intervention group, respectively. The edema area in the control group is significantly larger than that of the intervention group.
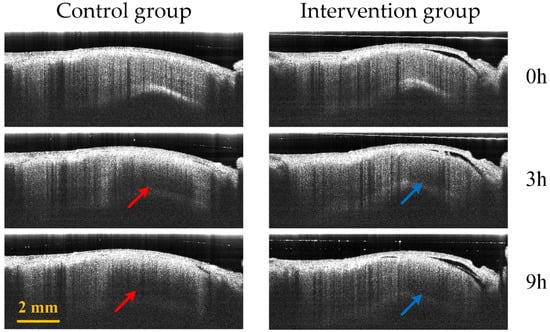
Figure 8.
Control group (first column) and intervention group (second column) B-Scan attenuated images at different time points (0 h, 3 h and 9 h) in the infarction region. The red and blue arrows represent the edema regions of the control group and the intervention group, respectively.
The results showed that the blood vessels in the infarcted zone gradually decreased and the edema area gradually expanded. Quantitative analysis of cerebral blood flow and cerebral edema is essential to accurately grasp the progression of the disease. Three vascular parameters were quantified from OCTA images: VPD, VD and VL. Figure 9 shows the curves of the three vascular parameters over time.
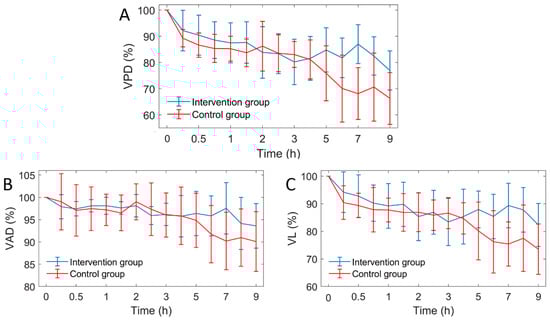
Figure 9.
The curves of three vascular parameters over time (n = 6). VPD: vascular perfusion density, VAD: vascular average diameter, VL: vascular length. (A) VPD; (B) VAD; (C) VL curves.
After MACO modeling, the three vascular parameters of the two groups decreased gradually, and all parameters showed a similar trend. This indicates that the decrease of VPD is caused by the decrease of both VD and VL. Two hours after MACO, mice in the intervention group were injected with mannitol. The difference in vascular parameters between the intervention group and the control group was unclear within 4 h. After 5 h, the vascular parameters of the intervention group were significantly higher than those of the control group. Figure 8 shows the comparison of the average VPD of mice in the two groups at 1–4 h and 5–9 h. During 1 to 4 h, the difference between the two groups was only 1.3%, and during 5 to 9 h, the VPD of the intervention group was 12% higher than the control group. Figure 10 shows the Comparison of the PVD in the two groups of mice at 1–4 h and 5–9 h.
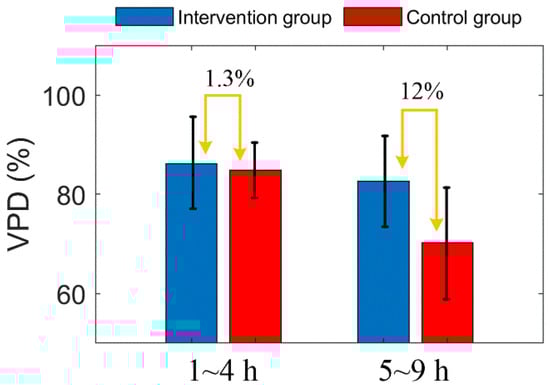
Figure 10.
Comparison of the PVD in the two groups of mice at 1–4 h and 5–9 h. The error bar represents “mean ± 95% confidence intervals”.
On the other hand, we quantified three edema parameters from the OCT attenuation image: edema area, central OAC and marginal OAC, as shown in Figure 11. It can be seen that the three edema parameters between the two groups were similar before 2 h. After 2 h, the growth rate of edema area decreased significantly in the intervention group. The falling rate of the central OAC has also slowed down, but the marginal OAC did not differ significantly.
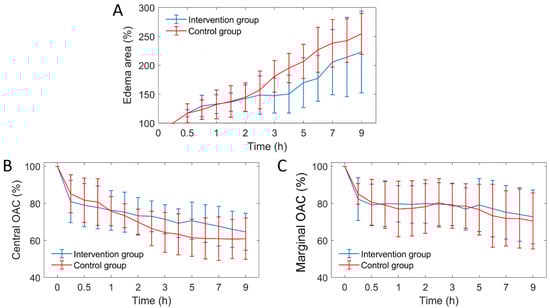
Figure 11.
The curves of three edema parameters over time (n = 6). OAC: optical attenuation coefficient. (A) VPD; (B) VAD; (C) VL curves.
Figure 12 shows the comparison of edema area before and after mannitol injection in the two groups of mice. Before mannitol injection, the difference of average edema area between the two groups is less than 1%. After injection, the average edema area of the intervention group was 33% lower than that of the control group.
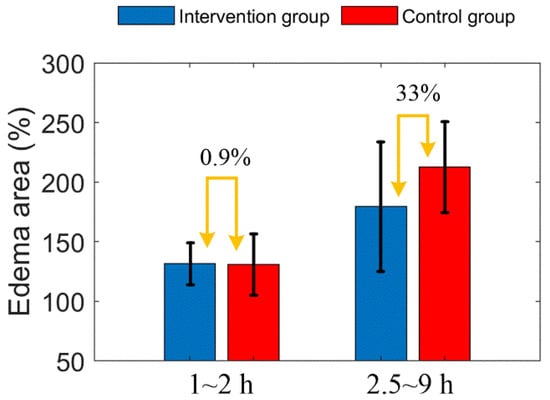
Figure 12.
Comparison of edema area before and after mannitol injection in the two groups of mice. The error bar represents “mean ± 95% confidence intervals”.
4. Discussion
Cerebral edema is a serious complication of ischemic cerebrovascular disease, which leads to intracranial hypertension and obstruction of microcirculation. Exploring and optimizing the treatment of cerebral edema is of great significance to rescuing patient life. When cerebral ischemia occurs, ATP levels decrease, sodium pumps on the cell membrane begin to fail, and excess sodium ions cannot be excreted from the cell. Chloride ions enter the cell and combine with sodium ions to form sodium chloride, leading to increased intracellular osmotic pressure. In order to maintain the osmotic pressure balance between the interior and exterior of the cell, a large number of water molecules pour into the cell from outside. Consequently, a cerebral edema is formed.
Swollen tissue extrudes peripheral capillaries and obstructs blood flow in peripheral capillaries. The blood perfusion density is reduced by high pressure, which again leads to cerebral edema. Our previous conclusions showed that a new edema will occur if the local perfusion density is reduced to 60% of the initial value [42]. Therefore, blood supply levels and the edema state are extremely critical physiological parameters and it is necessary to measure them accurately. In this paper, we used wide-range SS-OCT to detect the state of cerebral blood flow and cerebral edema in cerebral ischemic mice. Six parameters (VPD, VL, VD, edema area, marginal OAC and central OAC) were quantified. VPD, VL and VD reflect the cause of blood flow reduction. The edema area reflects the progress of the disease; OAC value reflects the water content of the brain tissue. These parameters contribute to our understanding of the effect of mannitol.
Due to individual differences between mice, the distribution of arteries and veins is different, thus, the infarct areas are different too. In order to evaluate objectively, we adopted percentage form for subsequent parameter comparison. First, from Figure 11A, we found that the increased trend of edema area between the intervention group and the control group mice was extremely similar before mannitol injection (before 2 h). After mannitol injection, however, the growth rate of edema area of the intervention group was significantly lower than that of the control group. Therefore, the progression of the edema was controlled. There was a 33% difference in the mean edema area between the two groups within 2.5 to 9 h. This indicates that the effect of mannitol on cerebral edema is rapid and conspicuous. This conclusion is consistent with some public reports [9,43].
As seen in Figure 11B, the falling rate of OAC in the edema central region was weakened, indicating that the growth rate of water content in this region was hindered, and the cell swelling was alleviated. There was no significant difference in the marginal OAC between the two groups (Figure 11C), indicating that the water content of the new edema tissue was similar. Moreover, it indicates that a new round of edema can occur only when the tissue water content reaches a certain critical value. Controlling brain water content below this threshold is an effective method that hinders the progression of cerebral edema.
Due to the dehydration effect of mannitol, the water content of brain tissues around the lesion barely increased, and it was difficult to reach the threshold of cerebral edema expansion. Moreover, slower swelling results in less pressure on peripheral microvessels. As shown in Figure 9B,C, the decrease rate of vascular average diameter and vascular length in the intervention group was significantly smaller than that of the control group. Changes in vessel diameter and length jointly determine changes in VPD (Figure 9A), Therefore, the trend of three vascular parameters is very similar. Moreover, we found that significant differences in vascular parameters did not appear immediately after mannitol injection, but rather until five hours later. Within 1 to 4 h, the difference of VPD between the two groups was only 1.3% by averaging, which was mainly caused by individual differences. However, from 5 to 9 h, the average VPD between the two groups differed by 12%. This suggests that the main reason for the improvement in blood supply is that the intracranial pressure is reduced, and the vicious cycle is interrupted. By contrast, the direct effect of mannitol on cerebral blood flow was inconspicuous.
Earlier, mannitol was proven to have a useful role in cerebral ischemia in experiments [44] and clinical [45]. This beneficial effect was confirmed by light and electron microscopy to observe the openness of microvessels and the structure of neurons. The mechanism may be related to enhancement of cerebral blood flow, improved microcirculatory dynamics, or amelioration of cerebral edema [46]. However, whether the beneficial effect of mannitol on cerebral ischemia stems from an increase in cerebral blood flow, remains to be elucidated. Akira Tanaka et al., revealed the effects of mannitol on cerebral blood flow in cats with middle cerebral artery occlusion (MCAO) in an earlier report. They found that mannitol did not significantly alter blood flow during MCAO, and the increase in cerebral blood flow was not directly related to the beneficial effects of mannitol, as this enhancement was extremely small [47]. Our results are consistent with this conclusion.
From Figure 11A, we also discovered that the standard deviation of edema area in the intervention group gradually increased over time. Especially from 7 to 9 h, the standard deviation of the control group was almost covered by that of the intervention group. This means that some mice in the intervention group showed a rapid increase in brain edema, and even reached that of the control levels. This is mainly due to the fact that after 7 h, the effect of the mannitol wore off, and the symptoms of ischemia were not alleviated and cytotoxic edema was not reversed. Therefore, the edema has rebounded. Similarly, the VPD rapidly declined within 7 to 9 h (Figure 9A). Therefore, we speculate that 7 h is the turning point of lesion aggravation, and it is necessary to strengthen disease monitoring at this time point in clinical treatment, predict the development trend of lesions in advance, and develop new intervention plans to prevent the spread of disease.
This paper demonstrates the effect of mannitol on cerebral edema from a more intuitive and novel perspective, and obtains some preliminary experimental results. Based on this technique, the effect of mannitol on different severities of cerebral edema with different dosages, frequency and timing of administration can be further studied. Moreover, this technique can be applied to the evaluation of other dehydrating agents or treatment schemes.
5. Conclusions
Mannitol can significantly reduce the water content of the edema center region. On one hand, it effectively inhibits the rapid growth of the edema area; on the other hand, it reduces the intracranial pressure, and restores the cerebral blood supply. SS-OCT-based angiography and attenuating imaging techniques can be reliable tools for evaluating the interventional effect of mannitol or other interventional medicines on cerebral edema in mice. This work will promote the improvement and perfection of treatment strategies.
Author Contributions
Conceptualization, Z.M. (Zhenhe Ma) and J.L. (Jian Liu); methodology, J.L. (Jian Liu); software, J.L. (Jian Liu), Z.M. (Ziyue Meng), A.L., Y.L. and J.L. (Jingmin Luan); validation, Z.M. (Zhenhe Ma), Y.Z. and Y.W.; formal analysis, Y.T. and H.W.; investigation, J.L. (Jian Liu) and Y.T.; resources, Z.M. (Zhenhe Ma) and J.L. (Jian Liu); data curation, Z.M. (Ziyue Meng); writing—original draft preparation, Z.M.; writing—review and editing, J.L. (Jian Liu) and Y.Y.; visualization, Z.M. (Zhenhe Ma) and J.L. (Jian Liu); supervision, Z.M. (Zhenhe Ma) and J.L. (Jian Liu); project administration, J.L. (Jian Liu); funding acquisition, Z.M. (Zhenhe Ma), J.L. (Jian Liu)., Y.Z. and Y.W. All authors have read and agreed to the published version of the manuscript.
Funding
This work was supported in part by National Natural Science Foundation of China (61771119, 61901100 and 62075037), Natural Science Foundation of Hebei Province (H2019501010, F2019501132, E2020501029 and F2020501040).
Data Availability Statement
The data that support the findings of this study are available from the corresponding author upon reasonable request.
Conflicts of Interest
The authors declare no conflict of interest.
References
- Hurd, M.D.; Goel, I.; Sakai, Y.; Teramura, Y. Current status of ischemic stroke treatment: From thrombolysis to potential regenerative medicine. Regen. Ther. 2021, 18, 408–417. [Google Scholar] [CrossRef] [PubMed]
- Xu, H.-B.; Sun, Y.-F.; Luo, N.; Wang, J.-Q.; Chang, G.-C.; Tao, L.; Yang, B.-Q.; Chen, H.-S. Net Water Uptake Calculated in Standardized and Blindly Outlined Regions of the Middle Cerebral Artery Territory Predicts the Development of Malignant Edema in Patients with Acute Large Hemispheric Infarction. Front. Neurol. 2021, 12, 305. [Google Scholar] [CrossRef] [PubMed]
- Camara-Lemarroy, C.R.; Ibarra-Yruegas, B.E.; Gongora-Rivera, F. Gastrointestinal complications after ischemic stroke. J. Neurol. Sci. 2014, 346, 20–25. [Google Scholar] [CrossRef]
- Foroushani, H.M.; Hamzehloo, A.; Kumar, A.; Chen, Y.; Heitsch, L.; Slowik, A.; Strbian, D.; Lee, J.-M.; Marcus, D.S.; Dhar, R. Accelerating Prediction of Malignant Cerebral Edema after Ischemic Stroke with Automated Image Analysis and Explainable Neural Networks. Neurocrit. Care 2021, 1–12. [Google Scholar] [CrossRef] [PubMed]
- Yao, Y.; Zhang, Y.; Liao, X.; Yang, R.; Lei, Y.; Luo, J. Potential Therapies for Cerebral Edema After Ischemic Stroke: A Mini Review. Front. Aging Neurosci. 2021, 12, 618819. [Google Scholar] [CrossRef] [PubMed]
- Ji, C.; Yu, X.; Xu, W.; Lenahan, C.; Tu, S.; Shao, A. The role of glymphatic system in the cerebral edema formation after ischemic stroke. Exp. Neurol. 2021, 340, 113685. [Google Scholar] [CrossRef]
- Gong, J.-B.; Wen, L.; Zhan, R.-Y.; Zhou, H.-J.; Wang, F.; Li, G.; Yang, X.-F. Early decompressing craniectomy in patients with traumatic brain injury and cerebral edema. Asian Biomed. 2014, 8, 53–59. [Google Scholar] [CrossRef]
- Donato, T.; Shapira, Y.; Artru, A.; Powers, K. Effect of Mannitol on Cerebrospinal Fluid Dynamics and Brain Tissue Edema. Anesth. Analg. 1994, 78, 58–66. [Google Scholar] [CrossRef]
- Schwarz, S.; Schwab, S.; Bertram, M.; Aschoff, A.; Hacke, W. Effects of Hypertonic Saline Hydroxyethyl Starch Solution and Mannitol in Patients with Increased Intracranial Pressure after Stroke. Stroke 1998, 29, 1550–1555. [Google Scholar] [CrossRef]
- Wakai, A.; McCabe, A.; Roberts, I.; Schierhout, G. Mannitol for acute traumatic brain injury. Cochrane Database Syst. Rev. 2013, 2013, CD001049. [Google Scholar] [CrossRef]
- Kalita, J.; Misra, U.; Ranjan, P.; Pradhan, P.; Das, B. Effect of mannitol on regional cerebral blood flow in patients with intracerebral hemorrhage. J. Neurol. Sci. 2004, 224, 19–22. [Google Scholar] [CrossRef] [PubMed]
- Kim, E.Y.; Lee, S.K.; Kim, D.J.; Suh, S.H.; Kim, J.; Heo, J.H.; Kim, D.I. Detection of thrombus in acute ischemic stroke: Value of thin-section noncontrast-computed tomography. Stroke 2005, 36, 2745–2747. [Google Scholar] [CrossRef] [PubMed]
- Figueiredo, G.; Brockmann, C.; Boll, H.; Heilmann, M.; Schambach, S.J.; Fiebig, T.; Kramer, M.; Groden, C.; Brockmann, M.A. Comparison of Digital Subtraction Angiography, Micro-Computed Tomography Angiography and Magnetic Resonance Angiography in the Assessment of the Cerebrovascular System in Live Mice. Clin. Neuroradiol. 2012, 22, 21–28. [Google Scholar] [CrossRef] [PubMed]
- Beckmann, N.; Stirnimann, R.; Bochelen, D. High-resolution magnetic resonance angiography of the mouse brain: Application to murine focal cerebral ischemia models. J. Magn. Reson. 1999, 140, 442–450. [Google Scholar] [CrossRef] [PubMed]
- Xia, S.; Utriainen, D.; Tang, J.; Kou, Z.; Zheng, G.; Wang, X.; Shen, W.; Haacke, E.M.; Lu, G. Decreased oxygen saturation in asymmetrically prominent cortical veins in patients with cerebral ischemic stroke. Magn. Reson. Imaging 2014, 32, 1272–1276. [Google Scholar] [CrossRef] [PubMed]
- Kudomi, N.; Hayashi, T.; Watabe, H.; Teramoto, N.; Piao, R.; Ose, T.; Koshino, K.; Ohta, Y.; Iida, H. A Physiologic Model for Recirculation Water Correction in CMRO2 Assessment with 15O2 Inhalation PET. J. Cereb. Blood Flow Metab. 2008, 29, 355–364. [Google Scholar] [CrossRef]
- Balbi, M.; Vanni, M.P.; Vega, M.J.; Silasi, G.; Sekino, Y.; Boyd, J.D.; LeDue, J.M.; Murphy, T.H. Longitudinal monitoring of mesoscopic cortical activity in a mouse model of microinfarcts reveals dissociations with behavioral and motor function. J. Cereb. Blood Flow Metab. 2019, 39, 1486–1500. [Google Scholar] [CrossRef]
- Wang, Z.; Hughes, S.M.; Dayasundara, S.; Menon, R.S. Theoretical and Experimental Optimization of Laser Speckle Contrast Imaging for High Specificity to Brain Microcirculation. J. Cereb. Blood Flow Metab. 2006, 27, 258–269. [Google Scholar] [CrossRef]
- Zhang, W.; Wu, L.; Li, J.; Yi, X.; Wang, X.; Lu, Y.; Chen, W.; Zhou, Z.; Zhang, L.; Zhao, H.; et al. Combined hemoglobin and fluorescence diffuse optical tomography for breast tumor diagnosis: A pilot study on time-domain methodology. Biomed. Opt. Express 2013, 4, 331–348. [Google Scholar] [CrossRef]
- Culver, J.P.; Durduran, T.; Furuya, D.; Cheung, C.; Greenberg, J.H.; Yodh, A.G. Diffuse Optical Tomography of Cerebral Blood Flow, Oxygenation, and Metabolism in Rat during Focal Ischemia. J. Cereb. Blood Flow Metab. 2003, 23, 911–924. [Google Scholar] [CrossRef]
- Yu, Y.; Meng, Z.; Li, A.; Lin, Y.; Liu, J.; Ma, Y.; Wang, Y.; Ma, Z. Monitoring of edema progression in permanent and transient MCAO model using SS-OCT. J. Innov. Opt. Health Sci. 2021, 14, 2140006. [Google Scholar] [CrossRef]
- Liu, J.; Li, Y.; Yu, Y.; Yuan, X.; Lv, H.; Liu, L.; Zhao, Y.; Wang, Y.; Ma, Z. Simultaneous detection of cerebral blood perfusion and cerebral edema using swept-source optical coherence tomography. J. Biophotonics 2019, 13, e201960087. [Google Scholar] [CrossRef]
- Chen, Z.; Milner, T.E.; Srinivas, S.; Wang, X.; Malekafzali, A.; Van Gemert, M.J.C.; Nelson, J.S. Noninvasive imaging of in vivo blood flow velocity using optical Doppler tomography. Opt. Lett. 1997, 22, 1119–1121. [Google Scholar] [CrossRef]
- Leitgeb, R.A.; Schmetterer, L.; Drexler, W.; Fercher, A.F.; Zawadzki, R.J.; Bajraszewski, T. Real-time assessment of retinal blood flow with ultrafast acquisition by color Doppler Fourier domain optical coherence tomography. Opt. Express 2003, 11, 3116–3121. [Google Scholar] [CrossRef] [PubMed]
- Schmitt, J.M. OCT elastography: Imaging microscopic deformation and strain of tissue. Opt. Express 1998, 3, 199–211. [Google Scholar] [CrossRef] [PubMed]
- Larin, K.V.; Sampson, D.D. Optical coherence elastography–OCT at work in tissue biomechanics. Biomed. Opt. Express 2017, 8, 1172–1202. [Google Scholar] [CrossRef]
- Chong, S.P.; Bernucci, M.; Radhakrishnan, H.; Srinivasan, V.J. Structural and functional human retinal imaging with a fiber-based visible light OCT ophthalmoscope. Biomed. Opt. Express 2016, 8, 323–337. [Google Scholar] [CrossRef] [PubMed]
- Chen, S.; Shu, X.; Nesper, P.L.; Liu, W.; Fawzi, A.; Zhang, H.F. Retinal oximetry in humans using visible-light optical coherence tomography [Invited]. Biomed. Opt. Express 2017, 8, 1415–1429. [Google Scholar] [CrossRef]
- Gong, P.; Chin, L.; Es’Haghian, S.; Liew, Y.M.; Wood, F.M.; Sampson, D.; McLaughlin, R. Imaging of skin birefringence for human scar assessment using polarization-sensitive optical coherence tomography aided by vascular masking. J. Biomed. Opt. 2014, 19, 126014. [Google Scholar] [CrossRef]
- Mahmud, M.S.; Cadotte, D.W.; Vuong, B.; Sun, C.; Luk, T.W.H.; Mariampillai, A.; Yang, V. Review of speckle and phase variance optical coherence tomography to visualize microvascular networks. J. Biomed. Opt. 2013, 18, 050901. [Google Scholar] [CrossRef]
- Grulkowski, I.; Liu, J.J.; Potsaid, B.; Jayaraman, V.; Lu, C.D.; Jiang, J.; Cable, A.E.; Duker, J.S.; Fujimoto, J.G. Retinal, anterior segment and full eye imaging using ultrahigh speed swept source OCT with vertical-cavity surface emitting lasers. Biomed. Opt. Express 2012, 3, 2733–2751. [Google Scholar] [CrossRef] [PubMed]
- Mogensen, M.; Thrane, L.; Jørgensen, T.M.; Andersen, P.E.; Jemec, G. OCT imaging of skin cancer and other dermatological diseases. J. Biophotonics 2009, 2, 442–451. [Google Scholar] [CrossRef] [PubMed]
- Qin, J.; Shi, L.; Wang, H.; Reif, R.; Wang, R.K. Functional evaluation of hemodynamic response during neural activation using optical microangiography integrated with dual-wavelength laser speckle imaging. J. Biomed. Opt. 2014, 19, 26013. [Google Scholar] [CrossRef] [PubMed][Green Version]
- Wang, R.K.; Jacques, S.L.; Ma, Z.; Hurst, S.; Hanson, S.R.; Gruber, A. Three dimensional optical angiography. Opt. Express 2007, 15, 4083–4097. [Google Scholar] [CrossRef]
- Liang, D.; Bhatta, S.; Gerzanich, V.; Simard, J.M. Cytotoxic edema: Mechanisms of pathological cell swelling. Neurosurg. Focus 2007, 22, E2. [Google Scholar] [CrossRef] [PubMed]
- Liu, J.; Li, Y.; Yu, Y.; Yuan, X.; Lv, H.; Zhao, Y.; Ma, Z. Cerebral edema detection in vivo after middle cerebral artery occlusion using swept-source optical coherence tomography. Neurophotonics 2019, 6, 045007. [Google Scholar] [CrossRef] [PubMed]
- Liu, J.; Ding, N.; Yu, Y.; Liu, L.; Yuan, X.; Lv, H.; Zhao, Y.; Ma, Z. Whole-brain microcirculation detection after ischemic stroke based on swept-source optical coherence tomography. J. Biophotonics 2019, 12, e201900122. [Google Scholar] [CrossRef]
- Liu, J.; Ma, Y.; Dou, S.; Wang, Y.; La, D.; Liu, J.; Ma, Z. Hemodynamic changes in a rat parietal cortex after endothelin-1-induced middle cerebral artery occlusion monitored by optical coherence tomography. J. Biomed. Opt. 2016, 21, 075014. [Google Scholar] [CrossRef]
- Ma, Z.; Ding, N.; Yu, Y.; Ma, Y.; Yuan, X.; Wang, Y.; Zhao, Y.; Luan, J.; Liu, J. Quantification of cerebral vascular perfusion density via optical coherence tomography based on locally adaptive regional growth. Appl. Opt. 2018, 57, 10117–10124. [Google Scholar] [CrossRef]
- Liu, J.; Ding, N.; Yu, Y.; Yuan, X.; Luo, S.; Luan, J.; Zhao, Y.; Wang, Y.; Ma, Z. Optimized depth-resolved estimation to measure optical attenuation coefficients from optical coherence tomography and its application in cerebral damage determination. J. Biomed. Opt. 2019, 24, 035002. [Google Scholar] [CrossRef]
- van Leeuwen, T.; Faber, D.; Aalders, M. Measurement of the axial point spread function in scattering media using single-mode fiber-based optical coherence tomography. IEEE J. Sel. Top. Quantum Electron. 2003, 9, 227–233. [Google Scholar] [CrossRef]
- Liu, J.; Li, Y.; Lin, Y.; Meng, Z.; Guo, X.; Yu, Y.; Ma, Z. Quantitative research on the interaction between cerebral edema and peripheral cerebral blood perfusion using swept-source optical coherence tomography. Quant. Imaging Med. Surg. 2020, 11, 939–947. [Google Scholar] [CrossRef] [PubMed]
- James, H.E. The Effect of Intravenous Fluid Replacement on the Response to Mannitol in Experimental Cerebral Edema: An Analysis of Intracranial Pressure, Serum Osmolality, Serum Electrolytes, and Brain Water Content. In Brain Edema XIII; Springer: Vienna, Austria, 2006; Volume 96, pp. 125–129. [Google Scholar]
- Little, J.R. Modification of acute focal ischemia by treatment with mannitol. Stroke 1978, 9, 4–9. [Google Scholar] [CrossRef] [PubMed]
- Brown, F.D.; Hanlon, K.; Mullan, S. Treatment of aneurysmal hemiplegia with dopamine and mannitol. J. Neurosurg. 1978, 49, 525–529. [Google Scholar] [CrossRef]
- Peña, H.; Gaines, C.; Suess, D.; Crowell, R.M.; Waggener, J.D.; DeGirolami, U. Effect of mannitol on experimental focal ischemia in awake monkeys. Neurosurgery 1982, 11, 477–481. [Google Scholar]
- Tanaka, A.; Tomonaga, M. Effect of mannitol on cerebral blood flow and microcirculation during experimental middle cerebral artery occlusion. Surg. Neurol. 1987, 28, 189–195. [Google Scholar] [CrossRef]


Publisher’s Note: MDPI stays neutral with regard to jurisdictional claims in published maps and institutional affiliations. |
© 2022 by the authors. Licensee MDPI, Basel, Switzerland. This article is an open access article distributed under the terms and conditions of the Creative Commons Attribution (CC BY) license (https://creativecommons.org/licenses/by/4.0/).