Article

Study of an Optical Fiber Time Transmission Method with Real-Time Average Temperature Measurement of Links

1
School of Electronic and Information Engineering, Jiujiang University, Jiujiang 332005, China
2
Department of Navigation Engineering, PLA Naval University of Engineering, Wuhan 430033, China
*
Author to whom correspondence should be addressed.
Photonics 2022, 9(5), 293; https://doi.org/10.3390/photonics9050293
Submission received: 3 April 2022 / Revised: 22 April 2022 / Accepted: 23 April 2022 / Published: 26 April 2022
(This article belongs to the Topic Fiber Optic Communication)

Abstract

:
The temperature of optical fiber links is an important factor affecting the accuracy of optical fiber time transmission. However, the real-time temperature measurement of optical fiber links in field networks is difficult and contains many errors. In this paper, a new method for the real-time average temperature measurement of optical fiber links is proposed. By accurately measuring the round-trip time delay of the optical fiber link and filtering out the delay jitter and system noise through the Kalman filter, the real-time average temperature of optical fiber links can be accurately calculated. The experimental results in the temperature control box show that the temperature measurement accuracy of this method is about 0.015 °C. Under the condition of a significant temperature change, the time synchronization accuracy of the round-trip system can reach the sub-nanosecond level and the time stability is less than 35 ps/s and 8 ps/104 s.

1. Introduction

With progress in high-precision frequency standard technologies, the stability of the optical frequency atomic clock has reached 10−19 [1]. Among the seven international basic units, time has the highest measurement accuracy [2]. The large-scale time service of the atomic clock together with long-distance time transfer among atomic clocks can improve the accuracy and stability of the clock source and improve the overall performance and redundancy of the clock group [3]. Therefore, transmitting high-precision, time-frequency information to users is an essential topic in this field. Compared with other time service methods, optical fiber time-frequency synchronization technology has obvious advantages such as low loss, high stability, and large bandwidth, and has gradually become the time service method with the highest accuracy and stability [4].
At present, in the single-fiber bidirectional optical fiber time transmission scheme between the master and the slave time service stations, the round-trip method and wavelength division multiplexing (WDM) are typical methods [5]. They use optical signals with two different wavelengths on the same optical fiber link. The unequal round-trip wavelength and refractive index lead to asymmetric round-trip delays. With the change in link temperature, the round-trip delay difference fluctuates [6,7]. The optical fiber link in the field is inevitably affected by environmental factors such as pressure and temperature changes. The temperature change will affect the transmission delay of the optical fiber link, which affects the transmission accuracy based on WDM and the round-trip method. Since the link temperature is difficult to measure, the traditional timing system lacks a tracking estimation of the change in the round-trip time delay difference caused by temperature change [8,9].
In the round-trip method, by measuring the round-trip delay sum τ s u m = τ λ 1 + τ λ 2 of the master–slave station, and the delay ratio ρ = τ λ 1 τ λ 2 , the one-way transmission delay τ λ 1 from the master station to the slave station is solved and used to compensate the slave station clock. According to the temperature characteristics of optical fiber, the ratio ρ fluctuates with the change in temperature. If the real-time temperature of the fiber core of the optical fiber link can be measured accurately, the ratio ρ can be calculated directly, and then the one-way delay τ λ 1 can be calculated more accurately [10]. However, there are many difficulties in measuring the real-time temperature of the optical fiber link. Firstly, the temperatures of the optical cable, optical fiber, and fiber core are different in the actual environment. Therefore, the method of estimating the core temperature using the surface temperature of the optical fiber is flawed. However, it is difficult to measure the temperature of the optical fiber surface. Secondly, the length of the optical fiber link is usually tens or even hundreds of kilometers in length. The longitude and latitude span and the altitude span lead to different temperatures in parts of the same optical fiber. Even if the segmented temperature measurement is carried out in different parts of the optical fiber, there will still be numerous errors in measurement and calculation [11,12]. Therefore, it is difficult to monitor the real-time temperature of the optical fiber link by direct measurement. Due to the lack of an accurate scheme for the real-time temperature of optical fiber links, the traditional round-trip method directly makes the ratio ρ a fixed value at room temperature [13]. This scheme may cause nanosecond time synchronization errors in a 100 km optical fiber link [14].
In view of the lack of tracking of the real-time temperature of the optical fiber link in the traditional round-trip optical fiber timing system, calculating the real-time average temperature of the optical fiber link between two timing stations is proposed in this paper. Through the pre-measurement of the optical fiber length, round-trip wavelength, and terminal hardware delay, the real-time value of the round-trip delay of the optical fiber link, which varies with temperature, can be accurately measured and the jitter and noise of the round-trip delay value can be filtered using the Kalman filter algorithm. Finally, the real-time average temperature of the optical fiber link can be accurately calculated. The experimental results of the temperature control box show that the optical fiber link temperature estimation accuracy can reach 0.015 °C. This paper’s temperature-tracking measurement scheme could potentially provide a solution to the problems encountered when measuring the link temperature of the field optical fiber network. Applying the average temperature value to the round-trip time service system can significantly improve the time service accuracy. In addition, the temperature measurement method in this paper directly uses the round-trip time service system, and the temperature measurement results can be directly applied to the time service system without adding other measurement equipment.

2. Principles and Methods

2.1. The Principle of the Round-Trip Method

The structure and principle of the optical fiber time synchronization system based on the round-trip method are shown in Figure 1. The system consists of the master station and the slave station connected by an optical fiber link. Clock A is the clock source; Clock B is the clock to be tamed. There are two Time-to-Digital Converters (TDC) used to measure the time intervals: TDC1 in the master station and TDC2 in the slave station.
The round-trip method measures the round-trip time delay sum of the master and slave stations through the TDC1 of the master station, as shown in Formula (1):
τ TDC 1 = τ λ 1 + τ λ 2 + τ h
wherein, τ λ 1 is the link transmission delay of wavelength λ 1 optical signal from the master station to slave station, and τ λ 2 is the link transmission delay of wavelength λ 2 optical signal from slave station to master station. τ h is the sum of the transceiver delay of the terminal hardware equipment of the master–slave station, including the master station transmission delay τ m e , the slave station reception delay τ s r , the slave station transmission delay τ s e , and the master station reception delay τ m r , as shown in Formula (2):
τ h = τ m e + τ s r + τ s e + τ m r
In the existing optical fiber timing system, the terminal equipment can be placed in a constant temperature environment, τ h is regarded as a fixed value and can be measured in advance. Thus, the round-trip time delay sum τ s u m of the optical fiber link is obtained, as shown in Formula (3):
τ s u m = τ λ 1 + τ λ 2 = τ TDC 1 τ h
The expression of the transmission delay value of the optical fiber link is shown in Formula (4) [10]:
τ ( λ ,   T ) = L 0 C ( 1 + α ( T T 0 ) ) ( n ( λ ,   T ) λ d n ( λ ,   T ) d λ ) ,
where the light speed C is 299,792,458 m/s, L0 is the initial length of the optical fiber, T0 is the initial temperature of the optical fiber, T is the average temperature of the optical fiber link, α is the thermal expansion coefficient of the optical fiber 5.6 × 10⁻⁷ K−1, λ is the wavelength of the optical signal, and n is the refractive index.
The Sellmeier refractive index formula of optical fiber is shown in Formula (5) [11]:
n ( λ ,   T ) = A + B / ( 1 C / λ 2 ) + D / ( 1 E / λ 2 )
wherein, the unit of wavelength λ is μm. For G.652 optical fiber, the relevant parameters in Formula (5) are as follows: A = 6.90754 × 10⁻⁶T + 1.31552, B = 2.35835 × 10⁻⁵T + 0.788404, C = 5.84758 × 10⁻⁷T + 0.0110199, D = 5.48368 × 10⁻⁷T + 0.91326, E = 100.
According to Formulas (4) and (5), the round-trip time delay ratio value ρ can be expressed as:
ρ = τ λ 1 τ λ 2 = n ( λ 1 ,   T ) λ 1 d n ( λ 1 ,   T ) d λ 1 n ( λ 2 ,   T ) λ 2 d n ( λ 2   , T ) d λ 2
From Formulas (3) and (6), τ λ 1 can be solved as shown in Formula (7).
τ λ 1 = ρ ( τ TDC 1 τ h ) ρ + 1
Send the calculated τ λ 1 to the compensation module of the slave station and tame clock B. The master station sends a time signal with a wavelength of λ 1 at the CA time. When the optical signal reaches the slave station, the time value of clock A of the master station changes from CA to C A + τ λ 1 + τ m e + τ m r .
When the terminal equipment of the master-slave station is placed in the same constant temperature and pressure environment, and the laser and photodetector of the same model is selected, the terminal equipment can be ensured as much as possible after the pre-test. This leads to:
τ m e + τ s r = τ h 2
At this moment, the time value of clock B of the uncompensated slave station is CB. Therefore, it is necessary to compensate the time value of clock B to C A + τ λ 1 + τ h 2 to realize the time transmission of the master–slave station.
It can be seen from Formula (6) that ρ fluctuates with the change in temperature. However, due to the lack of tracking of the temperature of the optical fiber link, the traditional round-trip method takes ρ as the fixed value of τ λ 1 τ λ 2 at room temperature. This method may cause nanosecond time transfer errors in a 100 km optical fiber link [12].

2.2. Time Transfer Method Based on Temperature Tracking

This paper presents a method to calculate the real-time average temperature of the optical fiber link between two time service stations through the real-time round-trip delay measurement. By measuring the fiber length, the round-trip wavelengths, and the terminal hardware delay of the optical fiber time transmission system, the real-time value of the fiber link round-trip delay with temperature is accurately calculated. The jitter and noise of the round-trip delay values are filtered by the Kalman filter algorithm. In the measurement value of TDC for the round-trip delay sum, the system noise caused by terminal equipment such as lasers, optical detectors, and modulation and demodulation equipment reduces the data quality. According to the optimal estimation performance of the Kalman filter and considering its good performance in atomic clock error estimations and time scale algorithms, we chose the Kalman filter to reduce the influence of system noise so as to provide experimental data as accurately as possible for temperature measurement.
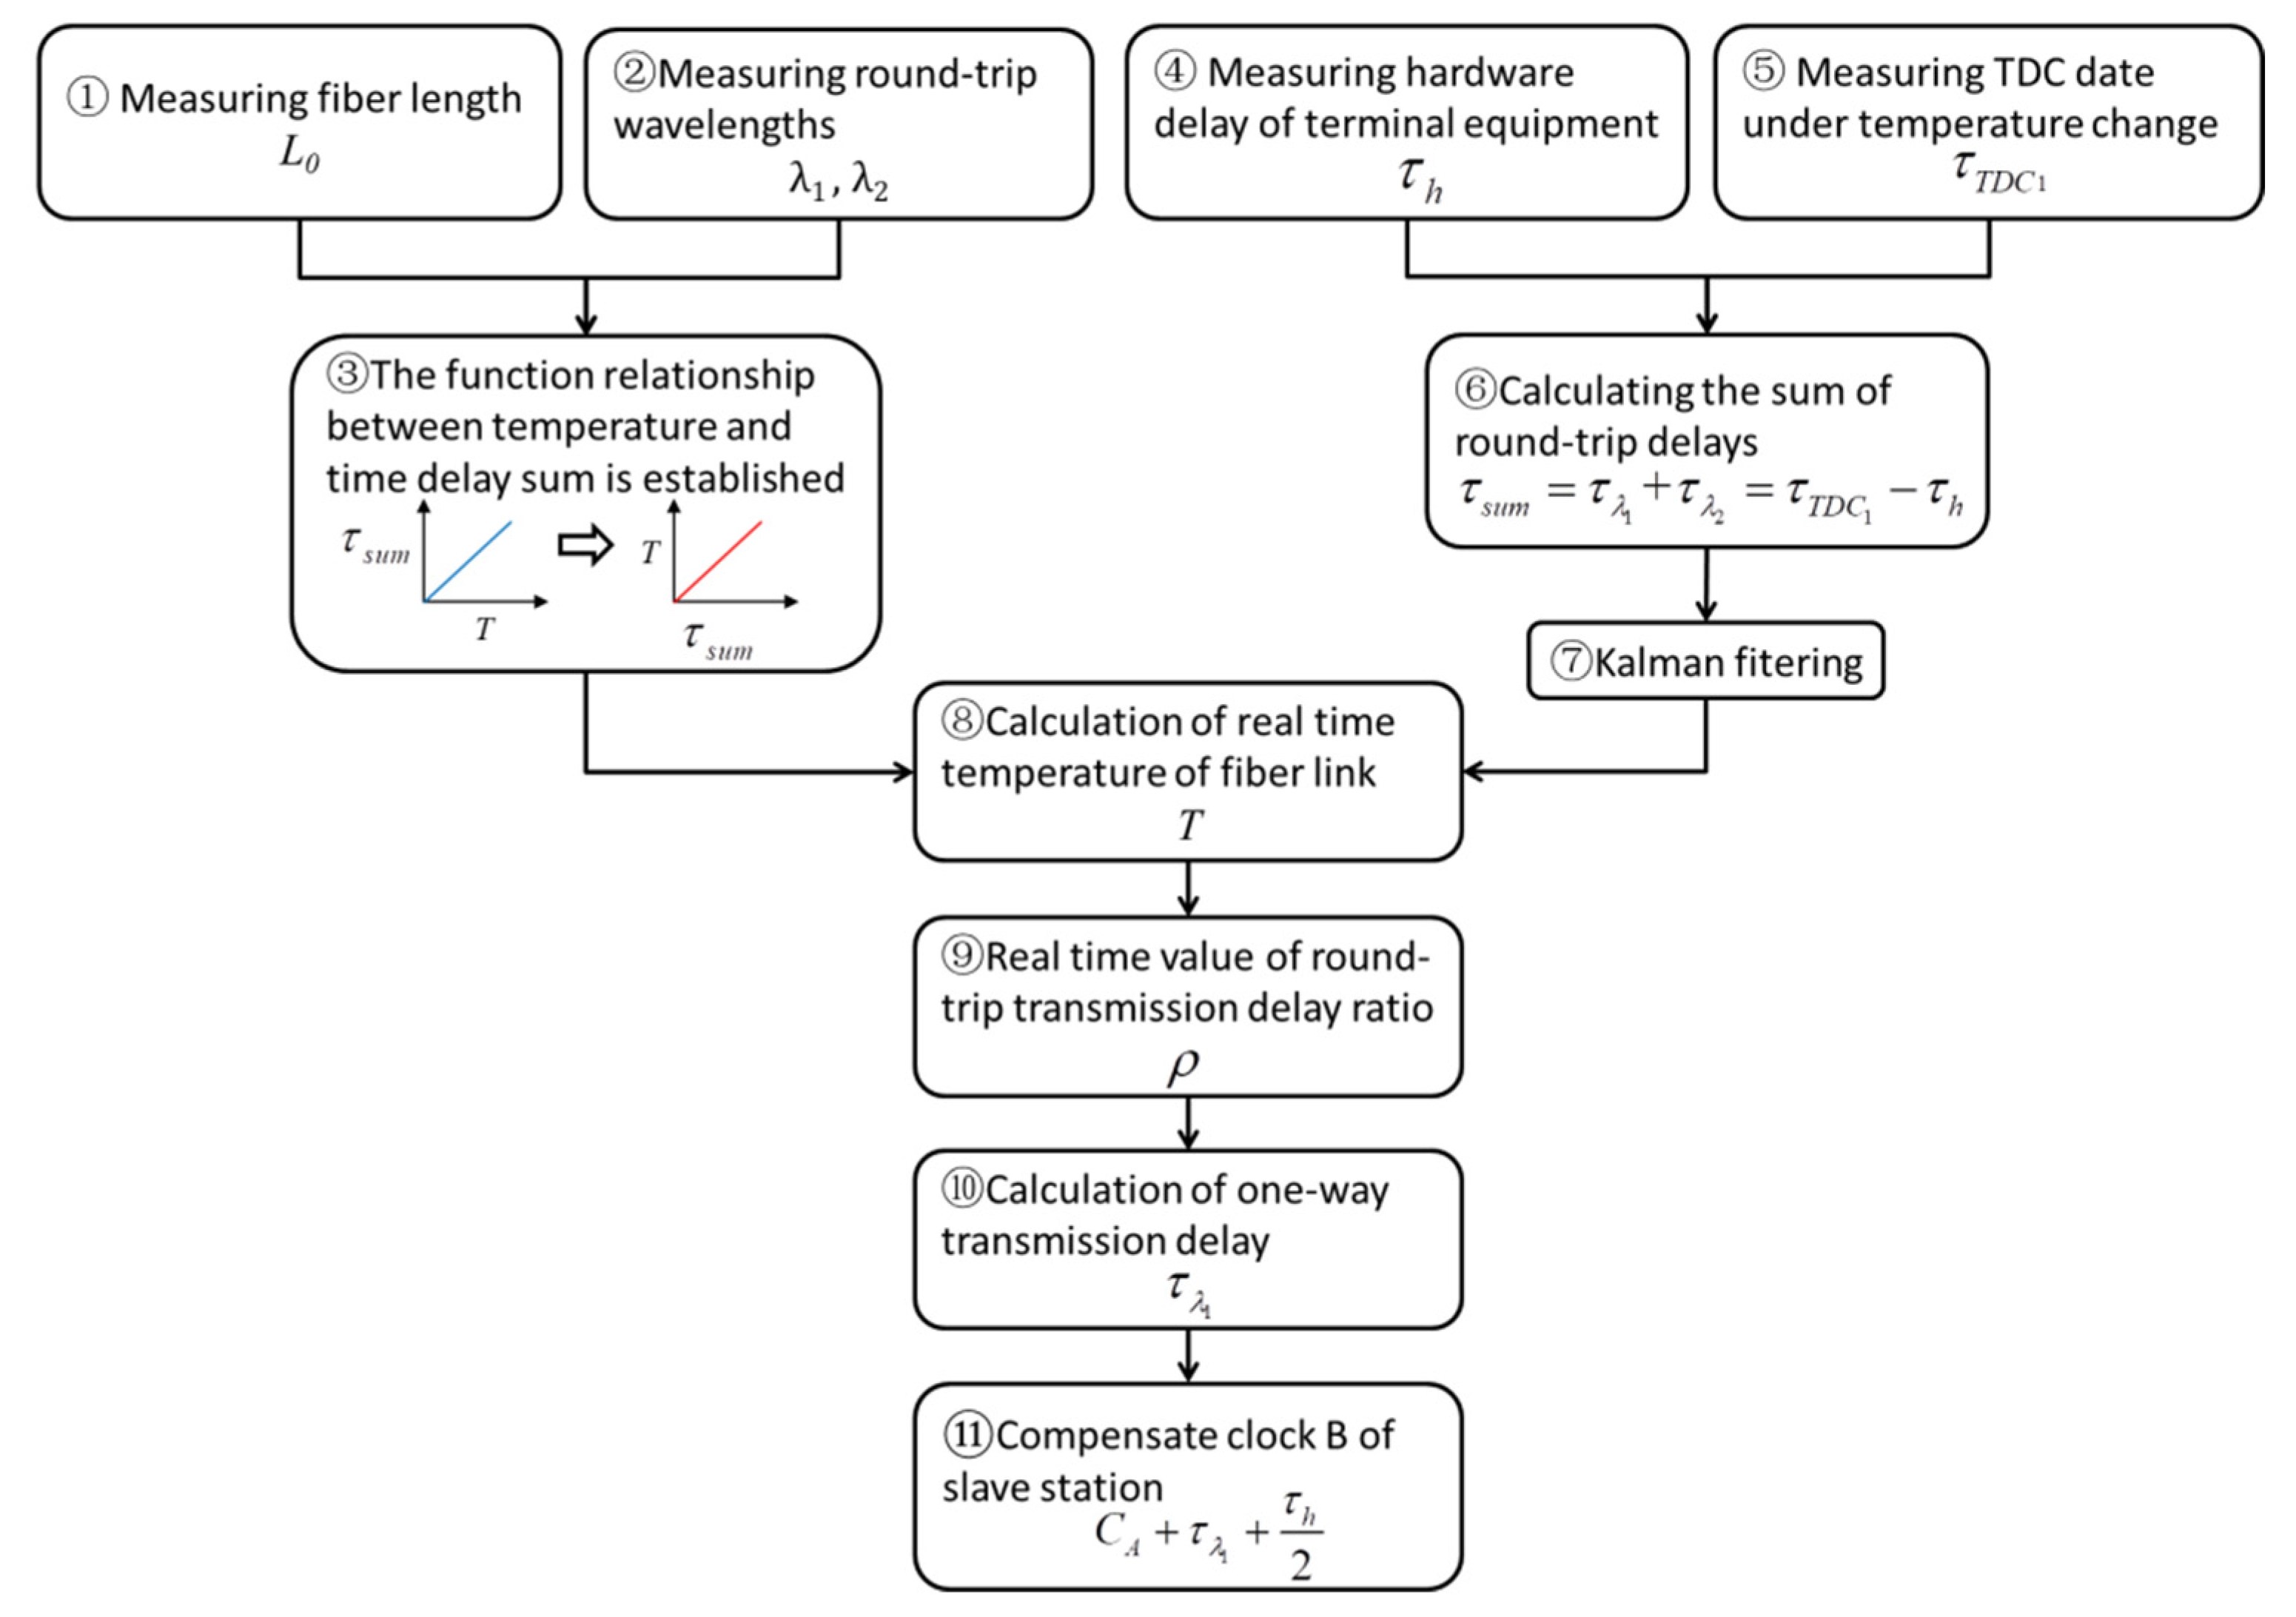
Then, by substituting the relevant parameters into Formulas (4) and (5), the corresponding relationship between the round-trip delay value and the average temperature of the link can be determined. Finally, the real-time average temperature of the optical fiber link can be accurately calculated. By substituting the measured real-time average temperature into Formulas (5) and (6), the real-time value of the ratio ρ with temperature can be calculated. The ratio of ρ substitution (5) can be used to solve the one-way delay of τ λ 1 . The specific implementation steps are as follows:
  • Measure the initial length L0 of the 23 °C optical fiber link in advance;
  • Measure the round-trip optical signal wavelengths λ 1 and λ 2 using a spectrometer;
  • Substitute the optical fiber length L0, and wavelengths λ 1 and λ 2 into Formulas (4) and (5), determine the corresponding relationship between the round-trip delay and the temperature, and establish the relationship between the temperature and the time-delay sum;
  • Pre-calibrate the transceiver delay sum τ h of the terminal hardware of the master–slave station;
  • Measure the round-trip delay τ TDC 1 of the master–slave station through the time interval measurement module;
  • The round-trip delay sum τ s u m = τ λ 1 + τ λ 2 of the optical fiber link is calculated using Formula (3);
  • The delay τ s u m jitter and noise interference are filtered by the Kalman filter algorithm;
  • The real-time average temperature T of the optical fiber link is calculated by the filter value of τ s u m ;
  • Substitute the measured real-time average temperature into Formulas (5) and (6) and the real-time value of the ratio ρ can be calculated;
  • Substitute the ratio ρ into Formula (7) to solve the one-way time delay τ λ 1 under temperature change.
  • Compensate clock CB to C A + τ λ 1 + τ h 2 .
The system workflow is shown in Figure 2:

3. Experiment and Results Analysis

3.1. Construction of an Experimental Platform

In order to verify the feasibility and accuracy of the optical fiber time transmission system based on link temperature tracking, an experimental platform is built. The experimental settings parameter table is shown in Table 1.
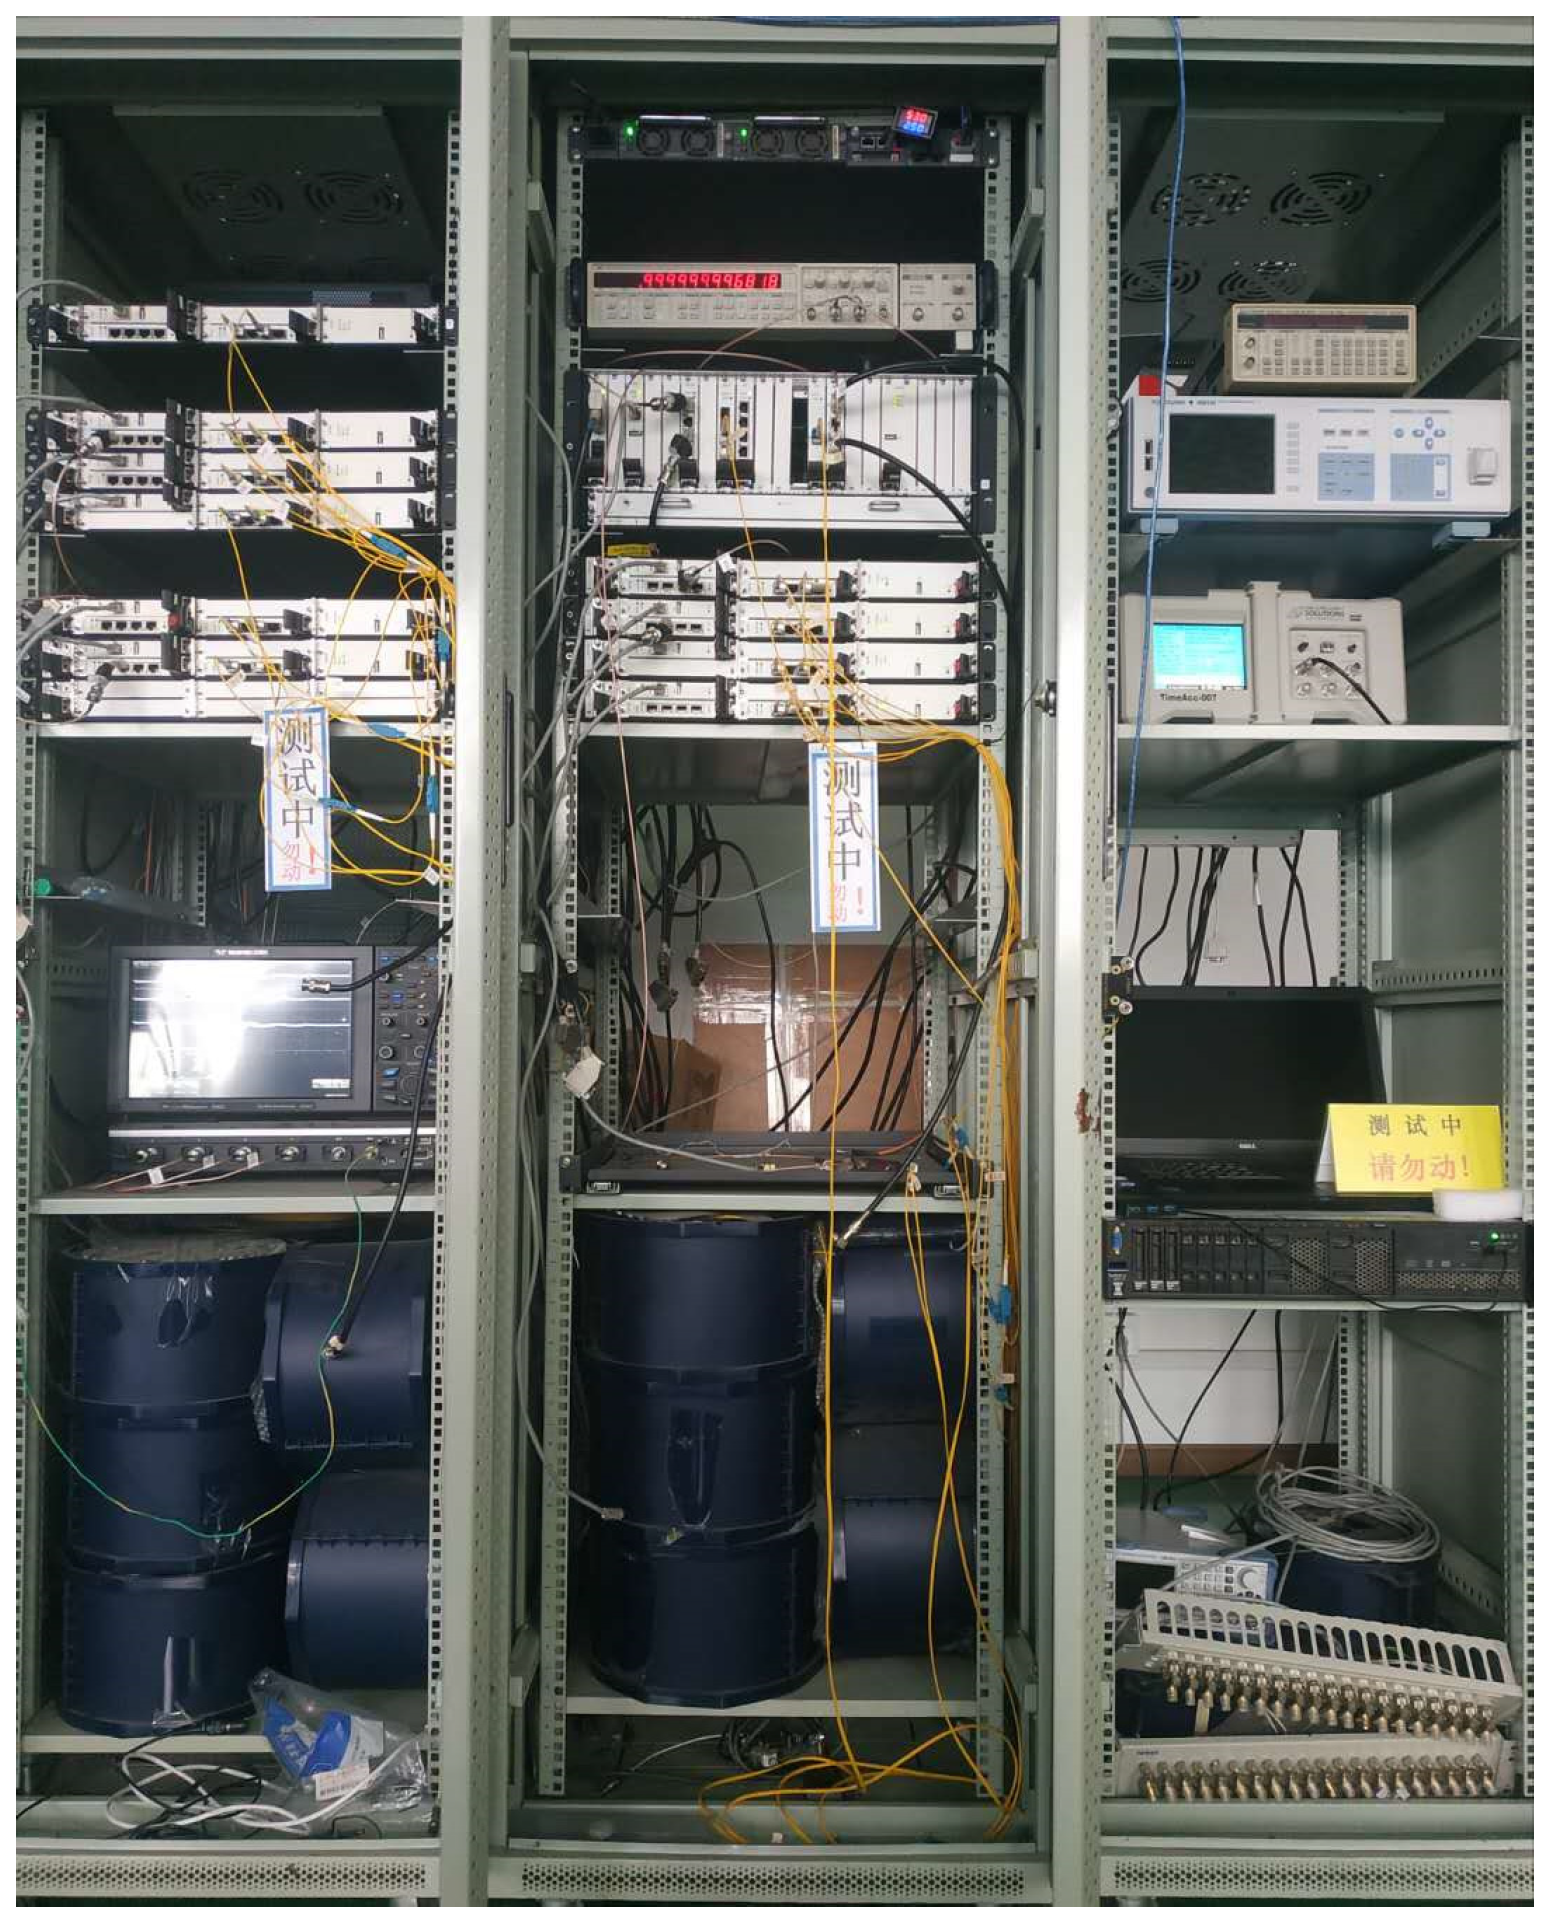
A 50 km G.652 single-mode optical fiber is used between the master and slave stations. Through pre-measurement, the combined length of the coiled fiber and the additional connecting fiber is 50692.593 m. The optical signal wavelength λ 1 from the master station to the slave station is 1550.87 nm, and the optical fiber wavelength λ 2 from the slave station to the master station is 1490.92 nm. The measurement accuracy of TDC is 100 ps. The terminal equipment of the master–slave station is placed in a constant temperature environment of 23 °C. Through pre-measurement, the hardware delay τ h of the terminal equipment is 3.4 ns. The coiled fiber is placed in the temperature control box (TC). The initial temperature of the temperature control box is 17 °C and this is maintained for 3 h. After 30 min of heating, the temperature of the temperature control box reaches the maximum temperature of 27 °C and this is maintained for 5.5 h. The total experimental time is 9 h. The experimental block diagram of the experimental platform is shown in Figure 3, and the physical diagram of the experimental platform is shown in Figure 4.

3.2. Temperature Measurement Results

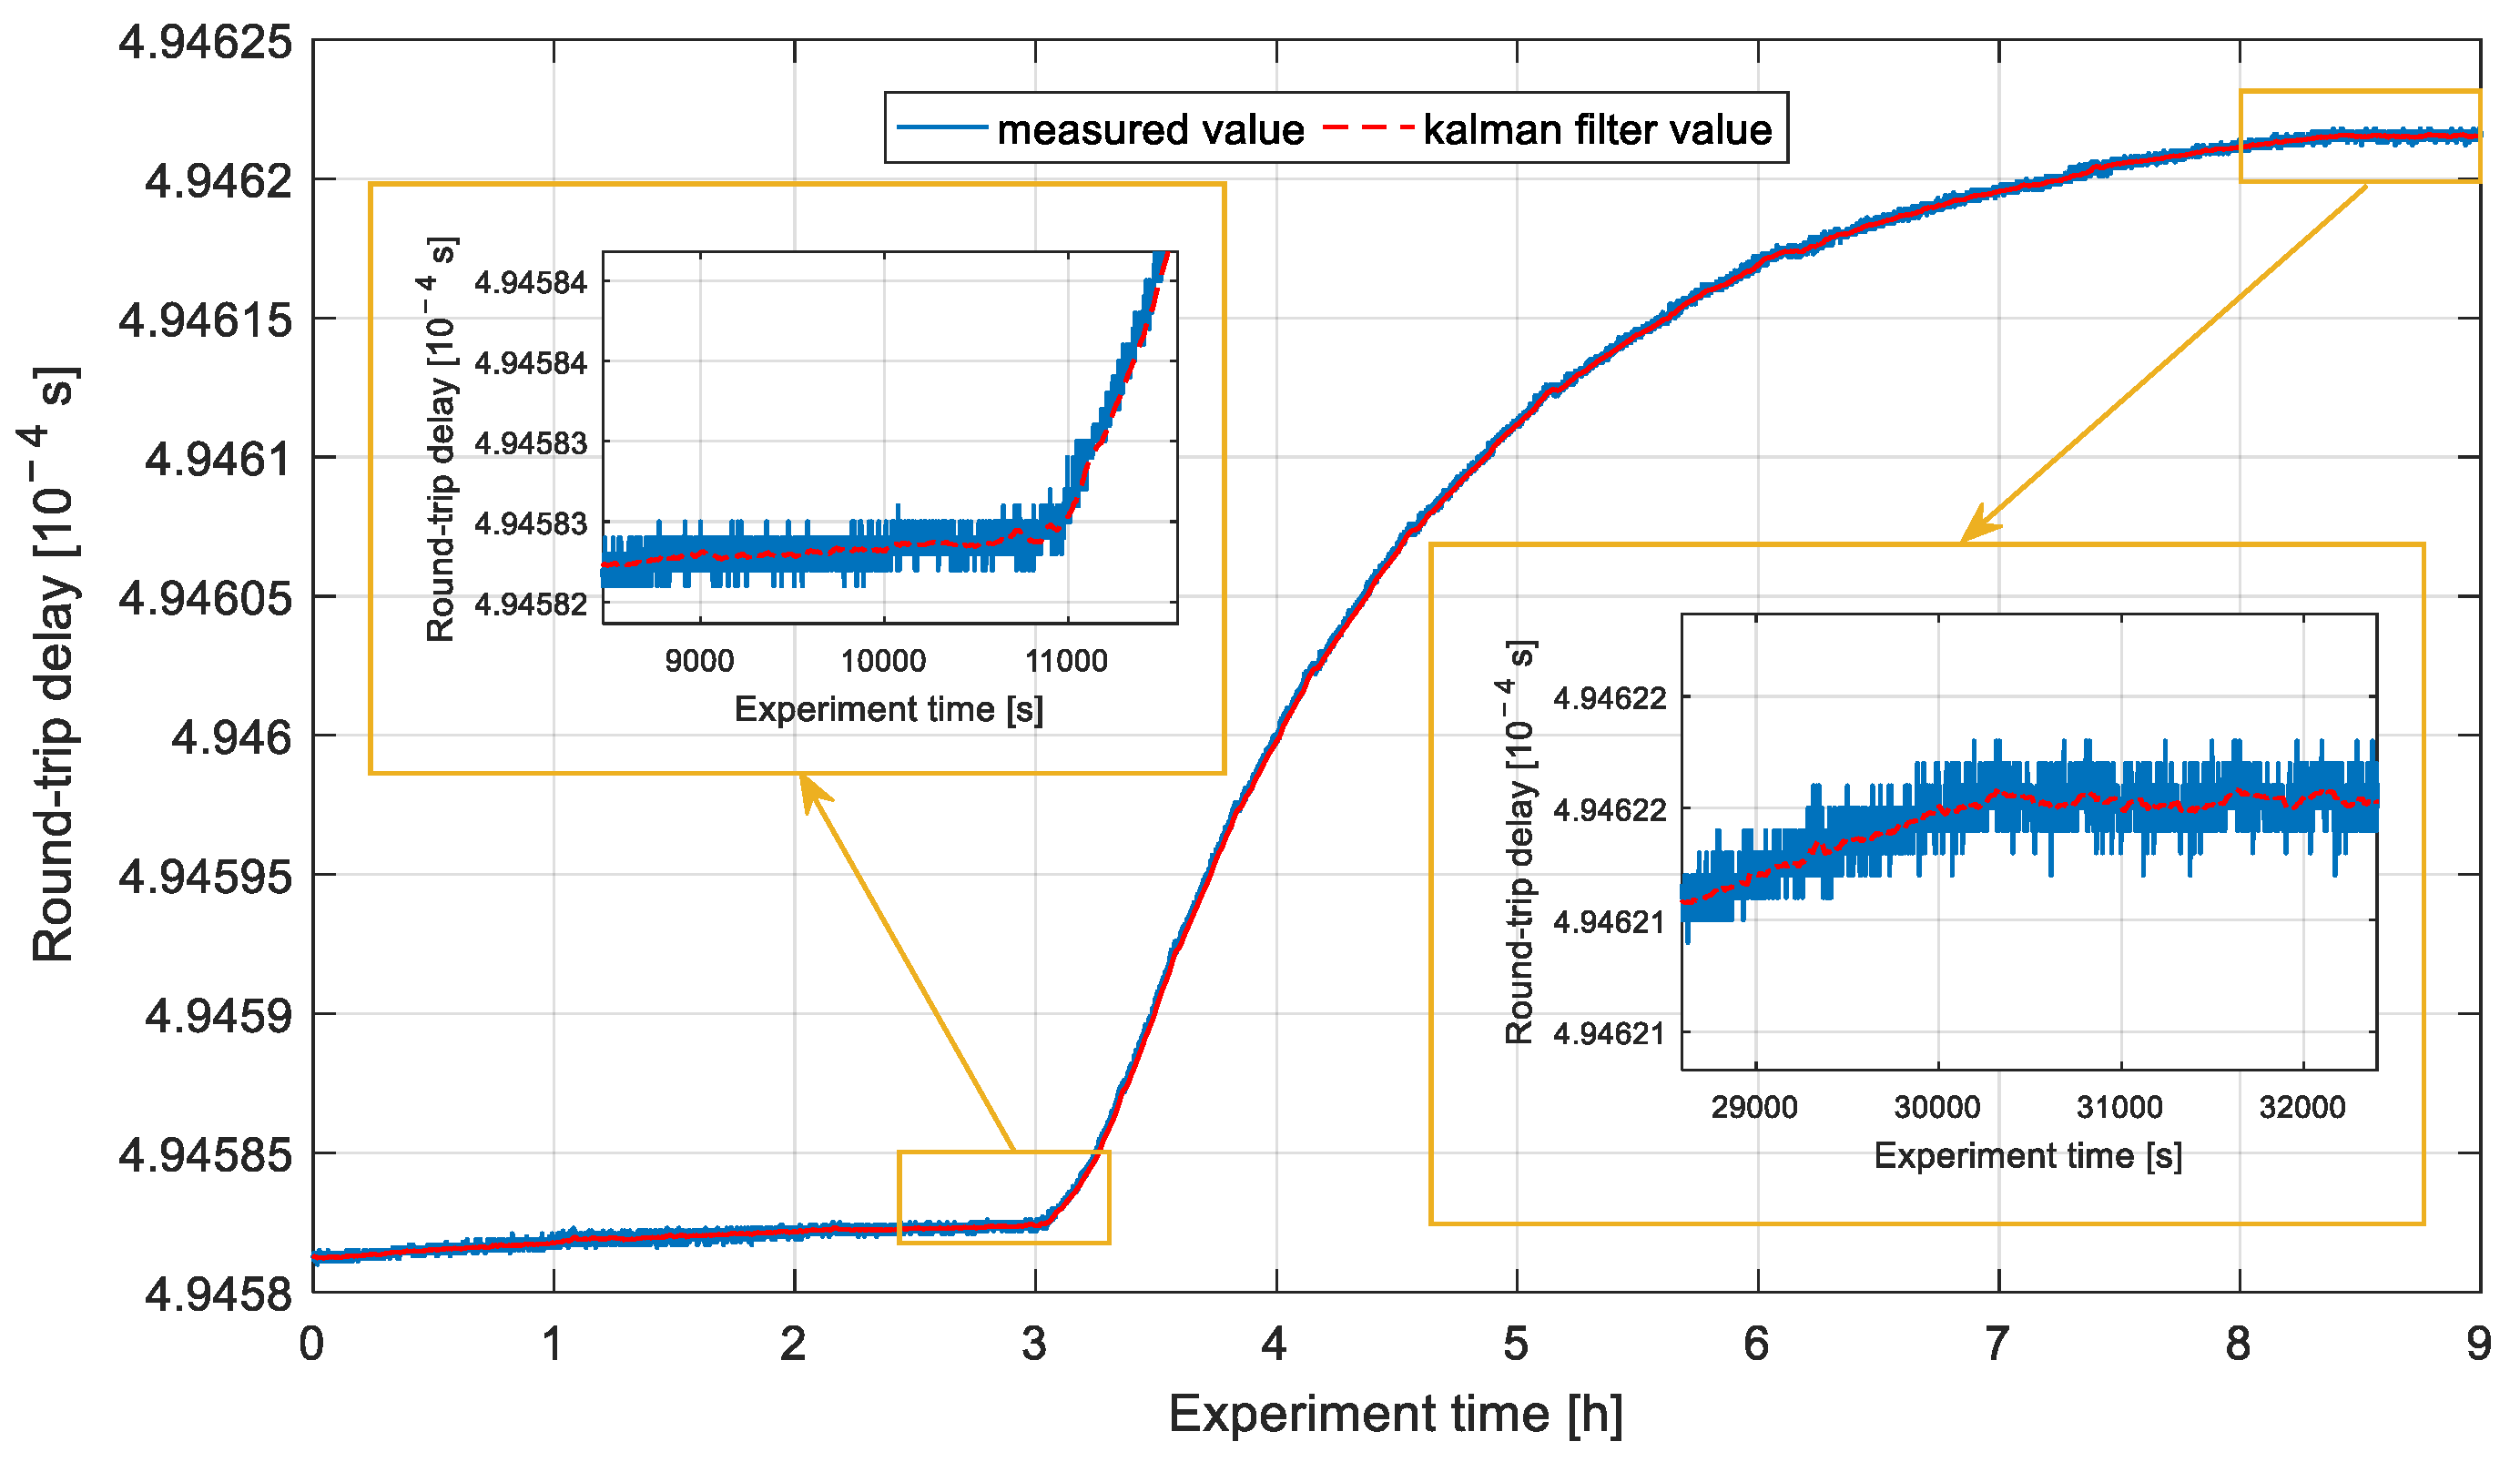
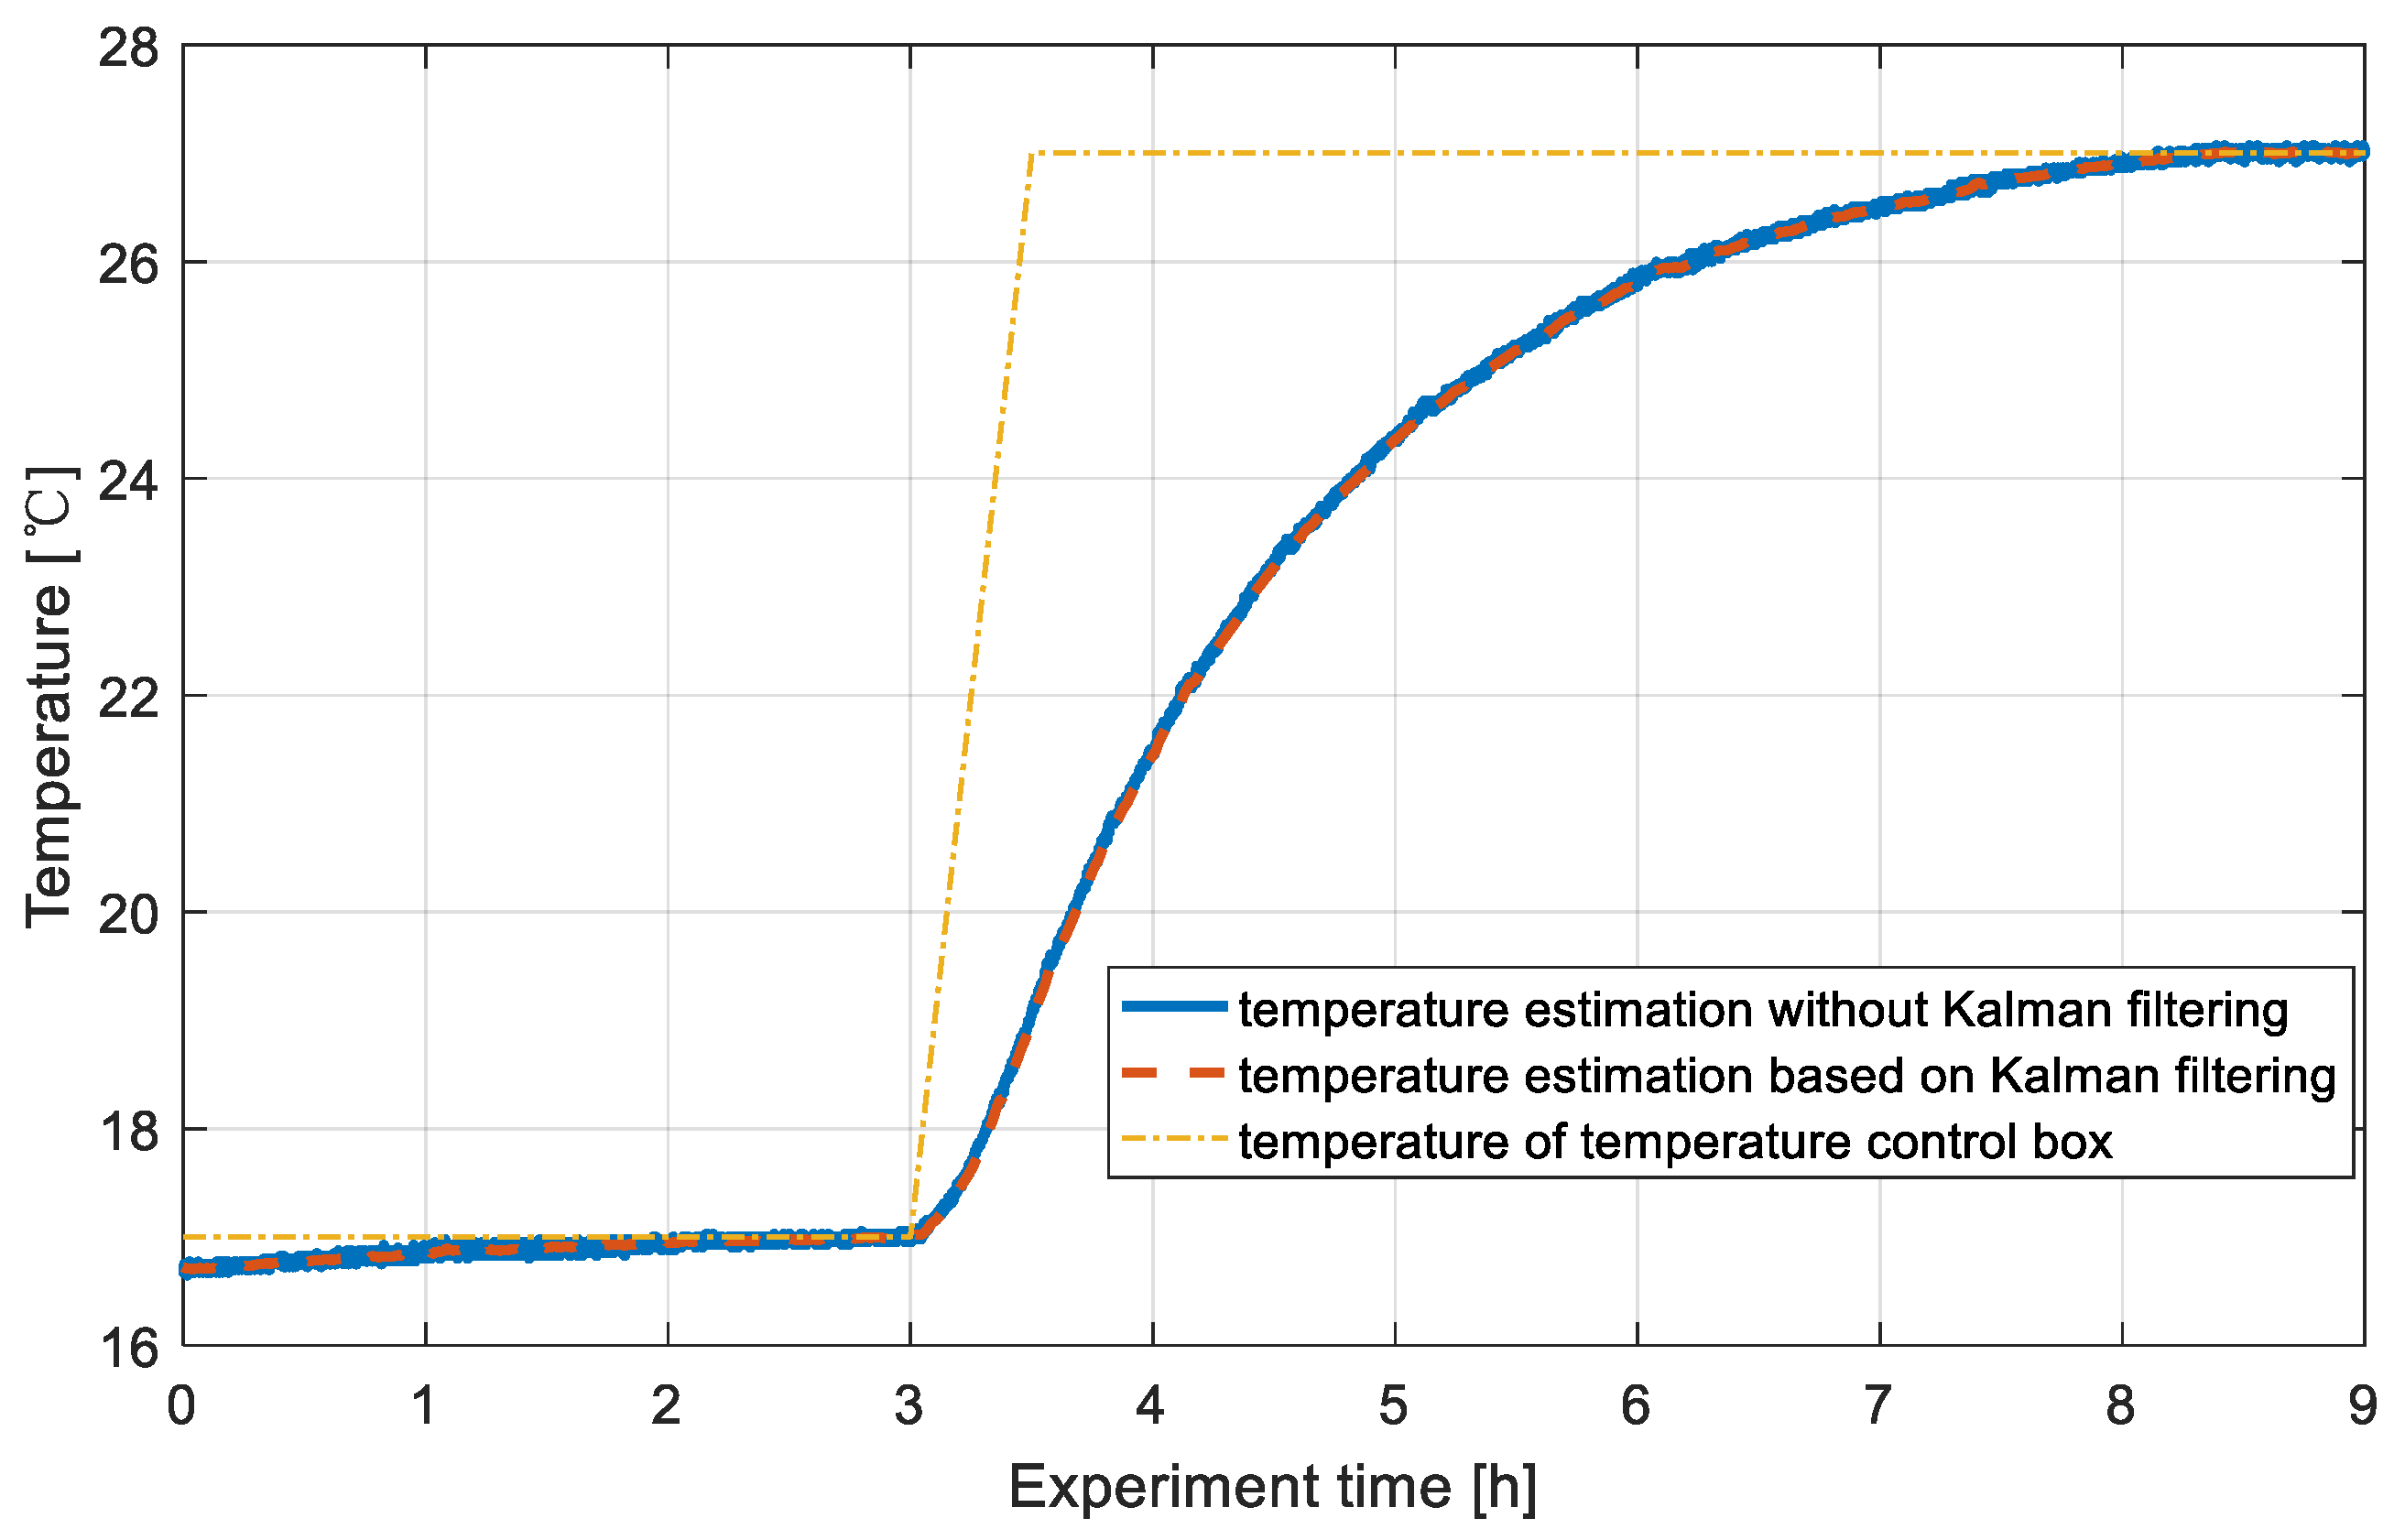
During 0–3 h, the temperature box is kept at 17 °C to ensure that the fiber core temperature reaches the initial temperature. During 3–3.5 h, the temperature control box rises rapidly to 27 °C. During 3.5–9 h, the temperature box is kept at 27 °C so that the optical fiber core can absorb heat for a long time, ensuring that the core temperature can finally reach 27 °C. Through the measured data of TDC and deducting the terminal hardware delay, the change curve of the round-trip delay sum of the optical fiber link can be obtained. The measurement results show that the round-trip delay sum of the optical fiber link increases slowly in the period during 0–2.5 h and tends to be flat after 2.5 h. It shows that the initial temperature of the coiled fiber is slightly lower than the initial temperature of the temperature control box, but that after 2.5 h of heat absorption, the core of the coiled fiber reaches 17 °C. When the temperature of the temperature control box reaches 27 °C, the round-trip delay sum of the optical fiber link rises for up to 5.5 h and tends to be flat after 8.5 h, indicating that it takes about 5.5 h for the coil fiber temperature to change from 17 °C to 27 °C. The heating rate of the coiled fiber lags far behind that of the temperature control box because the optical fibers in the coiled fiber are tightly intertwined and the outer shell of the coiled fiber is wrapped in plastic material.
Affected by laser emission wavelength jitters, link noises, TDC measurement errors, and system random noises, there are inevitable peripheral fluctuations in the measurement data of the round-trip delay of the optical fiber link. In this scheme, the round-trip delay value is processed by the Kalman filter to obtain a more accurate round-trip delay measurement value. The estimated round-trip delay after Kalman filter processing is shown in Figure 5 kalman filter value.
By substituting the optical fiber length L0 and the round-trip wavelengths λ 1 and λ 2 of this experimental scheme into Formula (4), the corresponding relationship between the round-trip delay value and the optical fiber link temperature T can be determined and the relationship between the round-trip delay and the link temperature can be deduced. Thus, the change curve of link temperature T is solved. The estimated value of the link temperature is shown in Figure 6.
Compared with the temperature value not processed by the Kalman filter, the fluctuation range of the temperature value derived from the round-trip delay value that is processed by the Kalman filter is smaller. If we observe the two time periods of 9000–10,800 s and 30,000–324,000 s, we can see that the temperature value after filtering is closer to the real-time temperature of the optical fiber core.
Thus, the scheme can estimate the real-time average temperature of the optical fiber link at any time. In order to further analyze the accuracy of this scheme in measuring the real-time temperature of the optical fiber link, we selected the experimental data in the period of 30,000–32,400 s for analysis, and the results are shown in Figure 7.
During the period 30,000–32,400 s, the temperature of the temperature control box stabilized at 27 °C for more than 5 h, and the link temperature value solved by the system exceeded 27 °C for the first time in about 30,600 s and fluctuated around 27 °C after that. This indicates that the link temperature is consistent with the temperature of the temperature control box during this period. The results show that the error peak of the link temperature without the Kalman filter is about 0.08 °C; the error peak of the link temperature measurement data processed by the Kalman filter is about 0.015 °C, the mean value of the temperature estimation error is 0.0022 °C, and the standard deviation is 0.0069 °C.
Through error analysis, the temperature measurement error of 0.015 °C is mainly caused by the following factors. Firstly, the temperature control accuracy of the CTP404 temperature control box used in the experiment is 0.01 °C, which is the main source of errors for temperature measurements. Secondly, the equipment of the temperature measurement system contains noise and signal jitters such as laser emission wavelength jitters, terminal equipment hardware delay jitters, etc. In addition, the measurement accuracy of the time interval counter could cause certain measurement errors.

3.3. Experimental Results of Time Transfer

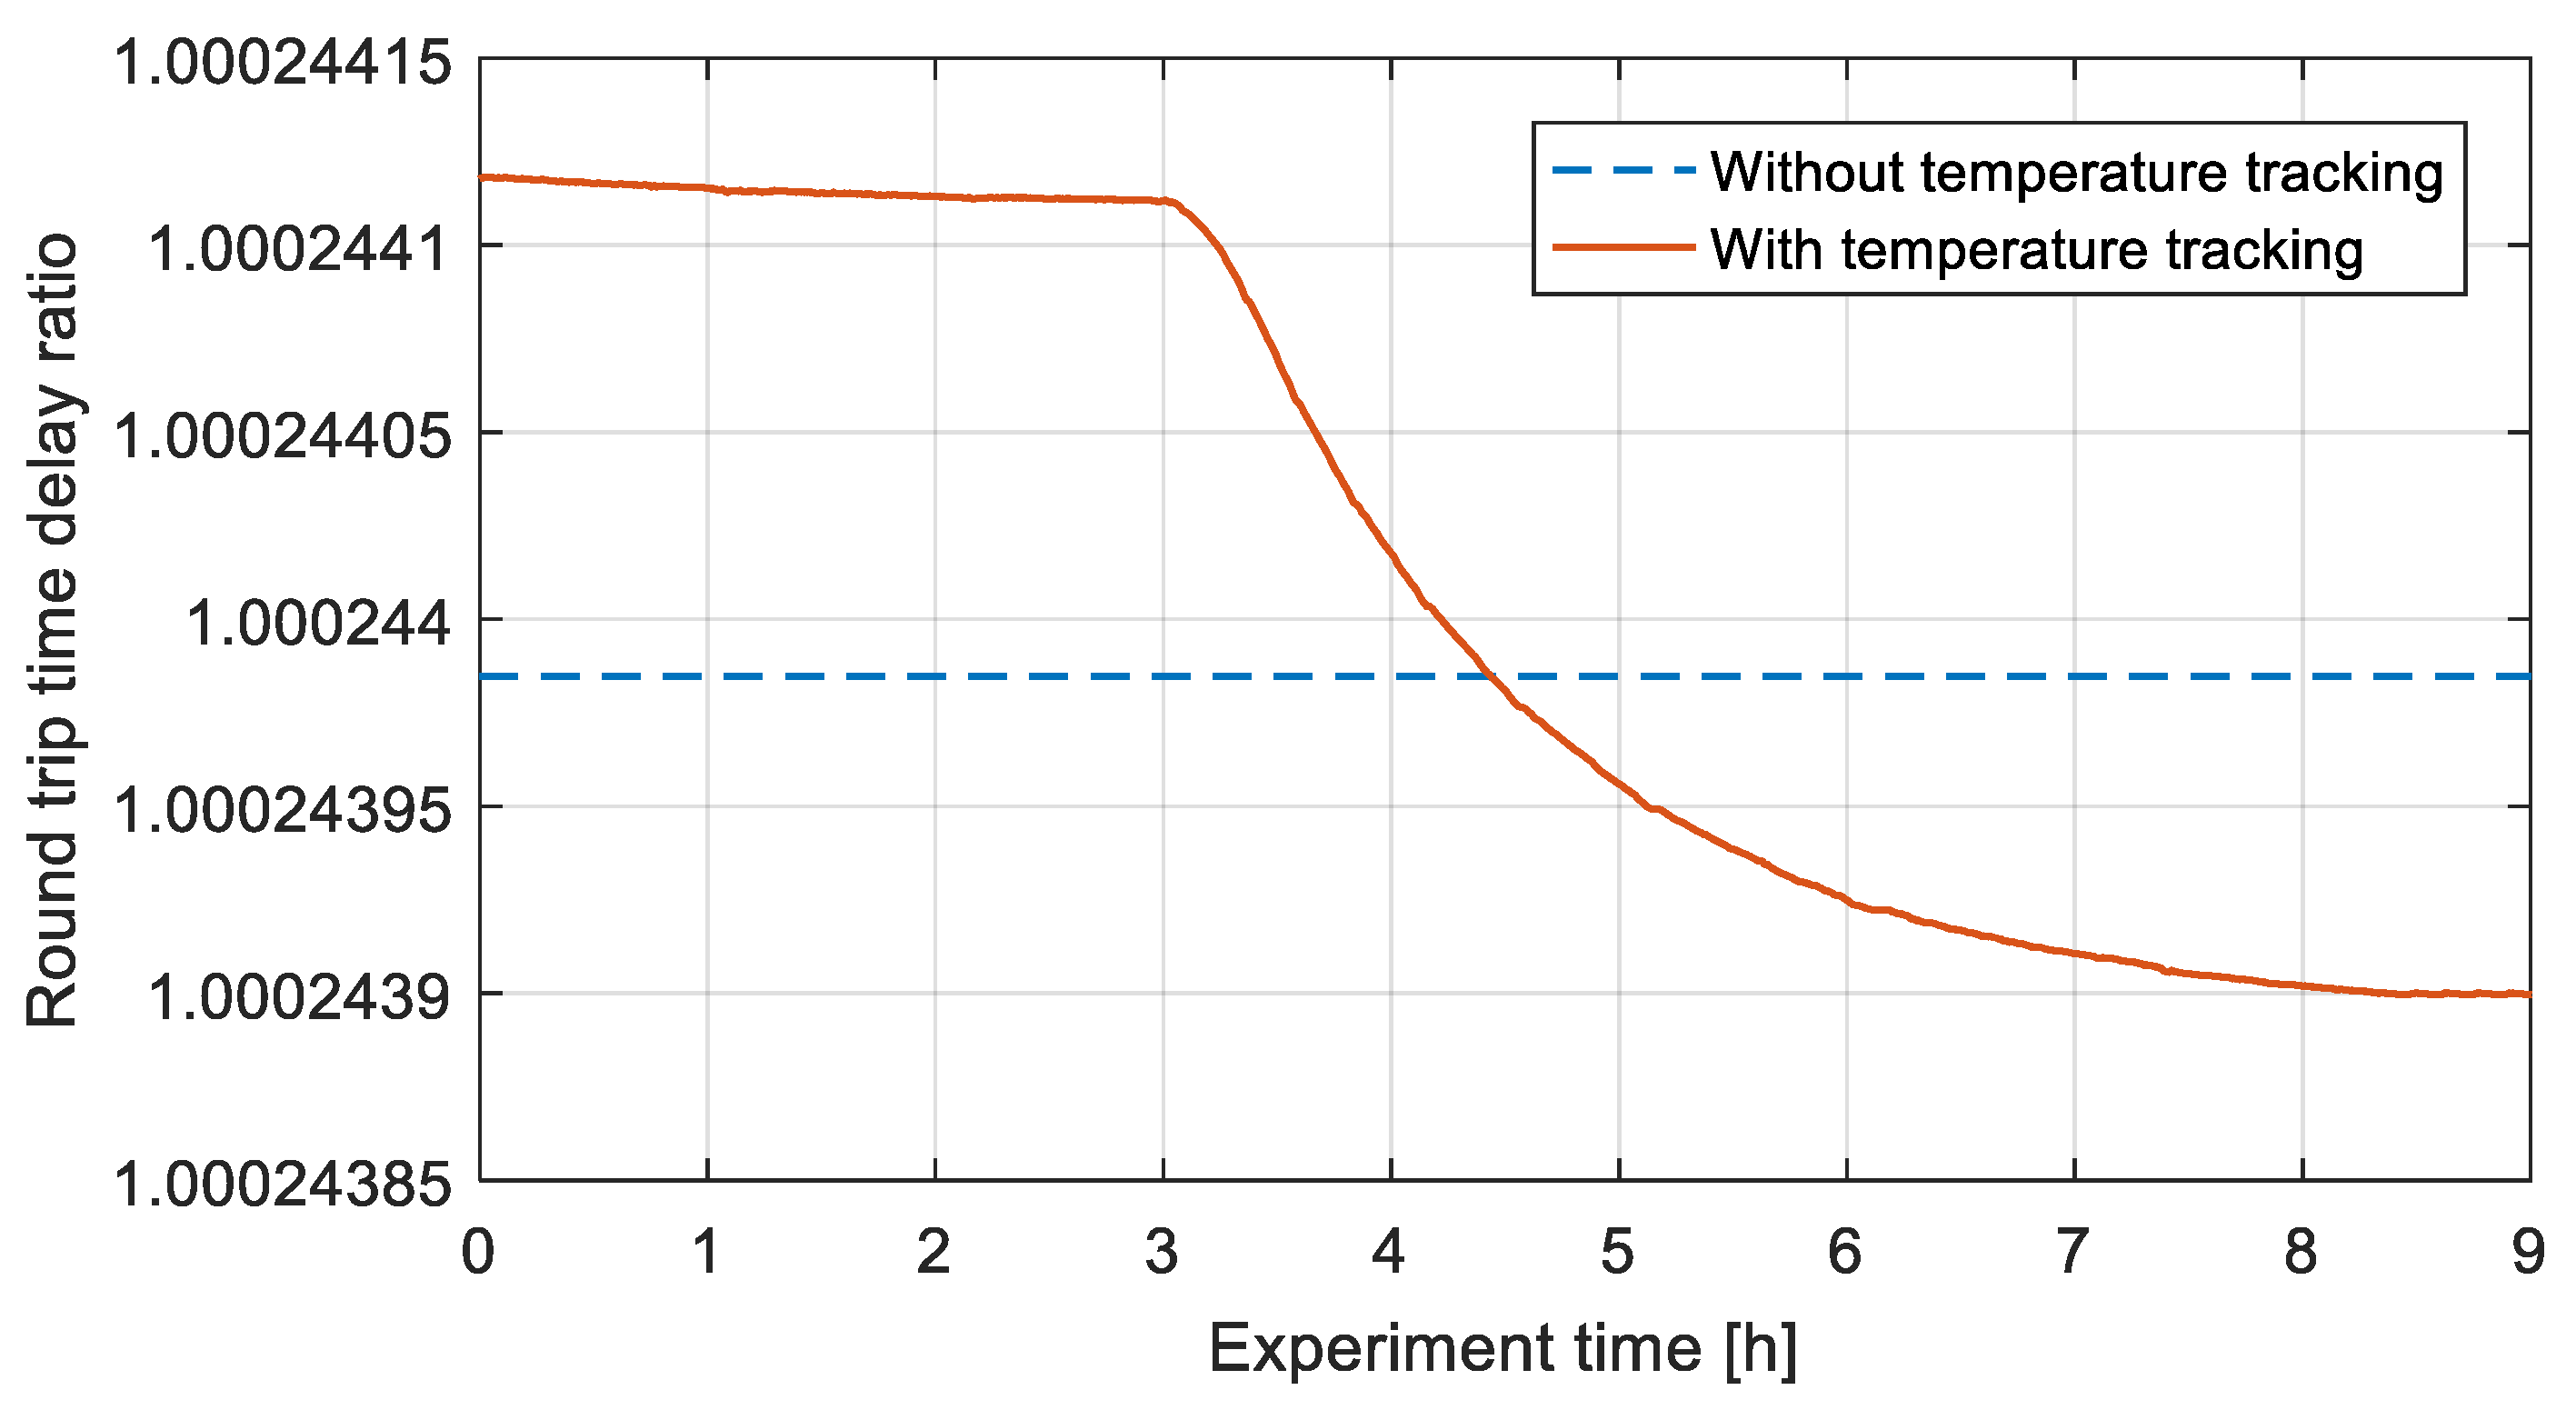
According to the results of the real-time average temperature of the optical fiber link accurately measured in Figure 7, the dynamic ratio relationship ρ = τ λ 1 τ λ 2 of the round-trip delay can be solved by substituting into Formulas (5) and (6), which can replace the method of solving the one-way delay in which the ratio in the traditional round-trip method takes a fixed value at room temperature. Therefore, compared with the traditional round-trip method, the optical fiber link temperature measurement scheme in this paper considers the influence of the link’s real-time temperature contrast value ρ in solving the one-way time delay of the master–slave station, so as to improve the time transmission accuracy of the master–slave station of the round-trip time transmission system. The comparison diagram of the round-trip time delay ratio of the link with and without temperature tracking is shown in Figure 8.
Substituting the delay ratio ρ based on the link’s temperature tracking into Formula (7) can calculate a more accurate one-way delay value, so as to improve the time synchronization accuracy of master–slave stations. The time synchronization results of this scheme and the traditional round-trip method are shown in Figure 9.
The peak value of the clock difference after time synchronization of the traditional round-trip method is 2.26 ns, and the peak value of the clock difference based on temperature tracking time synchronization is 1.51 ns. The Time Deviation (TDEV) of the two schemes is shown in Figure 10.
Time deviation (TDEV) is a characteristic parameter of time stability. The deterioration of its short-term stability (1~100 s) is mainly related to the decline in the signal-to-noise ratio of the received signal in optical fiber transmission, whereas the deterioration of long-term stability (1000~3000 s) is mainly due to the change in the transmission delay differences of the optical fiber link with temperature and the drift of the transmission wavelength. The time stability of the round-trip method without temperature tracking is about 42 ps/s and 29 ps/104 s, and the time stability using the temperature tracking discussed in this paper is less than 35 ps/s and 8 ps/104 s.

4. Conclusions

In this paper, a time transfer method based on the real-time average temperature tracking of optical fiber links is proposed. By accurately measuring the round-trip delay sum of the optical fiber link, and filtering out the delay jitter and system noise using the Kalman filter, the real-time average temperature of the optical fiber link can be accurately calculated. The real-time average temperature can accurately solve the round-trip time delay ratio of optical fiber, so as to further improve the time transmission accuracy of the round-trip time synchronization scheme. The experimental results show that the temperature measurement accuracy of this method is about 0.015 °C. Using this method, the timing accuracy of the traditional round-trip time transmission system is improved by about 700 ps, and the time stability is less than 35 ps/s and 8 ps/104 s.

Author Contributions

Conceptualization, D.C. and M.W.; methodology, J.X.; software, X.T.; validation, J.X. and M.W.; formal analysis, D.C.; investigation, X.T.; resources, J.X.; data curation, D.C.; writing—original draft preparation, D.C.; writing—review and editing, M.W.; supervision, J.X.; project administration, M.W.; funding acquisition, J.X. All authors have read and agreed to the published version of the manuscript.

Funding

This research was funded by the National Natural Science Foundation, China (41804076) and the National Key Research and Development, China (2016YFB0501700, 2016YFB0501701).

Institutional Review Board Statement

Not applicable for studies not involving humans or animals.

Informed Consent Statement

Not applicable.

Data Availability Statement

Data underlying the results presented in this paper are not publicly available at this time but may be obtained from the authors upon reasonable request.

Conflicts of Interest

The authors declare no conflict of interest.

References

  1. Chen, D.; Xu, J.; Liang, Y.; Jiang, S.; He, H. Long-Distance Time Transfer in Optical Fiber Networks Using a Cascaded Taming Technology. Math. Probl. Eng. 2021, 2021, 8860028. [Google Scholar] [CrossRef]
  2. Smotlacha, V.; Kuna, A.; Mache, W. Time transfer using fiber links. In Proceedings of the EFTF-2010 24th European Frequency and Time Forum, Noordwijk, The Netherlands, 13–16 April 2010; pp. 1–8. [Google Scholar]
  3. Droste, S.; Ozimek, F.; Udem, T.; Predehl, K.; Hänsch, T.W.; Schnatz, H.H.; Grosche, G.; Holzwarth, R. Optical-Frequency Transfer over a Single-Span 1840 km Fiber Link. Phys. Rev. Lett. 2013, 111, 110801. [Google Scholar] [CrossRef] [PubMed]
  4. Chen, D.; Xu, J.; Li, Z.; Tan, X.; Wu, M. Optical fiber time transmission technology based on a double-fiber round-trip method. Appl. Opt. 2021, 60, 7504–7510. [Google Scholar] [CrossRef] [PubMed]
  5. Czubla, A.; Krehlik, P.; Sliwczyliski, L. Some approximated methods of calculation Sagnac correction for optical fiber time transfer. In Proceedings of the 2017 Joint Conference of the European Frequency and Time Forum and IEEE International Frequency Control Symposium, Besancon, France, 9–13 July 2017; IEEE: New York, NY, USA; pp. 399–401. [Google Scholar]
  6. Zhang, H.; Wu, G.; Hu, L.; Li, X.; Chen, J. High-precision time transfer over 2000-km fiber link. IEEE Photonics J. 2015, 7, 15615634. [Google Scholar] [CrossRef]
  7. Lopez, O.; Kanj, A.; Pottie, P.E.; Rovera, D.; Achkar, J.; Chardonnet, C.; Amy-Klein, A.; Santarelli, G. Simultaneous remote transfer of accurate timing and optical frequency over a public fiber network. Appl. Phys. B 2013, 110, 3–6. [Google Scholar] [CrossRef] [Green Version]
  8. Yang, Y. Concepts of Comprehensive PNT and related key technologies. Acta Geod. Cartogr. Sin. 2016, 45, 506. [Google Scholar]
  9. Krehlik, P.; Sliwczynski, L.; Buczek, L. ELSTAB-fiber optic time and frequency distribution technology—A general characterization and fundamental limits. IEEE Trans. Ultrason. Ferroelectr. Freq. Control 2016, 63, 993–1004. [Google Scholar] [CrossRef] [PubMed]
  10. Ghosh, G.; Endo, M. Temperature-dependent Sellmeier coefficients and chromatic dispersions for some optical fiber glasses. J. Lightwave Technol. 1994, 12, 1338–1342. [Google Scholar] [CrossRef] [Green Version]
  11. Yu, L.; Wang, R.; Lu, L.; Zhu, Y.; Zheng, J.; Wu, C.; Zhang, B.; Wang, P. WDM-based radio frequency dissemination in a tree-topology fiber optic network. Opt. Express 2015, 23, 19783–19792. [Google Scholar] [CrossRef] [PubMed]
  12. Lou, Z.; Yang, B.; Han, K.; Wang, X.; Zhang, H.; Xi, X.; Liu, Z. Real-time in-situ distributed fiber core temperature measurement in hundred-watt fiber laser oscillator pumped by 915/976 nm LD sources. Sci. Rep. 2020, 10, 9006. [Google Scholar] [CrossRef] [PubMed]
  13. Jin, C.; Shevchenko, N.A.; Li, Z.; Popov, S.; Chen, Y.; Xu, T. Nonlinear Coherent Optical Systems in the Presence of Equalization Enhanced Phase Noise. J. Lightwave Technol. 2021, 39, 4646–4653. [Google Scholar] [CrossRef]
  14. Ding, M.; Feng, Z.; Marpaung, D.; Zhang, X.; Komanec, M.; Suslov, D.; Dousek, D.; Zvánovec, S.; Numkam Fokoua, E.R.; Bradley, T.D.; et al. Optical fiber delay lines in microwave photonics: Sensitivity to temperature and means to reduce it. J. Lightwave Technol. 2021, 39, 2311–2318. [Google Scholar] [CrossRef]
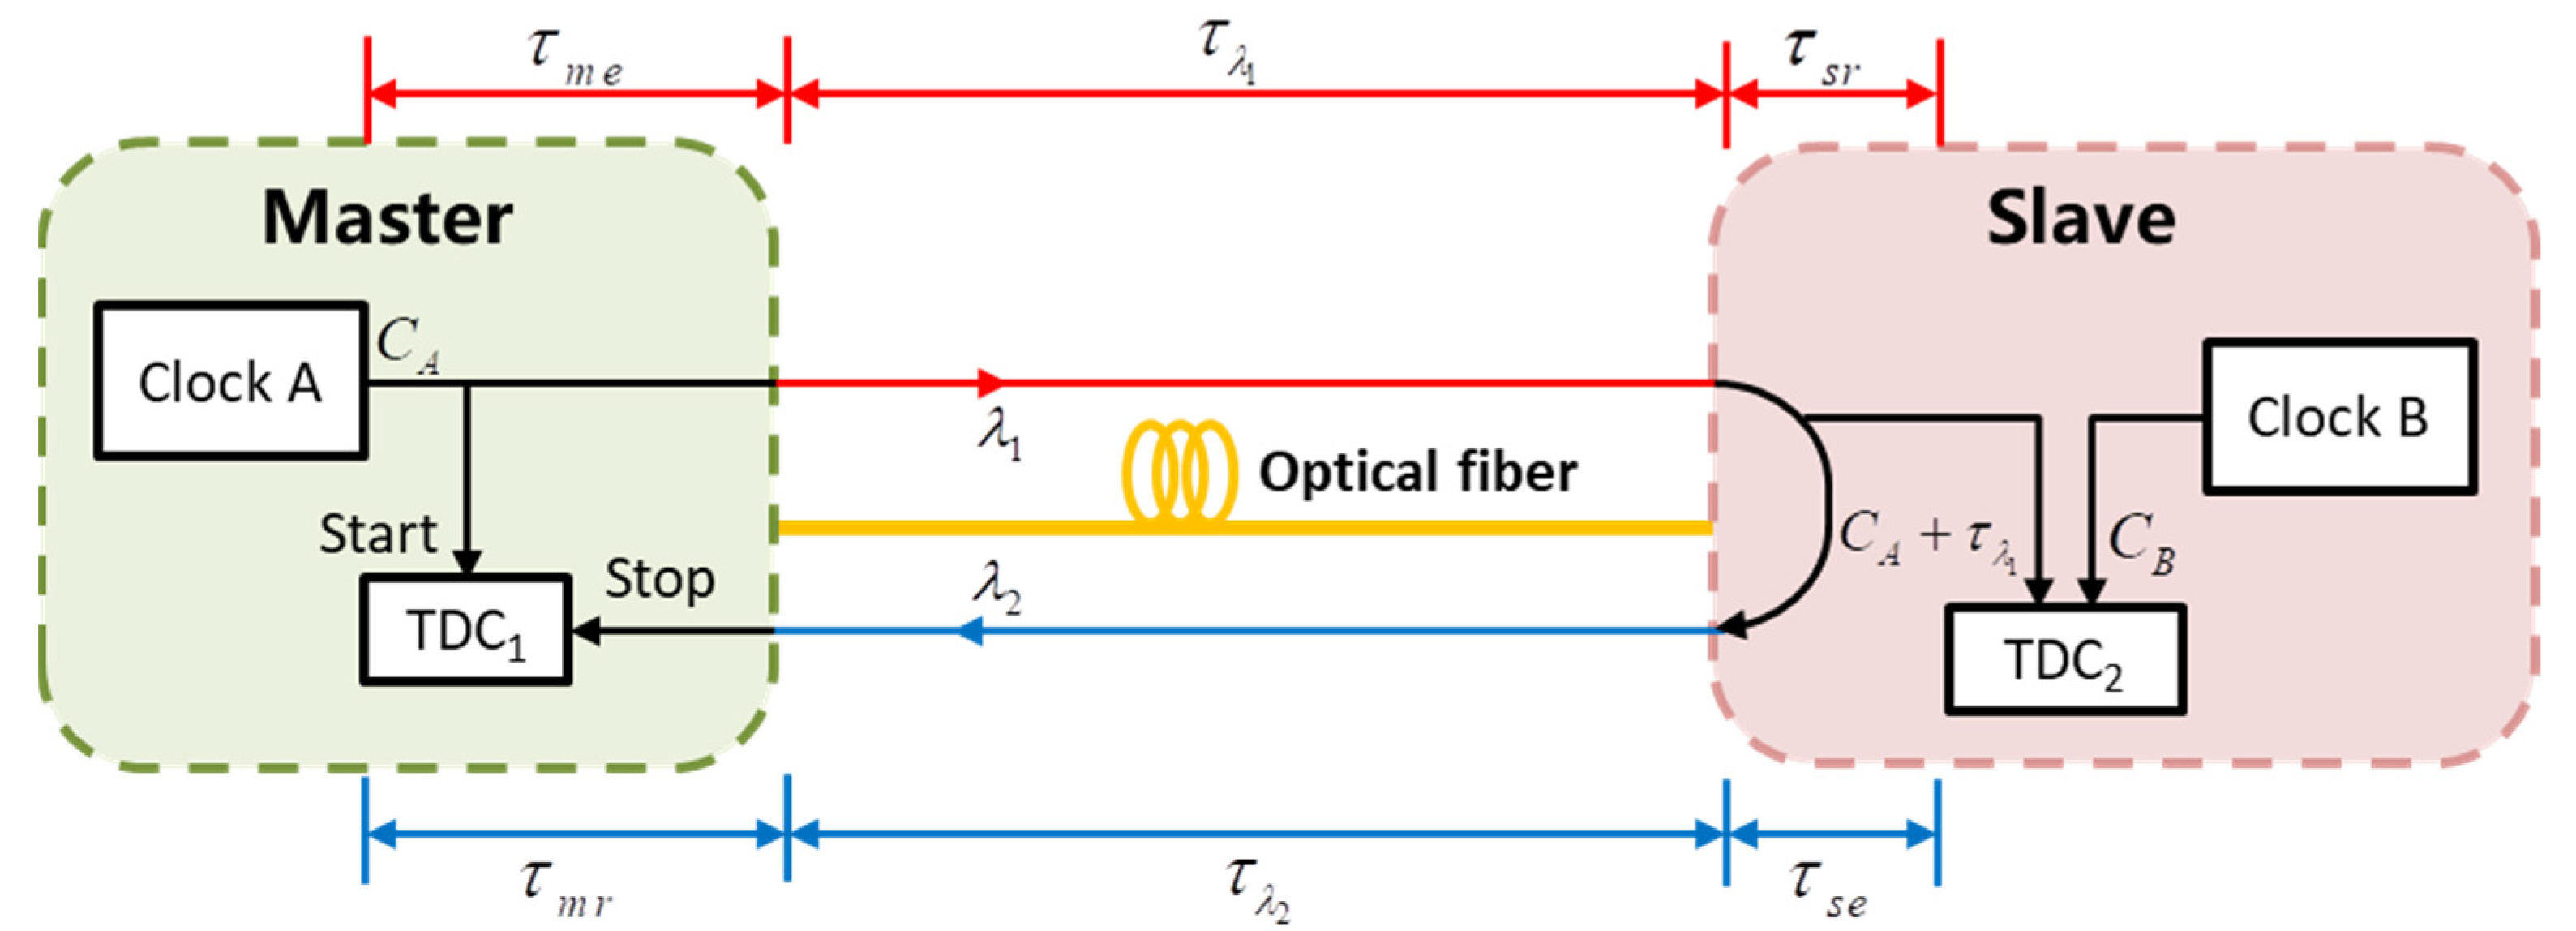
Figure 1. The principle of optical fiber time synchronization system based on round-trip method.
Photonics 09 00293 g001
Figure 2. Flow chart of the time transfer system based on temperature tracking.
Photonics 09 00293 g002
Figure 3. Experimental block diagram of the experimental platform.
Photonics 09 00293 g003
Figure 4. The physical diagram of the experimental platform.
Photonics 09 00293 g004
Figure 5. Round-trip delay after Kalman filtering.
Photonics 09 00293 g005
Figure 6. Temperature of the temperature control box and the estimated temperature of the link.
Photonics 09 00293 g006
Figure 7. Estimated link temperature for 30,000–32,400 s.
Photonics 09 00293 g007
Figure 8. Curves of two round trip ratios.
Photonics 09 00293 g008
Figure 9. Clock difference of two schemes (a) without temperature tracking and (b) with temperature tracking.
Photonics 09 00293 g009
Figure 10. TDEV of two schemes.
Photonics 09 00293 g010
Table 1. Experimental setup parameters.
ParameterValueParameterValue
Optical fiber modelG.652Clock sourceCesium clock-3230B
Fiber length50,692.593 mFiber loss0.187 dB/km
Modulation on λ1 s−1Measurement resolution of TDC100 ps
Wavelength of λ 1 1550.87 nmTemperature control box (TC)CTP404
Wavelength of λ 2 1490.92 nmExperiment duration9 h
Terminal equipment temperature23 °CInitial temperature of TC17 °C
Hardware delay τ h 3.4 nsFinal temperature of TC27 °C
Publisher’s Note: MDPI stays neutral with regard to jurisdictional claims in published maps and institutional affiliations.