Article

A High-Energy and High-Intensity Inverse Compton Scattering Source Based on CompactLight Technology

1
European Organization for Nuclear Research, CH-1211 Geneva, Switzerland
2
Elettra-Sincrotrone Trieste S.C.p.A., 34149 Trieste, Italy
*
Author to whom correspondence should be addressed.
Photonics 2022, 9(5), 308; https://doi.org/10.3390/photonics9050308
Submission received: 28 February 2022 / Revised: 13 April 2022 / Accepted: 23 April 2022 / Published: 30 April 2022
(This article belongs to the Special Issue Advances and Application of Electron Beam Dynamics)

Abstract

:
An inverse Compton scattering source based on the CompactLight injector and capable of producing MeV gamma-rays with a brilliance several orders of magnitude larger than existing sources is proposed. The CompactLight injector can operate at a bunch repetition rate of 1 kHz, with trains of 50 bunches and a bunch spacing of 5 ns, giving a maximum total flux of 8.62   ×   10 11 photons/s. For a normalised emittance of 0.3  mm mrad, an average brilliance of 1.85   ×   10 14 photons/( s mm 2 mrad 2  0.1%BW) could be obtained. A 1 kW colliding laser was considered, corresponding to a laser pulse energy of 50 m J . Given the electron beam energy up to 300 MeV provided by the CompactLight photoinjector, a maximum photon energy of 2 MeV is obtained. Simulations of inverse Compton scattering were performed using the RF-Track particle tracking software. Parametric scans were used to derive the electron and laser spot sizes maximising the total flux. The accelerator optic components were also determined from the final focus design, which was optimised for a micrometer-level electron beam size at the interaction point. Given a maximum total flux in the order of 10 12 photons/s and a maximum output photon energy in the MeV range, the proposed source could be used for various applications, including X-ray imaging.

1. Introduction

The scattering of a low energy photon from a relativistic electron resulting in a high energy X-ray is defined as inverse Compton scattering (ICS). X-ray sources based on ICS can achieve a quasi-monochromatic X-ray beam of tunable energy, similarly to large-scale synchrotrons. The compactness of ICS sources, along with an increased energy tunability, allow for applications such as tomography, crystallography, and cancer therapy. ICS was first described in 1948 by Feenberg and Primakoff [1]. The first ICS sources were proposed in the 1960s [2,3]. Recent developments in high power compact lasers led to a regained interest in ICS for compact light sources [4]. Since the 2000s, the number of existing ICS sources has gradually increased. The first commercially produced source, the Munich Compact Light Source (MuCLS), is currently used for research in medical imaging, such as K-edge subtraction [5] and phase contrast imaging [6]. The Tsinghua Thomson Scattering X-ray source (TTX) in China [7] and ThomX in France [8] rank among larger scale existing sources.
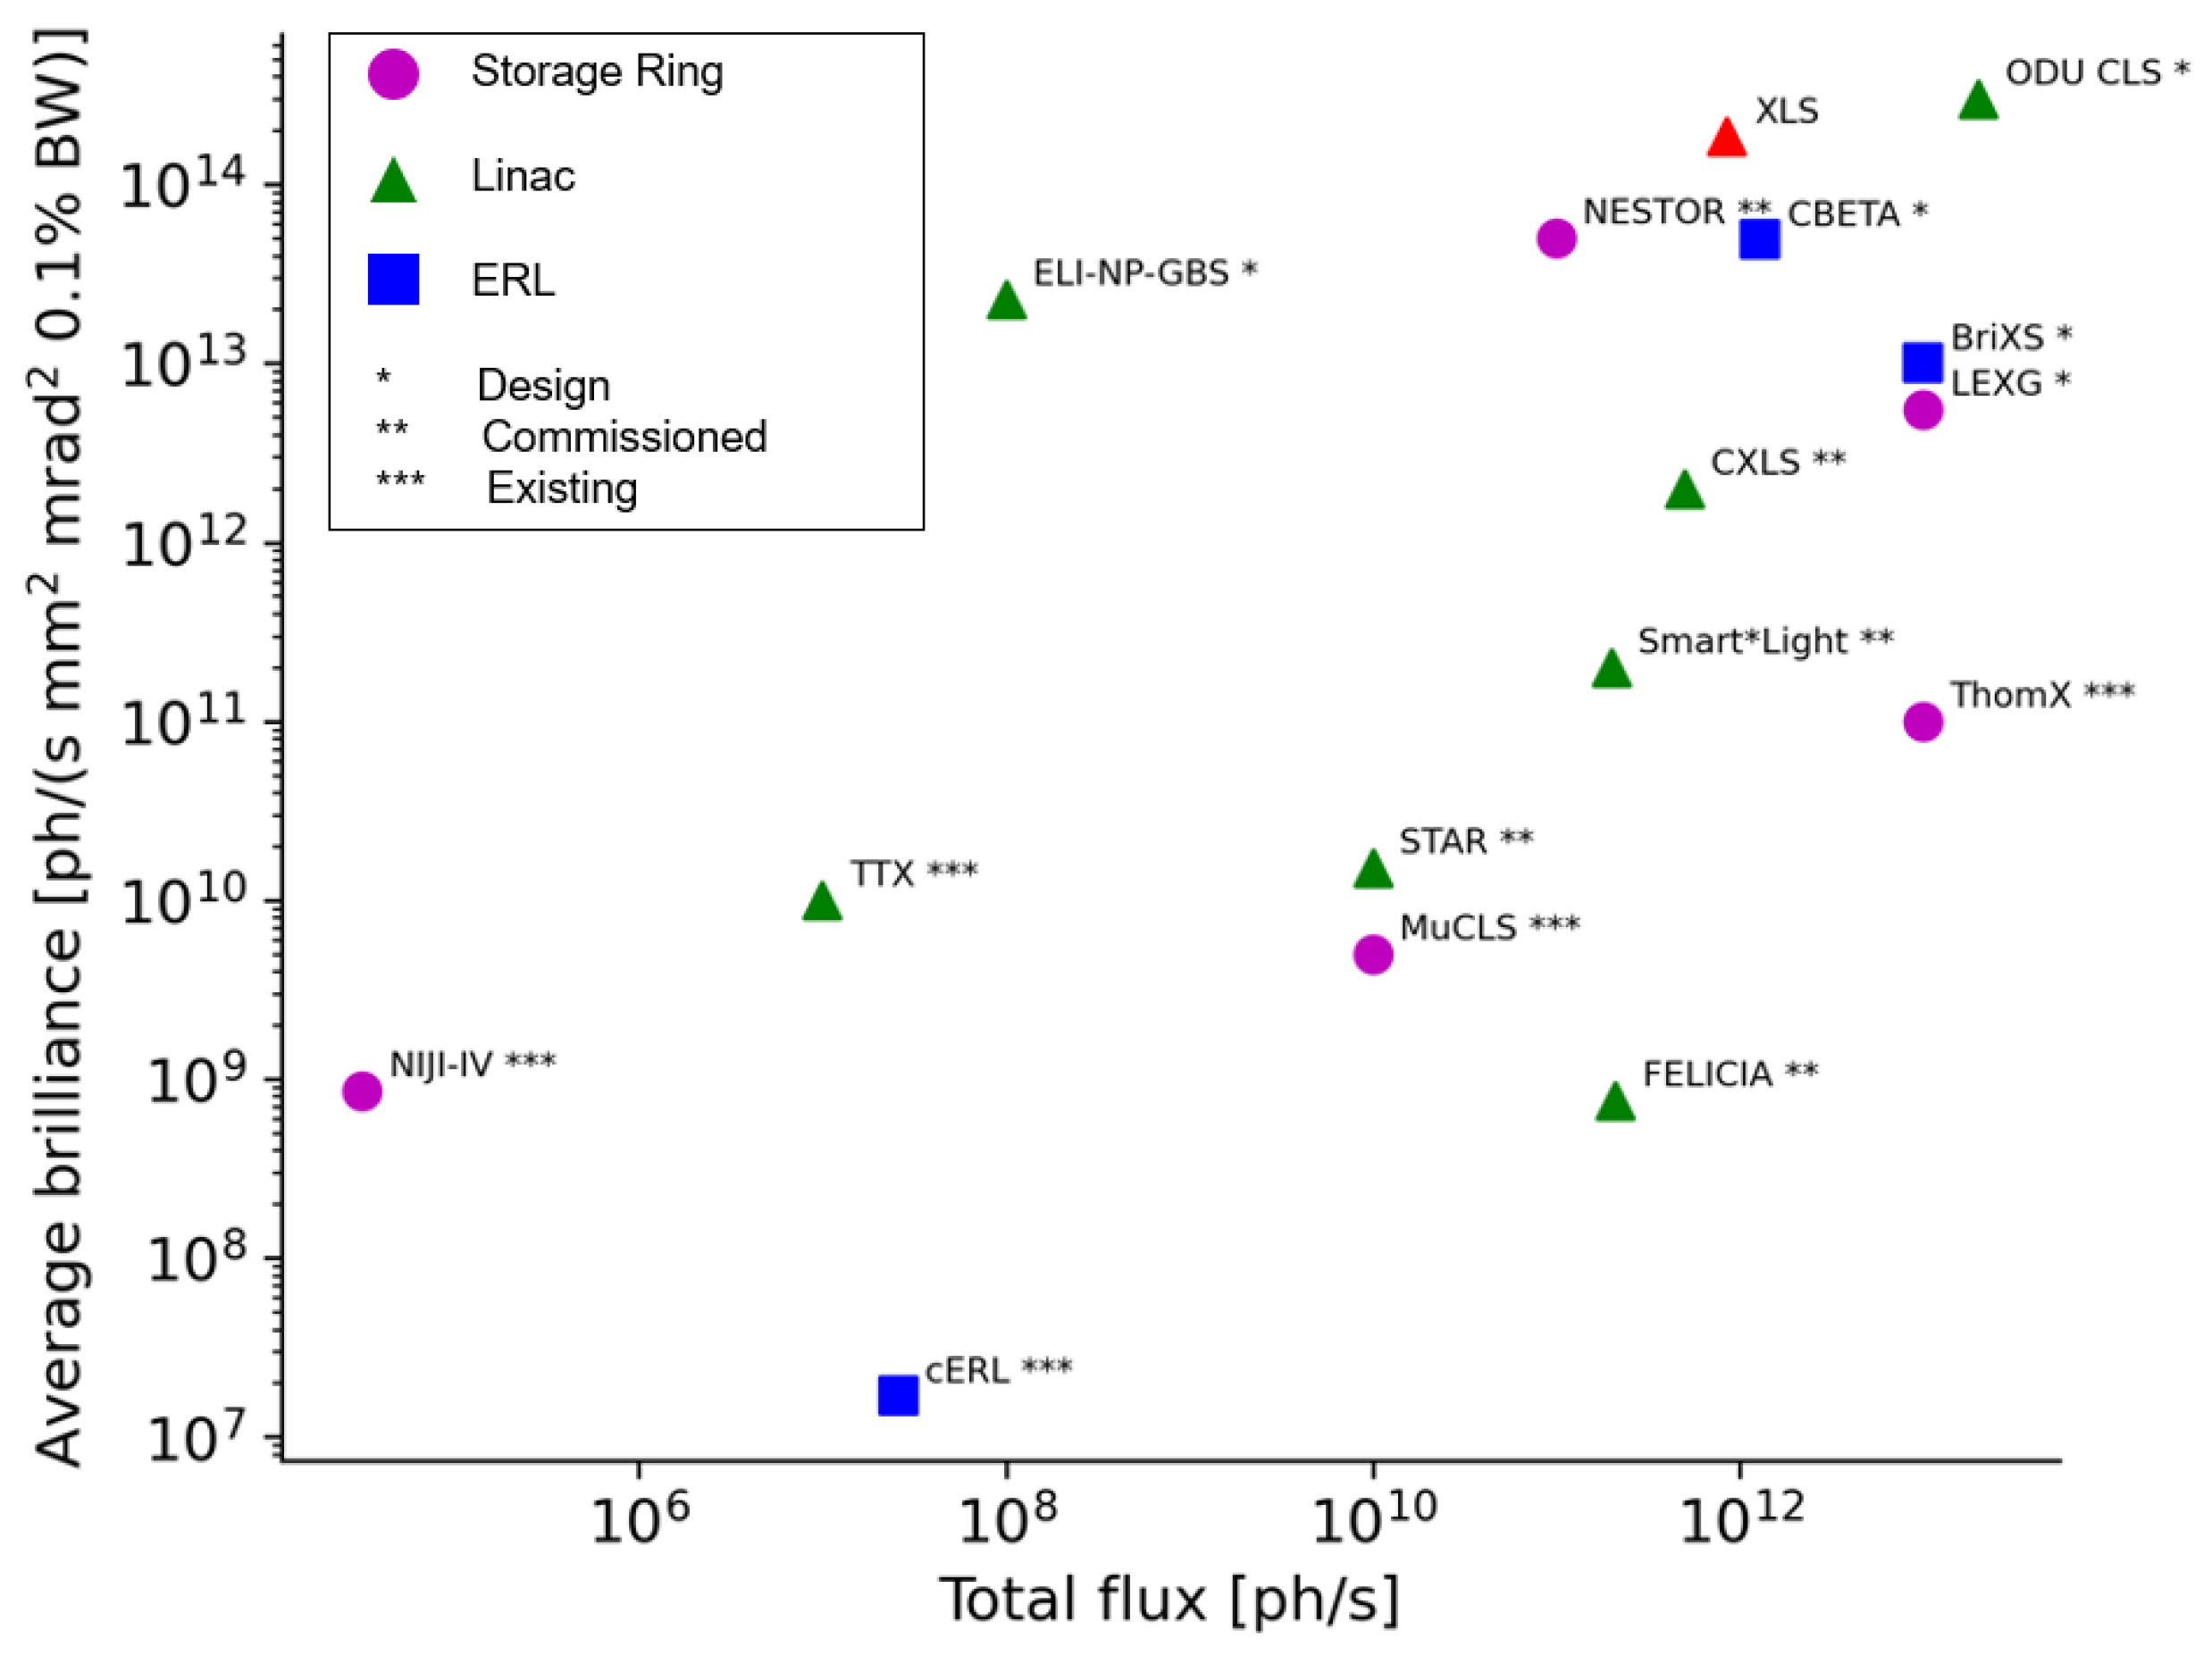
Three main types of ICS sources have been proposed: storage-rings-based (SR), linac-based, and energy-recovery-linac-based (ERL). The first are the most common; notable examples include MuCLS and ThomX. Due to beam recirculation, storage rings can reach high values for flux; however, quantum excitation in the bending magnets limits the minimum emittance, hampering the ICS performance. Linacs have also been considered for compact ICS designs; for instance, TTX in China, BoCXS in Bologna [9], and STAR in Consenza, Italy [10]. Compared to storage rings, linacs feature limited repetition frequency; this is compensated by the lower electron beam emittance and shorter bunches, which are both critical parameters in X-ray production. More recently, energy recovery linacs garnered interest and ERL designs for ICS have been published [11]. However, ERLs require superconducting technology, which is costly and not easily available to hospitals or small laboratories. A summary of flux and brilliance values for various ICS sources is included in Figure 1.
ICS sources can be used for various applications, most originating from studies at synchrotron sources. However, due to limited availability, ICS sources are becoming a popular alternative. Clinical applications, for example, would benefit from treatments at hospitals rather than requiring travel to large scale sources. The main challenge for ICS sources currently is in achieving high intensity and high energy X-rays. Table 1 contains a summary of X-ray parameters required for the presented ICS applications.
Clinical studies have been conducted at the MuCLS for K-edge subtraction (KES) and phase contrast imaging (PCI). KES, first proposed in 1953, involves taking X-ray images at energies slightly below and above the 53 k e V K-edge of a contrast medium. KES has been used to visualise kidney stones [12] and for coronary angiography [5]. This method exploits the tunability and high-energy properties of ICS sources.
In phase contrast imaging, a quasi-spatial coherent radiation illuminates an object, which gives rise to a spatially varying phase shift. As the radiation propagates through the sample, parts of the wavefront interfere, resulting in a characteristic phase contrast pattern. The resulting signal can be visualised if the transverse coherence of the source is sufficiently large and the point source size is small [6]. Studies in dynamic respiratory imaging were conducted at the MuCLS in 2018 [13].
Another relevant clinical application of ICS sources represents cancer therapy. It has been shown that ICS sources such as ThomX are able to reproduce beam parameters from Stereotactic Synchrotron Radiation therapy (SSRT) [14]. In particular, proof of concept studies of microbeam radiation therapy (MRT) have been conducted at MuCLS, which indicated MRT’s ability to slow down tumour growth rate, despite a much lower dose than the one used in SSRT studies [15]. To optimise MRT, the photon flux and peak-to-valley-dose ratio should be maximised, and a typical X-ray energy of 100–300 keV should be used [16].
FLASH radiotherapy (FLASH-RT) is a novel cancer therapy method which could be adapted for ICS sources. It applies high intensity doses in a much smaller timeframe than conventional radiotherapy (CONV-RT), typically 100 Gy / s 1 compared with 1 Gy / s 1 in CONV-RT [17]. Successful experiments have been performed at the ESRF with 102 keV photons, where the authors recommended that future studies be conducted at high intensity ICS sources [18].
Protein crystallography has also been considered as a potential application of ICS sources. Studies at Lyncean Technologies’ CLS have shown that X-ray diffraction from ICS can be used to determine the structure of protein crystals [19]. X-ray diffraction is also used in the pharmaceutical industry to determine the crystal structure of drug substances [20].
ICS X-ray tomographies could be adapted for cultural heritage studies. ThomX would be able to generate X-rays for such imaging [21]. X-ray fluorescence (XRF), a potential analysis method, was used to discover a hidden Van Gogh painting [22]. In particular, high intensity X-rays allow for decimeter-sized areas to be scanned.
High intensity megavoltage X-rays could be used in nuclear resonance fluorescence. There have been proposals of nondestructive assay systems for radioactive nuclides which would require an ICS source [23]. This process would be nondestructive and applicable to difficult-to-measure or stable nuclides.
The ICS source proposed in this paper is based on the CompactLight (XLS) injector, operating at a 1 k Hz repetition rate and accelerating electrons up to 300 M e V within 15 m of length. CompactLight is a design study funded by the European Union under the Horizon 2020 programme, which brought together the world’s leading experts in the field of compact acceleration and undulator technology, united to make X-ray FEL facilities more affordable, compact, power-efficient, and better performing [25]. XLS used an optimal combination of emerging and innovative accelerator and undulator technologies to create a compact hard X-ray FEL, approximately 2 / 3 the size of SwissFEL [26].

2. Theory

The energy of ICS-generated photons, E X , depends on the relativistic factor, γ , the photon energy of the laser, E laser , the angle between the electron and laser beam ϕ , and the scattering angle between the generated photon beam and the electron beam θ . Assuming ultra-relativistic electrons and a laser photon energy much smaller than the electron rest mass [27],
E X = 2 γ 2 E laser 1 + cos ϕ 1 + γ 2 θ 2 .
The maximum X-ray energy of 4 γ 2 E laser is obtained in head-on collisions, where ϕ 0 . The geometry of the IP interaction is shown in Figure 2.
Assuming round Gaussian transverse intensity distributions for both electron and laser beams, the total number of photons, N γ , generated by ICS depends on the crossing angle, ϕ , the number of electrons in the bunch, N e , and the number of laser photons in the pulse, N laser ,
N γ = σ c N e N laser cos ( ϕ / 2 ) 2 π σ γ , y σ γ , x 2 cos 2 ( ϕ / 2 ) + σ γ , z 2 sin 2 ( ϕ / 2 ) ,
where σ γ , i , with i = x , y , z , is the source spot size, a convolution of the electron σ i and laser σ laser beam size in each direction at the interaction point (IP) [28,29].
The Compton scattering cross section is represented by σ c . Given typical lasers of 1064 nm wavelength, the approximation σ c σ T can be used, where σ T 0.665 barns is the Thomson cross section.
An important parameter of Gaussian laser beams is the Rayleigh length, z R ; the distance between the beam waist and the location where the beam area is doubled,
z R = π w 0 2 λ M 2 ,
where w 0 is the beam waist size, M 2 is the laser beam quality factor, and λ is the laser wavelength.
The number of scattered photons per second, or flux, can be derived by taking the time derivative of N γ . In sources with a high repetition rate, f, the average flux is:
N . γ = N γ f .
Assuming head-on collisions through a small collection angle and negligible recoil, the bandwidth of a scattered photon beam can be expressed as:
σ E γ E γ = σ E θ E θ 2 + 2 σ E e E e 2 + σ E laser E laser 2 + σ E ϵ E ϵ 2 ,
where σ E θ / E θ is the contribution from the collection angle θ , σ E e / E e and σ E laser / E laser are the relative energy spreads of the electron and laser, and σ E ϵ / E ϵ is the contribution due to the electron beam transverse emittance ϵ x , y [30]. Typically, the largest contribution to the relative bandwidth is given by the collection angle θ and electron beam energy E e .
The integral of the photon energies in a 0.1% bandwidth at the Compton edge is a factor 1.5 × 10 3 smaller than the integral of the full energy spectrum, as derived in [31] for a single electron in the linear Thomson-backscatter limit. The flux within a 0.1% bandwidth is defined as F = 1.5 × 10 3 N . γ .
The spectral brilliance ( B ) is the density of photons in the six-dimensional space containing the beam [31],
B = F 4 π 2 σ γ , x σ γ , x σ γ , y σ γ , y ,
where σ γ , i is the beam divergence. B is measured in ph/( s mm 2 mrad 2  0.1%BW). In a non-diffraction limited beam, where σ γ , x ϵ x / β x ,
B = F 4 π 2 σ γ , x ϵ x / β x σ γ , y ϵ y / β y .
Compact sources further benefit from the approximation, σ γ , x σ x = β x ϵ x , where β x , y is a Twiss parameter. B can then be expressed only in terms of photon flux, electron beam energy, and normalised transverse emittance of the electron beam ϵ x , y N ,
B γ 2 F 4 π 2 ϵ x N ϵ y N .
The peak brilliance ( B ^ ) is defined as the normalisation of B with respect to the rms duration of scattered X-rays σ t [32],
B ^ = 1 2 π B f σ t .
Usually, ICS takes place in a high-finesse Fabry–Pérot cavity (FPC) [33]. The FPC, which typically consists of two perfectly aligned high-reflectivity mirrors, stores laser photons matching resonance conditions. If an incident laser’s wavefront matches the circulating laser’s, the former is transmitted to the cavity, resulting in a high power laser stored in the cavity. The cavity frequency was determined from the electron bunch spacing, from which the round-trip length L RT was derived using:
L RT = n × c f rep ,
where n is the integer (sub)harmonic and f rep is the cavity frequency. Given a two-mirror cavity, the minimum acceptable crossing angle is:
ϕ = 1 / γ + Φ / d ,
where Φ is the mirror diameters, and d is the distance between the two mirrors [34].

3. Machine Description

A modified CompactLight injector was considered as a driver for the ICS source. The CompactLight injector consists of an RF C-band photoinjector with a copper cathode, followed by a travelling-wave C-band linac capable of operating at a 1 k Hz repetition rate [26]. A maximum energy of 300 MeV can therefore be reached in less than 15 m from the cathode. Figure 3, which was taken from the XLS CDR, shows a 3-D schematics of the CompactLight electron gun. Since most applications of ICS X-rays require electron beam energies typically below 100 MeV, one could consider using even a shorter linac for maximum compactness. A summary of the XLS injector parameters is presented in Table 2.
The CompactLight injector is optimised to deliver a two-bunch beam train with 75 p C bunch charge and normalised emittance as low as 0.15 mm mrad . Such a two-bunch beam structure is ideal for driving a Free Electron Laser. However, it provides an insufficient average current to make a CompactLight-based ICS competitive to existing designs. To increase the average current, we raised the number of bunches per train from 2 to 50, with a bunch spacing of 5 n s , and brought the single-bunch charge from 75 to 200 pC. Due to the larger charge extracted from the cathode, we evaluated that the normalised emittance would increase from 0.15 to 0.3 mm mrad, following the dependence of ϵ N [ μ m rad ] Q [ nC ] 2 / 3 described in [35].
After the linac exit, the electrons travel through a short “final focus” section to match the electrons from the linac to the laser, using a set of quadrupoles to obtain the minimum spot size at the IP. A sufficient distance from the final quadrupole to the IP was considered to allow for the inclusion of the FPC. The electron beam enters the FPC plane with a crossing angle ϕ , passing near the concave mirrors, which focus the beam waist at the IP. This crossing angle was optimised to prevent collisions of the electron beam with the cavity mirrors. As the majority of the scattered photons travel in the direction of the electron beam, a dipole bending magnet is required to deflect the electrons to a beam dump.
To obtain a large pulse energy and maximise flux, TRUMPF’s 1 kW Dira 1000 [36] was considered. The Dira 1000 is a state-of-the-art, high-power compact laser with a pulse length of 0.6   p s and a wavelength of 1 μ m . To ensure cavity stability and achieve a micrometer-size beam waist at the interaction point, a four-mirror bow-tie FPC was considered [33,37]. The cavity geometry and laser spot sizes required to maximise flux were obtained using the method described in [34]. A sketch of the FPC cavity, including the electron beam and the interaction point, is shown in Figure 4.

4. Method

The presented results were obtained using a novel particle tracking code; RF-Track [38]. Standard Monte Carlo programs used for ICS simulations include CAIN [39] and COMPTON [40]. The latter has been benchmarked against experimental results from various ICS sources [41].
RF-Track is a fast and parallel particle tracking code developed at CERN to simulate beam tracking in the presence of collective effects, such as space-charge and wakefields, in field maps as well as in conventional matrix-based elements. Recently, the possibility to simulate the ICS process was added. RF-Track simulates ICS using a Monte Carlo method where the electron-photon interaction is computed taking into account the scattering differential cross section. RF-Track uses the Thomson cross section at low photon energies, or the nonlinear Klein–Nishina cross section at high photon energies [42,43], to compute the parameters of the scattered photon as well as the electron recoil. The effects of linear laser polarization are taken into account in both cases. All computations are performed in the electron’s rest frame, through full 4-D Lorentz boosts from and to the laboratory frame. RF-Track allows the user to describe the laser beam using a set of realistic parameters: Gaussian vs uniform profile, polarization, the M 2 parameter (or alternatively the Rayleigh length), and the laser orientation in the 3-D space.
RF-Track also allows the user to select the minimum number of scattered photons generated per each integration step. Given the small value of the Compton scattering cross section, this feature allows the user to generate arbitrarily large photon statistics, even for a low number of electron macro-particles. This particular feature makes the simulation of ICS in RF-Track orders of magnitude faster than similar codes.
A benchmark of RF-Track was performed against data in the literature and against CAIN directly. The flux and brilliance of four ICS sources were computed in RF-Track, and compared with values referenced in articles: CXLS [44], CBETA [45], ThomX [8] and ODU CLS [29]. This allowed for the study of several ICS designs on the RF-Track output. ODU CLS is a superconducting linac design, reaching the highest flux and brilliance known for any ICS source. CXLS is a linac based source similar in design to XLS and under commissioning at Arizona State University. ThomX is a storage ring source operating in Orsay. CBETA is an ERL design from Cornell with a focus on high energy X-rays. Regarding the simulation codes used to derive properties of the output photon beam, ThomX used CAIN, ODU CLS used a program developed by Erik Johnson [46], CXLS used COMPTON, and CBETA used both ICARUS [47] and ICCS3D [48]. Equations (4), (7) and (8) were used to compute the flux and average brilliance of the X-ray photon beam obtained from the simulation. Since RF-Track uses a Monte Carlo approach, the standard deviation of the results was computed from several runs of the code. Two set-ups of ODU CLS were considered, σ laser = 3.2   μ m , 12   μ m . From Equation (3), the first beam size corresponded to a low z R value, and was therefore used to perform a qualitative test on the accuracy of RF-Track. Further benchmarks focused on comparing the performance of RF-Track against CAIN. This also included a study of the total flux results for ThomX [49], and a reproduction of photon spectra of the cERL source [11].
From Equation (2), it emerges that the X-ray flux is directly proportional to the laser pulse energy, the repetition rate, and the bunch charge. However, the relation of the electron and laser spot sizes on the total flux is nontrivial and required a study of the parametric scans of flux in a 1.5   m rad cone, N . γ , 1.5 mrad . Typically, applications require bandwidths under 5% and flux in a 1–2 mrad cone [14]. From Equation (5), an electron beam energy of 300 MeV could lead to a bandwidth larger than the limits set by typical applications. Therefore, to study the increase of bandwidth with beam energy, the parametric scans were performed for E e = 100   M e V and E e = 300   M e V .
Due to the small ICS cross section of 0.665 barns, a high-power laser and micrometer electron and spot sizes are required to generate sufficient flux for most applications. The output X-ray parameters are therefore very sensitive to misalignments of the electron and laser beam. In practice, misalignments are caused by vibrations, temporal thermal gradients, which are able to change the RF phases of the linac, or thermally induced stress in optics, from the proximity of the optical set-up to strong magnets [50]. To account for these effects, the decrease in N . γ , 1.5 mrad due to laser beam offsets was investigated for the XLS-based source. Position offsets in the horizontal, vertical, and longitudinal direction were computed in RF-Track, along with yaw and pitch offsets. Offset scans from RF-Track were benchmarked against scans obtained from CAIN. Offset ranges corresponding to a 5% loss of flux were determined by taking the mean and standard deviation from polynomial fits of the offset plots for several runs.
A preliminary design of the final focus, that is, the matching section between linac and the IP, was performed to obtain a realistic estimate of the beam parameters at the scattering point, given E e = 100   M e V . In particular, beam tracking through four thick quadrupoles allowed for the derivation of the electron IP beam size including chromatic effects. The optimisation was performed using the Simplex algorithm [51], with a merit function which minimised the beam size and beam divergence at the IP, while maintaining the beam size at the location of each quadrupole reasonably small. The Twiss parameters β and α at the entrance of the final focus were chosen as degrees of freedom, along with the distance between quadrupoles and their strengths. The optics functions at the entrance of the final focus were constrained to values obtainable at the linac exit.

5. Results

The benchmark of RF-Track is detailed in Section 5.1, followed by the FPC geometry optimisation in Section 5.2. RF-Track simulations of the XLS-based ICS source are detailed in Section 5.3, where parametric scans of electron and laser beam sizes are described. Section 5.4 shows offset scans and Section 5.5 presents the final focus optimisation.

5.1. Code Benchmark

The comparison between referenced and simulated results is displayed in Figure 5. It was found that RF-Track can accurately predict the flux and brilliance of ICS sources, including for set-ups with low z R , such as the σ laser = 3.2   μ m configuration of ODU CLS.
Figure 6 displays a comparison of plots obtained in RF-Track and in CAIN for the ThomX source [49]. Both codes derived the expected Compton edge of 45 keV. The X-ray beam size obtained in RF-Track, σ x / σ y = 18   μ m / 40   μ m , and beam divergence, 4   m rad , also correspond to results from CAIN. The majority of photons were concentrated in a cone of 2 m rad opening angle, as shown in Figure 6d. Results indicate that RF-Track is able to reproduce the properties of scattered photons from simulations performed in CAIN.
The benchmark of RF-Track against CAIN also allowed for a comparison of the codes’ performances, summarised in Table 3. RF-Track computed the results from Figure 6 several orders of magnitude faster than CAIN. The difference in speed was due to RF-Track’s feature to set the minimum number of scattered photon macro-particles per integration step, which effectively enhances the scattering cross section. CAIN required 5 × 10³ times more macro-electrons to generate photon macro-particles with sufficient statistics. The theoretical flux is noticeably closer to the value from RF-Track, rather than CAIN. The difference might be due to CAIN handling more detailed models of beam polarization than RF-Track, which only considers linear polarization of the photon beam. Also, CAIN implements models of photon-photon interaction. These effects should be relevant at higher photon energies.
Another benchmark was the reproduction of cERL photon spectra made in CAIN [11]. The results, displayed in Figure 7, indicate that RF-Track is able to reproduce characteristics such as amplitude and bandwidth of photon spectra at various collection angles, ranging from 1 m rad to the full angle spectrum.

5.2. Set-Up of the Laser Cavity

Given a bunch repetition rate of 1 kHz, a pulse energy per train of 1 J can be obtained from the available laser power. XLS can provide 50 bunches per pulse, therefore a 20 mJ pulse energy would be available per bunch. The bunch spacing of 5 n s would require a 200 MHz enhancement cavity to sustain the pulse energy across the bunch train.
Enhancement cavities can be operated in continuous wave (CW) or burst mode. A CW cavity was chosen for XLS, due to the large bunch spacing of 5 n s . In CW, given a 1 kW laser power and a 200 MHz cavity, a laser pulse energy of 5 μ J would be obtained. To match the ’no cavity’ intensity, an enhancement factor of 4 × 10 3 would be required. Recent developments show that factors up to 10 5 10 6 are achievable [52]. However, due to safety considerations, the enhancement factor was increased only up to 10 4 . This resulted in a final pulse energy of 50 mJ.
A round-trip length of 0.75   m was required for the second harmonic n = 2 . A summary of the FPC parameters is included in Table 4. The laser beam size at the IP of σ laser , x / σ laser , y = 4.71 / 4.71   μ m was obtained from the FPC geometry optimisation. To achieve a micrometer beam size, a curvature radius of the M3 and M4 mirrors of 13 c m was required. Given a mirror diameter of 0.5   c m , a minimum ϕ = 2 is required for the laser-beam interaction.

5.3. Parametric Scans

The benchmark showed that RF-Track can be used as a substitute for other ICS simulation codes, such as CAIN. The parametric scan of the laser wavelength against the electron beam energy from Figure 8 confirms the larger photon energy achievable by the XLS-based source, up to 2 MeV. Furthermore, Figure 8 shows the square dependence of the scattered photon energy on the electron beam energy and linear dependence of the scattered photon energy on the laser photon energy, evidenced in Equation (1).
Scans of bandwidth and flux in a 1.5   m rad cone were computed in Figure 9 for the XLS-based source. The obtained bandwidth maps showed a decrease of up to 4% for a lower electron beam energy of 100 MeV, and an electron beam size larger than 4 μ m .
The laser and electron spot size parametric scans revealed that to maximise N . γ , 1.5 mrad , an electron spot size at the IP of 2– 4 μ m and a laser spot size at the IP of 3– 6 μ m are required. The laser beam size obtained from the FPC optimisation corresponds to the 3–6 μ m range. The relevant laser, electron and output photon beam parameters are summarised in Table 5. The electron beam energy is dependent on N . γ , 1.5 mrad , and not the total flux, since the bandwidth of the 1.5   m rad cone changes with E e , from Equation (5).

5.4. Offset Scans

A benchmark of the offset scans computed in RF-Track with scans in CAIN was performed. A comparison of horizontal offset scans of ThomX obtained from RF-Track and CAIN is shown in Figure 10. The transverse offset scan computed in RF-Track corresponded to its equivalent in CAIN. The angle offsets in CAIN, however, had noticeably larger flux values for offsets over 0.5   rad . This difference might be due to small-angle approximations in CAIN, common in simulation codes; whereas RF-Track uses exact angles.
The results of the offset scans are summarised in Table 6. Figure 11 shows N . γ , 1.5 mrad , normalised by the maximum value, as a function of the beam offset. The horizontal and vertical offset limits are symmetrical with respect to the no-offset value. The arrival time offset shows a notable exception. The electron bunch length of 1 ps limited the shift in z to a region of −0.5–0.5 ps. Note that the XLS-based source is more sensitive to vertical rather than horizontal misalignments.
Plots of the yaw offset included an asymmetry, with peak in flux corresponding to the crossing angle of 2 . When the yaw equaled the crossing angle, the electron and laser beam formed a head-on collision, which corresponded to the maximum achievable flux.

5.5. Optimisation of the Final Focus Section

From Figure 9, an electron beam size of 2–4 μ m was required to maximise flux. A design consisting of four quadrupoles 0.2   m long proved sufficient to reach the minimum spot size. The results from the final focus optimisation are summarised in Table 7. The tracking of the optics functions across the distance of the final focus is presented in Figure 12. The simulations indicate that the optics functions do not reach critical values in the final focus. The emittance increased at the IP with respect to its value at the linac exit due to chromatic effects from the quadrupoles in the final focus. The total length of the final focus was minimised to 2.65   m , with a distance from the last quadrupole to the IP of 0.68   m . Following the optimisation of the FPC geometry and of the final focus, flux and brilliance values corresponding to the most advanced ICS designs were obtained.
The X-ray beam properties at the IP for E e = 100   M e V are included in Figure 13. The photon spectra confirm the effects of a high electron beam energy on bandwidth, as observed in the 5 m rad spectrum.

6. Discussion

The simulation results from RF-Track indicated that an ICS source based on a CompactLight-like photoinjector and capable of reaching the quoted laser and electron beam parameters at the IP would be able to generate photons with an average brilliance orders of magnitude larger than any existing source. Due to the high power supplied by the injector, MeV gamma-rays could be generated, resulting in a high energy and high intensity ICS source useful for various applications, i.e., tomographies and protein crystallography.
The benchmark of RF-Track against CAIN revealed its potential use for ICS simulations. Furthermore, the faster run time of RF-Track could make it a popular alternative to current ICS simulation software. RF-Track could also be used for other computations than ICS, including the beamline design, with the implementation of quadrupole and dipole effects.
The baseline parameters of the XLS injector were optimised to maximise flux. To achieve this, the number of bunches per train was increased from 10 to 50, and the bunch charge was increased from 75 p C to 200 p C . The shift to a larger bunch charge and number of bunches per train is known to cause beam loading and beam break-up [53]. Previous studies have experimentally demonstrated, however, that even for X-band technology, long-range wakefields can be significantly minimised through damping of high-order modes, and beam break-up avoided [54]. Given that the presented ICS source is based on a C-band photoinjector and a travelling wave C-band linac, the risk of beam break-up becomes much less significant.
Using RF-Track, parametric scans were computed to derive the electron and laser spot sizes corresponding to the maximum flux in a 1.5   m rad cone. Potential applications could be identified by comparing the XLS source parameters with the values quoted in Table 1. FLASH-RT and nuclear resonance fluorescence require high intensity MeV gamma-rays of flux in the order of 10 13 ph/s [18,23], a value at least 10 times larger than the total flux achieved by XLS. However, tomographies typically require a photon flux of 10 12 ph/s, while higher X-ray energies would allow for the visualisation of tissue at greater depths [55].
A limitation revealed by the parametric scans was the increase in bandwidth with photon energy, which exceeded values typically required by applications. Therefore, at high electron beam energies, collimators would need to be included, similar to a design proposed for ELI-NP-GBS [56], which cut the photon beam and limited the flux. Photon energies of up to 2 MeV would require the use of modular collimators, comprising 12 tungsten dual slits, each with a relative rotation of 30 .
To estimate the potential loss in flux caused by the laser beam displacement, offset scans were computed in RF-Track. The full interaction plane was considered, therefore both position and angle offsets were determined. The results from Table 6 indicate that a 5% loss in flux would correspond to a position offset of a few μ m , or an angle offset of tens of mrad .
A study of the accelerator optics and FPC cavity geometry was required to obtain the minimum possible electron and laser spot size. It was found that with four quadrupoles in the final focus, an electron beam size of σ x , y = 5.56 / 12.34   μ m could be obtained. The optimisation of the FPC revealed that a laser spot size of 5 μ m could be obtained for a round trip length of 0.75   m . From the final focus optimisation, the distance from the last quadrupole to the IP of 0.68   m was derived, which is sufficient given the obtained FPC geometry. A summary of the achievable electron and laser beam parameters is included in Table 8. The targeted source sizes can be reached from the final focus and FPC design.
Further studies of the XLS-based ICS source will focus on developing a start-to-end simulation. This would address the impact of imperfection, tolerance, and wakefield effects.

7. Conclusions

The preliminary parameters of an ICS source based on a CompactLight-like photoinjector are presented. Photon energies up to 2 MeV could be obtained, given electron beam energies up to 300 MeV delivered by the photoinjector. Using a Dira 1000-like laser would allow for X-ray photons with an average brilliance of 1.85   ×   10 14 ph/( s mm 2 mrad 2 0.1 % BW ) . The novel ICS source was simulated using RF-Track, which required a benchmark against CAIN, a popular particle tracking software used in ICS. Parametric scans revealed that, to maximise the photon flux required for applications, micrometer size electron and laser spot sizes would need to be achieved. By optimising a Fabry–Pérot cavity and the final focus structure, it was found that small beam sizes can be reached by the XLS-based source. Applications such as tomographies, protein crystallography and cancer therapy could greatly benefit from the high energy and high intensity photon beams generated by the XLS-based source.

Author Contributions

Conceptualization, V.M., A.L.; methodology, V.M.; software, V.M., A.L.; validation, V.M.; formal analysis, V.M.; investigation, V.M.; resources, A.L.; data curation, V.M.; writing—original draft preparation, V.M.; writing—review and editing, V.M., A.L.; visualization, V.M.; supervision, A.L.; project administration, G.D.; funding acquisition, A.L., G.D. All authors have read and agreed to the published version of the manuscript.

Funding

This project has received funding from the European Union’s Horizon2020 research and innovation programme under grant agreement No 777431.

Institutional Review Board Statement

Not applicable.

Informed Consent Statement

Not applicable.

Data Availability Statement

The data presented in this study are available on request from the corresponding author.

Acknowledgments

We would like to thank David Alesini, Steffen Doebert, and Roberto Corsini for discussions on the parameters for the CompactLight injector, Eduardo Granados and Aurélien Martens for discussions on the laser system, and Alessandro Variola and Illya Drebot for help in setting-up and running the CAIN simulations.

Conflicts of Interest

The authors declare no conflict of interest.

References

  1. Feenberg, E.; Primakoff, H. Interaction of Cosmic-Ray Primaries with Sunlight and Starlight. Phys. Rev. 1948, 73, 449–469. [Google Scholar] [CrossRef]
  2. Milburn, R.H. Electron Scattering by an Intense Polarized Photon Field. Phys. Rev. Lett. 1963, 10, 75–77. [Google Scholar] [CrossRef] [Green Version]
  3. Arutyunian, F.; Tumanian, V. The Compton effect on relativistic electrons and the possibility of obtaining high energy beams. Phys. Lett. 1963, 4, 176–178. [Google Scholar] [CrossRef]
  4. Hecht, J. Short history of laser development. Appl. Opt. 2010, 49, F99–F122. [Google Scholar] [CrossRef] [PubMed]
  5. Kulpe, S.; Dierolf, M.; Braig, E.; Günther, B.; Achterhold, K.; Gleich, B.; Herzen, J.; Rummeny, E.; Pfeiffer, F.; Pfeiffer, D. K-edge subtraction imaging for coronary angiography with a compact synchrotron X-ray source. PLoS ONE 2018, 13, e0208446. [Google Scholar] [CrossRef] [PubMed] [Green Version]
  6. Gradl, R.; Dierolf, M.; Hehn, L.; Günther, B.; Yildirim, A.Ö.; Gleich, B.; Achterhold, K.; Pfeiffer, F.; Morgan, K.S. Propagation-based Phase-Contrast X-ray Imaging at a Compact Light Source. Sci. Rep. 2017, 7, 4908. [Google Scholar] [CrossRef]
  7. Du, Y.; Yan, L.; Hua, J.; Du, Q.; Zhang, Z.; Li, R.; Qian, H.; Huang, W.; Chen, H.; Tang, C. Generation of first hard X-ray pulse at Tsinghua Thomson Scattering X-ray Source. Rev. Sci. Instrum. 2013, 84, 053301. [Google Scholar] [CrossRef]
  8. Dupraz, K.; Alkadi, M.; Alves, M.; Amoudry, L.; Auguste, D.; Babigeon, J.L.; Baltazar, M.; Benoit, A.; Bonis, J.; Bonenfant, J.; et al. The ThomX ICS source. Phys. Open 2020, 5, 100051. [Google Scholar] [CrossRef]
  9. Bazzani, A.; Cardarelli, P.; Paternò, G.; Placidi, M.; Taibi, A.; Turchetti, G. BoCXS: A compact multidisciplinary X-ray source. Phys. Open 2020, 5, 100036. [Google Scholar] [CrossRef]
  10. Faillace, L.; Agostino, R.G.; Bacci, A.; Barberi, R.; Bosotti, A.; Broggi, F.; Cardarelli, P.; Cialdi, S.; Drebot, I.; Formoso, V.; et al. Status of compact inverse Compton sources in Italy: BriXS and STAR. In Proceedings of the SPIE Optics + Photonics 2019, San Diego, CA, USA, 11–15 August 2019. [Google Scholar] [CrossRef]
  11. Akagi, T.; Kosuge, A.; Araki, S.; Hajima, R.; Honda, Y.; Miyajima, T.; Mori, M.; Nagai, R.; Nakamura, N.; Shimada, M.; et al. Narrow-band photon beam via laser Compton scattering in an energy recovery linac. Phys. Rev. Accel. Beams 2016, 19, 114701. [Google Scholar] [CrossRef] [Green Version]
  12. Kulpe, S.; Dierolf, M.; Günther, B.; Busse, M.; Achterhold, K.; Gleich, B.; Herzen, J.; Rummeny, E.; Pfeiffer, F.; Pfeiffer, D. K-edge Subtraction Computed Tomography with a Compact Synchrotron X-ray Source. Sci. Rep. 2019, 9, 13332. [Google Scholar] [CrossRef] [PubMed] [Green Version]
  13. Gradl, R.; Dierolf, M.; Günther, B.; Hehn, L.; Möller, W.; Kutschke, D.; Yang, L.; Donnelley, M.; Murrie, R.; Erl, A.; et al. In vivo Dynamic Phase-Contrast X-ray Imaging using a Compact Light Source. Sci. Rep. 2018, 8, 6788. [Google Scholar] [CrossRef] [PubMed]
  14. Jacquet, M.; Suortti, P. Radiation therapy at compact Compton sources. Phys. Medica 2015, 31, 596–600. [Google Scholar] [CrossRef] [Green Version]
  15. Dombrowsky, A.C.; Burger, K.; Porth, A.K.; Stein, M.; Dierolf, M.; Günther, B.; Achterhold, K.; Gleich, B.; Feuchtinger, A.; Bartzsch, S.; et al. A proof of principle experiment for microbeam radiation therapy at the Munich compact light source. Radiat. Environ. Biophys. 2020, 59, 111–120. [Google Scholar] [CrossRef] [PubMed]
  16. Bartzsch, S.; Corde, S.; Crosbie, J.C.; Day, L.; Donzelli, M.; Krisch, M.; Lerch, M.; Pellicioli, P.; Smyth, L.M.; Tehei, M. Technical advances in X-ray microbeam radiation therapy. Phys. Med. Biol. 2020, 65, 02TR01. [Google Scholar] [CrossRef] [PubMed]
  17. Bourhis, J.; Montay-Gruel, P.; Gonçalves Jorge, P.; Bailat, C.; Petit, B.; Ollivier, J.; Jeanneret-Sozzi, W.; Ozsahin, M.; Bochud, F.; Moeckli, R.; et al. Clinical translation of FLASH radiotherapy: Why and how? Radiother. Oncol. 2019, 139, 11–17. [Google Scholar] [CrossRef] [PubMed]
  18. Montay-Gruel, P.; Bouchet, A.; Jaccard, M.; Patin, D.; Serduc, R.; Aim, W.; Petersson, K.; Petit, B.; Bailat, C.; Bourhis, J.; et al. X-rays can trigger the FLASH effect: Ultra-high dose-rate synchrotron light source prevents normal brain injury after whole brain irradiation in mice. Radiother. Oncol. 2018, 129, 582–588. [Google Scholar] [CrossRef] [PubMed]
  19. Abendroth, J.; McCormick, M.S.; Edwards, T.E.; Staker, B.; Loewen, R.; Gifford, M.; Rifkin, J.; Mayer, C.; Guo, W.; Zhang, Y.; et al. X-ray structure determination of the glycine cleavage system protein H of Mycobacterium tuberculosis using an inverse Compton synchrotron X-ray source. J. Struct. Funct. Genom. 2010, 11, 91–100. [Google Scholar] [CrossRef]
  20. Byrn, S.R.; Zografi, G.; Chen, X.S. Solid State Properties of Pharmaceutical Materials; John Wiley & Sons Inc.: Hoboken, NJ, USA, 2017. [Google Scholar] [CrossRef]
  21. Walter, P.; Variola, A.; Zomer, F.; Jaquet, M.; Loulergue, A. A new high quality X-ray source for Cultural Heritage. Comptes Rendus Phys. 2009, 10, 676–690. [Google Scholar] [CrossRef]
  22. Dik, J.; Janssens, K.; Van Der Snickt, G.; Van Der Loeff, L.; Rickers, K.; Cotte, M. Visualization of a lost painting by vincent van gogh using synchrotron radiation based X-ray fluorescence elemental mapping. Anal. Chem. 2008, 80, 6436–6442. [Google Scholar] [CrossRef]
  23. Hajima, R.; Hayakawa, T.; Kikuzawa, N.; Minehara, E. Proposal of nondestructive radionuclide assay using a high-flux gamma-ray source and nuclear resonance fluorescence. J. Nucl. Sci. Technol. 2008, 45, 441–451. [Google Scholar] [CrossRef]
  24. Kulpe, S.; Dierolf, M.; Günther, B.; Brantl, J.; Busse, M.; Achterhold, K.; Gleich, B.; Pfeiffer, F.; Pfeiffer, D. Dynamic K-edge Subtraction Fluoroscopy at a Compact Inverse-Compton Synchrotron X-ray Source. Sci. Rep. 2020, 10, 9612. [Google Scholar] [CrossRef] [PubMed]
  25. CompactLight Project Website. Available online: http://www.CompactLight.eu (accessed on 1 April 2022).
  26. D’Auria, G.; Thompson, N.; Clarke, J.; Ferrario, M.; Wuensch, W.; Nguyen, F.; Aksoy, A.; Rochow, R.; Chianchi, A.; Latina, A.; et al. Conceptual Design Report of the CompactLight X-ray FEL; 2022; in publication. [Google Scholar]
  27. Jacquet, M. Potential of compact Compton sources in the medical field. Phys. Medica 2016, 32, 1790–1794. [Google Scholar] [CrossRef] [PubMed]
  28. Suzuki, T. General Formulas of Luminosity for Various Types of Colliding Beam Machines; National Lab. for High Energy Physics: Ibaraki, Japan, 1976. [Google Scholar]
  29. Deitrick, K.E.; Krafft, G.A.; Terzić, B.; Delayen, J.R. High-brilliance, high-flux compact inverse Compton light source. Phys. Rev. Accel. Beams 2018, 21, 080703. [Google Scholar] [CrossRef] [Green Version]
  30. Petrillo, V.; Bacci, A.; Ben Alì Zinati, R.; Chaikovska, I.; Curatolo, C.; Ferrario, M.; Maroli, C.; Ronsivalle, C.; Rossi, A.R.; Serafini, L.; et al. Photon flux and spectrum of γ-rays Compton sources. Nucl. Instrum. Methods Phys. Res. Sect. Accel. Spectrometers Detect. Assoc. Equip. 2012, 693, 109–116. [Google Scholar] [CrossRef]
  31. Krafft, G.A.; Priebe, G. Compton Sources of Electromagnetic Radiation. Rev. Accel. Sci. Technol. 2010, 3, 147–163. [Google Scholar] [CrossRef]
  32. Curatolo, C.; Drebot, I.; Petrillo, V.; Serafini, L. Analytical description of photon beam phase spaces in inverse Compton scattering sources. Phys. Rev. Accel. Beams 2017, 20, 080701. [Google Scholar] [CrossRef] [Green Version]
  33. Kogelnik, H.; Li, T. Laser Beams and Resonators. Appl. Opt. 1966, 5, 1550–1567. [Google Scholar] [CrossRef]
  34. Favier, P.; Amoudry, L.; Cassou, K.; Chiche, R.; Dupraz, K.; Martens, A.; Nutarelli, D.; Soskov, V.; Zomer, F.; Courjaud, A.; et al. Optimization of a Fabry-Perot cavity operated in burst mode for Compton scattering experiments. Phys. Rev. Accel. Beams 2018, 21, 121601. [Google Scholar] [CrossRef] [Green Version]
  35. Di Mitri, S.; Latina, A.; Aicheler, M.; Aksoy, A.; Alesini, D.; Burt, G.; Castilla, A.; Clarke, J.; Cortés, H.M.C.; Croia, M.; et al. Scaling of beam collective effects with bunch charge in the compactlight free-electron laser. Photonics 2020, 7, 125. [Google Scholar] [CrossRef]
  36. Metzger, T. Ultrafast Thin-Disk Amplifiers; EUV Litho, Inc.: Austin, TX, USA, 2019. [Google Scholar]
  37. Zomer, F.; Fedala, Y.; Pavloff, N.; Soskov, V.; Variola, A. Polarization induced instabilities in external four-mirror Fabry—Perot cavities. Appl. Opt. 2009, 48, 6651–6661. [Google Scholar] [CrossRef] [PubMed] [Green Version]
  38. Latina, A. RF-Track Reference Manual; Technical Report; CERN: Geneva, Switzerland, 2020. [Google Scholar] [CrossRef]
  39. Chen, P.; Horton-Smith, G.; Ohgaki, T.; Weidemann, A.W.; Yokoya, K. CAIN: Conglomérat d’ABEL et d’Interactions Non-linéaires. Nucl. Inst. Methods Phys. Res. A 1995, 355, 107–110. [Google Scholar] [CrossRef] [Green Version]
  40. Brown, W.J.; Anderson, S.G.; Barty, C.P.; Betts, S.M.; Booth, R.; Crane, J.K.; Cross, R.R.; Fittinghoff, D.N.; Gibson, D.J.; Hartemann, F.V.; et al. Experimental characterization of an ultrafast Thomson scattering X-ray source with three-dimensional time and frequency-domain analysis. Phys. Rev. Spec. Top.-Accel. Beams 2004, 7, 060702. [Google Scholar] [CrossRef]
  41. Brown, W.J.; Hartemann, F.V. Three-dimensional time and frequency-domain theory of femtosecond X-ray pulse generation through Thomson scattering. Phys. Rev. Spec. Top.-Accel. Beams 2004, 7, 060703. [Google Scholar] [CrossRef] [Green Version]
  42. Landau, L.D.; Lifshitz, E.M. Mechanics and Electrodynamics; Elsevier: Amsterdam, The Netherlands, 1972. [Google Scholar] [CrossRef]
  43. Hau-Riege, S.P.; London, R.A.; Huldt, G.; Chapman, H.N. Pulse requirements for X-ray diffraction imaging of single biological molecules. Phys. Rev.-Stat. Nonlinear Soft Matter Phys. 2005, 71, 061919. [Google Scholar] [CrossRef] [Green Version]
  44. Nanni, E.A.; Graves, W.S.; Moncton, D.E. From incoherent to coherent X-rays with ICS sources. In Proceedings of the Advances in Laboratory-based X-ray Sources, Optics, and Applications IV, San Diego, CA, USA, 10 August 2015; Volume 9590. [Google Scholar] [CrossRef]
  45. Deitrick, K.; Hoffstaetter, G.H.; Franck, C.; Muratori, B.D.; Williams, P.H.; Krafft, G.A.; Terzić, B.; Crone, J.; Owen, H. Intense monochromatic photons above 100 keV from an inverse Compton source. Phys. Rev. Accel. Beams 2021, 24, 050701. [Google Scholar] [CrossRef]
  46. Deitrick, K.E. Inverse Compton Light Source: A Compact Design Proposal. Ph.D. Thesis, Old Dominion University, Norfolk, VA, USA, 2017. [Google Scholar]
  47. Sun, C.; Wu, Y.K. Theoretical and simulation studies of characteristics of a Compton light source. Phys. Rev. Spec. Top. Accel. Beams 2011, 14, 044701. [Google Scholar] [CrossRef] [Green Version]
  48. Terzić, B.; Brown, A.; Drebot, I.; Hagerman, T.; Johnson, E.; Krafft, G.A.; Maroli, C.; Petrillo, V.; Ruijter, M. Improving performance of inverse Compton sources through laser chirping. EPL 2019, 126, 12003. [Google Scholar] [CrossRef] [Green Version]
  49. Variola, A.; Haissinski, J.; Loulergue, A.; Zomer, F. (Eds.) ThomX Technical Design Report; HAL Open Science: Lyon, France, 2014. [Google Scholar]
  50. Günther, B.; Dierolf, M.; Achterhold, K.; Pfeiffer, F. Device for source position stabilization and beam parameter monitoring at inverse Compton X-ray sources. J. Synchrotron Radiat. 2019, 26, 1546–1553. [Google Scholar] [CrossRef] [Green Version]
  51. Tribbey, W. Numerical Recipes; ACM SIGSOFT Software Engineering Notes; Cambridge University Press: Cambridge, UK, 2010; Volume 35. [Google Scholar] [CrossRef]
  52. Börzsönyi, A.; Chiche, R.; Cormier, E.; Flaminio, R.; Jojart, P.; Michel, C.; Osvay, K.; Pinard, L.; Soskov, V.; Variola, A.; et al. External cavity enhancement of picosecond pulses with 28,000 cavity finesse. Appl. Opt. 2013, 52, 8376–8380. [Google Scholar] [CrossRef] [Green Version]
  53. Bacci, A.; Alesini, D.; Antici, P.; Bellaveglia, M.; Boni, R.; Chiadroni, E.; Cianchi, A.; Curatolo, C.; Di Pirro, G.; Esposito, A.; et al. Electron Linac design to drive bright Compton back-scattering gamma-ray sources. J. Appl. Phys. 2013, 113, 194508. [Google Scholar] [CrossRef] [Green Version]
  54. Zha, H.; Latina, A.; Grudiev, A.; De Michele, G.; Solodko, A.; Wuensch, W.; Schulte, D.; Adli, E.; Lipkowitz, N.; Yocky, G.S. Beam-based measurements of long-range transverse wakefields in the Compact Linear Collider main-linac accelerating structure. Phys. Rev. Accel. Beams 2016, 19, 011001. [Google Scholar] [CrossRef] [Green Version]
  55. Podgorsak, E.B.; Rawlinson, J.A.; Johns, H.E. X-ray depth doses from linear accelerators in the energy range from 10 to 32 MeV. Am. J. Roentgenol. 1975, 123, 182–191. [Google Scholar] [CrossRef] [PubMed]
  56. Paternò, G.; Cardarelli, P.; Marziani, M.; Bagli, E.; Evangelisti, F.; Andreotti, M.; Gambaccini, M.; Petrillo, V.; Drebot, I.; Bacci, A.; et al. A collimation system for ELI-NP Gamma Beam System – design and simulation of performance. Nucl. Instrum. Methods Phys. Res. Sect. Beam Interact. Mater. Atoms 2017, 402, 349–353. [Google Scholar] [CrossRef] [Green Version]
Figure 1. Landscape of ICS sources. Known ICS sources were sampled based on their total flux and average brilliance. Values for the CompactLight-based source were also included, in red.
Photonics 09 00308 g001
Figure 2. Schematic of an inverse Compton scattering process. The input laser of photon energy E L was upscaled to an X-ray of energy E X .
Photonics 09 00308 g002
Figure 3. The 2.5 Cell C-band gun components and 3-D design. The solenoid, the mode launcher, the laser ports and the supports are visible. This 3-D representation was created by IASA, Athens, on a design made by INFN-LNF.
Photonics 09 00308 g003
Figure 4. Schematic of Fabry–Pérot cavity of the XLS source. M1 and M2 are planar mirrors, M3 and M4 are concave mirrors. The interaction of the electron with the laser beam is evidenced at the IP.
Photonics 09 00308 g004
Figure 5. Comparison of total flux and average brilliance results from RF-Track with their corresponding referenced values. The errors obtained in RF-Track for both average brilliance and total flux are too small to be noticeable.
Photonics 09 00308 g005
Figure 6. Comparison of plots from ThomX simulation using RF-Track (left) and CAIN (right). (a) The photon energy spectrum in a 1  mrad and 5  mrad collection angle, along with the full angle spectrum. (b) The transverse source size. (c) The angular emission distribution. (d) The number of photons/ m rad 2 / s against energy and collection angle.
Photonics 09 00308 g006
Figure 7. Comparison of cERL photon spectra computed in CAIN and RF-Track for different values of emittance. CAIN photon spectra at (a) ϵ N = 1 mm mrad and (c) ϵ N = 5 mm mrad . RF-Track photon spectra at (b) ϵ N = 1 mm mrad and (d) ϵ N = 5 mm mrad . Figures for three distinct collection angles were shown, along with the full energy spectrum.
Photonics 09 00308 g007
Figure 8. Parametric scan of the photon energy obtained by varying the laser wavelength and electron beam energy. The maximum photon energies of various sources are included, along with the proposed XLS-based source.
Photonics 09 00308 g008
Figure 9. Parametric scans of flux and bandwidth in a 1.5 m rad cone. The laser and electron spot sizes were varied to determine the maximum flux in a 1.5 mrad cone. (a) Scan of flux in a 1.5 mrad cone at a beam energy of 100 M e V . (b) Scan of bandwidth in a 1.5 mrad cone at a beam energy of 100 M e V . (c) Scan of flux in a 1.5 mrad cone at a beam energy of 300 M e V . (d) Scan of bandwidth in a 1.5 mrad cone at a beam energy of 300 M e V .
Photonics 09 00308 g009
Figure 10. Comparison of ThomX horizontal offset scans obtained in RF-Track and CAIN, given a 0 crossing angle. Total flux results were normalised with respect to the maximum value. (a) Horizontal offset scans. (b) Yaw offset scans.
Photonics 09 00308 g010
Figure 11. Laser offset scans of normalised flux in a 1.5 mrad cone of the XLS-based source. (a) Scan of transverse offsets, horizontal and vertical. (b) Scan of longitudinal offset, expressed in terms of the arrival time. (c) Scan of angle offsets, pitch and yaw. The offset corresponding to the 2 crossing angle was marked with a dashed line.
Photonics 09 00308 g011
Figure 12. Tracking of optics functions across the distance travelled in the final focus. (a) Tracking of betatron function on a logarithmic scale. (b) Tracking of normalised emittance. (c) Tracking of alpha parameter. The quadrupoles are marked in green.
Photonics 09 00308 g012
Figure 13. Results of RF-Track simulations of the XLS-based ICS source for an electron beam energy of 100 M e V , for each bunch crossing. (a) The photon energy spectrum. (b) The number of photons / mrad 2 / s against energy and collection angle. (c) The X-ray transverse source size. (d) The angular emission distribution.
Photonics 09 00308 g013
Table 1. X-ray parameters required for ICS applications. In some cases, the information was not available in the literature (N/A).
ApplicationX-ray EnergyTotal FluxBandwidthSource Size (IP)Source Size (Sample)Divergence
[keV][ph/s][%][ μ m][mm][mrad]
K-edge subtraction [5,12,24]33.7 3 × 10 10 4.56164
Phase contrast imaging [6,13]25 2.4 × 10 9 4 39 × 45 164
Microbeam radiation therapy [15]25 10 13 3.67041.5
FLASH therapy [18]6000–10,000 10 14 N/A5017N/A
Protein crystallography [19]7–35 10 13 1.430302
X-ray fluorescence [21,22]6.5–92 3 × 10 10 1-320 20 × 10 3 N/A
Nuclear resonance fluorescence [23]1000–5000 2.2 × 10 13 0.249.5N/AN/A
Table 2. Baseline parameters of the CompactLight injector. Initial values, which were modified to increase the total flux, are marked in parenthesis.
ParameterSymbolCompactLightUnit
Electron beam energy E e 50–300MeV
Repetition ratef1000Hz
Bunches per train 50 (2)
Collision rate f eff 50,000s 1
Bunch length σ z 1ps
Bunch chargeQ200 (75)pC
Bunch spacing 5ns
Rel. energy spread σ E e / E e 5
Normalised emittance ϵ x , y N 0.3 (0.15)mm mrad
Table 3. Parameters used to compare the performance of RF-Track against CAIN. Values obtained from simulations of ThomX were compared with analytical estimates. The calculations were performed on the same PC for both RF-Track and CAIN. To obtain the standard error, both CAIN and RF-Track codes were run 10 times.
ParameterCAINRF-TrackAnalyticUnit
Electron macro-particles 5 × 10 7 10 4 N/AN/A
X-ray macro-particles12,7001,350,311N/AN/A
Runtime25450.67 0 s
Total flux ( 2.80 ± 0.02 ) ( 2.41 ± 0.01 ) 2.43 10 13 ph/s
Table 4. Parameters defining the FPC cavity geometry for the XLS-based ICS source.
ParameterSymbolValueUnit
Distance between concave mirrors 2 d 1 15cm
Distance between planar mirrors 2 d 2 13cm
Cavity heighth19cm
Curvature radiusR13cm
Mirror diameter Φ 0.5cm
Crossing angle ϕ 2
Table 5. Summary of parameters required to maximise the flux in a 1.5  mrad cone of the XLS-based ICS source. The corresponding scattered photon beam parameters are also included.
ParameterSymbolCompactLightUnit
Electron beam energy E e 100300MeV
Electron spot size σ e 1–40.5–3.0 μ m
Laser pulse energy E p 5050mJ
Laser spot size σ laser 3–63–6 μ m
Total flux N . γ 1.8 × 10121. × 1012ph/s
Flux in 1.5 mrad N . γ , 1.5 mrad 1.6 × 10117.0 × 1011ph/s
Average brilliance B 2.0 × 10145.0 × 10141
Bandwidth in 1.5 mradBW 1.5 mrad 4–816–19%
1 ph/(s mm2 mrad2 0.1%BW).
Table 6. Ranges of laser offset corresponding to a decrease of 5% in the flux in a 1.5 mrad cone. Values are displayed for the XLS-based ICS source at an electron beam energy of 100 MeV and 300 MeV. Results were grouped by offset type.
Offset100 MeV300 MeVUnit
Horizontal( 1.91 2.01 ) ± 0.17 ( 1.83 2.06 ) ± 0.08 μ m
Vertical( 2.08 2.09 ) ± 0.04 ( 2.03 2.06 ) ± 0.02 μ m
Arrival time( 0.72 0.40 ) ± 0.01 ( 0.71 0.40 ) ± 0.002 ps
Pitch( 18.59 18.49 ) ± 0.25 ( 18.44 18.34 ) ± 0.65 mrad
Yaw( 3.58 73.90 ) ± 0.12 ( 3.50 73.76 ) ± 0.15 mrad
Table 7. Parameters used for the final focus design. All beam parameters are at the IP. Output X-ray parameters were also included. The quadrupole gradients were quoted in the order of interaction with the electron bunch.
ParameterSymbolValueUnit
Beam size σ x * / σ y * 5.56/12.34 μ m
Target beam size σ target 5 μ m
Beam divergence σ x * / σ y * 0.38/0.16mrad
Length of final focusS2.65m
Distance from final focus to IP L * 0.68m
Quadrupole gradientsG 4.32 , 2.79 , 4.18 , 4.57 T / m
Initial β β x / β y 2.51/2.69m
Initial ϵ N ϵ x N / ϵ y N 0.3/0.3mm mrad
Initial α α x / α y 0.69/1.27
Table 8. Parameters of the CompactLight-based ICS source obtained for maximising flux in a 1.5 mrad cone. All beam parameters were quoted at the IP.
ParameterSymbolCompactLightUnit
Electron beam energy E e 100MeV
Collision frequency f eff 50,000s 1
Bunch chargeQ200pC
Rel. energy spread σ e / E e 5
Norm. emittance ϵ x / ϵ y 0.35/0.39 mm mrad
Electron spot size σ e , x * / σ e , y * 5.56/12.34 μ m
Laser pulse energy E p 50mJ
Laser spot size σ laser , x * / σ laser , y * 4.71/4.71 μ m
Crossing angle ϕ 2
Source size σ X - ray , x * / σ X - ray , y * 3.59/4.40 μ m
Total flux N . γ 8.62 × 10¹¹ph/s
Average brilliance B 1.85 × 10141
1 ph/(s mm2 mrad2 0.1%BW).
Publisher’s Note: MDPI stays neutral with regard to jurisdictional claims in published maps and institutional affiliations.

