Article

A New Lattice Boltzmann Scheme for Photonic Bandgap and Defect Mode Simulation in One-Dimensional Plasma Photonic Crystals

1
School of Materials Science and Engineering, China University of Petroleum (East China), Qingdao 266580, China
2
The 41st Institute of China Electronics Technology Group Corporation, Qingdao 266555, China
3
School of Earth Science and Engineering, China University of Petroleum (East China), Qingdao 266580, China
*
Author to whom correspondence should be addressed.
Photonics 2022, 9(7), 464; https://doi.org/10.3390/photonics9070464
Submission received: 2 June 2022 / Revised: 21 June 2022 / Accepted: 29 June 2022 / Published: 1 July 2022
(This article belongs to the Special Issue Phononic Crystals: Science and Applications)

Abstract

:
A novel lattice Boltzmann method (LBM) with a pseudo-equilibrium potential is proposed for electromagnetic wave propagation in one-dimensional (1D) plasma photonic crystals. The final form of the LBM incorporates the dispersive effect of plasma media with a pseudo-equilibrium potential in the equilibrium distribution functions. The consistency between the proposed lattice Boltzmann scheme and Maxwell’s equations was rigorously proven based on the Chapman–Enskog expansion technique. Based on the proposed LBM scheme, we investigated the effects of the thickness and relative dielectric constant of a defect layer on the EM wave propagation and defect modes of 1D plasma photonic crystals. We have illustrated that several defect modes can be tuned to appear within the photonic bandgaps. Both the frequency and number of the defect modes could be tuned by changing the relative dielectric constant and thickness of the defect modes. These strategies would assist in the design of narrowband filters.

1. Introduction

Photonic crystals (PhCs) are artificial, periodically modulated structures of dielectric materials that can control the propagation of electromagnetic (EM) waves with a range of forbidden frequencies called photonic bandgaps (PBGs). The first PhC devices were fabricated using an array of alumina lattice elements [1]. Since then, PhCs have been extensively studied for various applications [2,3,4,5]. By introducing a defect mode (DM) inside a PBG, the combination of EM waves and PBGs opens a promising perspective to control spontaneous emission [6]. Spontaneous emission is a fundamental characteristic that limits device performance in various fields, including photonics [7], illumination [8], and imaging [9]. It also hinders the realization of large-scale optical integrated circuits [8,9,10]. However, owing to the fixed physical structure of conventional PhCs, PBGs are not actively tunable, which limits their applicability.
In recent years, plasma media have been widely used as photonic crystals [11,12,13,14] due to the tunability of the permittivity via various parameters, such as the plasma frequency and the plasma density, as well as the collision frequency at both the micrometer scale using the microplasma technique [15,16,17,18] and the millimeter scale using the low-temperature plasma technique [19]. Plasma PhCs provide additional freedom to reconfigure the DM and PBGs through customization of the plasma parameters. Nevertheless, their complex design and manufacturing process limit the potential applications of topological photonics in two-dimensional (2D) and three-dimensional (3D) PhCs. Consequently, 1D PhCs are preferred due to their flexibility and ease of manufacturing [20,21]. One-dimensional plasma PhCs are employed to realize surface impedance and the bulk band. Furthermore, 1D plasma PhCs have been employed to manipulate light–matter interactions by tuning the plasma layer thickness in PhCs.
The unique EM properties of 1D plasma media have attracted much attention from researchers, leading to the investigation of the EM responses of plasma media using various numerical simulation methods [22,23,24,25,26]. Several groups have proposed various numerical methods to model the EM waves in plasma, such as the finite-difference time-domain (FDTD) method [27,28], the auxiliary FDTD method [29,30], and the recursive convolution FDTD method [31]. As a general numerical simulation method, the lattice Boltzmann method (LBM) has achieved considerable success in various applications in the last two decades, since it divides all simulators into two decoupling parts: streaming and colliding parts [32]. The former, streaming parts, can easily be implemented with a memory swap function, while the latter, colliding parts, are totally reliant on the data of the local cell without using the data from the adjacent cells; which enables them to exhibit excellent scalability and easy implementation [33], as well as to be widely used in solving a vast range of partial differential equations, including fluid flow [34], wave [35], quantum mechanics [36,37,38], and heat transfer [39,40,41,42,43] problems. Due to the LBM’s excellent performance in previous areas, there is considerable interest in investigating the applicability and capability of such a method in solving EM waves in 1D plasma PhCs. Several groups have developed relevant codes to solve the EM propagation problem in nondispersive media based on the LBM [44,45,46]. Chen et al. [25] implemented an LBM scheme for dispersive media, but with pseudo-permittivity and complex force terms. To the best of our knowledge, few LBM schemes have been applied to investigate the EM propagation behaviors in 1D plasma PhCs.
This study introduces a new LBM scheme with a pseudo-equilibrium potential to solve Maxwell’s equation in isotropic plasma media. Two validation simulation cases were carried out via comparison with existing analytical and FDTD solutions. Based on the validated method, we studied a 1D PhC to investigate the propagation behaviors of its EM waves and the properties of its PBGs.

2. Methods

The LBM has achieved considerable success in various applications as a general numerical simulation method [34,35,36,37,38,39,40,41]. In property scheme designing, the evolution of an interested physical field can be recovered from the particle distribution of the LBM [33,34,35]. In this study, we propose an LBM scheme with a new form term design, and prove that the new proposed scheme is mathematically consistent with Maxwell’s equations in plasma media using the Chapman–Enskog technique.
Maxwell’s equations in dielectric materials at a particular location, x, and time, t, are given by [25]:
× E ( x , t ) = B / t
× H ( x , t ) = D ( x , t ) / t
where B and H are the magnetic induction and the magnetic field intensity, respectively; and D and E are the electric displacement and the electric field intensity, respectively, where D ( ω ) = ε ( ω ) E ( ω ) , with ε ( ω ) denoting the dielectric constant of a linear, isotropic, and dispersive medium. We also have B = μ H , where μ . denotes the permittivity. Using the relative constants μ r and ε r , the relations μ = μ r μ 0 and ε = ε r ε 0 exist. Since, in the time domain, D ( ω ) = ε ( ω ) E ( ω ) can be rewritten as D ( x , t ) = ε ε 0 E ( x , t ) + ε 0 0 t E ( x , t τ ) ζ ( τ ) d τ , Maxwell’s equations (Equations (1) and (2)) in one-dimensional dispersive media could be rewritten in the following form:
ε ε 0 E y ( x , t ) t = H z ( x , t ) x ε 0 t 0 t E ( x , t τ ) ζ ( τ ) d τ
μ H z ( x , t ) t = E y ( x , t ) x
To solve Equations (3) and (4) and to recover the dispersive phenomena, we propose using the well-known LBM–BGK model, which is expressed as per [31]:
f i ( x + e i Δ t , t + Δ t ) f i ( x , t ) = Δ t ω τ ( f i ( x , t ) f i eq ( x , t ) )   i = 0 ,   1 ,   ,   b
where e i and f i ( x , t ) are the lattice vector and the particle distribution function in the i-th direction, respectively. When i = 0, e 0 is the zero vector [31]. ω = 1 τ ,   where   τ   and   Δ t are the relaxation time and the lattice time step with b = 2 for one-dimensional media, respectively. Additionally, we further propose a new group of definitions for the macroscopic electromagnetic quantities E y ( x , t ) and H z ( x , t ) , in addition to the equilibrium distribution f i eq ( x , t ) :
ε ε 0 E y ( x , t ) = i f i ( x , t ) ,   H z ( x , t ) = i e i f i ( x , t )
f i eq ( x , t ) = A 0 ε ε 0 E y ( x , t ) ψ ( x , t ) ,   i = 0
f i eq ( x , t ) = A ε ε 0 E y ( x , t ) + B e i H z ( x , t ) ,   i > 0
where ψ ( x , t ) is the new proposed pseudo-equilibrium potential, which is used to represent the dispersive effects; A 0 , A , and B are constants. In the following section, we will prove that the LBM model of Equation (5) can recover the Maxwell’s equations of Equations (3) and (4) using our proposed forms of Equations (6) and (8), and that the proposed pseudo-equilibrium potential ψ ( x , t ) could be used to recover the dispersive phenomena. Two extra conservation constraints are introduced to specify the distribution weights:
i f i eq ( x , t ) = i f i ( x , t ) = ε ε 0 E y ( x , t ) ψ ( x , t )
i e i f i eq ( x , t ) = i e i f i ( x , t ) = H z ( x , t )
Based on Equations (6) and (8) and Equations (9) and (10), we find:
A 0 + 2 A = 1 ,   and   2 B = 1
To calculate the pseudo-equilibrium potential in plasma media, we take the Drude model in the time domain:
ζ ( t ) = ω p 2 ϑ c ( 1 exp ( ϑ c t ) ) U ( t )
where ϑ c is the damping frequency, ω p is the plasma frequency, and U ( t ) is the unit step function.
We use the Chapman–Enskog expansion to construct the distribution weights and the pseudo-equilibrium potential, through which the evolution features of the EM waves controlled by Equations (3) and (4) can be recovered.
The particle distribution, f i ( x , t ) , can be expanded up to the second order with respect to the expansion parameter, θ :
f i ( x , t ) = f i eq ( x , t ) + θ f i 1 ( x , t ) + θ 2 f i 2 ( x , t ) + O ( θ 3 )
where f i 1 ( x , t ) and f i 2 ( x , t ) are the formal expansion functions representing the distribution function at the first and second orders, respectively. Combining Equations (9), (10) and (13):
i e i f i ( x , t ) = i e i f i eq ( x , t ) + θ e i f i 1 ( x , t ) + θ 2 e i f i 2 ( x , t ) + e i O ( θ 3 ) = i e i f i eq ( x , t )
i f i ( x , t ) = i f i eq ( x , t ) + θ f i 1 ( x , t ) + θ 2 f i 2 ( x , t ) + O ( θ 3 ) = i f i eq ( x , t )
Considering that e 0 is a zero vector, and that θ is an infinitesimal value, Equations (14) and (15) imply:
i f i k ( x , t ) = 0 ,
i e i f i k ( x , t ) = 0 ,   for   k > 0
By using the Taylor expansion and combining it with Equation (5), we obtain:
f i ( x + e i Δ t , t + Δ t ) f i ( x , t ) = Δ t ( t + e i α x α ) f i ( x , t ) + Δ t ( t + e i α x α ) 2 f i ( x , t ) / 2 + o ( Δ t 3 ) = Δ t τ ( f i ( x , t ) f i eq ( x , t ) )
The operators t and x α can then be expanded by using the Chapman–Enskog expansion:
t = θ t ( 0 ) + θ 2 t ( 1 ) + o ( θ 3 )
x α = θ x α ( 1 ) + o ( θ 2 )
and we can rewrite the pseudo-equilibrium potential in Equations (6) and (8):
ψ ( x , t ) = t t = 0 t ψ ( x , τ ) d τ = t ψ ˜ ( x , t )
where ψ ˜ ( x , t ) is assumed to be:
ψ ˜ ( x , τ ) = θ ψ ( 1 ) ˜ ( x , τ )
Grouping terms with the same order of θ leads to:
t ( 0 ) f i 0 ( x , t ) + e i α x α ( 1 ) f i 0 ( x , t ) = 1 τ f i 1 ( x , t )
and
t ( 1 ) f i 0 ( x , t ) + ( τ + Δ t 2 ) ( t ( 0 ) + e i α x α ( 1 ) ) 2 f i 0 ( x , t ) = 1 τ f i 2 ( x , t ) t ( 0 ) ψ ( 1 ) ˜ ( x , t )
With Equations (6) and (8), and summing Equation (24) over i, we obtain:
t ( 0 ) i f i 0 ( x , t ) + x α ( 1 ) i e i α f i 0 ( x , t ) = 1 τ i f i 1 ( x , t ) = t ( 0 ) ε ε 0 E y ( x , t ) + x α ( 1 ) H z ( x , t ) = 0
Multiplying both sides of Equation (25) by e i α :
t ( 0 ) H z ( x , t ) + x α ( 1 ) 2 A ε ε 0 E y ( x , t ) = 0
Summing both sides of Equation (24) over i gives:
t ( 1 ) i f i 0 ( x , t ) + ( τ + Δ t / 2 ) ( t ( 0 ) t ( 0 ) i f i 0 ( x , t ) + 2 t ( 0 ) x α ( 1 ) i e i α f i 0 ( x , t ) + x α ( 1 ) x α ( 1 ) i e i α e i α f i 0 ( x , t ) ) = t ( 1 ) ε ε 0 E y ( x , t ) + ( τ + Δ t / 2 ) ( t ( 0 ) t ( 0 ) ε ε 0 E y ( x , t ) + 2 t ( 0 ) x α ( 1 ) H z ( x , t ) + x α ( 1 ) x α ( 1 ) 2 A ε ε 0 E y ( x , t ) ) = t ( 0 ) i ψ ( 1 ) ˜ ( x , t )
Multiplying Equation (24) by e i α :
t ( 1 ) H z ( x , t ) + ( τ + Δ t 2 ) ( H z ( x , t ) ) + 4 t ( 0 ) x α ( 1 ) ε ε 0 E y ( x , t ) + x α ( 1 ) x α ( 1 ) H z ( x , t ) = t ( 0 ) i e i α ψ ( 1 ) ˜ ( x , t )
Through comparison with the Maxwell’s equations of Equations (3) and (4), we note that the following constraints exist:
ψ ˜ ( x , t ) = ε 0 0 t E ( x , t τ ) ζ ( τ ) d τ
2 A ε ε 0 = μ
τ = Δ t 2
Combining Equations (25)–(31) gives:
ε ε 0 t E y ( x , t ) = x H z ( x , t ) ε 0 t 0 t E ( x , t τ ) ζ ( τ ) d τ + O ( Δ t 3 ) + O ( θ 3 )
μ t H z ( x , t ) = x E y ( x , t ) + O ( Δ t 3 ) + O ( θ 3 )
From Equations (32) and (33), it can be verified that, with the new pseudo-equilibrium potential, the Maxwell’s equations can be recast as Δ t , and that θ can go to zero. Considering Equation (21), the pseudo-equilibrium potential in Equation (7) could be written as:
ψ ( x , t ) = ε 0 t 0 t E ( x , t τ ) ζ ( τ ) d τ = ε 0 0 t t E ( x , t τ ) ζ ( τ ) d τ = ε 0 0 n Δ t t E ( x , n Δ t τ ) ζ ( τ ) d τ = ε 0 m = 0 n t E ( x , ( n m ) Δ t ) m Δ t ( m + 1 ) Δ t ζ ( τ ) d τ = ε 0 m = 0 n t E ( x , ( n m ) Δ t ) [ ω p 2 ϑ c τ + ω p 2 ϑ c 2 exp ( ϑ c τ ) ] | m Δ t ( m + 1 ) Δ t = ε 0 m = 0 n t E ( x , ( n m ) Δ t ) [ ω p 2 ϑ c 2 Δ t + ω p 2 ϑ c 2 exp ( ϑ c m Δ t ) ( exp ( ϑ c Δ t ) 1 ) ]
Compared with the FDTD method, the LBM scheme proposed in this study does not require the parameter values from adjacent cells when we need to calculate the equilibrium distribution and pseudo-equilibrium potential, so it can be easily parallelized, which is also one of the most significant advantages of the LBM widely used in other applications [32,33,34,35]. Since we focussed on a 1D EM wave simulation problem, the proposed method cannot be directly used to solve 2D or 3D problems. However, we could have derived the pseudo- equilibrium potential for 2D and 3D dispersion materials following the Chapman–Enskog expansion procedure, Equations (13)–(34). Another aspect of this study is that one must convert between the LBM and physical spaces. Using the speed of light as a critical unit conversion parameter, Table 1 summarizes the conversion rules between the LBM quantities and their corresponding physical values.

3. Results and Discussion

To validate the accuracy of the proposed method, numerical and analytical solutions for three typical cases were considered. The results show that the proposed LBM method was able to correctly recover electromagnetic propagation behaviors in nondispersive and plasma media.

3.1. Electromagnetic Waves in Nondispersive Media

For the first validation case, we investigated an electromagnetic Gaussian pulse propagated through a 1D nondispersive medium with 104 cells and a dielectric interface at the center. The length of the entire simulation domain is 2.3 mm. The left half of the simulation domain is a vacuum with a relative dielectric constant of ε r 0 = 1.0 , while the right half is occupied with a nondispersive dielectric medium with a relative dielectric constant of ε r = 2.0 . The electromagnetic Gaussian pulse could be described as [26,46]:
H ( x ) = H M 0 exp ( [ ( x x cen ) / α ] 2 ) ,   E ( x ) = E M 0 exp ( [ ( x x cen ) / α ] 2 )
where H M 0 and E M 0 are the amplitudes of the magnetic and electric fields, respectively. The constant, α = 400 (in units of lattice cells), fixes the pulse width, and x c e n is in the quarter.
The theoretical amplitudes of the reflected, E M , R , and transmitted, E M , T , pulses can be calculated based on the incident pulse, E M 0 , and the relative dielectric constants, ε r 0 and ε r , as [7,47]:
E M , R E M 0 = ε r ε r 0 1 ε r ε r 0 + 1 ,   E M , T E M 0 = 2 ε r ε r 0 + 1
from which we calculate that the theoretical ratio of E M , R E M 0 is 0.17157, whereas the ratio of E M , T E M 0 is 0.82843. The simulated electric fields at 0, 3.07, and 4.60 ps are plotted in Figure 1. Based on Figure 1, the two ratios based on our proposed method are 0.17153 and 0.82761, respectively. According to the theoretical model, the ratio of the propagation distances, La and Lb, of EM waves in the vacuum domain and the nondispersive medium, respectively, is ε r = 1.41421, while the computed values of La and Lb are 2000 cells and 1414 cells, respectively, and the ratio of La and Lb is 1.41440. Thus, the simulation results deviate from the theoretical values by less than 1%.

3.2. PBGs in 1D Plasma PhCs Based on LBM–SEF

We further investigated the PBGs of 1D plasma PhCs to demonstrate the adaptability of the proposed LBM method. The dielectric material, D, and the plasma material, P, were placed in alternating layers to form 1D plasma PhCs, as shown in Figure 2. The entire simulation domain, with a length of 2.3 mm, was evenly divided, uniformly, into 105 lattice cells with a length of 23.0 nm. P had a set plasma frequency of ω p = 2.0 THz and a damping frequency of ϑ c = 50 GHz. The permeabilities of the dielectrics, A and D, were set to 1.0 and 4.0, respectively.
We investigated an incident Gaussian pulse propagating in the abovementioned 1D plasma PhCs, and the amplitude of the pulse is described as Equation (35) with α = 10 (in units of lattice cells). The incident wave propagated from the right air medium, traversed the 1D plasma PhCs, and returned to the air medium. The transmitted and reflected electric fields of the incident Gaussian pulse are distributed as shown in Figure 3.
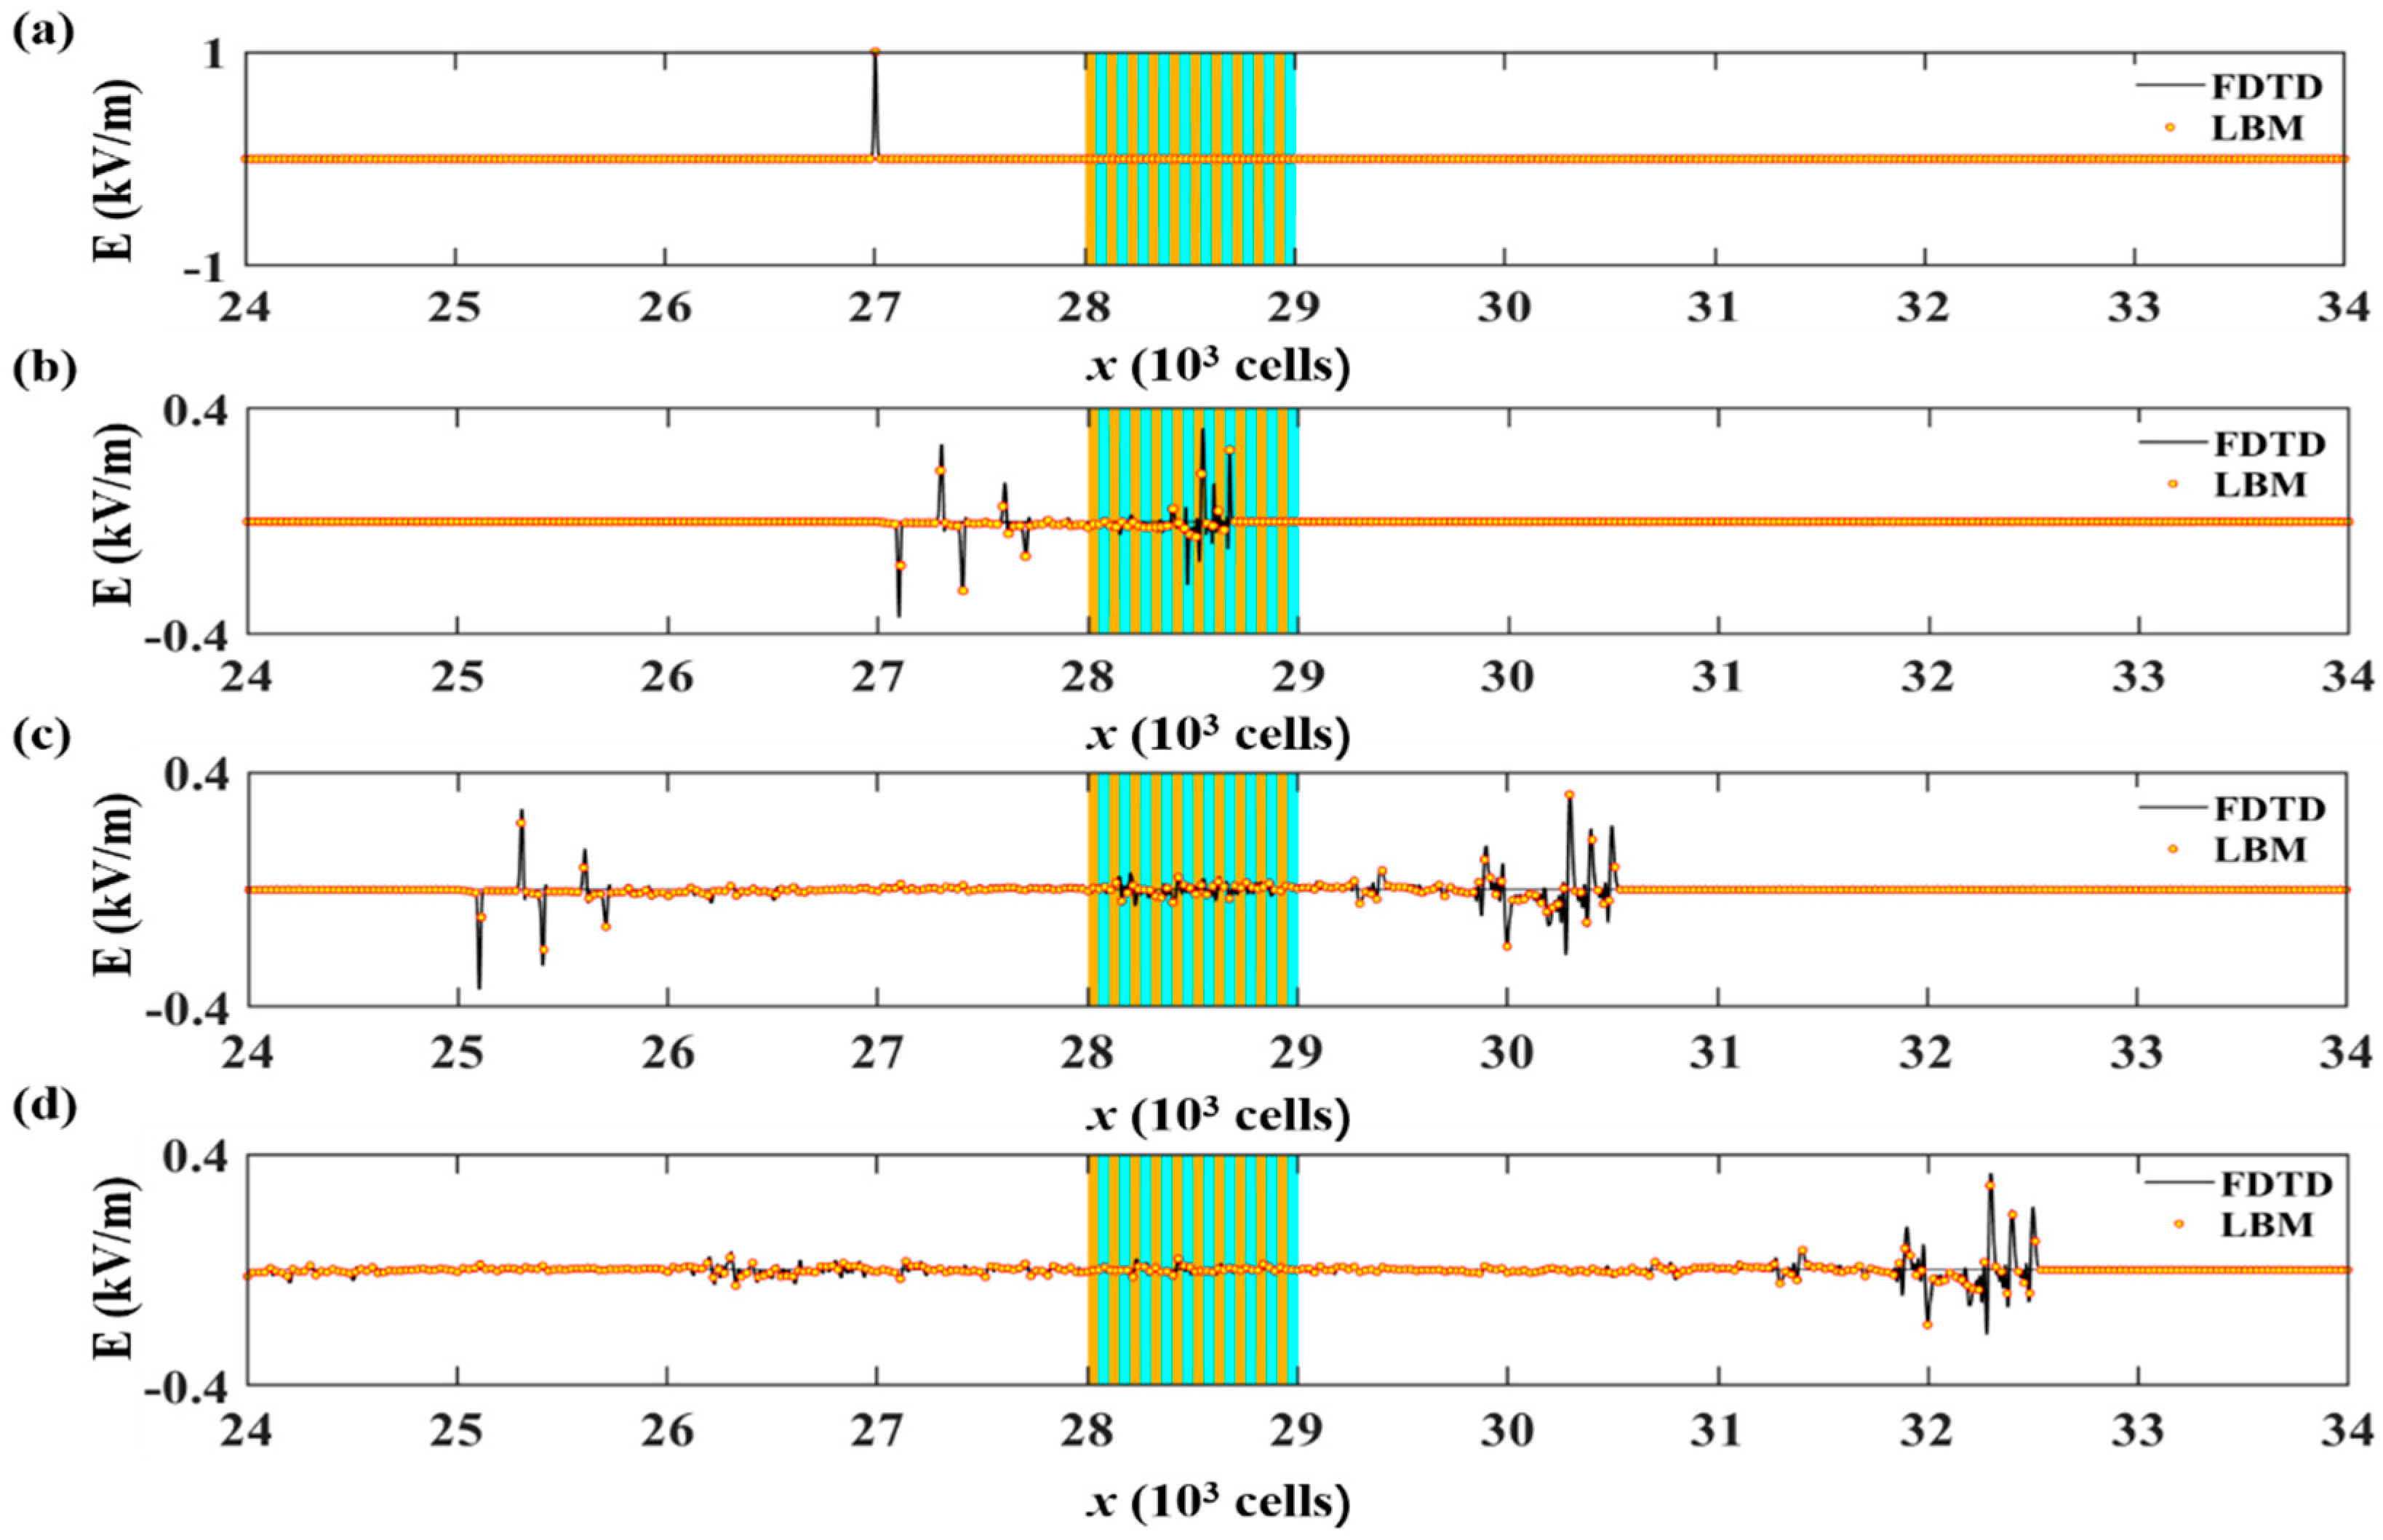
The simulation results for the 1D plasma PhCs are presented in Figure 3. Figure 3a,b shows that, at time t = 0 fs and t = 15.3 fs, the Gaussian pulse is in the air zone. Additionally, after passing through four dielectric layers and four plasma layers from the left, a significant proportion of the incoming EM waves is reflected back into the air domain, while the remaining proportion penetrates the plasma. At t = 30.6 and 45.9 fs, Figure 3c,d shows that most of the EM waves propagate through the leftmost plasma layer and still move toward the right. Additionally, there are still tens of small-amplitude pulses propagating in the 1D plasma PhCs. A comparison of the results obtained by our proposed method and the FDTD method is shown as Figure 3a–d, which demonstrates that the electric files obtained by our LBM model agree well with those calculated using the FDTD method.
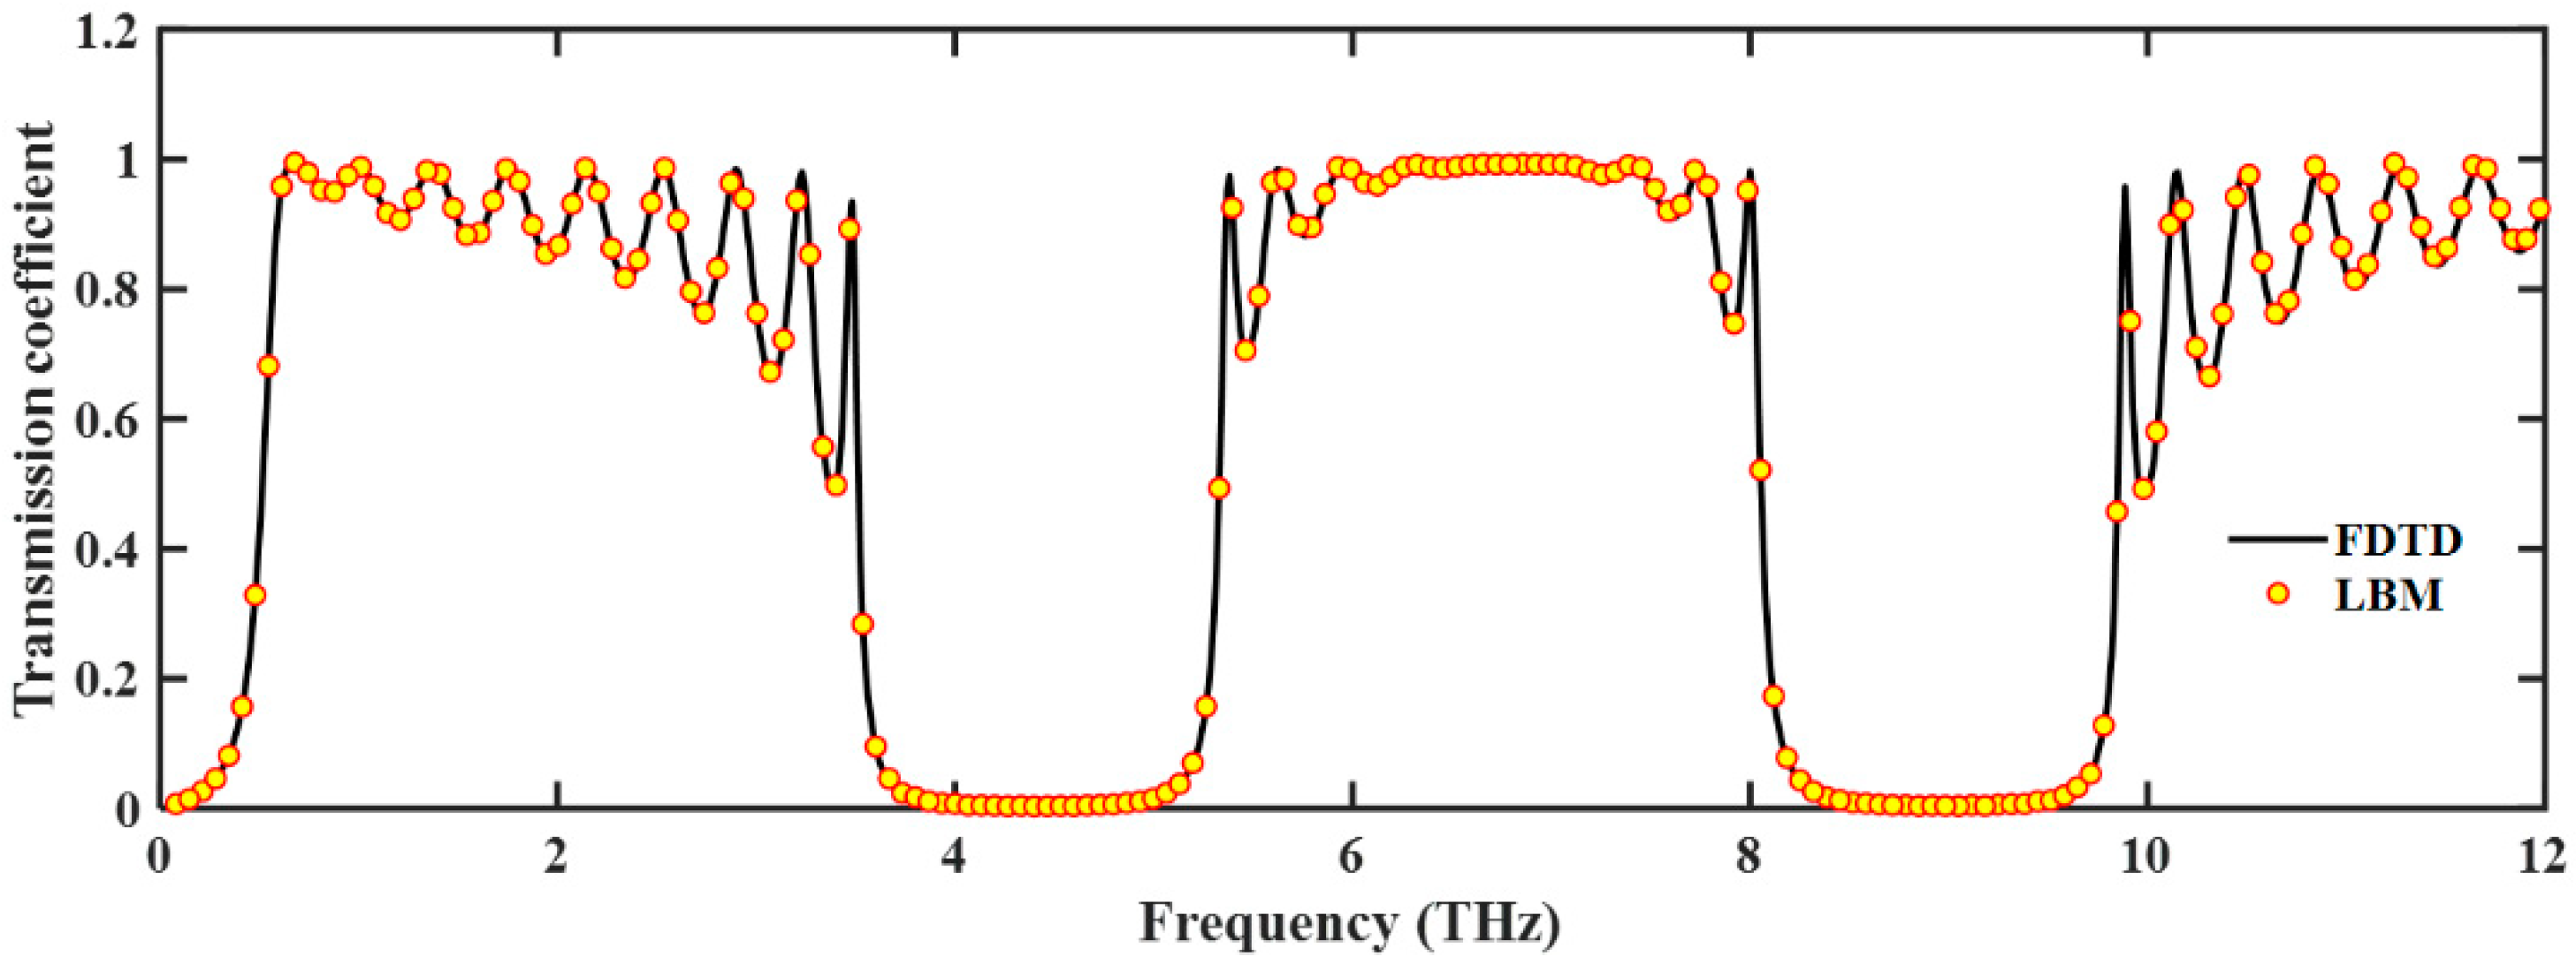
Figure 4 shows the transmission curves of 1D plasma PhCs. There are clearly two PBGs in the frequency domain region of 2.0–10.0 THz. In this case, the calculated transmission coefficients, obtained both with the present model and the FDTD method, are plotted as functions of frequency, Figure 4. The two curves are again in good agreement. This is because the PBG frequency domain lies above ω p / 2 π , and the relative permittivity of plasma in the PBGs region is near that of a vacuum, according to the Drude model. The theoretical most significant bandgap of 1D plasma PhCs is around f k × c 5 d = k × 4.6   THz , where d is the layer thickness of the 1D plasma PhCs, c is light speed, and k is a positive integer number. Figure 4 shows that the first gap at 3.8–4.8 THz and the second gap between 8.5 THz and 9.5 THz are in very good agreement with the theoretical model.
To calculate the convergence order of our proposed method, Richardson’s method [48] is further used to estimate the exact solution of the EM energy density E as:
E = lim δ x 0 E ( δ x ) 2 n E ( δ x 2 ) E ( δ x ) 2 n 1 + Er ( δ x n + 1 )
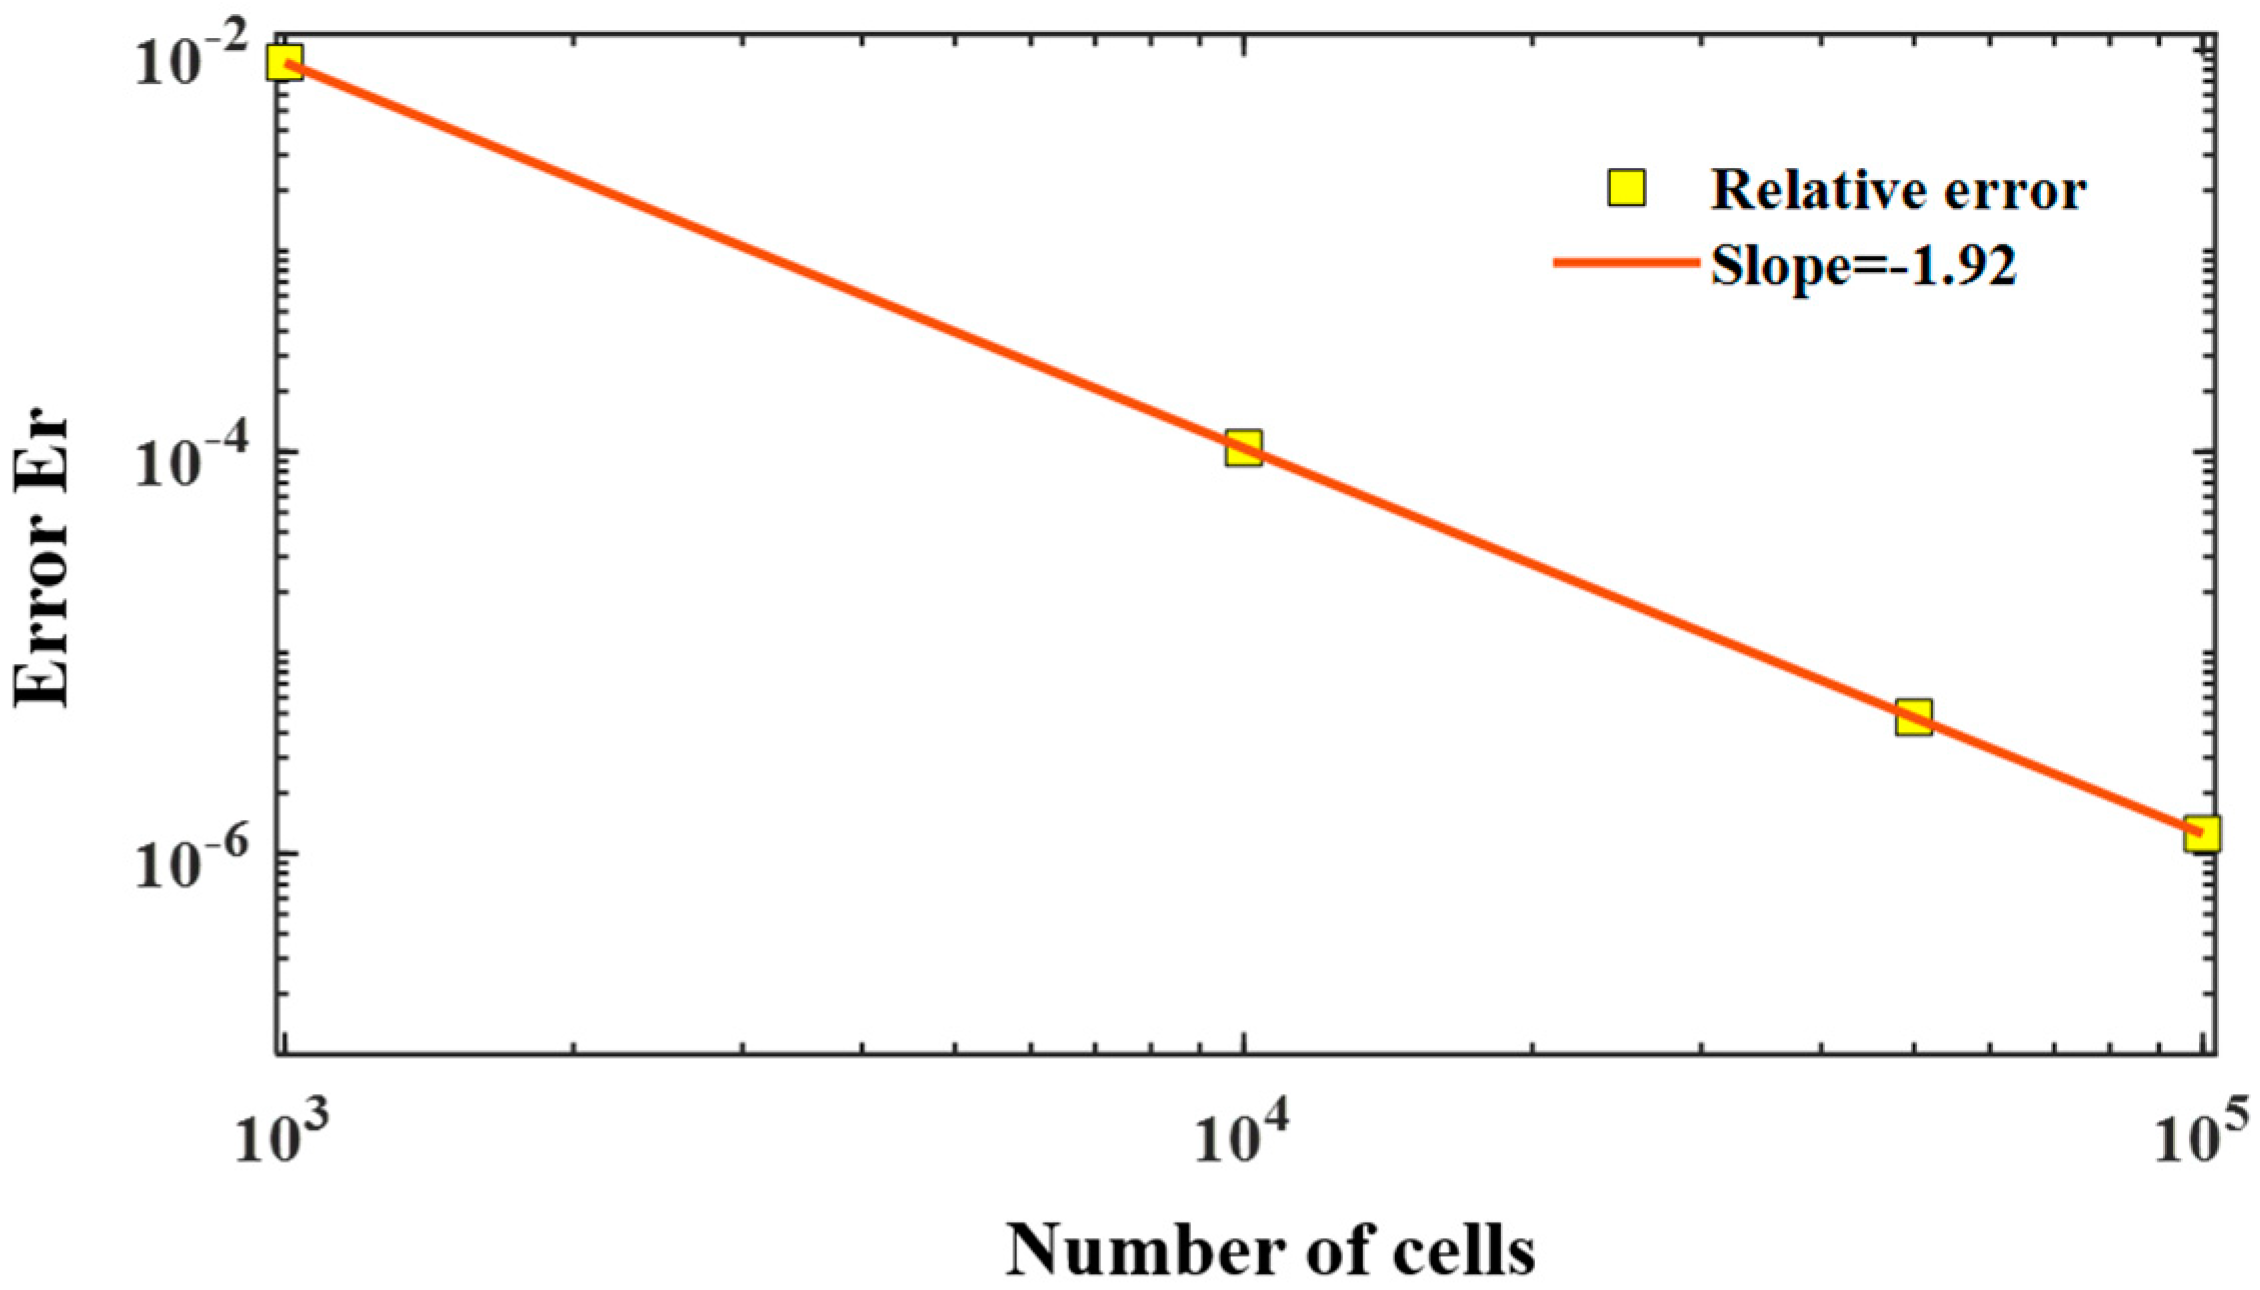
where Er ( δ x n + 1 ) is the estimation error with an order of n + 1, δ x = L N , and L and N are the computational domain length and total cell number, respectively. Figure 5 shows the numerical error as a function of the LBM grid cell number, ranging from 103 to 105 cells, which implies that relative error decreases with an increasing LBM grid cell number, as δ x 1.92 . The decrease in error verifies that the present scheme has a second-order convergence.

3.3. Effects of the Defect Layer Thickness on DMs and PBGs in 1D Plasma PhCs

To demonstrate the adaptability of the proposed method in the investigation of defect modes, we used the proposed lattice Boltzmann scheme to analyze the EM wave propagation behaviors in 1D plasma PhCs with one defect layer, and this presented an interesting phenomenon displayed by the plasma medium in response to incoming EM waves. By tuning the defect layer thickness, we can change the EM wave propagation behavior and the defect modes of 1D plasma PhCs.
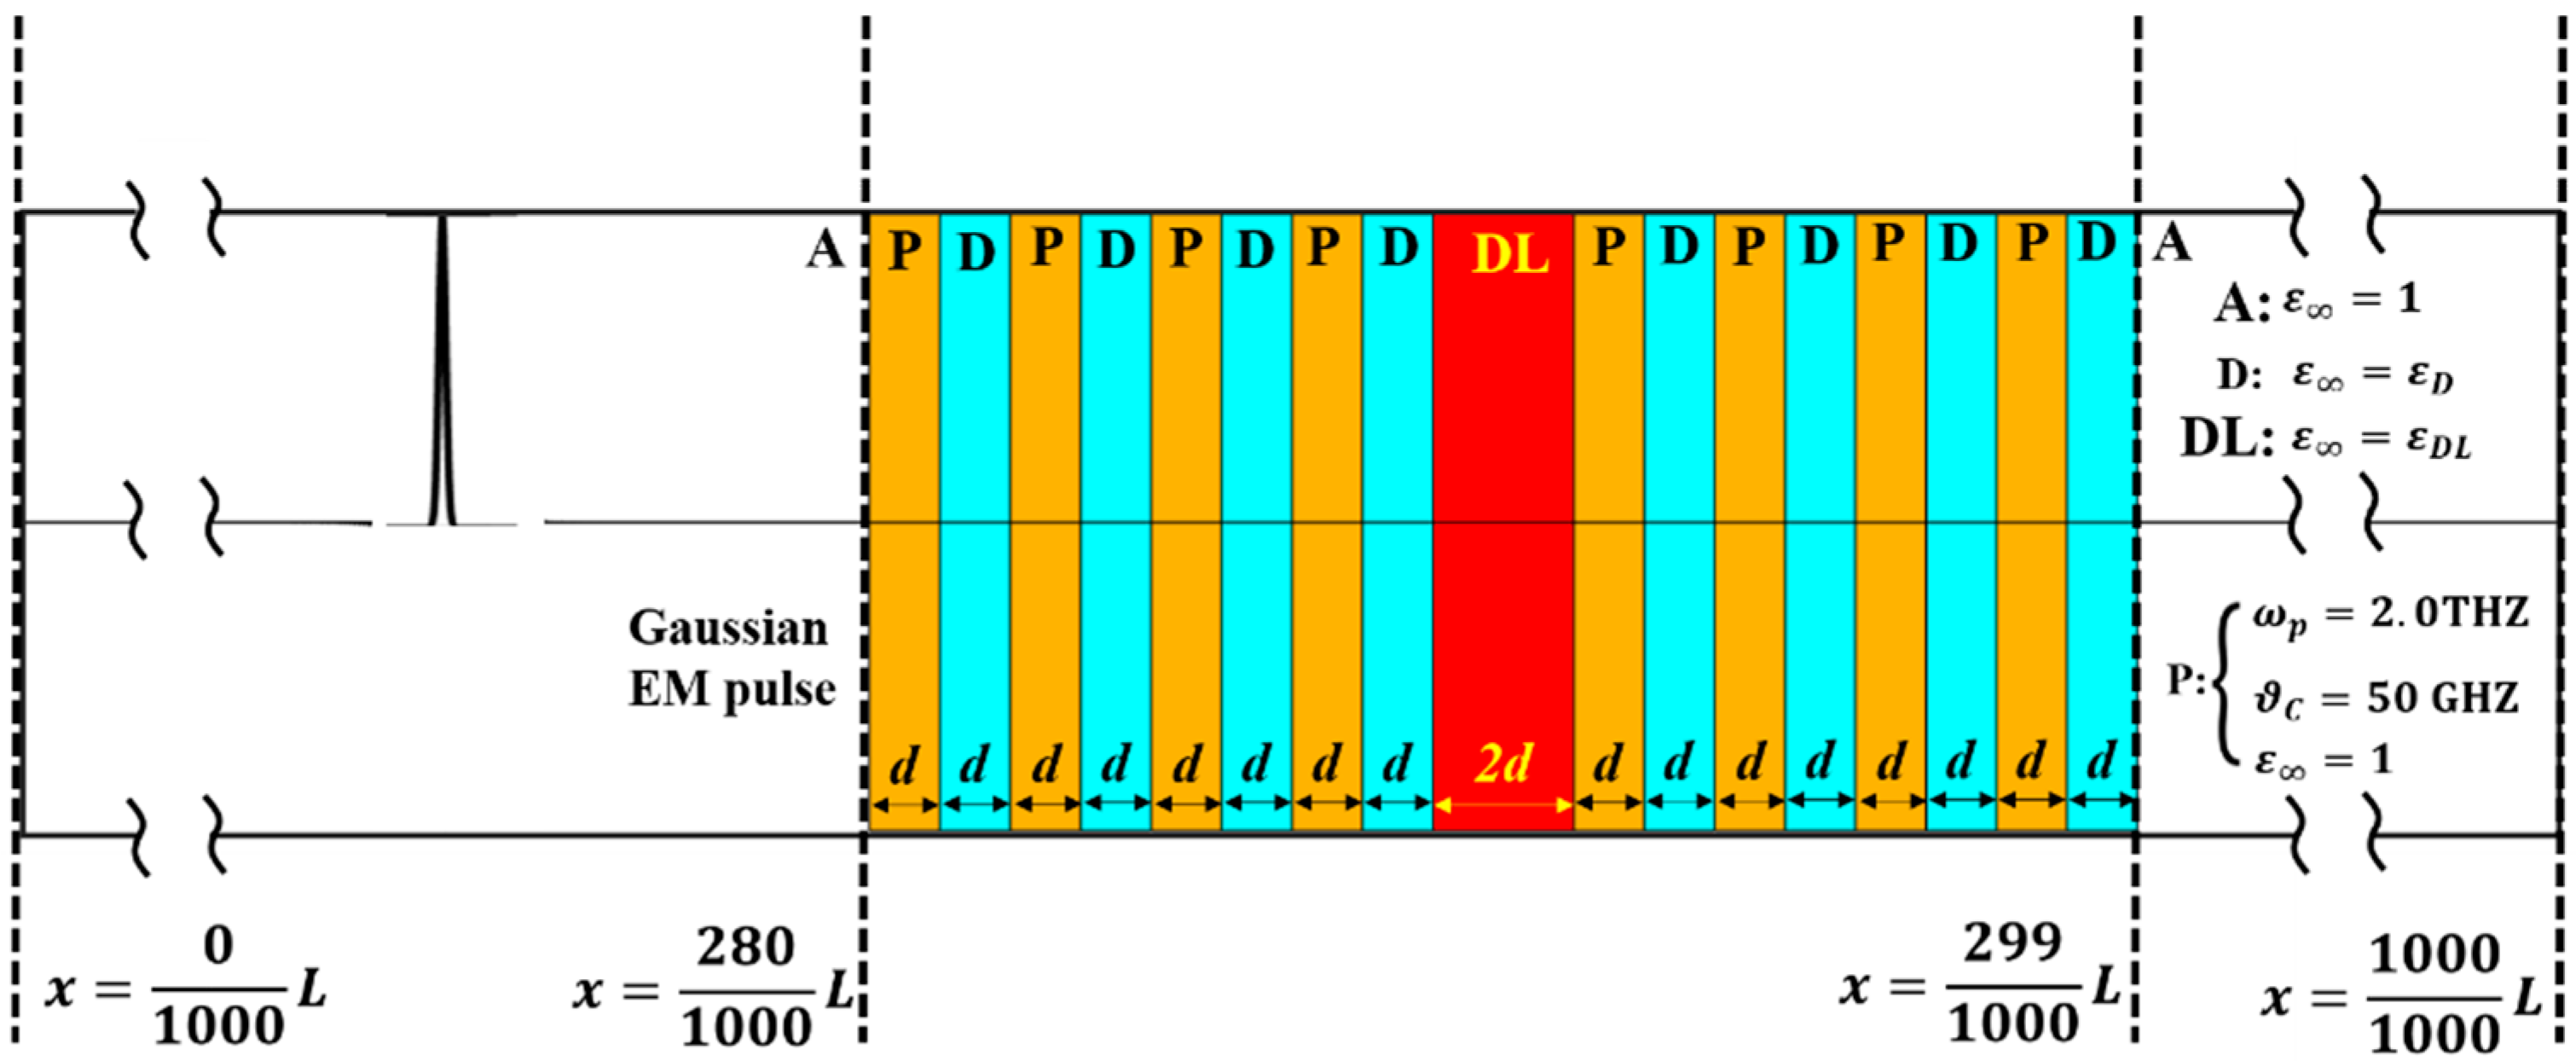
The schematic diagram in Figure 6 shows the proposed topological PhCs. One-dimensional PhCs comprised alternating layers of plasma, P, and dielectric, D, with one embedded defect layer of thickness, DL = 2 d (Figure 7) and DL = 4 d (Figure 8), in the region bounded by x = 0.28 L + 8 d and x = 0.28 L + 10 d , as well as by x = 0.28 L + 6 d and x = 0.28 L + 10 d ( d = 1.13 μm in this case). We focussed on the effect of the DL on the DM and PBGs in 1D plasma PhCs, where the permeability of the defect layer is set to be the same as that of the dielectric layer D.
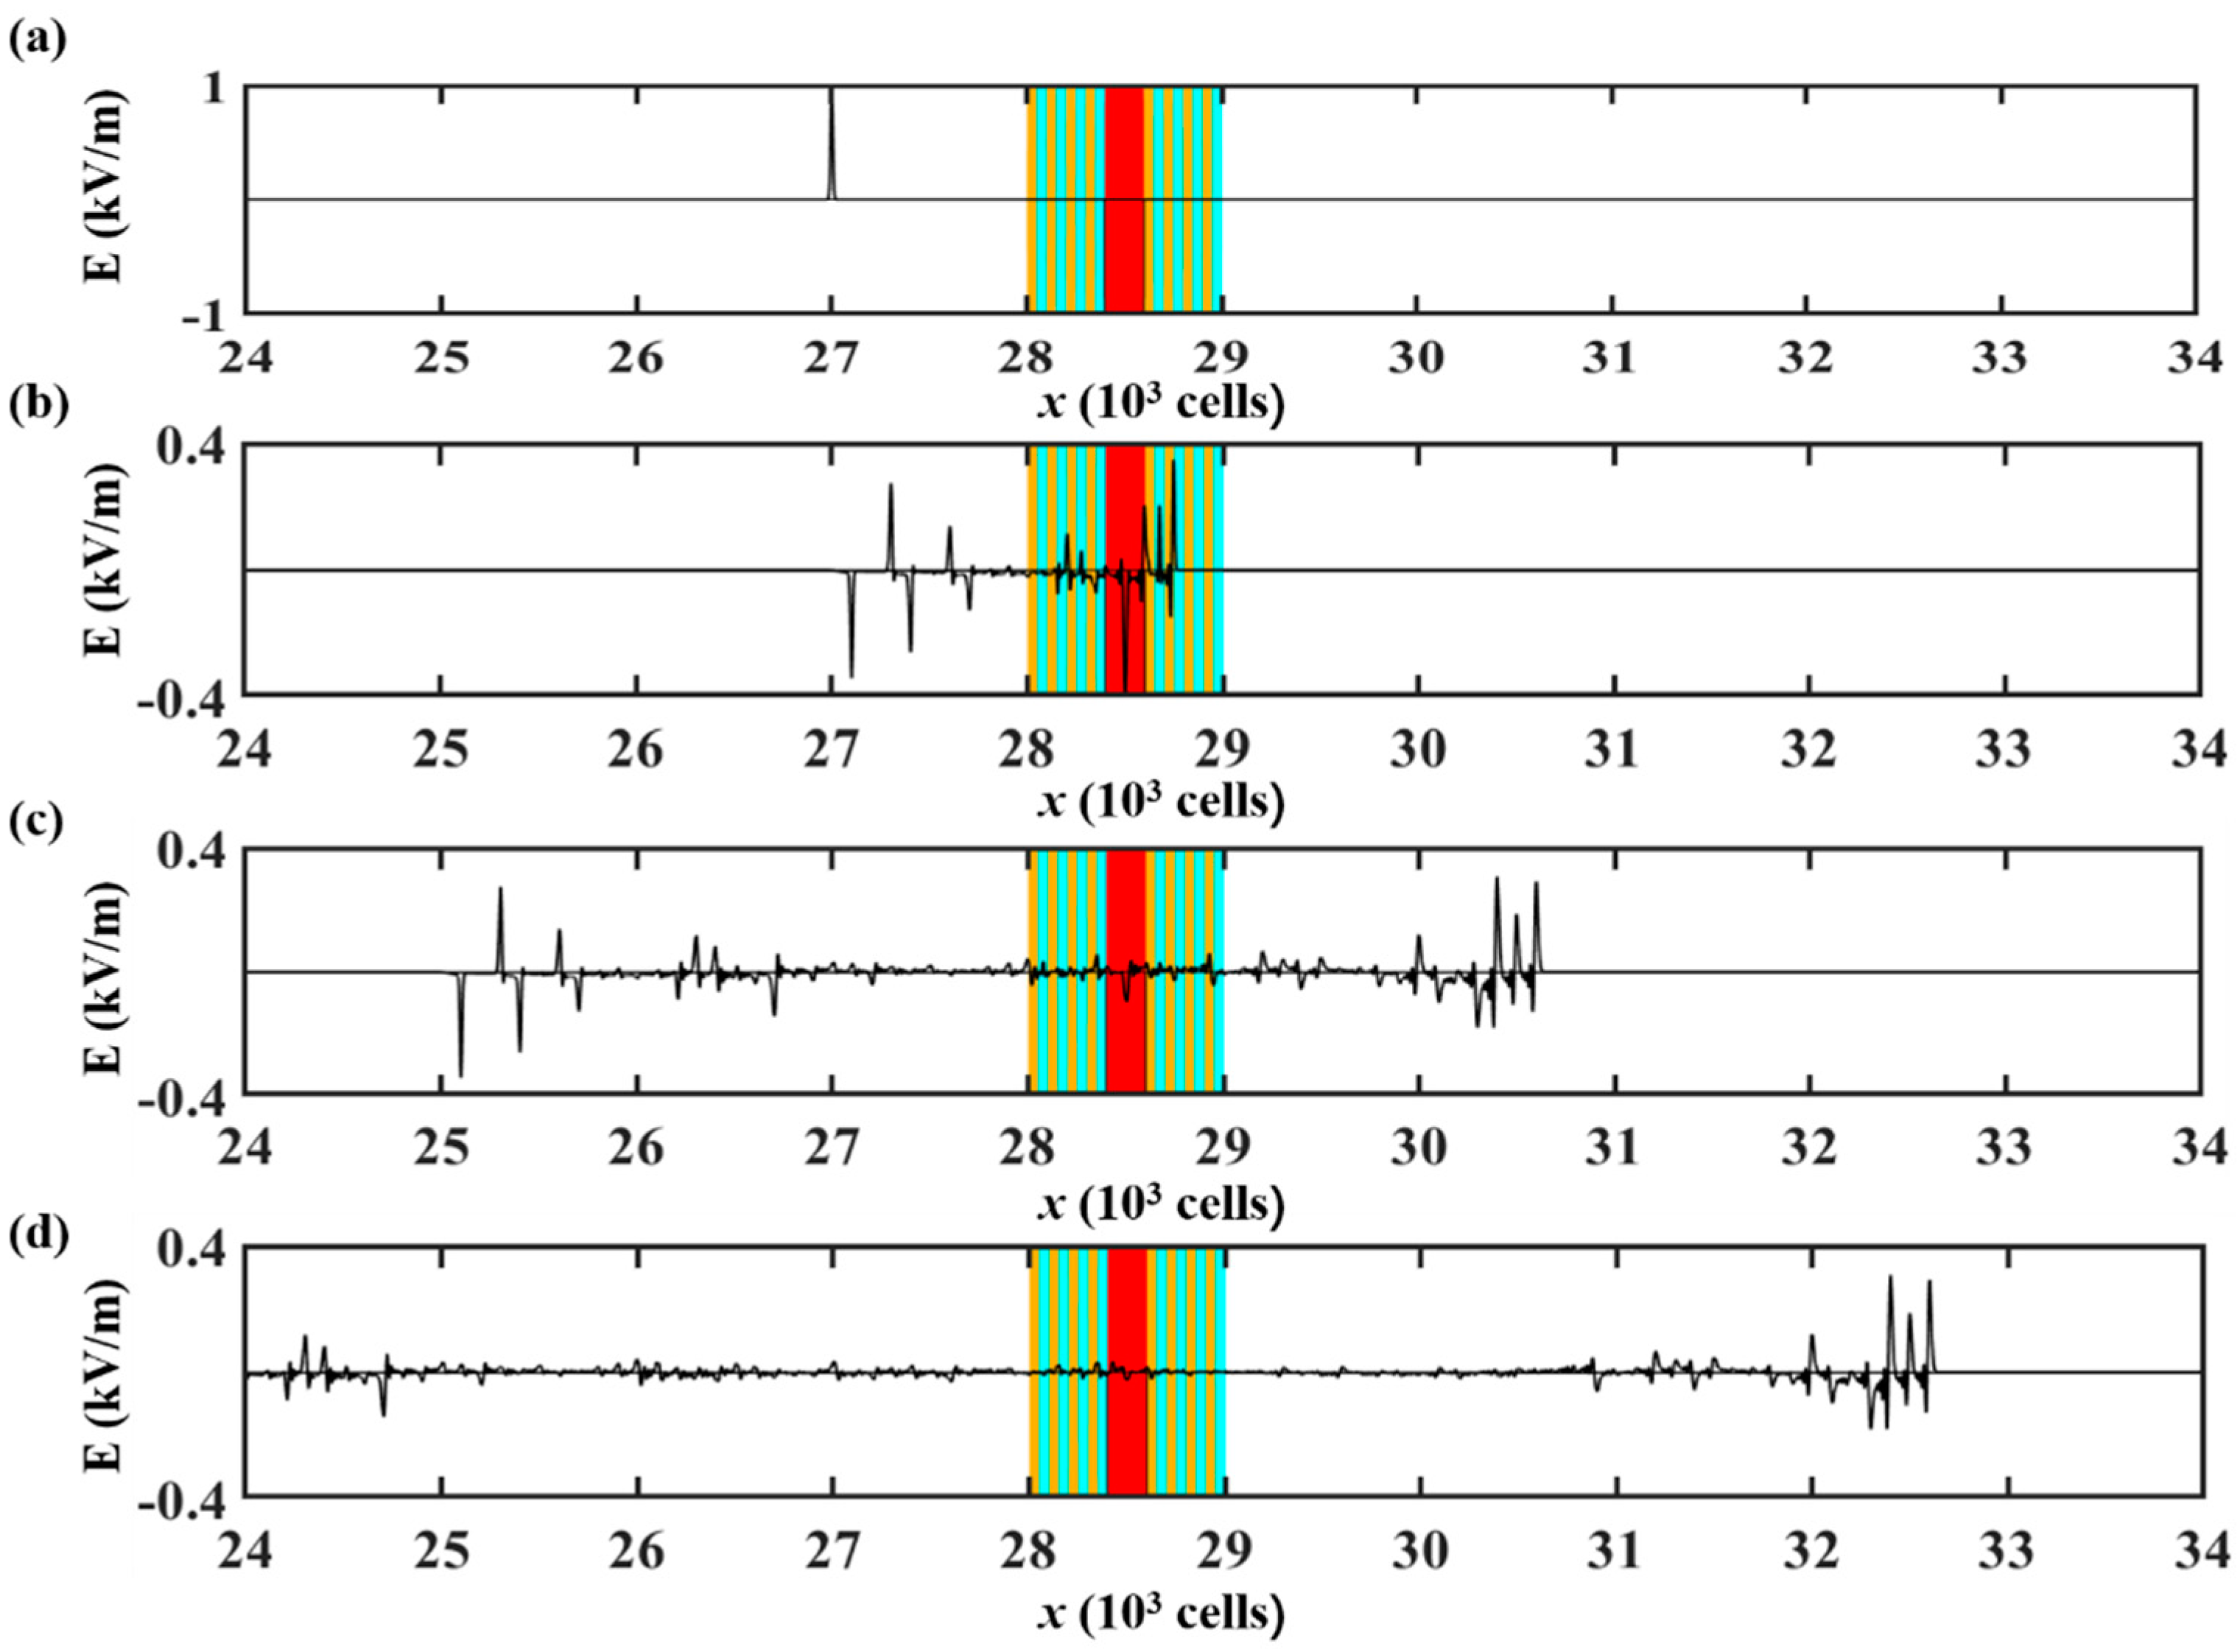
Using the same parameters (apart from the DL) as used in Figure 2, Figure 7 and Figure 8 show that an incident Gaussian pulse propagated from the right air medium traversed the 1D plasma PhCs. Figure 7a–d and Figure 8a–d show the impact of DL = 2d and DL = 4d on the transmitted and reflected electric fields of the incident Gaussian pulse in the computational domain at t = 0, 15.3, 30.6, and 45.9 fs. Compared with Figure 7b,c and Figure 8b,c this shows that the rightward-propagating EM waves are slightly slower for a thicker defect layer, and new reflected signals are observed around the left side of the 1D plasma PhCs as the DL increases from 2d to 4d.
Figure 9 shows the DMs of 1D PhCs with different DLs. As the DL increases, new DMs emerge from the bands below and above the bandgaps, which are consistent with the previous research conclusions [49,50]. This figure indicates that the number of DMs can be controlled by varying the DL. Thus, a range of defect thicknesses is suitable for designing multichannel filters.

3.4. Effects of the Relative Dielectric Constant on the DMs and PBGs in 1D Plasma PhCs

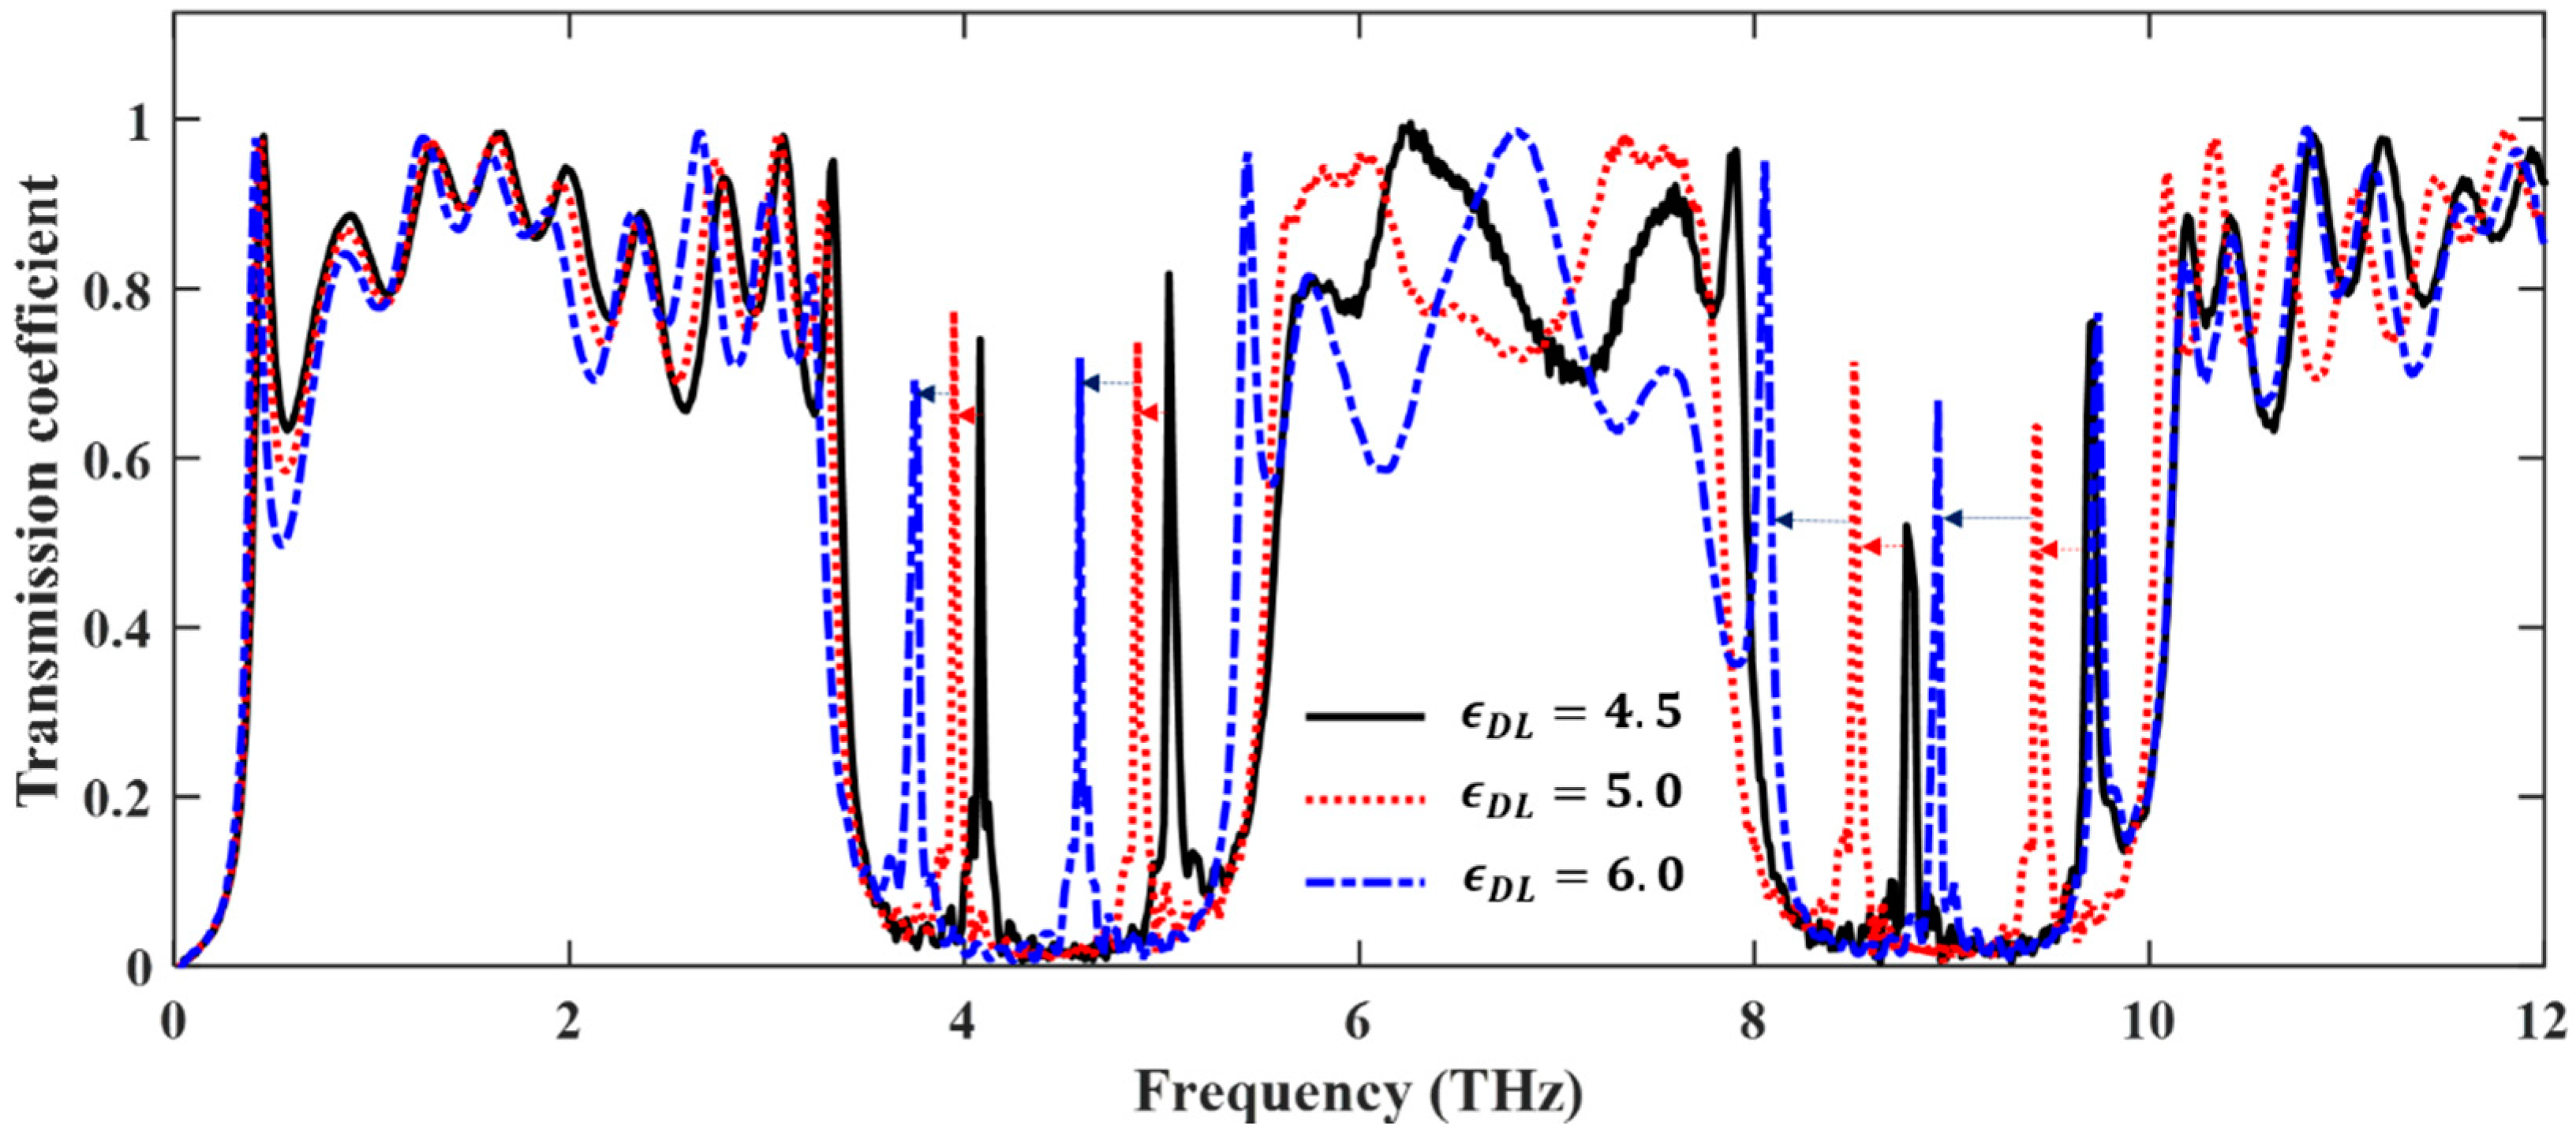
Using the same parameters that were used in Figure 6 (except for the relative dielectric constant of the defect layer), the influence of the relative dielectric constant on the electric field and transmission curves is given in Figure 10 and Figure 11, respectively.
Simulation results for different permeabilities are presented in Figure 10a–d. Figure 10a shows that, at t = 0, the initial Gaussian-modulated sinusoidal pulse is in the air zone. It then reaches the right side of the defect layer at approximately t = 15.3 fs, as shown in Figure 10b. Compared with the situation in Figure 7b, the EM waves propagate significantly slower here, owing to the higher permeability of the defect layer in Figure 10b. Figure 10c shows that at t = 30.6 fs most of the EM waves have passed through the 1D plasma PhCs, while there remains a significant reflected signal on the left side of the defect layer compared with Figure 7c. Figure 11 shows the transmission curves for different permeabilities of the defect layer with ε D L = 4.5 , 5.0, and 6.0. This shows that, as ε D L varies, the DMs of 1D plasma PhCs are modified accordingly. The defect frequency decreases until it merges with the low edge of the bandgap, and a different DM is generated from the upper edge of the bandgap. The DMs in the third bandgap (8.5–9.5 THz) are more dependent on the permeability of the defect materials than those in the second gap (3.8–4.8 THz). In addition, a range of defective materials can be used to design multichannel filters.

4. Conclusions

In summary, a novel LBM method with a pseudo-equilibrium potential was introduced in this study to investigate’ the propagating behaviors of EM waves in 1D plasma PhCs. The Drude model was used to describe the dispersive effects of plasma media, and the Chapman–Enskog expansion method was used to prove that the proposed method is mathematically consistent with Maxwell’s equations of EM waves in plasma media. The accuracy of the proposed method was demonstrated by comparing it to the analytical and FDTD methods. Two typical cases were considered in order to analyze the characteristics of EM waves that propagate through 1D plasma PhCs involving a defect layer of varying thickness and relative dielectric constants. The results showed that both the number and frequency of DMs are controlled by the thickness and relative dielectric constant of the defect layer. These features not only meet the requirements for designing tunable narrowband filters, but also demonstrate the suitability of the proposed LBM-SEF method for 1D plasma PhCs.

Author Contributions

Conceptualization, H.M. and M.T.; methodology, H.R. and L.S.; software, W.J.; validation, W.G.; formal analysis, B.W. All authors have read and agreed to the published version of the manuscript.

Funding

This research was funded by the National Natural Science Foundation (grant numbers 42072163, 12104513, and 21776315) and the Natural Science Foundation of Shandong Province (grant number ZR2019MD006).

Conflicts of Interest

The authors declare no conflict of interest.

References

  1. Yablonovitch, E. Photonic band gap structure. J. Opt. Soc. Am. B 1993, 10, 283–295. [Google Scholar] [CrossRef]
  2. Liang, Y.; Liu, Z.; Peng, J.; Lin, L.; Lin, R.; Lin, Q. Study on transmission characteristics and bandgap types of plasma photonic crystal. Photonics 2021, 8, 401. [Google Scholar] [CrossRef]
  3. Yupapin, P.; Trabelsi, Y.; Vigneswaran, D.; Taya, S.A.; Daher, M.G.; Colak, I. Ultra high sensitive sensor based on surface plasmon resonance structure having Si and graphene layers for the detection of chikungunya virus. Plasmonics 2022, 17, 1315–1321. [Google Scholar] [CrossRef]
  4. Taya, S.A.; Ramahi, O.M.; Abutailkh, M.A.; Doghmosh, N.; Nassar, Z.M.; Upadhyay, A.; Colak, I. Investigation of bandgap properties in one-dimensional binary superconductor-dieletric photonic crystal: TE case. India J. Phys. 2022, 96, 2151–2160. [Google Scholar] [CrossRef]
  5. Almawgani, A.H.; Taya, S.A.; Daher, M.G.; Colak, I.; Wu, F.; Patel, S.K. Detection of glucose concentration using a surface plasmon resonance biosensor based on barium titanate layers and molybdenum disulphide sheets. Phys. Scr. 2022, 97, 065501. [Google Scholar] [CrossRef]
  6. Yablonovitch, E.; Gmitter, T.J.; Bhat, R. Inhibited and enhanced spontaneous emission from optically thin AlGaAs/GaAs double heterostrutures. Phys. Rev. Lett. 1988, 61, 2546–2549. [Google Scholar] [CrossRef]
  7. Ma, H.; Wu, B.; Wang, Y.; Ren, H.; Jiang, W.; Tang, M.; Guo, W. A novel lattice Boltzmann scheme with single extended force term for electromagnetic wave propagating in one dimensional plasma medium. Eletronics 2022, 11, 882. [Google Scholar] [CrossRef]
  8. Steigerwald, D.A.; Bhat, J.C.; Collins, D.; Fletcher, R.M.; Holcomb, M.O.; Ludowise, M.J.; Martin, P.S.; Rudaz, S.L. llumination with solid state lighting technology. IEEE J. Sel. Top. Quantum Electron. 2002, 8, 310–320. [Google Scholar] [CrossRef]
  9. Gratzel, M. Photoelectrochemical cells. Nature 2001, 414, 338–344. [Google Scholar] [CrossRef]
  10. Haslinger, M.J.; Sivun, D.; Pohl, H.; Munkhbat, B.; Muhlberger, M.; Klar, T.A.; Scharber, M.C.; Hrelescu, C. Plasmon assistend direction and polarization sensitive organic thin film detector. Nanomaterials 2020, 10, 1866. [Google Scholar] [CrossRef]
  11. Kyaw, C.; Yahiaoui, R.; Chase, Z.A.; Tran, V.; Baydin, A.; Tay, F.; Kono, J.; Manjappa, M.; Singh, R.; Abeysinghe, D.C.; et al. Guided-mode resonances in flexible 2D terahertz photonic crystals. Optica 2020, 7, 537–541. [Google Scholar] [CrossRef]
  12. Shi, J.; Li, Z.; Sang, D.K.; Xiang, Y.; Li, J.; Zhang, S.; Zhang, H. THZ photonics in two dimensional materials and metamaterials: Properties, devices and prospects. J. Mater. Chem. C 2018, 6, 1291–1306. [Google Scholar] [CrossRef]
  13. Xiao, M.; Zhang, Z.Q.; Chan, C.T. Surface Impedance and Bulk Band Geometric Phases in One-Dimensional Systems. Phys. Rev. X 2014, 4, 021017. [Google Scholar] [CrossRef] [Green Version]
  14. Dong, J.-W.; Chang, M.-L.; Huang, X.-Q.; Hang, Z.H.; Zhong, Z.-C.; Chen, W.-J.; Huang, Z.-Y.; Chan, C.T. Conical Dispersion and Effective Zero Refractive Index in Photonic Quasicrystals. Phys. Rev. Lett. 2015, 114, 163901. [Google Scholar] [CrossRef] [Green Version]
  15. Xu, L.; Wang, H.-X.; Xu, Y.-D.; Chen, H.-Y.; Jiang, J.-H. Accidental degeneracy in photonic bands and topological phase transitions in two-dimensional core-shell dielectric photonic crystals. Opt. Express 2016, 24, 18059–18071. [Google Scholar] [CrossRef]
  16. Meng, G.; Ying, Q.; Loveless, A.M.; Wu, F.; Wang, K.; Fu, Y.; Garner, A.L.; Cheng, Y. Spatio-temporal dynamics of pulsed gas breakdown in microgaps. Phys. Plasma 2019, 26, 014506. [Google Scholar] [CrossRef]
  17. Li, X.; Lin, L.; Sheng, W.; Xu, H. Recent progress in the synthesis of nanomaterials by microplasma. J. Chem. Eng. Chin. Univ. 2021, 35, 589–600. [Google Scholar]
  18. Sun, P.P.; Zhang, R.; Chen, W.; Braun, P.V.; Eden, J.G. Dynamic plasma metal dielectric photonic crystals in the mm-wave region: Electromagnetically active artificial material for wireless communications and sensors. Appl. Phys. Rev. 2019, 6, 041406. [Google Scholar] [CrossRef]
  19. Son, J.H. Terahertz electromagnetic interactions with biological matter and their aaplications. J. Appl. Phys. 2009, 105, 102033. [Google Scholar] [CrossRef]
  20. Yang, Z.; Zhang, M.; Li, D.; Chen, L.; Fu, A.; Liang, Y.; Wang, H. Study on an artificial phenomenon observed in terahertz biological imaging. Biomed. Opt. Express 2021, 12, 3133–3141. [Google Scholar] [CrossRef]
  21. Erez, E.; Leviatan, Y. Current model analysis of electromagnetic scattering from objects containing a variety of length scales. J. Opt. Soc. Am. A 1994, 11, 1500–1504. [Google Scholar] [CrossRef]
  22. Shao, Y.; Yang, J.; Huang, M. A review of computational electromagnetic methods for graphene modeling. Int. J. Antennas Propag. 2016, 1, 7478621. [Google Scholar] [CrossRef] [Green Version]
  23. Sumithra, P.; Thiripurasundari, D. A review of computational electromagnetics methods. Adv. Electromagn. 2017, 6, 42–55. [Google Scholar] [CrossRef]
  24. Yee, K.S. Numerical solution of initial boundary value problems involving Maxwell’s equations in isotropic media. IEEE Trans. Antennas Propag. 1966, 39, 302–307. [Google Scholar]
  25. Chen, P.; Wang, C.; Ho, J. A lattice Boltzmann model for electromagnetic waves propagating in a one-dimensional dispersive medium. Comput. Math. Appl. 2013, 65, 961–973. [Google Scholar] [CrossRef]
  26. Feliziani, M.; Cruciani, S.; Santis, V.D.; Maradei, F. FD2TD Analysis of electromagnetic field propagation in multipole Debye media with and without convolution. Prog. Electromagn. Res. 2012, 42, 181–205. [Google Scholar] [CrossRef] [Green Version]
  27. Luebbers, R.; Kunz, K.S. A frequency dependent finite difference time domain formulation for dispersive materials. IEEE Trans. Electromagn. Compat. 1990, 32, 222–227. [Google Scholar] [CrossRef]
  28. Kashiwa, T.; Yoshida, N.; Fukai, I. A treatment by the finite difference time domain method of the dispersive characteristics associated with orientation polarization. IEICE Trans. 1990, 73, 1326–1328. [Google Scholar]
  29. Kashiwa, T.; Fukai, I. A treatment by the FDTD method of the dispersive characteristics associated with electronic polarization. Microw. Opt. Technol. Lett. 1990, 3, 203–205. [Google Scholar] [CrossRef]
  30. Ganhi, O.P.; Gao, B.Q.; Chen, J.Y. A frequency dependent finite difference time domain formulation for general dispersive media. IEEE Trans. Microw. Theory Tech. 1993, 41, 658–665. [Google Scholar] [CrossRef]
  31. Nickisck, L.J.; Franke, P.M. Finite difference time domain solution of Maxwell’s equations for the dispersive ionosphere. IEEE Antennas Propag. Mag. 1992, 34, 33–39. [Google Scholar] [CrossRef]
  32. Tang, M.; Zhan, H.; Ma, H.; Lu, S. Upscaling of dynamic capillary pressure of two-phase flow in sandstone. Water Resour. Res. 2019, 55, 426–443. [Google Scholar] [CrossRef] [Green Version]
  33. Tang, M.; Zhan, H.; Lu, S.; Ma, H.; Tan, H. Pore-scale CO2 displacement simulation based on the three fluid phase lattice Boltzmann method. Energy Fuels 2019, 33, 10039–10055. [Google Scholar] [CrossRef]
  34. Tang, M.; Lu, S.; Zhan, H.; Guo, W.; Ma, H. The effect of a microscale fracture on dynamic capillary pressure of two phase flow in porous media. Adv. Water Resour. 2018, 113, 272–284. [Google Scholar] [CrossRef]
  35. Chopard, B.; Luthi, P.; Wagen, J. Lattice Boltzmann method for wave propagation in urban microcells. IEEE Proc. Microwa. Antennas Propag. 1997, 144, 251–255. [Google Scholar] [CrossRef]
  36. Succi, S. Lattice Boltzmann schemes for quantum applications. Comput. Phys. Commun. 2002, 146, 317–323. [Google Scholar] [CrossRef]
  37. Succi, S.; Benzi, R. Lattice Boltzmann equation for quantum mechanics. Phys. D 1993, 69, 327–332. [Google Scholar] [CrossRef]
  38. Zhang, J.; Yan, G. A lattice Boltzmann model for the nonlinear Schrodinger equation. J. Phys. A Math. Theor. 2007, 40, 10393–10405. [Google Scholar] [CrossRef]
  39. Sajjadi, H.; Atashafrooz, M.; Delouei, A.A.; Wang, Y. The effect of indoor heating system location on particle deposition and convection heat transfer: DMRT-LBM. Comput. Math. Appl. 2021, 86, 90–105. [Google Scholar] [CrossRef]
  40. Jalali, A.; Delouei, A.A.; Khorashadizadeh, M.; Golmohammadi, A.M.; Karimnejad, S. Mesoscopic simulation of forced convective heat transfer of Carreau-Yasuda fluid flow over an inclined square: Temperature-dependent viscosity. J. Appl. Comput. Mech. 2020, 6, 307–319. [Google Scholar]
  41. Karimnejad, S.; Delouei, A.A.; Nazari, M.; Shahmardan, M.M.; Rashidi, M.M.; Wongwsies, S. Immersed boundary-thermal lattice Boltzmann method for moving simulation of non-isothermal elliptical particle. J. Therm. Anal. Calorim. 2019, 138, 4003–4017. [Google Scholar] [CrossRef]
  42. Chen, Y.; Wang, X.; Zhu, H. A general single-node second-order boundary condition for the lattice Boltzmann method. Phys. Fluids. 2021, 33, 043317. [Google Scholar] [CrossRef]
  43. Hanasoge, S.M.; Succi, S.; Orszag, S.A. Lattice Boltzmann method for electromagnetic wave propagation. Lett. J. Explor. Front. Phys. 2011, 96, 14002. [Google Scholar] [CrossRef] [Green Version]
  44. Lin, Z.; Fang, H.; Xu, J.; Zi, J.; Zhang, X. Lattice Boltzmann model for photonic band gap materials. Phys. Rev. E 2003, 67, 025701. [Google Scholar] [CrossRef] [PubMed] [Green Version]
  45. Richardson, L.F.; Gaunt, J.A. The deferred approach to the limit. Philos. Trans. R. Soc. Lond. Ser. A 1927, 226, 299–361. [Google Scholar]
  46. Mendoza, M.; Munoz, J.D. Three dimensional Lattice-Boltzmann model for electrodynamics. Phys. Rev. E 2010, 82, 056708. [Google Scholar] [CrossRef] [Green Version]
  47. Wang, B.; Cappelli, M.A. A plasma photonic crystal bandgap device. Appl. Phys. Lett. 2016, 108, 161101. [Google Scholar] [CrossRef]
  48. Dhuri, D.B.; Hanasoge, S. Numerical analysis of the lattice Boltzmann method for simulation of linear acoustic waves. Phys. Rev. E 2017, 95, 043306. [Google Scholar] [CrossRef] [Green Version]
  49. Liang, G.; Han, P.; Wang, H. Narrow frequency and sharp angular defect mode in one-dimensional photonic crystals from a photonic heterostructure. Opt. Lett. 2004, 29, 192–194. [Google Scholar] [CrossRef]
  50. Aghajamali, A.; Hayati, M.; Wu, C.; Barati, M. Properties of the defect modes in 1D lossy photonic crystals containing two types of negative index materials defects. J. Electromagn. Waves Appl. 2013, 27, 2317–2329. [Google Scholar] [CrossRef]
Figure 1. Distribution of an electric pulse crossing a dielectric interface. The shaded zone represents the dielectric medium, with a dielectric constant of ε r = 2.0 , and the nonshaded zone corresponds to the medium with ε r = 1.0 .
Photonics 09 00464 g001
Figure 2. Schematic of an incident Gaussian pulse and computational domain of 1D plasma PhCs. (The entire domain is 2.3 mm long, with a grid spacing of 23 nm).
Photonics 09 00464 g002
Figure 3. Snapshots of the electric field of an incident Gaussian pulse propagating in air and incident upon 1D plasma PhCs at different times: (a) 0, (b) 15.3, (c) 30.6, and (d) 45.9 fs. The properties of the plasma layer are ω p = 2.0 THz, ϑ c = 50 GHz. (Black solid curves are based on FDTD, and the curves with circular markers are based on the proposed method).
Photonics 09 00464 g003
Figure 4. Comparison of the transmission coefficient in magnitude and PBGs, plotted as a function of frequency. There are two significant PBGs in the frequency domain region of 2.0–10.0 THz. The black solid curve is based on the FDTD method, and the curve with circular markers is based on our proposed method.
Photonics 09 00464 g004
Figure 5. Numerical error as a function of LBM grid cell number.
Photonics 09 00464 g005
Figure 6. Schematic of an incident Gaussian pulse and computational domain of 1D plasma PhCs with one defect layer.
Photonics 09 00464 g006
Figure 7. Snapshots of the electric field of an incident Gaussian pulse propagating in air and incident upon a 1D plasma PhC with a defect layer thickness of DL = 2d at different times: (a) 0, (b) 15.3, (c) 30.6, and (d) 45.9 fs. The properties of the plasma layer are ω p = 2.0 THz, ϑ c = 50 GHz.
Photonics 09 00464 g007
Figure 8. Snapshots of the electric field of an incident Gaussian pulse propagating in air and incident upon a 1D plasma PhC with a defect layer thickness of DL = 4d at different times: (a) 0, (b) 15.3, (c) 30.6, and (d) 45.9 fs. The properties of the plasma layer are ω p = 2.0 THz, ϑ c = 50 GHz.
Photonics 09 00464 g008
Figure 9. Comparison of the transmission curves and defect modes of 1D plasma PhCs with DL = 0, 2d, and 4d. The plasma has the properties of ω p = 2.0 THz, ϑ c = 50 GHz.
Photonics 09 00464 g009
Figure 10. Snapshots of the electric field of an incident Gaussian pulse propagating in air and incident upon a 1D plasma PhC with a defect layer permeability of 6.0 at different times: (a) 0, (b) 15.3, (c) 30.6, and (d) 45.9 fs. The properties of the plasma layer are ω p = 2.0 THz, ϑ c = 50 GHz.
Photonics 09 00464 g010
Figure 11. Comparison of the transmission curves and defect modes of 1D plasma PhCs with different defect layer permeabilities ε D L = 4.5 , 5.0, and 6.0. The plasma has the properties of ω p = 2.0 THz, ϑ c = 50 GHz.
Photonics 09 00464 g011
Table 1. Conversion between the LBM and physical spaces.
DenominationLBM ContextPhysical Context
Space step Δ x L B = 1 Δ x P y = Δ x L B D L L
Time step Δ t L B = 1 Δ t P y = Δ t L B Δ x P y Δ x L B c L B c P y
Light speed c L B = 1 c P y = c
Electric field density E L B = 1 E P y = E L B θ V
Frequency f L B = 1 f P y = f L B Δ t L B Δ t p y
c is the speed of light, DL is the domain length, L is the cell number, and θV = 1 kV/m.
Publisher’s Note: MDPI stays neutral with regard to jurisdictional claims in published maps and institutional affiliations.