Article

Experimental Study of Transverse Trapping Forces of an Optothermal Trap Close to an Absorbing Reflective Film

Anhui Province Key Laboratory of Measuring Theory and Precision Instrument, School of Instrument Science and Optoelectronics Engineering, Hefei University of Technology, Hefei 230009, China
*
Author to whom correspondence should be addressed.
Photonics 2022, 9(7), 473; https://doi.org/10.3390/photonics9070473
Submission received: 18 May 2022 / Revised: 25 June 2022 / Accepted: 5 July 2022 / Published: 6 July 2022
(This article belongs to the Special Issue Optical Trapping: Techniques and Applications)

Abstract

:
The optothermal manipulation of micro-objects is significant for understanding and exploring the unknown in the microscale word, which has found many applications in colloidal science and life science. In this work, we study the transverse forces of an optothermal trap in front of a gold film, which is an absorbing reflective surface for the incident laser beam. It is demonstrated that optothermal forces can be divided into two parts: optical force of a standing-wave trap, and thermal force of a thermal trap. The optical force of the standing-wave trap can be obtained by measuring the optical trapping force close to a non-absorbing film with same reflectance. The thermal force can be obtained by subtracting the optical force of the standing-wave trap from the total trapping force of the optothermal trap close to the gold film. The results show that both optical and thermal trapping forces increase with laser power increasing. The optical trapping force is larger than the thermal trapping force, which is composed of convective drag force and thermophoretic force. Further experiment is run to study the composition of thermal force. The result shows that the convective flow is generated later than the thermophoretic flow. The results proposed here are useful for enabling users to optimize optothermal manipulation method for future applications.

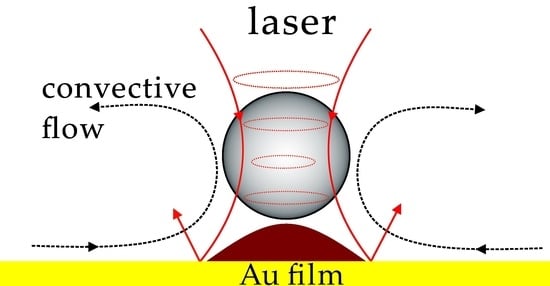
Graphical Abstract

1. Introduction

Over recent decades, optothermal manipulation techniques [1,2,3,4] have become useful tools for manipulating micro-objects such as microparticles [5,6,7,8,9,10,11,12], or microbubbles [13,14,15,16,17], etc. The optothermal methods manipulate the micro-objects by exerting the optothermal forces, which are based on various light-induced thermal processes [1] such as Marangoni convection [18], thermophoresis [19], thermophoretic depletion [20], thermoelectricity [21,22,23], and photophoresis [24,25,26].
Many optothermal manipulation experiments rely on heat-induced flow at a temperature gradient. In recent years, there have been some methods developed to generate the temperature gradients in sample cells, which can be induced by laser heating of absorbing films [5,6,7], absorbing particles [27,28,29], or absorbing liquids [30]. Among them, a commonly used method is laser heating of absorbing films. Metal film is a commonly used light absorbing film. The metal film can reflect laser beam, and there will be standing-wave traps [31,32,33,34,35,36,37,38,39,40] formed by the interference of incident and reflected beams. In most optothermal experiments, the laser power is always several milliwatts, the optical trapping force is much less than the thermal force. Therefore, the optical trapping force can be ignored when the microparticles are manipulated close to the metal films in most experiments at present. Previous research [31] has shown that the standing-wave trap can still exert optical force on the microparticle even trapped at a large distance of 5 μm from the reflective surface, and the force is related to the interfacial reflectance and not directly proportional to the reflectance. The optical force is proportional to the laser power [41]. Therefore, when the laser power is large, the optical trapping force cannot be ignored of the standing-wave trap. Especially for an optothermal trap formed by an objective with high numerical aperture, the optothermal force on the trapped microparticle will be considerably affected by optical force from the standing-wave trap. Optical and thermal forces exert together as a combined force on the microparticles. It is difficult to distinguish the two forces in forces’ measurement. Therefore, the investigation on the force components of an optothermal trap close to a reflective metal film has rarely been studied, and there is still a lack of detailed discussion.
In this paper, we study the transverse optothermal force when a laser beam is focused tightly on a gold film. The optical and thermal forces are investigated individually. The optical force of the optothermal trap is deemed equal to the optical force of a standing-wave trap close to a non-absorbing reflective film with same reflectance. At last, the composition and magnitude of thermal trapping forces of the optothermal trap are studied. The results of this work are helpful to understand the physical mechanism of optothermal manipulation.

2. Materials and Methods

2.1. Setup and Materials

A schematic of our experimental setup is shown in Figure 1a. The optical tweezers setup is based on an upright microscope (MF30, fluorescent microscope, Mingmei, Guangzhou, China) [42]. A laser beam (CNI, MIL-N-1064, TEM00, cw, Changchun, China) with the beam waist 3 mm is used as trapping source and to irradiate a gold film for generating a local heat spot. The laser beam becomes a linearly polarized beam after passing through a linear polarizer. The beam is expanded to fill the pupil of objective with a beam expander, which is constructed with two lenses (L1 and L2, fL1 = 50 mm, fL2 = 150 mm). The expanded beam is reflected into the microscope, and reflected downward by a dichroic mirror to a microscope objective (oil immersion, N.A. = 1.25, 100×). The objective focuses the beam into the sample cell, which is mounted at a stage. The fluorescence experiments are carried out using green fluorescence module of the microscope. The fluorescence is excited by the filtered light of a mercury lamp (λ = 510–560 nm) focused in the imaging plane. The emitted light is collected by the same objective and imaged on a CMOS camera. The images are processed with the ImageJ software. The laser power is measured at the pupil of objective lens, and can be adjusted with an adjustable power attenuation.
As in Figure 1b, the incident and reflected beams form a standing-wave trap, which can trap microparticles when the incident beam is focused close to the gold film. In addition, a part of incident energy is absorbed by the gold film and converted into heat. There is a temperature increase ΔT generated. The temperature increase induces a convection, which exerts a Stokes force on the microparticle and drags the particle towards the focal spot transversely.
The thickness of sample cells is 80 μm. The transverse trapping forces were measured in two kinds of sample cells, which were prepared with non-absorbing reflective films or a gold film. By measuring the power of the incident and reflected laser beam, the reflectance can be obtained. When measuring the reflectance, the incidence angle is as close to 0° as possible, and is ~4.2° in the measurements. The reflectances of the non-absorbing films are 0.14, 0.33, 0.50, 0.90, 0.99, respectively. About 100 nm thick gold layer was deposited onto the surface of a slide by magnetron sputtering on an Auto Sputter Coater (108, Cressington, Watford, UK).
The sample was a diluted suspension of polystyrene (PS, 5 μm in diameter, Baseline, Tianjin, China). A tape is used to create a chamber for the PS beads sample and fluorescent dye between a cover glass and a microscope slide with or with coating. The fluorescent dye was Rhodamine B (RhB, 83689, Sigma-Aldrich, St. Louis, MO, USA) with a concentration of 5 mg/L. The experiments were performed at 20 °C. A 20 μL drop with PS suspension was dropped into a sample cell and then covered with a coverslip to reduce vaporization of the suspension.

2.2. Transverse Trapping Force Measurement Method

When the laser beam illuminated on the gold film, the intensity of the reflected beam was 88% of that of the incident beam, and about 12% of incident energy was absorbed and converted into heat that generated a local hot spot. There is an optothermal trap formed by the focused beam near the gold film. The optothermal trapping force Ftrap can be divided into two parts: optical trapping force FoS, and thermal trapping force Ft. The Ft includes a convective drag force Fcc and a thermophoretic force Fth. The optothermal trap exerts the forces on a microparticle to stop it leaving the trap center. When the microscope stage is moving at a velocity V, a viscous drag force Fd from liquid is exerted on the microparticle due to relative motion between the microparticle and liquid, and the trapped microparticle will leave the trap center. In Figure 1b, a rectangular coordinate system is built using the trap center as the origin. The transverse forces exerted on a trapped microparticle are shown in Figure 1b when the microparticle leaves the trap center. The force on the microparticle can be expressed below,
F = F d + F trap = F d + F oS + F t = F d + F oS + ( F cc + F th ) .
The optical trapping force FoS and convective drag force Fcc point to the trap center. The thermophoretic force Fth drives the microparticle to leave the trap center. when the particle is trapped, the sum of the forces on the particle is zero. When stage is moving, the trapped microparticle deviates from the trap center and both Fd and Ftrap change. If Fd is smaller than Ftrap, the microparticle cannot escape from the trap. As the speed of the stage reaches the escape speed Vc, the microparticle can escape from the trap [41]. At this time, the combined force on the particle is zero, and the Equation (1) becomes F = Fdc + Ftrap = 0. The corresponding optothermal trapping force can be obtained by
F trap = F dc = F cc F th + F oS .
The measurement of critical drag force Fdc is based on the critical speed Vc, which can be achieved by tracking the movement trajectory of non-trapped particles. Considering the wall effect of bottom substrate, critical drag force on the particle can be calculated with Faxen’s law [43]:
F dc = 6 π η a V c / 1 9 16 a h ,
where η is viscosity coefficient, a is radius of particle, h is distance of the center of trapped sphere from the bottom surface of sample cell, and Vc is the critical escape speed. In the experiments, the value of h was measured. After a particle was trapped and clearly imaged, the stage was moved upwards along the z-axis. When the laser beam focused on the bottom surface of sample cell, the stage stopped moving. The total moving distance is seemed as h, which is also called as trapping height here. The variation of viscosity coefficient with temperature is obtained from the reference [44].

3. Results and Discussion

In our experiments, the gold film can absorb and reflect the incident beam. A local hot spot was formed after the gold film absorbs the laser energy. When the laser power was greater than 60 mW, the local area of the gold film illuminated by focused laser beam will be damaged by laser heating and will become transparent to the incident beam. The optothermal trap will turn into a pure optical trap. Therefore, the measurement experiments of optothermal forces were performed at laser power not more than 60 mW.

3.1. Measurement of Temperature Increase

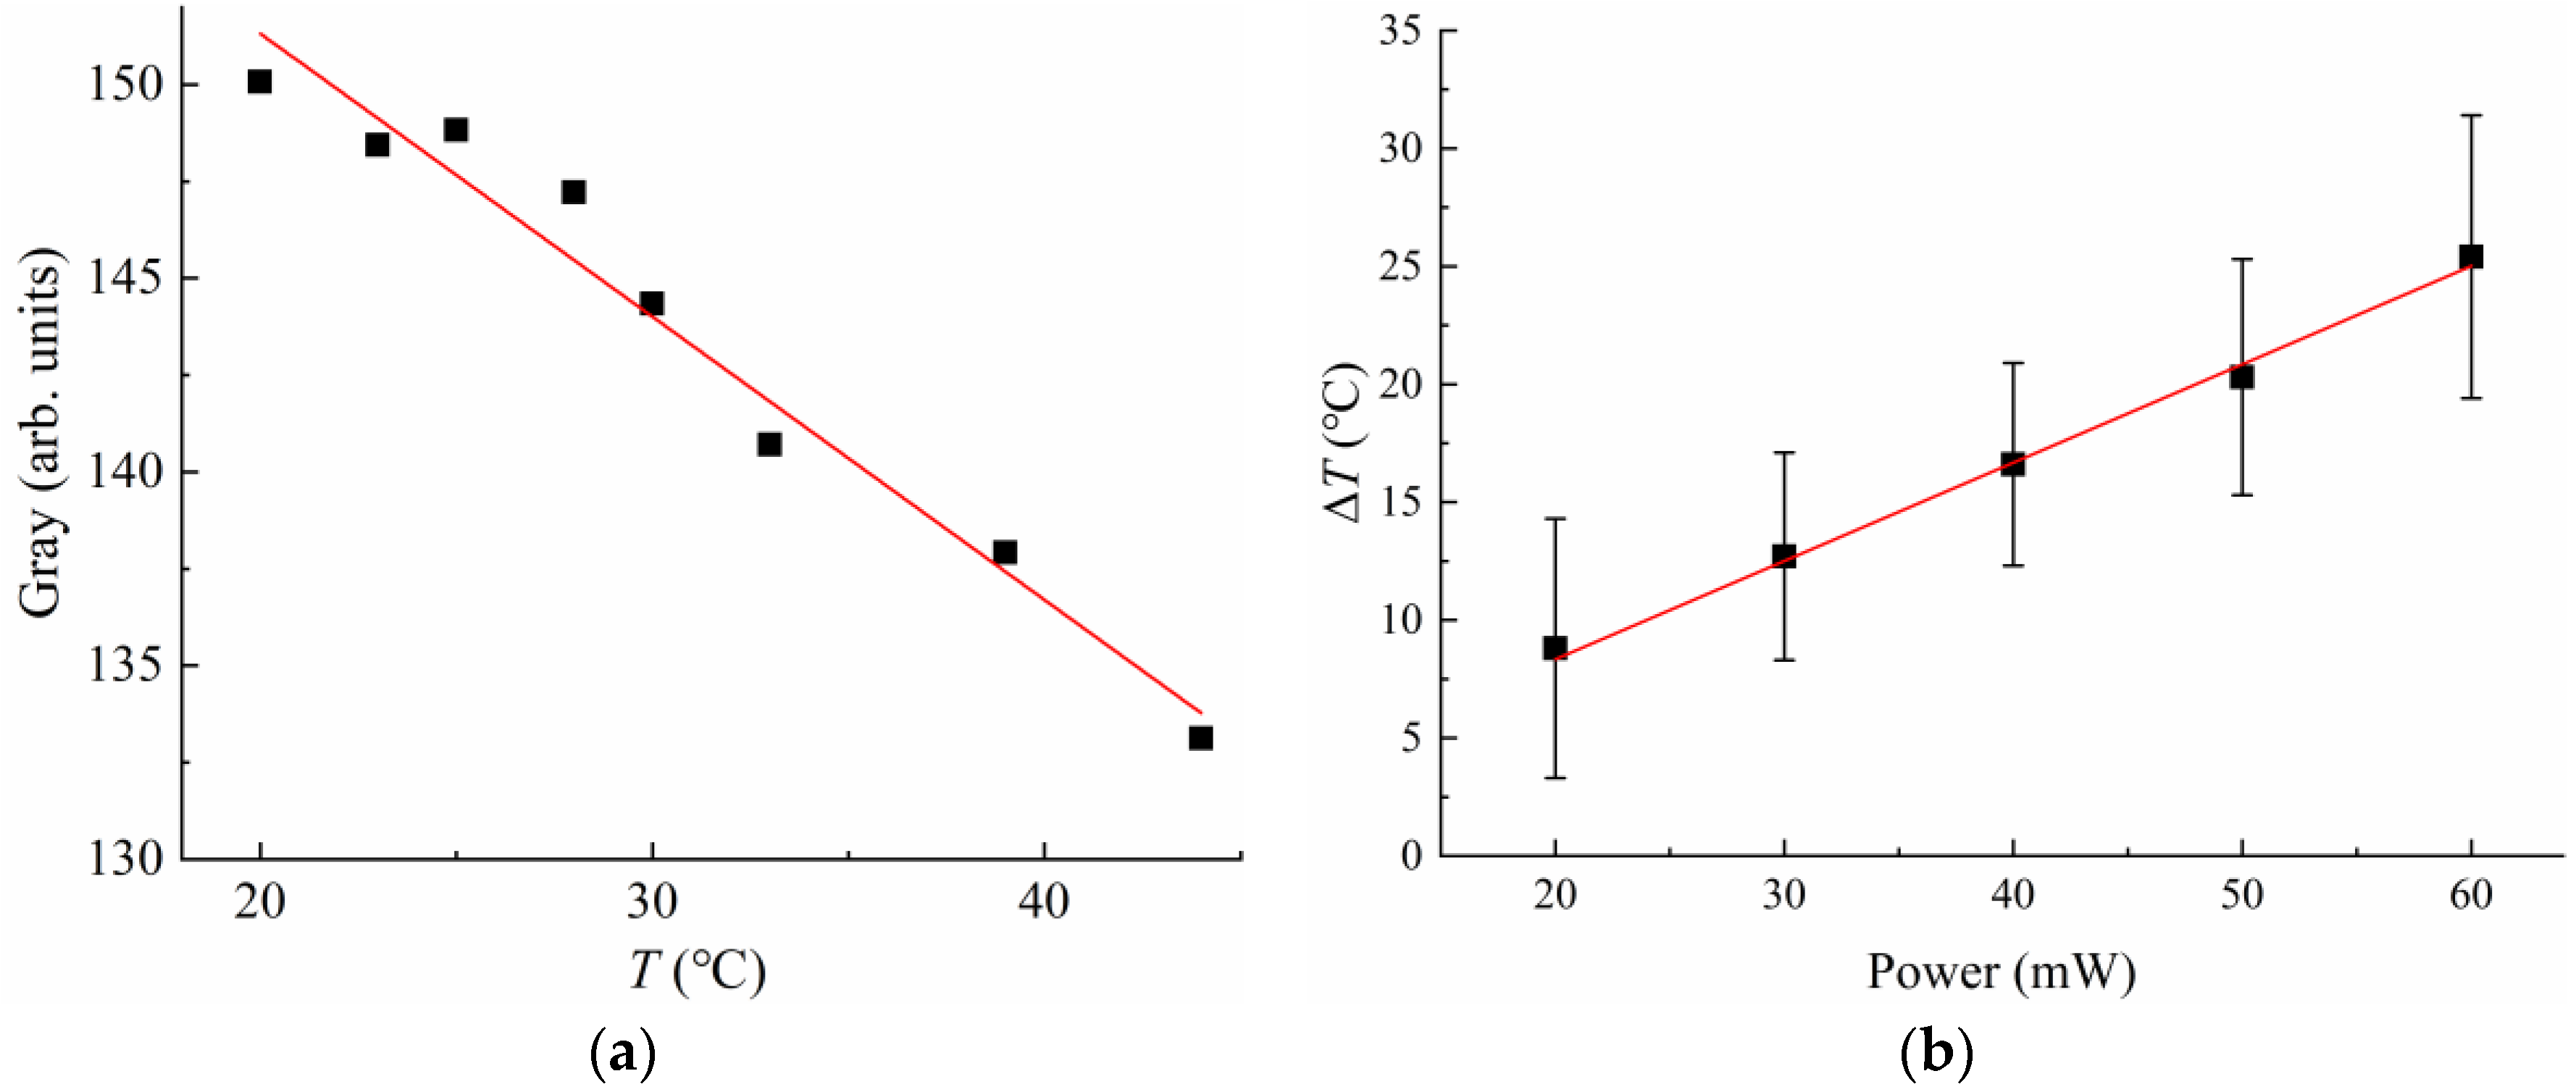
To investigate the thermal effects of optothermal trap, the temperature increase by laser heating should be obtained at first. The local temperature increase by laser heating was measured by fluorescence whose intensity is temperature dependent [45]. RhB was used as an indicator of temperature in the experiments because its intensity is strongly temperature dependent. The RhB can be excited by the light with wavelength of 553 nm and its emission wavelength is 627 nm. A drop of RhB solution was injected into a sample cell and excited by green module of a mercury lamp. The fluorescent signal was recorded by a CMOS camera, and the gray value was used to represent the intensity of emitting light. There were two steps to measure the temperature increase of local spot. First, variations of fluorescence intensity with temperature was calibrated without laser heating. Second, temperature increase by laser heating on the gold film was measured.
To calibrate the variation of fluorescence intensity with temperature, the RhB solution was dropped in a sealed sample cell with a slide, which was immersed in high temperature water of large volume. Then, the temperatures of water and fluorescence images were recorded simultaneously every time period. The temperature in the sample cell was deemed equal to the temperature of surrounding water, and decreased with the time. The average gray value was calculated of a circular area (8 μm in diameter) around the focused spot by the ImageJ software. When the temperature decreased from 50 °C to 20 °C, the relation between the temperature and average gray value was calibrated and shown in Figure 2a. It can be determined that the fluorescence intensity is inversely proportional to temperature. By liner fitting, it can be obtained that G = 0.73 T + 166, where G is average gray value, T is temperature.
To measure the temperature increase induced by laser heating of the gold film, the RhB solution of was injected into the sample cell with a gold film. The sample cell was no longer immersed in high temperature water of large volume. Next, when the laser was working, the fluorescence images were recorded at different laser power, respectively. The images were used to calculate the average gray values of the same area around the focus spot. Subtracting the average gray values at different laser power (20 mW ≤ P ≤ 60 mW) from average gray value at power of 0 mW, the variation of temperature increase with laser power can be determined according to the relation between the gray values and temperature in Figure 2a. The temperature increase induced by laser heating are shown in Figure 2b with different laser power. When laser power increased from 20 mW to 60 mW, the temperature increase increased from 8.8 ± 5.5 K to 25.4 ± 6.0 K. As shown in Figure 2b, the temperature increase increases linearly with power increasing, and the relevance to temperature increase and laser power is ΔT = 0.42 P.
There has been numerical simulation of the temperature increase induced by laser heating of gold film [46]. The results show that the temperature at the spot center can reach 50 °C when laser power is 10 mW. Our experimental results are consistent with their simulation result in magnitude, so we think that the measurements of the temperature increase are accurate.

3.2. Trapping Forces of Optical Trap and Optothermal Trap

To obtain the optical part of the trapping force of optothermal trap, there were two sample cells used in the experiments, which were prepared with non-absorbing reflective film (reflectivity 90%) and gold film (reflectivity 88%). Since the microparticles were trapped close to the substrate (h~3 μm), the Faxen correction to the drag force Fd felt by a sphere has considered in Equation (3). The longitudinal force is dramatically changed with trapping height [43], we did not study the longitudinal force because we could not accurately adjust the value of trapping height in our setup. The trapping force was measured in two sample cells with different power, and the results were shown in Figure 3. The symbols correspond to the average for ten experimental measurements at least for each power, whereas the error bars are statistical errors obtained from a single measurement. The blue inverted triangles (FoS) represent the data for optical trapping force of the standing-wave trap in the sample cell with the non-absorbing reflective film (R = 0.9); The orange circles (FAu) represent the data for optothermal trapping force in the sample cell with the gold film.
All the trapping forces increased with laser power increasing in the two sample cells. When power increased from 20 mW to 60 mW, optical trapping force raised from 4.9 ± 0.4 pN to 14.2 ± 1.1 pN, and optothermal trapping force raised from 5.8 ± 0.7 pN to 17.0 ± 1.4 pN. The reason for the forces increasing with laser power can be concluded to the increasing input laser energy. The optical trapping force of the standing-wave trap was linear to the laser power.
The FAu was greater than FoS at a same power. When power was 30 mW, FoS was 7.0 ± 1.3 pN, and FAu was 8.1 ± 1.1 pN. In the sample cell with non-absorbing reflective film, the laser is mainly absorbed by water, and the temperature increase is 1.4–1.9 °C/100 mW for 1064 nm laser [47]. Although the temperature increase has an effect on the optical trapping force [48,49], this effect can generally be ignored, and the convective drag force and the thermophoretic force can be ignored. Thus, Equation (2) becomes Ftrap = FoS. The trapping force in the sample cell without absorbing films was the optical trapping force of the standing-wave trap. When trapping in the sample cell with a gold film, the temperature increase generated by laser absorption can induce convective flow and thermophoresis, and the optothermal trapping force FAu can be expressed as:
F Au = F oS R + F cc F th ,
where R is the reflectivity of gold film. The convective drag force was greater than the thermophoretic force, so the optothermal trapping force was greater than optical trapping force, as in Figure 3.
When the laser power was less than 20 mW, the optothermal trapping was not stable. Sometimes the particles were trapped in the trap center, and sometimes the particles were trapped at the edge of the laser spot.

3.3. Thermal Forces of Optothermal Trap

Due to the gold film with absorbing and partial reflecting, the obtained FAu in Figure 3 is a combined force including optical force of a standing-wave trap and thermal force. In order to study the optical trapping force and thermal force of the optothermal trap, the two forces need to be separated. Here, the optical force close to the gold film FoS_Au can be deemed as the optical force close to a non-absorbing film with same reflectivity. Under the effect of hot source formed by laser absorption of gold film, the thermal convective flow and thermophoresis affected thermal force. The direction of thermophoretic force was from hot area to cold area, and convective drag force pointed to trap center. According to Equation (4), the thermal trapping force can be obtained by,
F t = F cc F th = F Au   F oS R .
Since the reflectivity of the gold film and the reflective film in Figure 3 are very close, we consider that the optical force close to gold film can be obtained by FoS_AuFoS (0.9). Then, the thermal trapping forces of the optothermal trap can be obtained by Equation (5). Figure 4 shows the relation between the thermal trapping force and temperature increase. The thermal trapping force increased with temperature increase increasing. When temperature increase raised from 8.8 K to 25.4 K, thermal trapping force raised from 1.0 pN to 2.7 pN.
By comparing FoS (R = 0.9) in Figure 3 and Ft in Figure 4, it can be seen that Ft increased as power increasing but was always smaller than FoS. The Ft on the particle near the gold film was combined with Fcc and Fth. As the temperature increase added, thermophoretic force increased, and the convective force is also affected by the temperature gradient as the thermophoretic force. At present, it is difficult to obtain the analytical solution for the combined effects of Fcc and Fth. Previous study has shown that the variation of Fcc and Fth with laser power is complex [9]. At low optical power, the Ft was dominant. When the laser power increased to a certain value, the Fcc was comparable with the Fth [9]. As the laser power continues to increase, the particles will be driven into the trap center. Previous studies have shown that a pure thermal trap can confine and trap particles, and thermal trapping force increased with increasing laser power [7]. Therefore, we think that as the laser power increased, the convective drag force was always larger than thermophoretic force within the temperature range in our experiments. Therefore, the thermal trapping force increased with increasing power as in Figure 4.
The thermophoretic force is determined with parameters such as temperature increase, and Soret coefficient of the particles [19]. Here, the Soret coefficient cannot be calibrated accurately. In addition, the convection is also affected by temperature increase, and thickness of sample cell, and cannot be described analytically in a confined space. Therefore, we do not establish a physical model of the thermal trapping force and performed fitting of the data of Ft in Figure 4.

3.4. Observation of Individual Action of Fcc and Fth

When the laser begins to heat the gold film, the particles close to the trap were pushed away from the heating spot at first. Then, the particles were dragged towards the trap center. However, if the gold film has not been damaged, the thermophoretic is always present, and the particle would receive a combination of thermophoretic and convective drag forces. The two forces cannot be distinguished from the force of a stable optothermal trap because the action of two forces is expressed as drag force of a steady flow. In order to observe the action of thermophoretic force and convective drag force separately, we took advantage of the difference in generation time between them. When laser power was low, the thermal motion of the particles cannot be observed noticeable. Here, laser beam with high power was focused on a gold film for observing the effects of thermophoresis and convection. When the thermal flows generated, the particle will move along with the thermal flows. In Figure 5, the microparticles were moving with the thermal flows, which were generated by a laser beam focusing on the gold film with 100 mW power.
In the experiment, the laser was turned on at 0 s. The optical trap trapped and kept a microparticle in trap center, and other surrounding particles were pushed away from the trap center due to the generation of thermophoresis as in Figure 5a,b. After 2 s, the repelled microparticles were all located at stable positions as in Figure 5c. During the process of pushing particles, the gold film has been damaged due to irradiation with high power laser, and the thermophoresis disappeared when the gold film was penetrated. The trapped particle was unstable and has been kicked away from the trap center along z-axis during the time. After the time t = 3.6 s, a convection formed in the sample cell, and driven the microparticles towards to trap center as in Figure 5d,e. A microparticle was trapped in the trap center by the optical trap as in Figure 5f.
By calculating the speed of particle moving with the thermal flows, we can estimate the corresponding thermal force separately with Equation (3). The values of the forces are the average for three experimental measurements at least, whereas the error bars are statistical errors obtained from a single measurement. The Fth dominated the diffusion of microparticle at first, and was 2.6 ± 0.4 pN. When the gold film was destroyed, the thermophoresis disappeared and the optothermal trap became a pure optical trap. The convective flow generated later, and dragged the microparticles moving towards the trap center. By tracking the particles before they moved into the action range of the optical trap (radius of 1 μm), Fcc can be calculated and was 5.1 ± 0.8 pN. Previous study [50] has shown that the speed of laser induced convection is on order of tens of μm/s when the temperature increase is on the order of tens of K. In our experiments, the Fcc of 5.1 pN corresponds to a flow speed of 60 μm/s, which is consistent in the magnitude. The temperature and other related parameters have changed between the beginning and the end of the experiment when the gold film has been damaged during the experiment. Therefore, the thermophoretic force obtain at the beginning and convective drag force at the end of the experiment cannot be used to calculate the thermal trapping force. Further research is needed to measure both the thermal forces accurately.
The thermophoresis generated by laser heating spreads the water outside the center. Since water is a continuous medium, the convection is formed pointing to the center after the thermophoresis in the tiny space. However, the gold film is damaged, and the thermophoresis stops, so the convection flow is not continuous. Only the particles on the right side of Figure 5 move by the convection, representing that the convection generated in this experiment flows from the right side to the center. However, in the experimental observations, the convection was not generated only in a fixed direction, but in all directions around the spot center, indicating that the initial convection flow may be possible in all directions. The factors influencing the preferential direction of convection generation are not clear and remain to be studied.

3.5. Optical Force of Standing-Wave Trap with Different Reflectivities

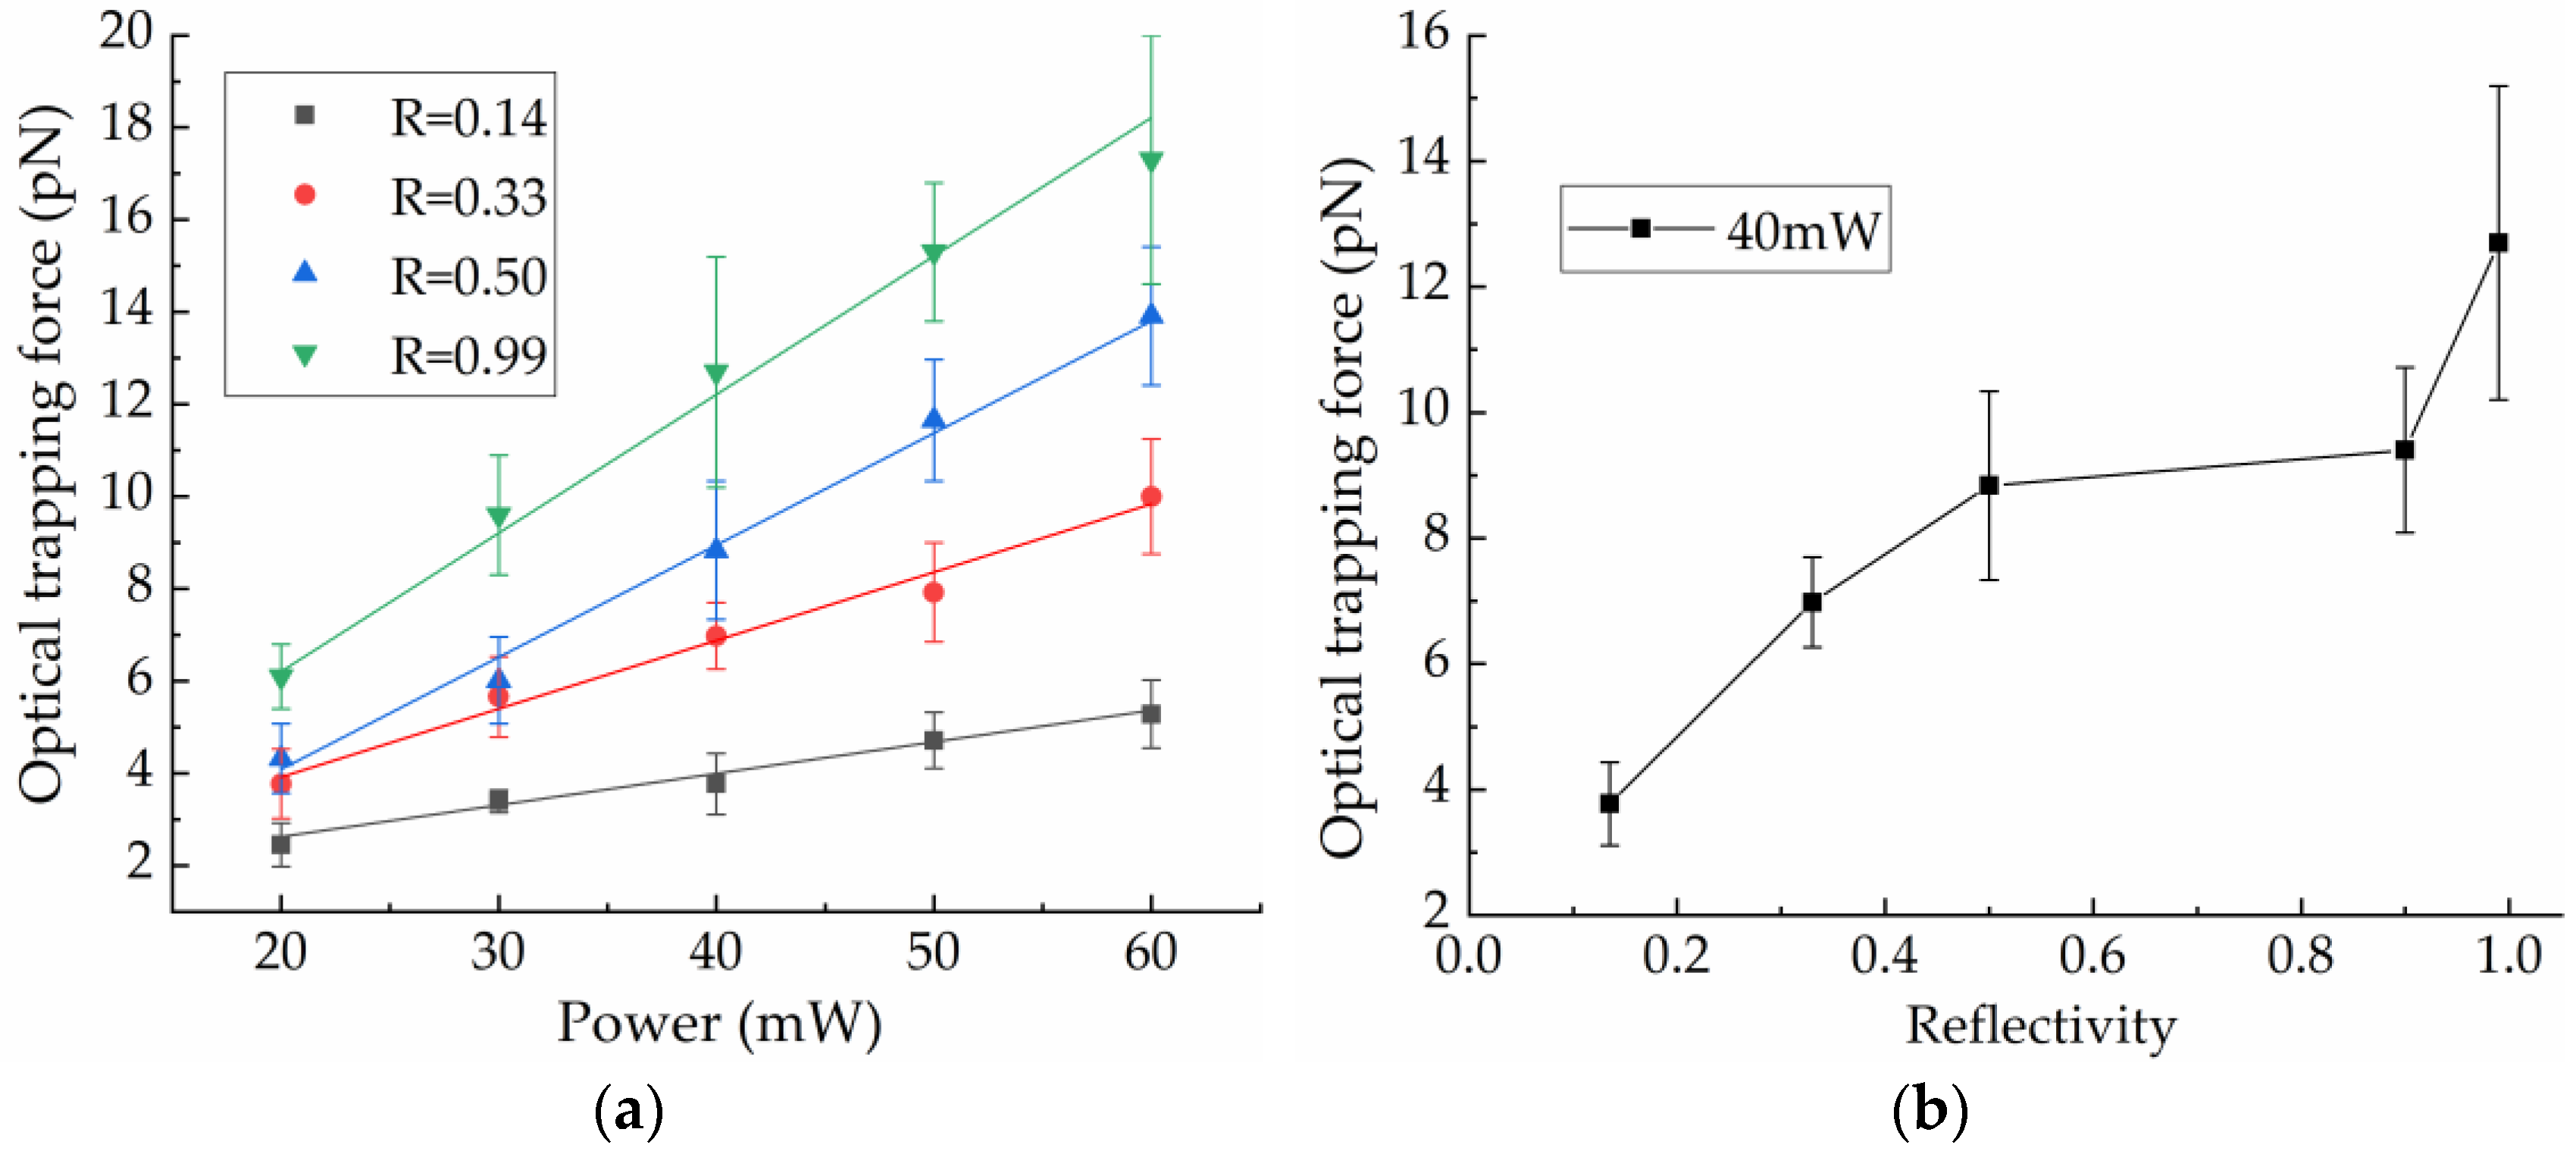
For other absorbing reflective films with different reflectivity, the optical trapping force does not increase linearly with increasing reflectance [31]. if one wants to obtain the thermal trapping force by using the Equation (5). It is necessary to use a non-absorbing film with same reflectance to the metal film for separating the FoS and Ft. Here we measured the FoS with films with different reflectivities, and the results are shown in the Figure 6a. The symbols correspond to the average for ten experimental measurements at least for each power, whereas the error bars are statistical errors obtained from a single measurement. In all the cells with non-absorbing films, the optical trapping forces increased with laser power increasing, and were linear to the laser power.
For a same laser power, the FoS increases with the reflectivity of the film. Figure 6b shows the case with a laser power of 40 mW. When the reflectivity raised from 0.14 to 0.99, FoS raised from 3.8 ± 0.7 pN to 12.7 ± 2.5 pN.
In this study, we have used similar reflectivity dielectric films to investigate the optical trapping force of stand-wave trap close to the gold film. This may introduce some deviation in the values of the optical force due to the difference in reflectance between the two surfaces. A more appropriate approach is to use a physical model, which can descript the relation between optical trapping force of the standing-wave traps and the reflectance. However, this requires complex calculation according to the experimental conditions [32,40]. The method here can easily be used to measure the optical and thermal trapping forces of an optothermal trap experimentally.
The method provided in this study is based on hydrodynamic viscous force to measure the trapping force. The hydrodynamic viscous force can drag the particles with whatever materials, and is always much larger than the Brown stochastic force, so the method is not limited to the particle with most types. A special case is light-absorbing particles. If the particles are light-absorbing particles, the laser heating of the gold film in the experiment will also heat the light-absorbing particles, which forms a local thermal gradient, and the method provided in this study is no longer applicable. In addition, for the nanoparticles, the drag force is small and cannot measured accurately. For measuring the drag force on nanoparticles, the laser power should be increased. However, the power increasing will damage the gold film (>60 mW), which limits the application in measuring the optothermal trapping force on the nanoparticles.

4. Conclusions

In this work, we investigate the transverse trapping forces of an optothermal trap formed by a focused laser beam in front of a gold film, which is an absorbing reflective film for the trapping laser. The optothermal trapping force is a result of combined optical and thermal forces. The trapping forces have been measured in the sample cells with different substrates for forces separation. The thermal and optical forces can be separated by measuring the trapping forces in absorbing and non-absorbing films. The results show that the optical trapping force increases linearly with laser power increasing of the optothermal trap. The thermal trapping force increases with laser power but is smaller than the optical trapping force.
Due to temperature increase on the local spot of gold film, the thermal force is generated with a combined effect of thermophoresis and convection. Further experiments were carried out to investigate the composition of thermal force using the generation time difference of flow. As the laser is turned on, the thermophoresis is generated at first. The microparticle can be trapped stably in the focused spot due to existing of the optical trapping force. The convective flow generates in the sample cell later, and drags the surrounding microparticles into the trap center again. The convective drag force and thermophoretic force are estimated. Our works here give a method for investigating the optical and thermal forces separately, which may be useful for understanding the mechanism of optothermal manipulation close to an absorbing reflective film.

Author Contributions

Conceptualization, M.-C.Z.; methodology, F.J. and M.-C.Z.; investigation, H.-D.W., W.B., B.Z. and B.-W.L.; data curation, H.-D.W.; writing—original draft preparation, H.-D.W.; writing—review and editing, M.-C.Z.; supervision, M.-C.Z.; funding acquisition, M.-C.Z. All authors have read and agreed to the published version of the manuscript.

Funding

This research was funded by the National Natural Science Foundation of China, grant No. 11874138.

Institutional Review Board Statement

Not applicable.

Informed Consent Statement

Not applicable.

Data Availability Statement

Data underlying the results presented in this paper are not publicly available at this time but may be obtained from the authors upon reasonable request.

Acknowledgments

The authors thank Junxi Zhang and Lijie Niu from School of Instrument Science and Opto-electronics Engineering, Hefei University of Technology for plating the Au films.

Conflicts of Interest

The authors declare no conflict of interest.

References

  1. Lin, L.; Hill, E.H.; Peng, X.; Zheng, Y. Optothermal Manipulations of Colloidal Particles and Living Cells. Acc. Chem. Res. 2018, 51, 1465–1474. [Google Scholar] [CrossRef]
  2. Liu, S.; Lin, L.; Sun, H.B. Opto-Thermophoretic Manipulation. ACS Nano 2021, 15, 5925–5943. [Google Scholar] [CrossRef] [PubMed]
  3. Chen, J.; Loo, J.F.C.; Wang, D.; Zhang, Y.; Kong, S.K.; Ho, H.P. Thermal Optofluidics: Principles and Applications. Adv. Opt. Mater. 2020, 8, 1900829. [Google Scholar] [CrossRef]
  4. Chen, Z.; Li, J.; Zheng, Y. Heat-Mediated Optical Manipulation. Chem. Rev. 2022, 122, 3122–3179. [Google Scholar] [CrossRef]
  5. Jiang, H.-R.; Wada, H.; Yoshinaga, N.; Sano, M. Manipulation of Colloids by a Nonequilibrium Depletion Force in a Temperature Gradient. Phys. Rev. Lett. 2009, 102, 208301. [Google Scholar] [CrossRef] [PubMed] [Green Version]
  6. Fränzl, M.; Cichos, F. Hydrodynamic Manipulation of Nano-Objects by Thermo-Osmotic Flows. Nat. Commun. 2022, 13, 656. [Google Scholar] [CrossRef] [PubMed]
  7. Zenteno-Hernandez, J.A.; Lozano, J.V.; Sarabia-Alonso, J.A.; Ramírez-Ramírez, J.; Ramos-García, R. Optical trapping in the presence of laser-induced thermal effects. Opt. Lett. 2020, 45, 3961–3964. [Google Scholar] [CrossRef] [PubMed]
  8. Zhong, M.-C.; Liu, A.-Y.; Ji, F. Opto-thermal oscillation and trapping of light absorbing particles. Opt. Express 2019, 27, 29730–29737. [Google Scholar] [CrossRef]
  9. Flores-Flores, E.; Torres-Hurtado, S.A.; Páez, R.; Ruiz, U.; Beltrán-Pérez, G.; Neale, S.L.; Ramirez-San-Juan, J.C.; Ramos-García, R. Trapping and manipulation of microparticles using laser-induced convection currents and photophoresis. Biomed. Opt. Express 2015, 6, 4079–4087. [Google Scholar] [CrossRef] [Green Version]
  10. Frueh, J.; Rutkowski, S.; Si, T.; Ren, Y.-X.; Gai, M.; Tverdokhlebov, S.I.; Qiu, G.; Schmitt, J.; He, Q.; Wang, J. Direct measurement of thermophoretic and photophoretic force acting on hot micromotors with optical tweezers. Appl. Surf. Sci. 2021, 549, 149319. [Google Scholar] [CrossRef]
  11. Frueh, J.; Rutkowski, S.; Si, T.; Gai, M.; Gao, C.; Tverdokhlebov, S.I.; Qiu, G.; Schmitt, J.; He, Q.; Ren, Y.-X.; et al. Propulsion Mechanisms of Light-Driven Plasmonic Colloidal Micromotors. Adv. Photonics Res. 2021, 3, 2100189. [Google Scholar] [CrossRef]
  12. Zhong, M.-C.; Wang, Z.-Q.; Li, Y.-M. Oscillations of absorbing particles at the water-air interface induced by laser tweezers. Opt. Express 2017, 25, 2481–2488. [Google Scholar] [CrossRef]
  13. Lin, L.; Peng, X.; Mao, Z.; Li, W.; Yogeesh, M.N.; Rajeeva, B.B.; Perillo, E.P.; Dunn, A.K.; Akinwande, D.; Zheng, Y. Bubble-Pen Lithography. Nano Lett. 2016, 16, 701–708. [Google Scholar] [CrossRef]
  14. Li, B.-W.; He, J.-W.; Bai, W.; Wang, H.-D.; Ji, F.; Zhong, M.-C. An approach of bubble generation and manipulation by using the photothermal effects of laser irradiation on light absorbing particles. Rev. Sci. Instrum. 2021, 92, 114902. [Google Scholar] [CrossRef] [PubMed]
  15. Ortega-Mendoza, J.G.; Sarabia-Alonso, J.A.; Zaca-Morán, P.; Padilla-Vivanco, A.; Toxqui-Quitl, C.; Rivas-Cambero, I.; Ramirez-Ramirez, J.; Torres-Hurtado, S.A.; Ramos-García, R. Marangoni force-driven manipulation of photothermally-induced microbubbles. Opt. Express 2018, 26, 6653–6662. [Google Scholar] [CrossRef]
  16. Sarabia-Alonso, J.A.; Ortega-Mendoza, J.G.; Mansurova, S.; Muñoz-Pérez, F.M.; Ramos-García, R. 3D trapping of microbubbles by the Marangoni force. Opt. Lett. 2021, 46, 5786–5789. [Google Scholar] [CrossRef]
  17. Yan, X.; Xu, J.; Meng, Z.; Xie, J.; Wang, H. A New Mechanism of Light-Induced Bubble Growth to Propel Microbubble Piston Engine. Small 2020, 16, 2001548. [Google Scholar] [CrossRef]
  18. Chen, Y.; Yang, J.; Wu, J.; Li, Z.; Liu, S.; Zhong, H.; Zhou, R.; Luo, A.; Ho, H.P.; He, S.; et al. Generation and manipulation of oil-in-water micro-droplets by confined thermocapillary microvortices. Opt. Lett. 2020, 45, 1998–2001. [Google Scholar] [CrossRef] [PubMed]
  19. Helden, L.; Eichhorn, R.; Bechinger, C. Direct measurement of thermophoretic forces. Soft Matter 2015, 11, 2379–2386. [Google Scholar] [CrossRef] [Green Version]
  20. Duhr, S.; Braun, D. Thermophoretic depletion follows Boltzmann distribution. Phys. Rev. Lett. 2006, 96, 168301. [Google Scholar] [CrossRef] [Green Version]
  21. Peng, X.; Chen, Z.; Kollipara, P.S.; Liu, Y.; Fang, J.; Lin, L.; Zheng, Y. Opto-thermoelectric microswimmers. Light Sci. Appl. 2020, 9, 141. [Google Scholar] [CrossRef] [PubMed]
  22. Lin, L.; Kollipara, P.S.; Kotnala, A.; Jiang, T.; Liu, Y.; Peng, X.; Korgel, B.A.; Zheng, Y. Opto-thermoelectric pulling of light-absorbing particles. Light Sci. Appl. 2020, 9, 34. [Google Scholar] [CrossRef] [PubMed] [Green Version]
  23. Kotnala, A.; Kollipara, P.S.; Zheng, Y. Opto-thermoelectric speckle tweezers. Nanophotonics 2020, 9, 927–933. [Google Scholar] [CrossRef] [PubMed] [Green Version]
  24. Ren, Y.-X.; Zeng, X.; Zhou, L.-M.; Kong, C.; Mao, H.; Qiu, C.-W.; Tsia, K.K.; Wong, K.K.Y. Photonic Nanojet Mediated Backaction of Dielectric Microparticles. ACS Photonics 2020, 7, 1483–1490. [Google Scholar] [CrossRef]
  25. Shvedov, V.G.; Hnatovsky, C.; Eckerskorn, N.; Rode, A.V.; Krolikowski, W. Polarization-sensitive photophoresis. Appl. Phys. Lett. 2012, 101, 051106. [Google Scholar] [CrossRef]
  26. Gong, Z.; Pan, Y.-L.; Wang, C. Optical configurations for photophoretic trap of single particles in air. Rev. Sci. Instrum. 2016, 87, 103104. [Google Scholar] [CrossRef]
  27. Miniewicz, A.; Quintard, C.; Orlikowska, H.; Bartkiewicz, S. On the origin of the driving force in the Marangoni propelled gas bubble trapping mechanism. Phys. Chem. Chem. Phys. 2017, 19, 18695–18703. [Google Scholar] [CrossRef]
  28. Qian, Y.; Neale, S.L.; Marsh, J.H. Microparticle manipulation using laser-induced thermophoresis and thermal convection flow. Sci. Rep. 2020, 10, 19169. [Google Scholar] [CrossRef]
  29. Zhang, Y.; Tang, X.; Zhang, Y.; Liu, Z.; Yang, X.; Zhang, J.; Yang, J.; Yuan, L. Optical attraction of strongly absorbing particles in liquids. Opt. Express 2019, 27, 12414–12423. [Google Scholar] [CrossRef]
  30. Kumari, P.; Dharmadhikari, J.A.; Dharmadhikari, A.K.; Basu, H.; Sharma, S.; Mathur, D. Optical trapping in an absorbing medium: From optical tweezing to thermal tweezing. Opt. Express 2012, 20, 4645–4652. [Google Scholar] [CrossRef]
  31. Jonáš, A.; Zemánek, P.; Florin, E.-L. Single-beam trapping in front of reflective surfaces. Opt. Lett. 2001, 26, 1466–1468. [Google Scholar] [CrossRef] [PubMed] [Green Version]
  32. Zemánek, P.; Jonáš, A.; Šrámek, L.; Liška, M. Optical trapping of Rayleigh particles using a Gaussian standing wave. Opt. Commun. 1998, 151, 273–285. [Google Scholar] [CrossRef]
  33. Zemánek, P.; Jonáš, A.; Šrámek, L.; Liška, M. Optical trapping of nanoparticles and microparticles by a Gaussian standing wave. Opt. Lett. 1999, 24, 1448–1450. [Google Scholar] [CrossRef] [PubMed]
  34. Jákl, P.; Šerý, M.; Ježek, J.; Liška, M.; Zemánek, P. Axial optical trap stiffness influenced by retro-reflected beam. J. Opt. A Pure Appl. Opt. 2007, 9, S251–S255. [Google Scholar] [CrossRef]
  35. Shilkin, D.A.; Lyubin, E.V.; Soboleva, I.V.; Fedyanin, A.A. Trap position control in the vicinity of reflecting surfaces in optical tweezers. JETP Lett. 2014, 98, 644–647. [Google Scholar] [CrossRef]
  36. Chvatal, L.; Brzobohaty, O.; Zemanek, P. Binding of a pair of Au nanoparticles in a wide Gaussian standing wave. Opt. Rev. 2015, 22, 157–161. [Google Scholar] [CrossRef]
  37. Wu, M.Y.; Ling, D.X.; Ling, L.; Li, W.; Li, Y.Q. Stable optical trapping and sensitive characterization of nanostructures using standing-wave Raman tweezers. Sci. Rep. 2017, 7, 42930. [Google Scholar] [CrossRef] [Green Version]
  38. Donato, M.G.; Brzobohatý, O.; Simpson, S.H.; Irrera, A.; Leonardi, A.A.; Lo Faro, M.J.; Svak, V.; Maragò, O.M.; Zemánek, P. Optical Trapping, Optical Binding, and Rotational Dynamics of Silicon Nanowires in Counter-Propagating Beams. Nano Lett. 2019, 19, 342–352. [Google Scholar] [CrossRef]
  39. Rafferty, A.; Preston, T.C. Trapping positions in a dual-beam optical trap. J. Appl. Phys. 2021, 130, 183105. [Google Scholar] [CrossRef]
  40. Zemánek, P.; Jonáš, A.; Jákl, P.; Ježek, J.; Šerý, M.; Liška, M. Theoretical comparison of optical traps created by standing wave and single beam. Opt. Commun. 2003, 220, 401–412. [Google Scholar] [CrossRef]
  41. Simmons, R.M.; Finer, J.T.; Chu, S.; Spudich, J.A. Quantitative measurements of force and displacement using an optical trap. Biophys. J. 1996, 70, 1813–1822. [Google Scholar] [CrossRef] [Green Version]
  42. Zhong, M.-C.; Liu, A.-Y.; Zhu, R. Optical assembling of micro-particles at a glass-water interface with diffraction patterns caused by the limited aperture of objective. Appl. Sci. 2018, 8, 1522. [Google Scholar] [CrossRef] [Green Version]
  43. Happel, J.; Brenner, H. Low Reynolds Number Hydrodynamics; Martinus Nijhoff Publishers: The Hague, The Netherlands, 1983. [Google Scholar]
  44. Lide, D.R. CRC Handbook of Chemistry and Physics, 82nd ed.; CRC Press LLC: Boca Raton, FL, USA, 2002. [Google Scholar]
  45. Šiler, M.; Ježek, J.; Jákl, P.; Pilát, Z.; Zemánek, P. Direct measurement of the temperature profile close to an optically trapped absorbing particle. Opt. Lett. 2016, 41, 870–873. [Google Scholar] [CrossRef]
  46. Xiang, Y.; Tang, X.; Min, C.; Rui, G.; Kuai, Y.; Lu, F.; Wang, P.; Ming, H.; Zhan, Q.; Yuan, X.; et al. Optical Trapping with Focused Surface Waves. Ann. Phys. 2020, 532, 1900497. [Google Scholar] [CrossRef]
  47. Mao, H.B.; Arias-Gonzalez, J.R.; Smith, S.B.; Tinoco, I.; Bustamante, C. Temperature control methods in a laser tweezers system. Biophys. J. 2005, 89, 1308–1316. [Google Scholar] [CrossRef] [Green Version]
  48. Lu, D.; Gámez, F.; Haro-González, P. Temperature Effects on Optical Trapping Stability. Micromachines 2021, 12, 954. [Google Scholar] [CrossRef]
  49. Hosokawa, C.; Tsuji, T.; Kishimoto, T.; Okubo, T.; Kudoh, S.N.; Kawano, S. Convection Dynamics Forced by Optical Trapping with a Focused Laser Beam. J. Phys. Chem. C 2020, 124, 8323–8333. [Google Scholar] [CrossRef]
  50. Kotnala, A.; Kollipara, P.S.; Li, J.; Zheng, Y. Overcoming Diffusion-Limited Trapping in Nanoaperture Tweezers Using Opto-Thermal-Induced Flow. Nano Lett. 2020, 20, 768–779. [Google Scholar] [CrossRef]
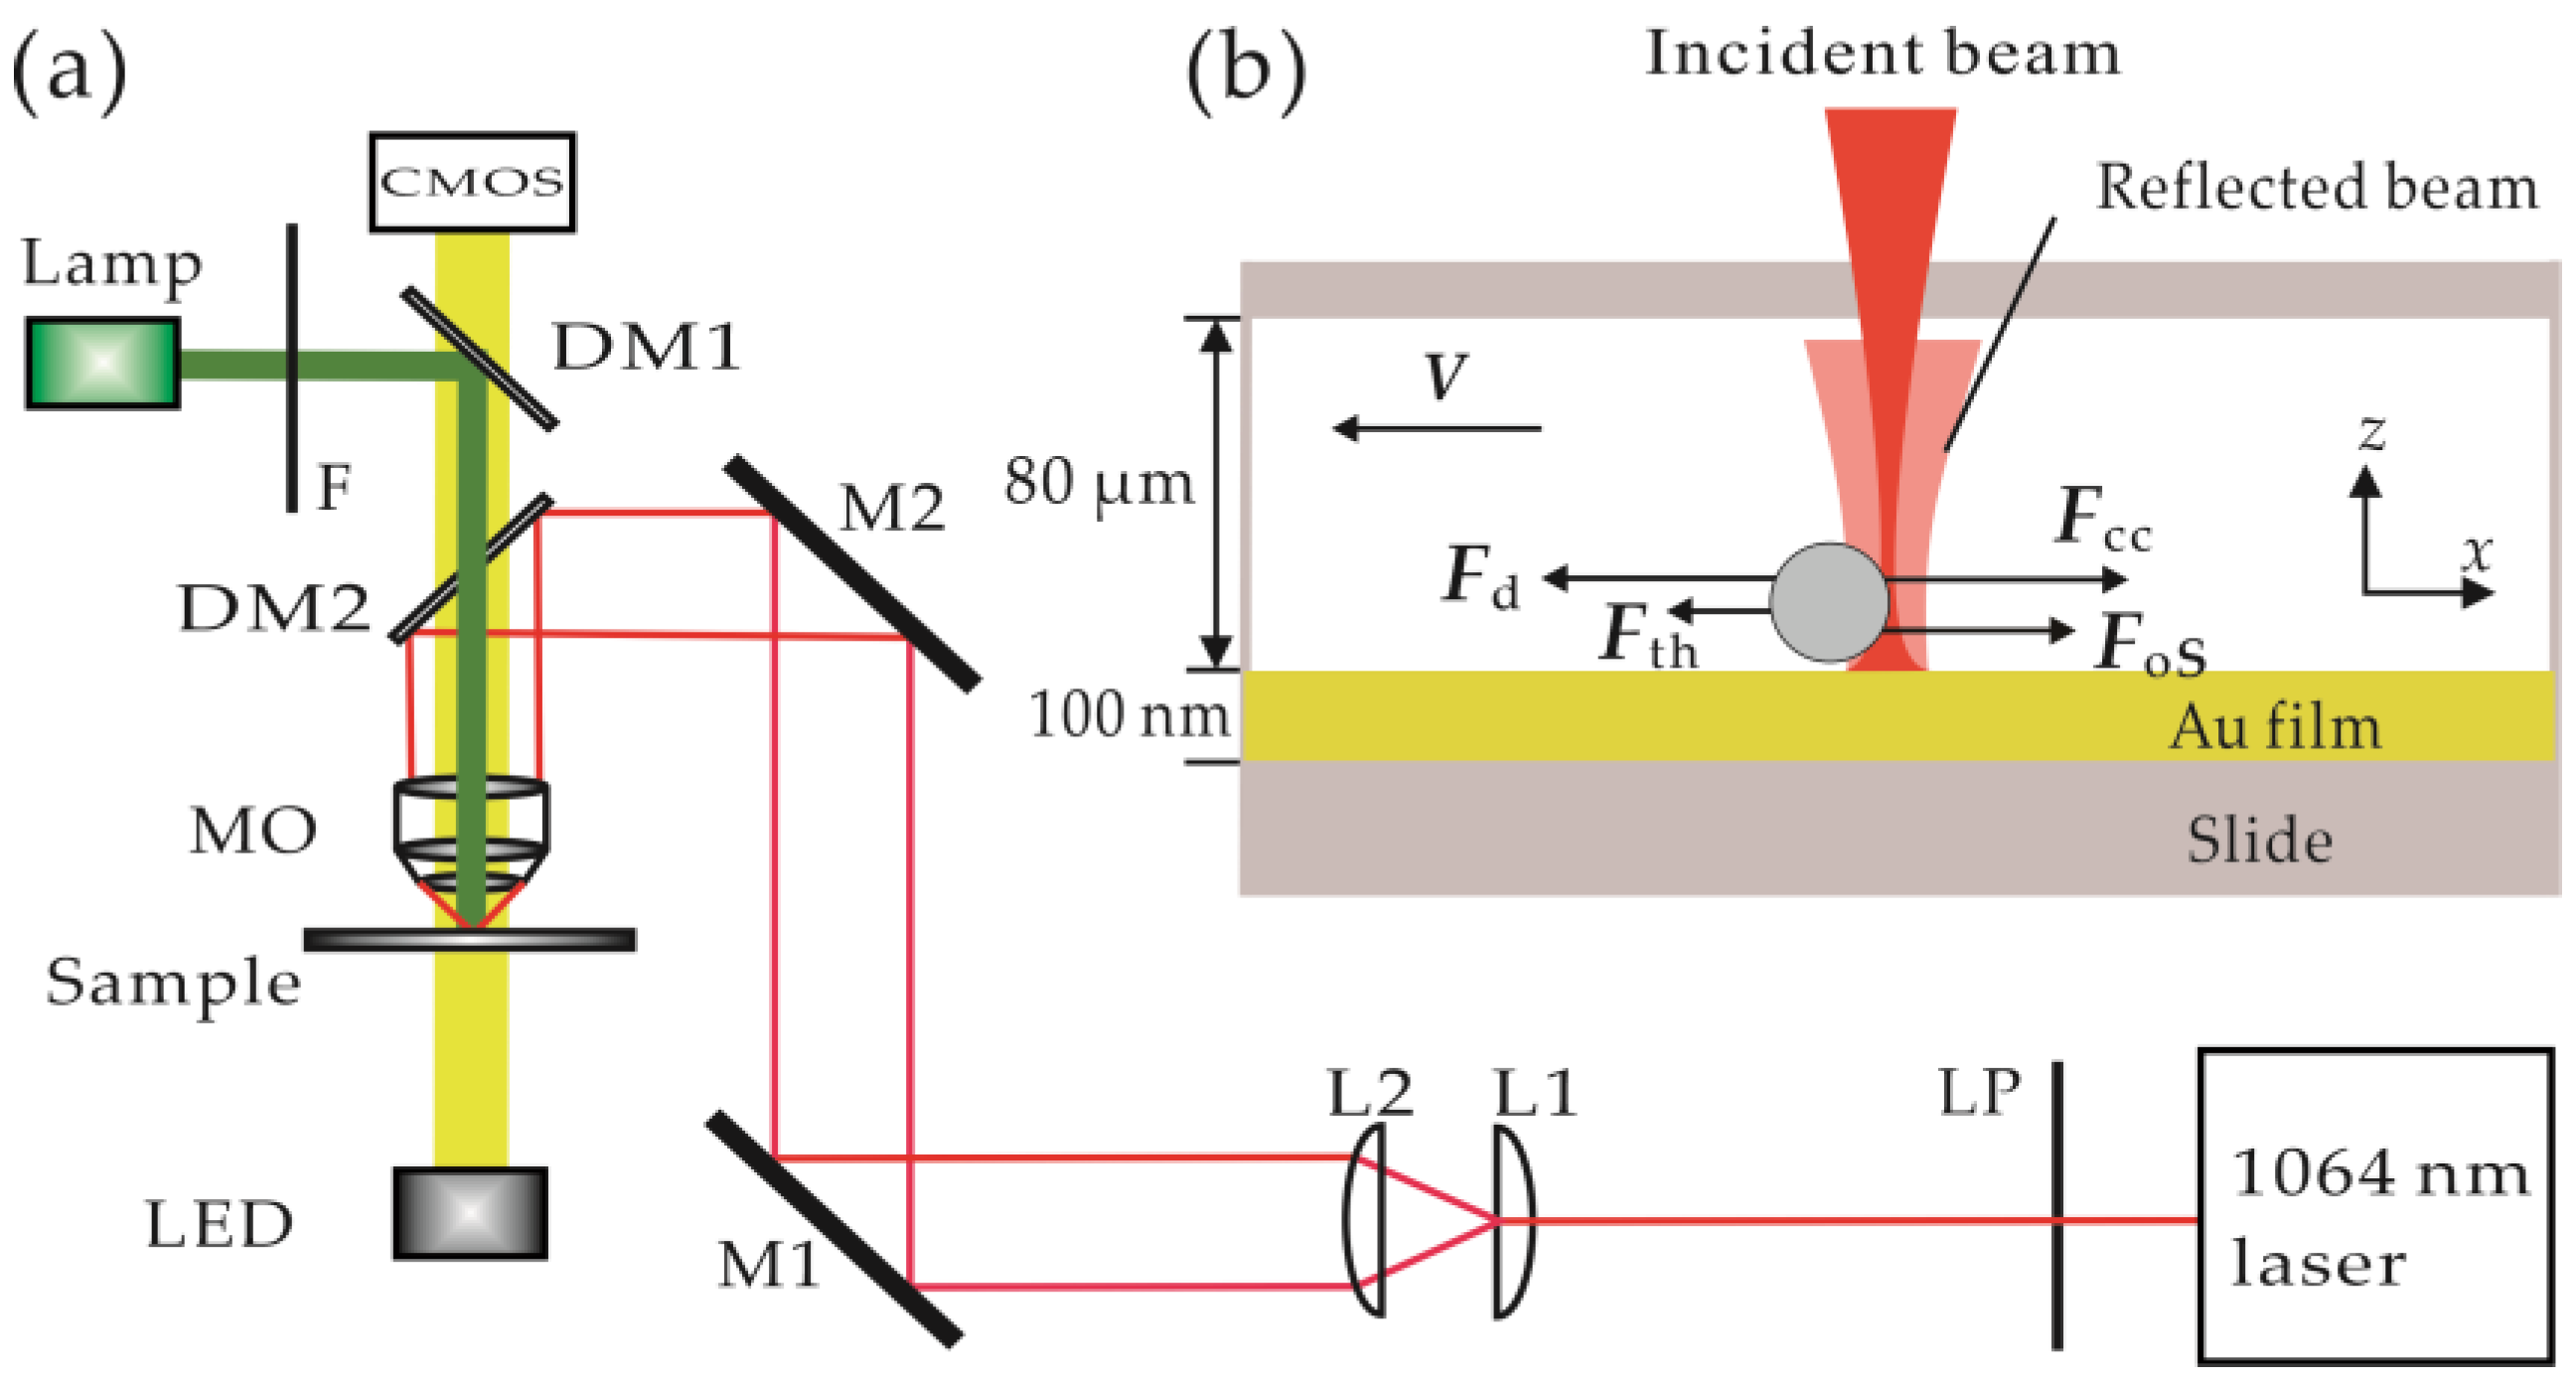
Figure 1. (a) Experimental setup. Trapping part (red): trapping laser beam is expanded and focused into the sample volume by a microscope objective. Fluorescence part (green): light of a mercury lamp is filtered and focused into the sample volume. Emitted fluorescent light is collected by the same microscope objective and recorded by a CMOS camera. Imaging part (yellow): the sample is illuminated by a LED and imaged by the same CMOS camera. LP, liner polarizer; L1-L2, lens; M1-M2, mirrors; F, Filter; DM1-DM2, dichroic mirror; MO, microscope objective; CMOS, CMOS camera; (b) Schematic description of optothermal trap and forces on a microparticle close to the gold film. The laser is focused before being reflected by the gold film. The optothermal trap is combined with an optical trap and a thermal trap. When the stage is moving at a velocity V, a viscous drag force Fd from liquid is exerted on the microparticle. Fcc, convective drag force; FoS, optical trapping force of standing-wave trap; Fth, thermophoretic force.
Photonics 09 00473 g001
Figure 2. (a) Gray value at different temperature; (b) Temperature increases with different power.
Photonics 09 00473 g002
Figure 3. Transverse trapping force as a function of laser power at two different sample cells, which constructed with a non-absorbing reflective film (R = 0.9), or a gold film as the substrates, respectively. FoS, optical trapping force of stand-wave trap; FAu, optothermal trapping force close to a gold film.
Photonics 09 00473 g003
Figure 4. Thermal trapping force Ft of the optothermal trap close to a gold film.
Photonics 09 00473 g004
Figure 5. Particles motion under thermophoretic force and convective drag force. (a,b) A particle is trapped in trap center and the surrounding particles are pushed away from trap center by thermophoretic force; (c) Repelled particles stop moving; (d,e) Particles are driven to trap center by convective drag force. (f) A particle is trapped. Scale bar, 10 μm. Red dot indicates the laser focal spot. Red arrow indicates the moving direction of microparticle.
Photonics 09 00473 g005
Figure 6. (a) The relationship between optical trapping force and laser power close to reflective films with different reflectivities; (b) Optical trapping force at different reflectivity when power is 40 mW.
Photonics 09 00473 g006
Publisher’s Note: MDPI stays neutral with regard to jurisdictional claims in published maps and institutional affiliations.