Article

Specific Phase Modulation with Dynamic Variable Spectral Width of Nanosecond Optical Pulse in High-Power Lasers

1
Key Laboratory of High Power Laser and Physics, Shanghai Institute of Optics and Fine Mechanics, Chinese Academy of Sciences, Shanghai 201800, China
2
Center of Materials Science and Optoelectronics Engineering, University of the Chinese Academy of Sciences, Beijing 100049, China
*
Author to whom correspondence should be addressed.
Members of DCI Joint Team.
Photonics 2022, 9(8), 586; https://doi.org/10.3390/photonics9080586
Submission received: 23 July 2022 / Revised: 14 August 2022 / Accepted: 16 August 2022 / Published: 18 August 2022
(This article belongs to the Special Issue High Power Laser: Theory and Applications)

Abstract

:
High-power laser pulse transmitted by phase modulation with certain spectrum distribution can suppress the buildup of transverse stimulated Brillouin scattering (TSBS) in large aperture laser optics and smooth the speckle pattern illuminating the target by spectral smoothing dispersion (SSD). In this paper, based on the requirements of the double-cone ignition scheme including simultaneously realizing that the focal spot is variable at different times in size and the spatial intensity distribution is uniform, we propose a novel phase modulation technology with a rapid variable modulation index in the nanosecond scale instead of utilizing conventional constant amplitude sinusoidal curve. The relevant simulation results indicate that the proposed technology can realize the dynamic nanosecond spectral distribution and the trend correlates with the variety of modulation index. Particularly, we indirectly measure this rapid changeable spectral distribution based on the mapping relationship between frequency and time domain. We believe that the new technology is expected to meet the requirements of SSD and the dynamic focus simultaneously.

1. Introduction

A high-power laser driver is an important component of an inertial confinement fusion (ICF) laser system, composed of a front-end, preamplifier, main amplifier, target, and other control and diagnostic systems [1,2]. In order to suppress the stimulated Brillouin scattering (SBS) effect in fused silica large aperture optical elements under the working system of high-power narrow-band laser pulse, it is necessary to use phase modulation technology in the front-end of the system to redistribute the single longitudinal mode laser energy to multiple modes whose mode spacing exceeds the SBS bandwidth, making the peak power of each mode below the SBS threshold, thus avoiding strongly damaging these optics [3,4,5,6]. Generally, the spectral width needs to be broadened to 0.1~0.15 nm. Besides this, the process of ICF implosion imposes a series of requirements on the uniformity of irradiation to the target surface, leading to a variety of beam uniformity techniques, including SSD [7,8]. The core of SSD is the high-frequency phase modulation of the laser pulse in the front-end of the system, which can spectrally broaden the incident laser, and then shoots the broadened laser into the dispersive grating. Different times of sinusoidal modulation correspond to diverse spectral frequencies, so the light will be emitted at different angles under the action of the dispersive grating. During the modulation, the emitted light will dither periodically to form the focal spot, which will be uniformly smooth [9]. Hence, during the optical pulse duration, the focal spot will move slightly but rapidly and would be considered as smoothed by the plasma [10,11,12]. Given that the temporal shape of the laser pulse must be perfectly controlled to ensure an optimal laser-target interaction, the required spectral broadening on the Shenguang-II (SG-II) is generated by phase modulation, so that the beam intensity is not affected.
As we know, phase modulation with a constant amplitude sinusoidal curve is a common strategy in high-power laser drivers currently. While, according to the diversity of physical processes, it is necessary to use diverse physical parameters in different time periods to further improve the dynamic regulating ability of spectral width and focal spot [13]. The front-end of the OMEGA device has diverse modulation requirements at different points in time, that is, variable spectral widths [14,15], but this is achieved through the temporal and spatial stitching of the light beams and the optical path system is relatively complex. Therefore, in order to further realize the function of dynamic spectral width changing with time; it may need necessary to modify the modulation signal instead of using the conventional constant amplitude sinusoidal signal to improve the dynamic regulating ability.
In this paper, we present a novel phase modulation technology with a rapid time-varying modulation index function to obtain dynamic spectral distribution. The relevant simulation results indicate that the specific phase modulation function can realize the dynamic change of spectral width in the nanosecond order and a result of far-field focal spot continuous variation with radius change of 40 μm after SSD and CPP corresponding to the contributions of spectral widths from 0.5 nm to 0.1 nm, respectively. In the experiments, to eliminate the limitation that the optical spectrum analyzer (OSA) cannot respond to dynamic changes in the nanosecond scale, we establish the mapping relationship between frequency and time domain to indirectly measure and quantify the dynamic variable spectral distribution. The proposed method can meet the requirements of variable spectral widths at different times without beam splitting modulation. Meanwhile, specific phase modulation can also increase the real-time regulation ability of the spectrum and increase the regulation dimension of the beam. In addition, our intuition is that the proposed technology of rapid variable spectral distribution may be referable for the related research on dynamic focusing, like the double-cone ignition scheme [16].

2. Principle and System Structure

2.1. Principle of Constant Amplitude Phase Modulation

The electro-optic effect can affect the optical properties of crystals by changing the applied electric field. In this paper, a lithium niobate waveguide modulator is used for phase modulation. The common cutting methods for lithium niobate optical waveguides are X-cut-Y-transmission and Z-cut-Y-transmission, for example, Z-cut-Y-transmission means that the lithium niobate waveguide modulator cuts in the Z direction and the light travels in the Y direction. The electrode is located below the optical waveguide and is connected to the microwave source. Phase-modulated pulses are generated based on the electro-optical crystals by changing the refractive index of the crystal through an applied electric field, which in turn changes the phase of the transmitted laser [17]. Traditionally, the spectrum is broadened by means of constant amplitude sinusoidal phase modulation. It is characterized by two parameters: the frequency fm and the modulation index m, which is the amplitude of the sinusoidal function expressed in radians. The optical field can be expressed as:
E o u t = A 0 e x p [ i m sin ( 2 π f m t ) + i φ 0 ]
where A0 is the slowly varying intensity; φ0 is initial phase; f(t) = m sin(2πfmt) is the phase modulation signal. Assuming that the phase modulation signal is a periodic signal, the corresponding optical spectrum consists of fm spaced Dirac peaks, the spectrum of the pulse can be obtained in the form of a Bessel function:
E m ˜ = n = + J n ( m ) δ ( f n f m )
where Jn (m) is the nth Bessel function. Power in the spectral domain can be expressed as:
P f = | E m ˜ | 2 = n = + | J n ( m ) | 2 δ ( f n f m )
Phase modulation delivers pulse energy at different wavelengths, and according to Carlson’s theory, the spectrum has infinite width, but most of the signal energy is contained within 2(m + 1)fm [18,19,20].

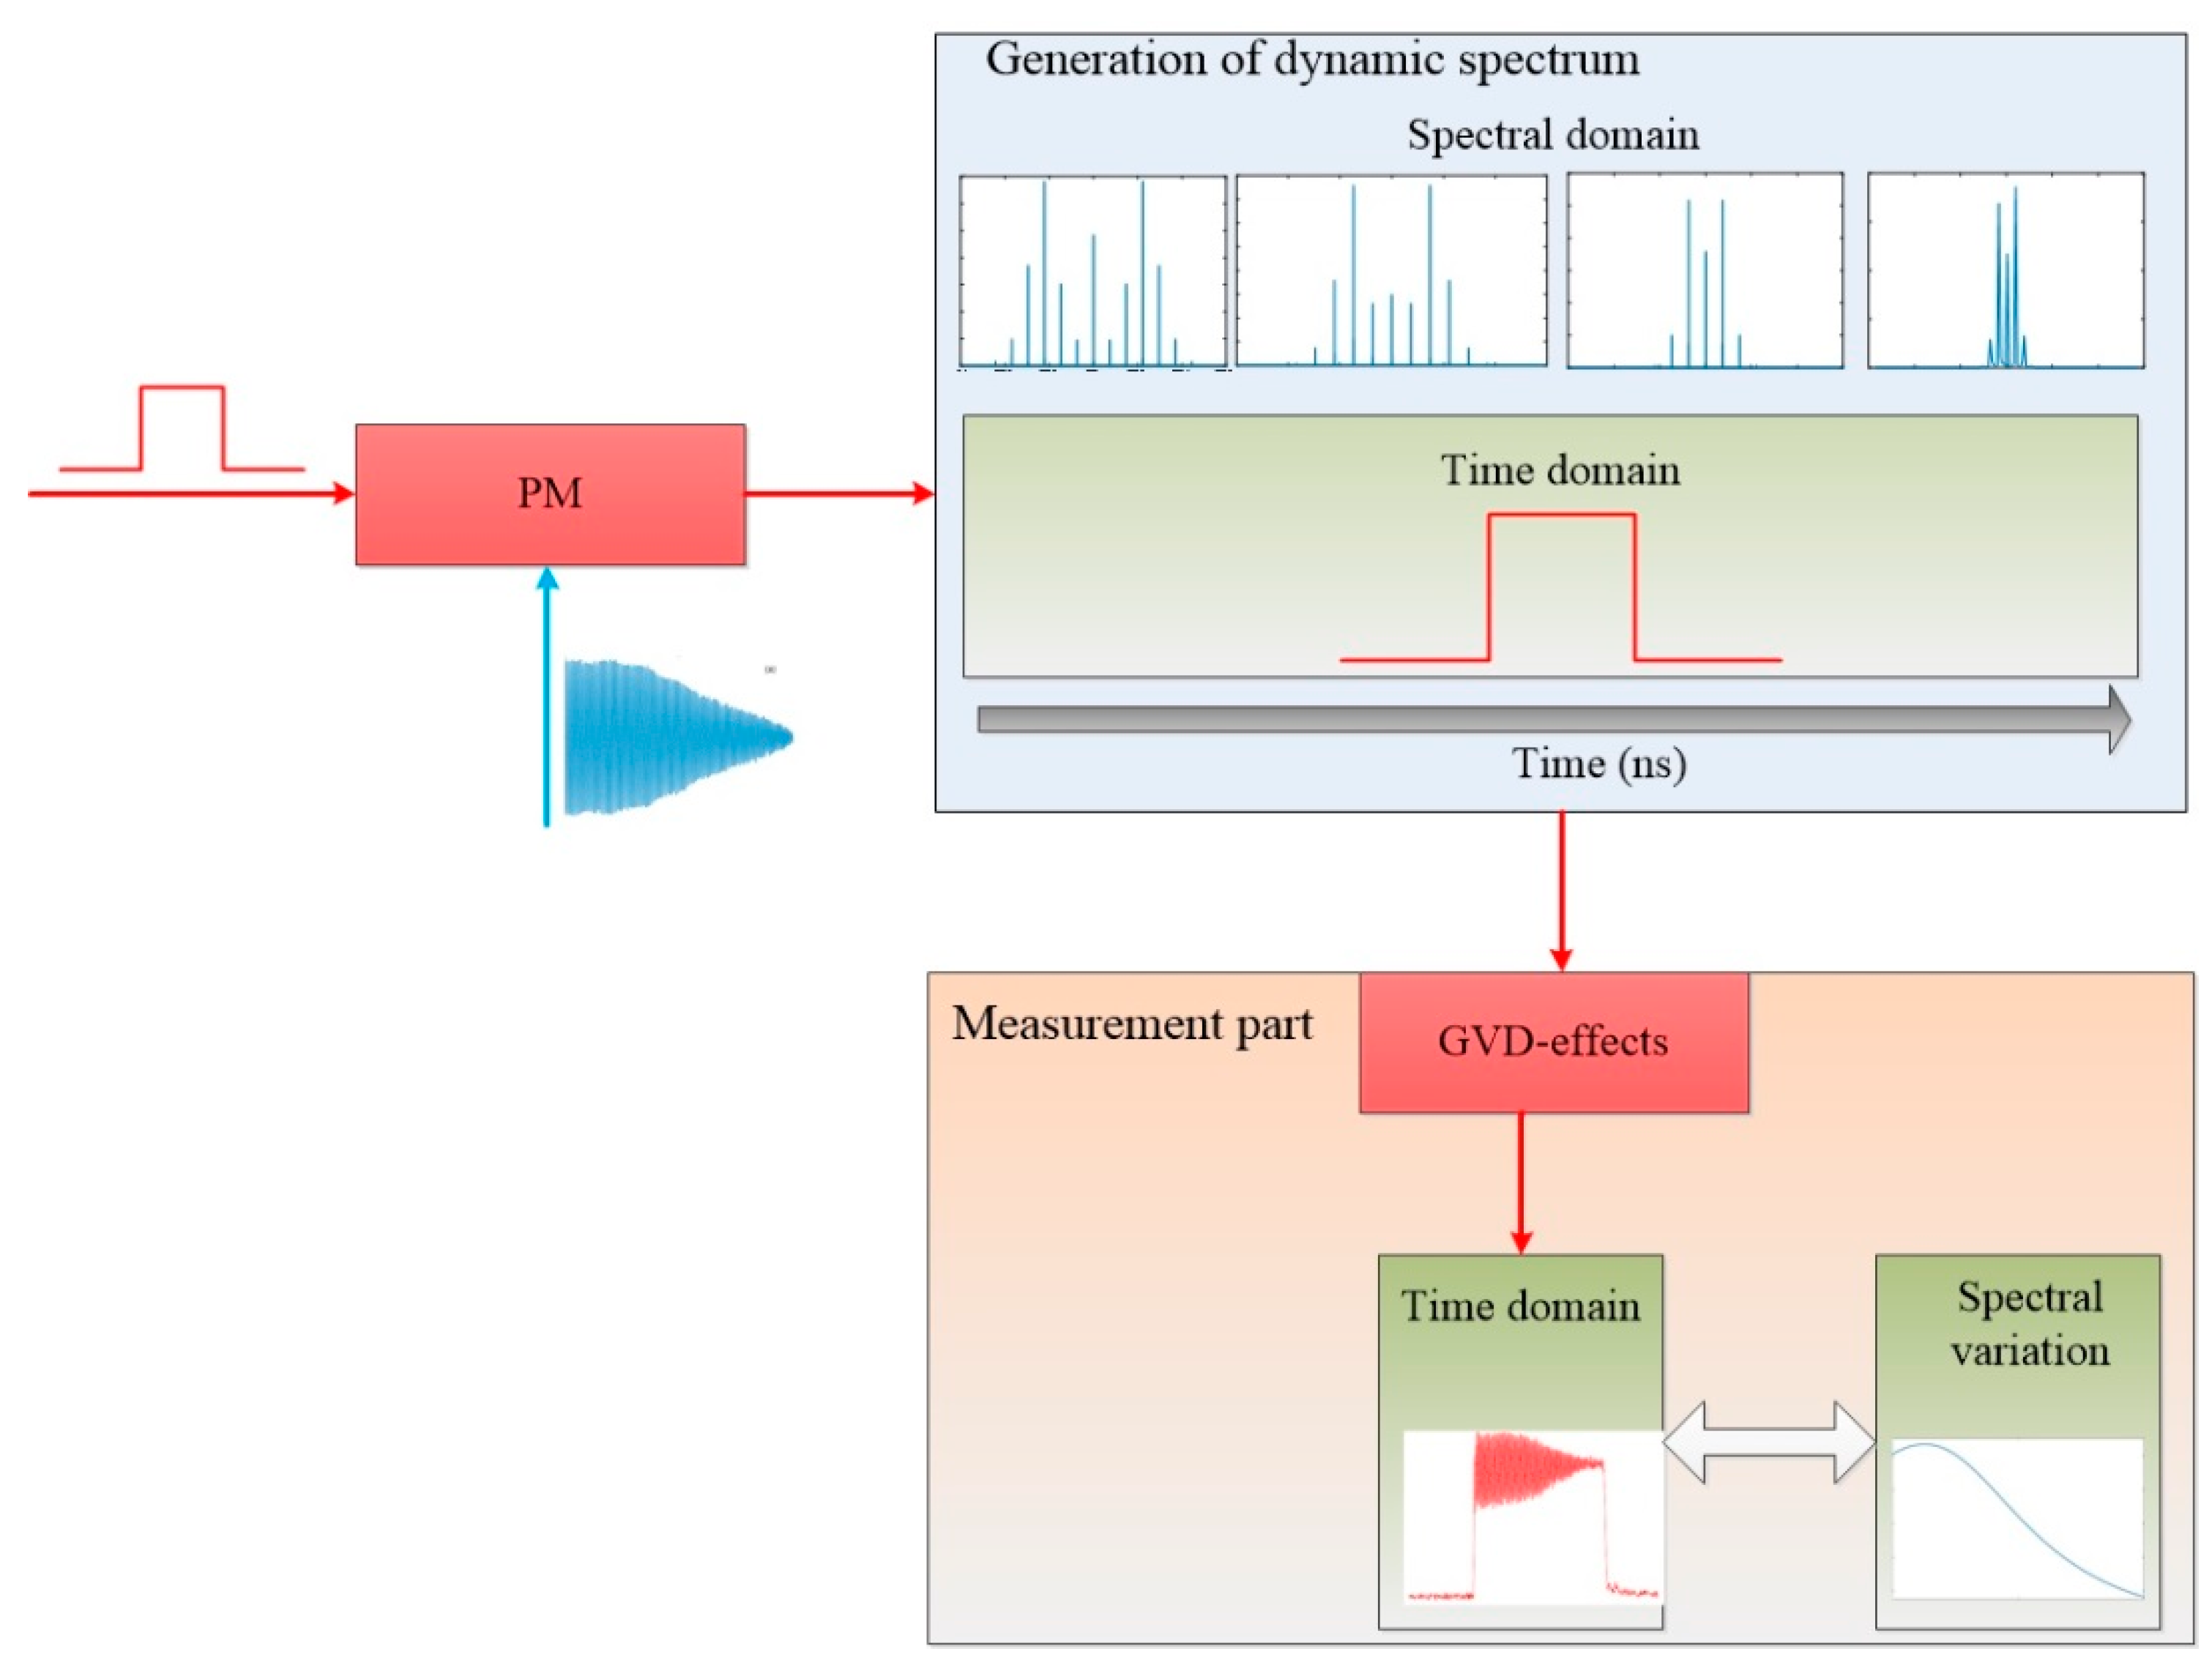
2.2. Principle of Specific Phase Modulation

The modulation index m for phase modulation generally is a constant, but the modulation index under specific modulation is a time-varying function, that is, m(t). Where m(t) = −kt, k is the linear modulation coefficient. In this case, the modulation function of the idiosyncratic phase modulation can be expressed as:
f 2 ( t ) = m ( t ) sin ( 2 π f m t )
The purpose of specific phase modulation is to design the modulation index function according to the modulation requirements of the optical pulse at different times. The amplitude of the modulation index can be increased or decreased by active control. Under this condition, the spectrum of the pulse can be expressed as:
E m 2 ˜ = n = + J n ( m ( t ) ) δ ( f n f m )
As can be seen from Equation (5), the spectrum of the pulse with specific phase modulation is a function varying with time, and the corresponding spectral width will also change dynamically. However, the form of this term is relatively complex and needs to be analyzed in conjunction with the specific m(t) function.
However, this rapid spectral change cannot be measured directly, so we use the frequency modulation (FM) to amplitude modulation (AM) conversion effect to justify the rapid spectral change [21]. To increase the FM-to-AM effect, we add additional group velocity dispersion (GVD) effect to map the spectral change to the FM-to-AM effect depth change in the time domain, so that it can be characterized indirectly and conveniently. The FM-to-AM depth of the output pulse can be estimated as:
α = 2   ·   β 2   ·   L   ·   m ( t )   ·   ( 2 π f ) 2
where β2 is GVD, L is fiber length. According to Equation (6), the gradient change of the FM-to-AM effect can rely on enhancing the GVD effect. Since β2L is constant in the ICF front-end system due to the fixed wavelength 1053 nm and fiber length, the FM-to-AM effect is only affected by the modulation index and also changes dynamically in the time-domain after specific phase modulation. Hence, due to the changes in the time domain and frequency domain both being caused by m(t), we can indirectly infer the rapidly changing spectral width by measuring the change of FM-to-AM depth over the length of the laser pulse.

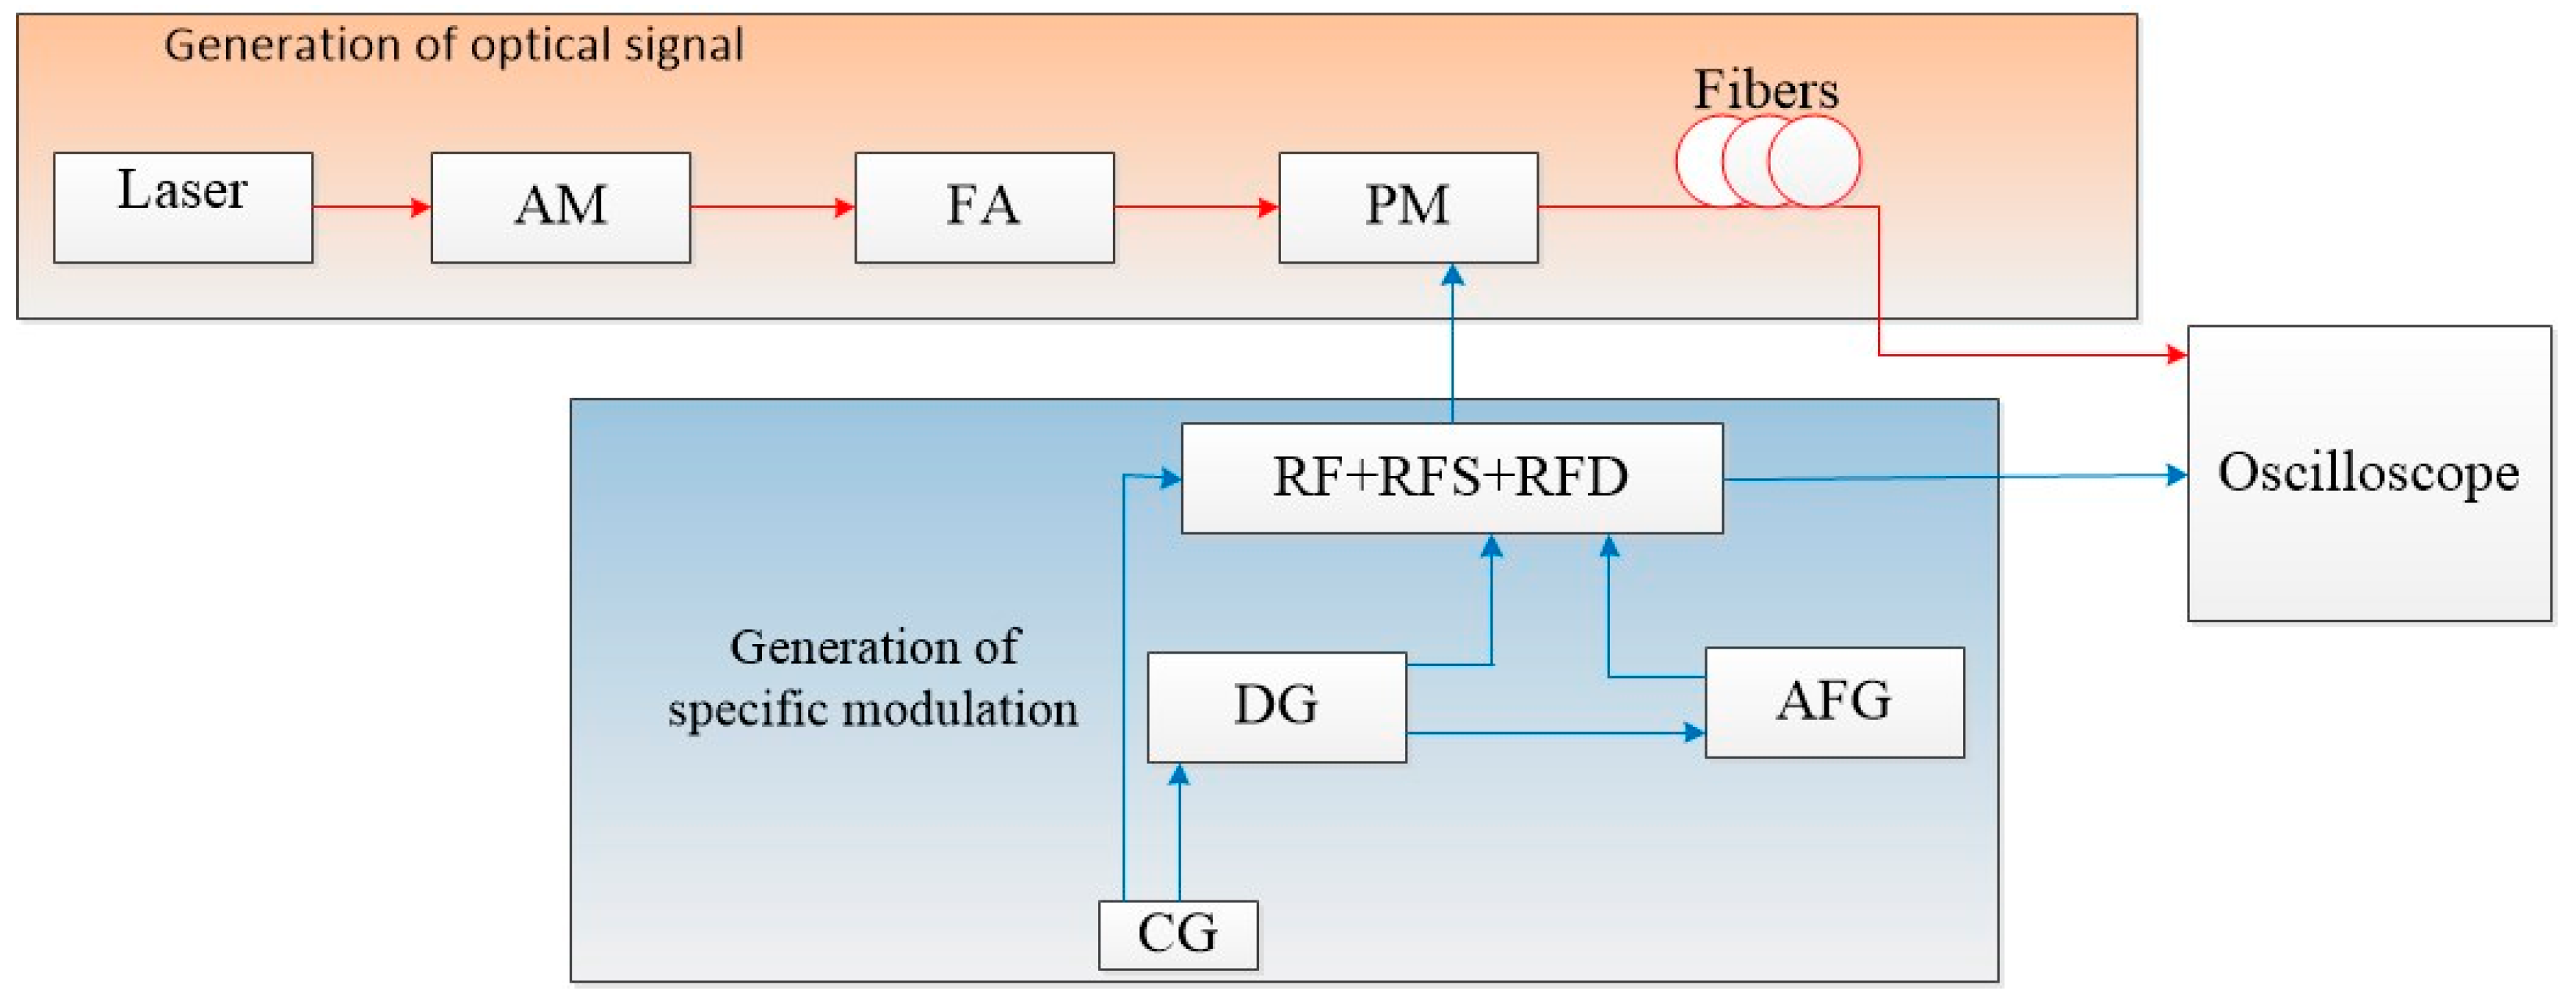
2.3. Structure of Specific Phase Modulation

As shown in Figure 1, Radio-frequency (RF) signals with gradually changing amplitude and pulse optical signals are loaded into a Phase modulator (PM) respectively, where blue represents electrical signals and red represents optical signals. The spectrum is controlled by specific phase modulation, and the bandwidth changes dynamically, but the time domain signal has not changed. Then, affected by the GVD effect, the change of FM-to-AM effect is amplified and highlighted; finally, the pulse signal with gradually changing FM-to-AM depth is obtained. Subsequently, we indirectly measure this rapid changeable spectral distribution based on the mapping relationship between frequency and time domain. Generally, based on the physical requirements, we adopt nanosecond optical pulses in the front-end system of a high-power laser driver. Therefore, the time width of the specific modulation signal in this paper is also limited to the nanosecond level and the modulated signals with smaller time width and shape-controllable can also be obtained in our proposed scheme, but it is not considered in this current experimental system.

3. Simulations and Experimental Results

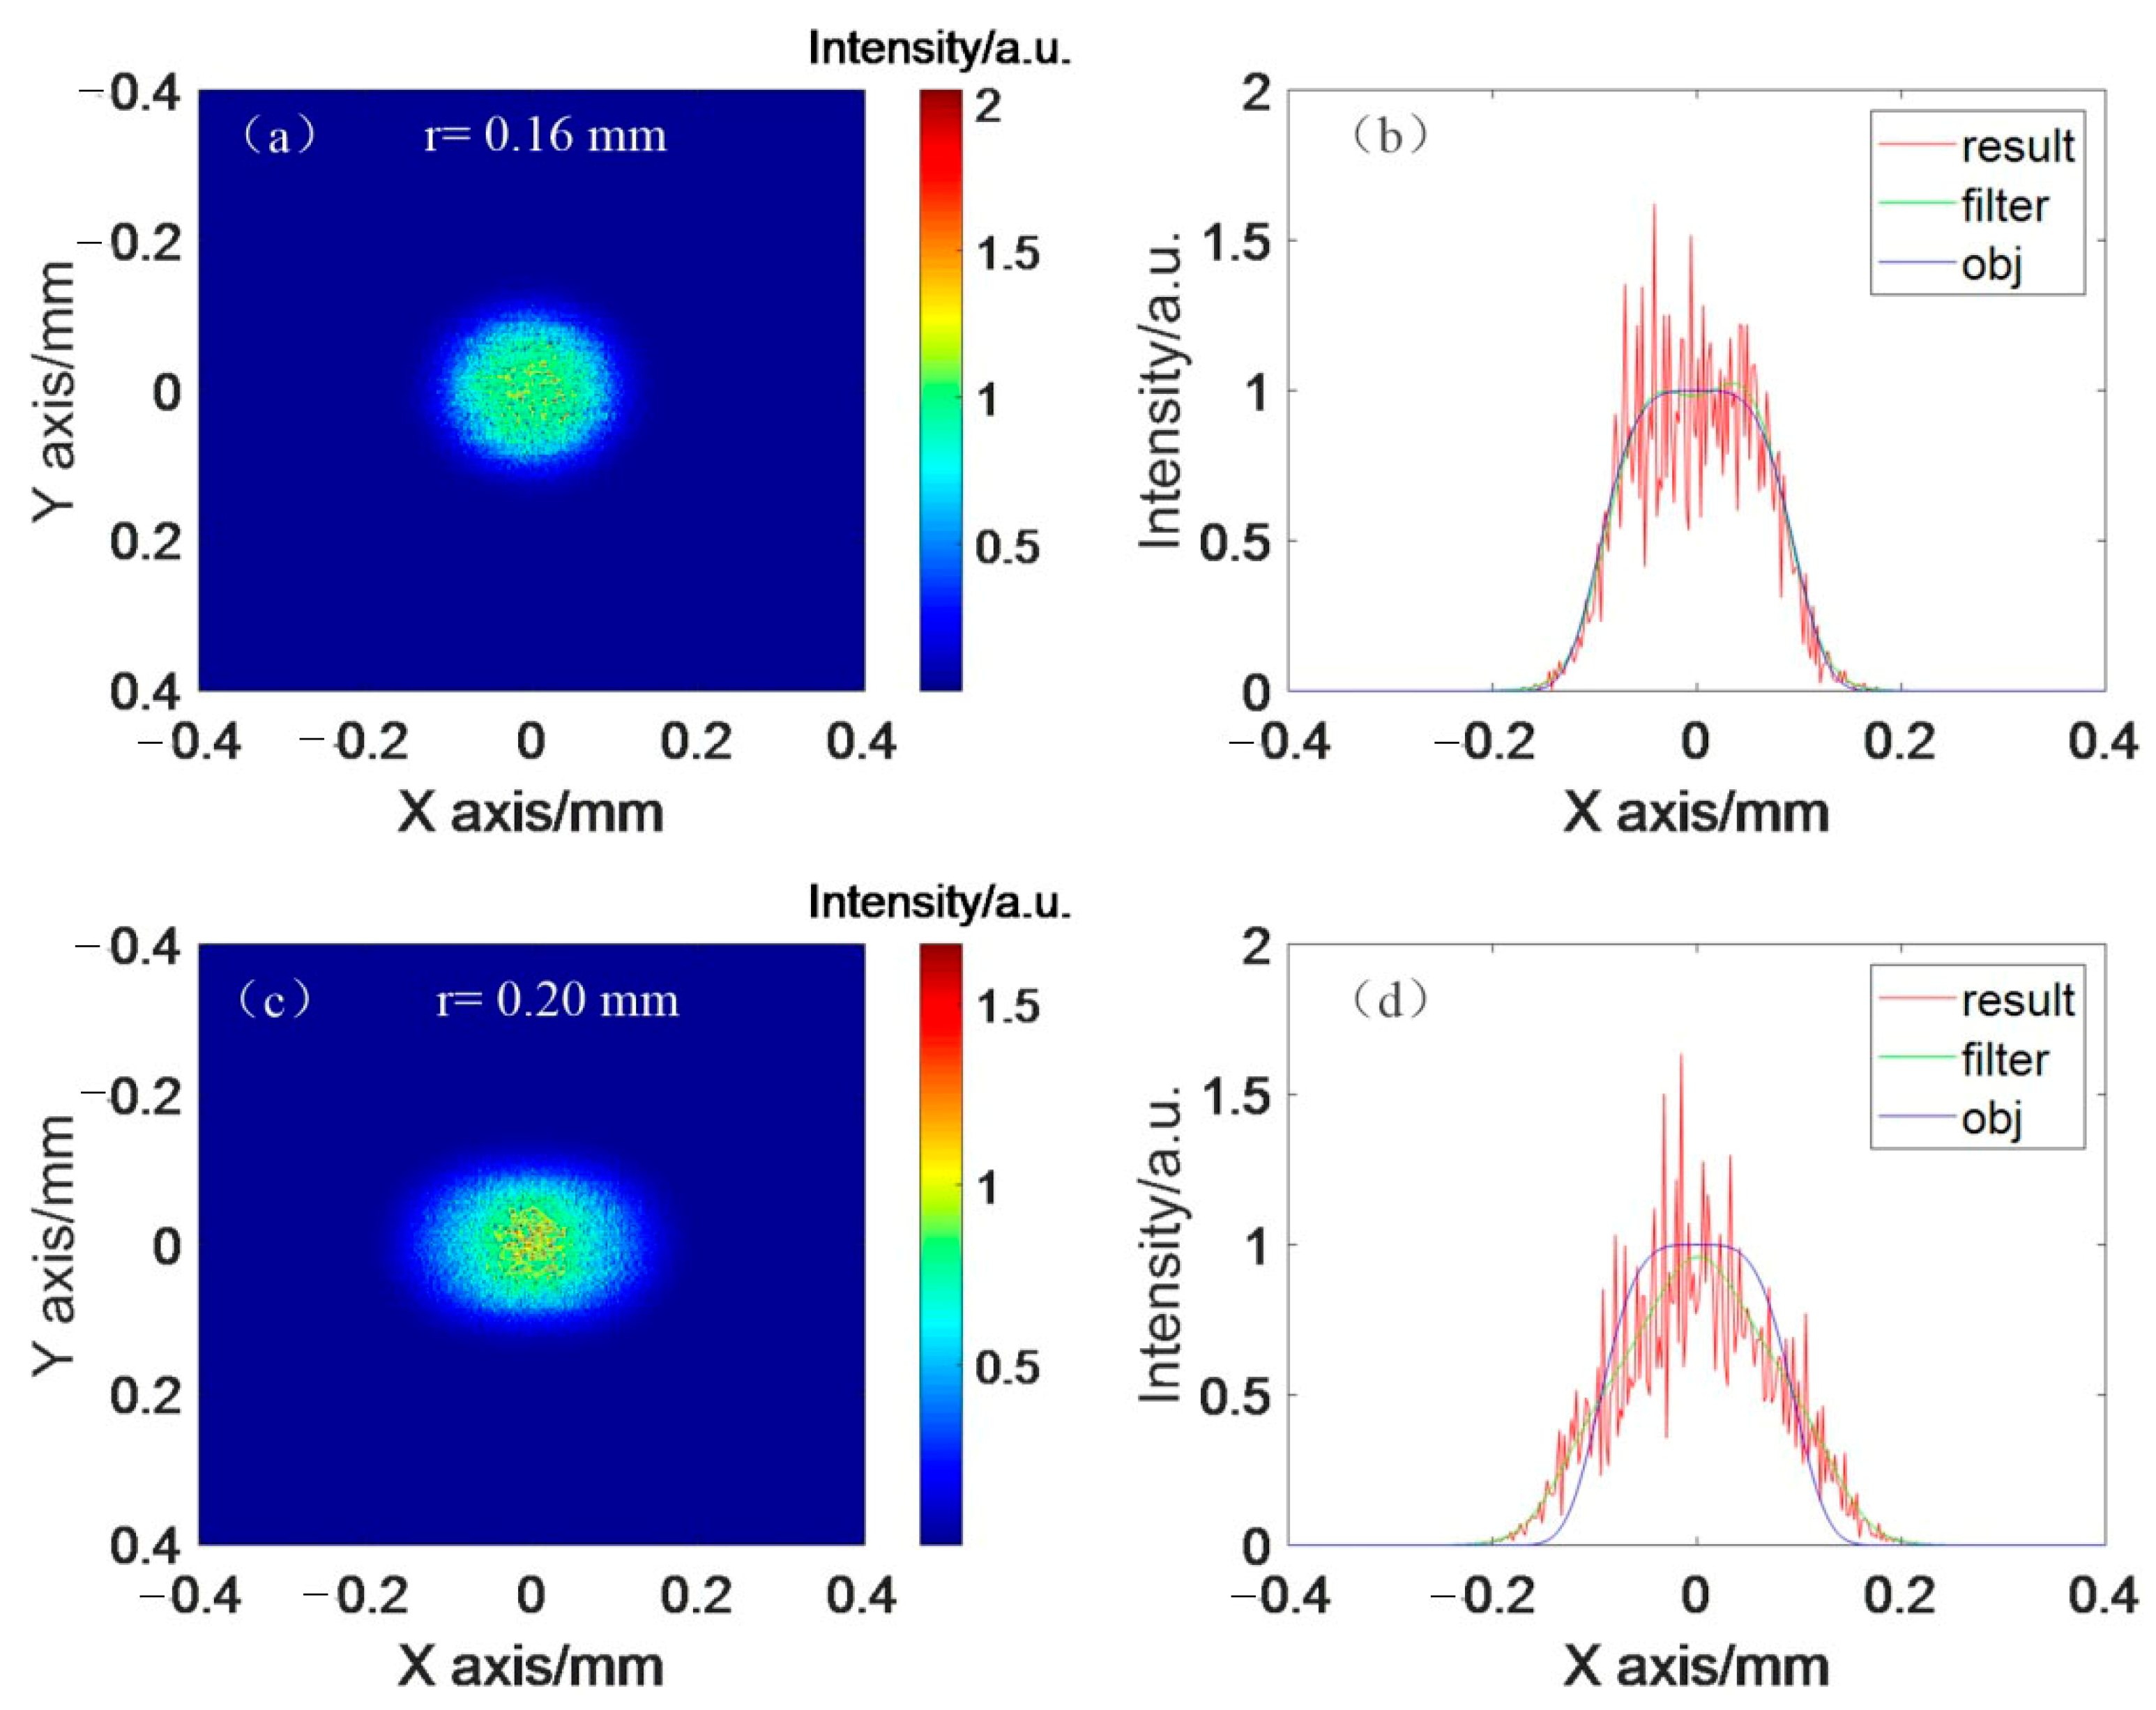
3.1. Simulations Results

According to Equation (4), a specific modulation signal with a time-width of 5 ns, frequency of 19.75 GHz, and diminishing amplitude is simulated, which is shown in Figure 2a. Based on this simulated signal, we utilize the simulated width of 100 ps signal pulse as the sampling window in the range of 5 ns. Thus, 50 corresponding spectral width data are calculated and recorded to fit into a spectral width curve varying with time. As shown in Figure 2b, the spectral width curve shows a decreasing trend with time and is consistent with the amplitude change of the modulation signal. The thumbnail shows the broadened spectral intensities of 0.6 nm, 0.3 nm, 0.2 nm, and 0.1 nm respectively in the dynamic process of calculating the spectral width. After phase modulation, the single-frequency signal light spectrum will be widened. The widened spectrum is symmetrically distributed on both sides of the central wavelength of the original single-frequency light and is composed of multiple discrete spectral lines.
Moreover, we simulate the effect of specific phase modulation on SSD beam and continuous phase plates (CPP), for more intuitive comparison. Simulations are performed with the following parameters: the modulation frequency is 20 GHz, the dispersion coefficient is 0.81 ps/mm, the CPP aperture is 330 mm, the lens focal length is 2234 mm, and the far-field objective focal spot diameter is 300 μm. The modulation signals corresponding from 0.5 nm to 0.1 nm spectral widths are used and the focal spots are observed after passing through the SSD grating, CPP, and focusing. As shown in Figure 3a,c, under the effect of diverse indexes of modulation signals, the far-field focal spot radius is from 0.16 to 0.20 mm respectively, resulting in a consecutive variation of 40 μm. In addition, the abscissa of Figure 3b,d also apparently indicates that the focal spot sizes on the transverse plane obtained by different modulation indexes have significantly different degrees of spreading relative to the objective focal spot, which predicts satisfying performances for the exploration of dynamic focal spot control technology. Figure 3b,d shows section comparison diagrams of Figure 3a,c, respectively. The filtering result indicates that the curve envelope is obtained by filtering the red cross-section curve so that the focal spot radius can be compared more clearly. For Figure 3b,d, we think the abscissa span difference between the two figures is obvious. They are mainly used to help explain that the focal spot size changes more obviously under the action of a specific modulation curve.

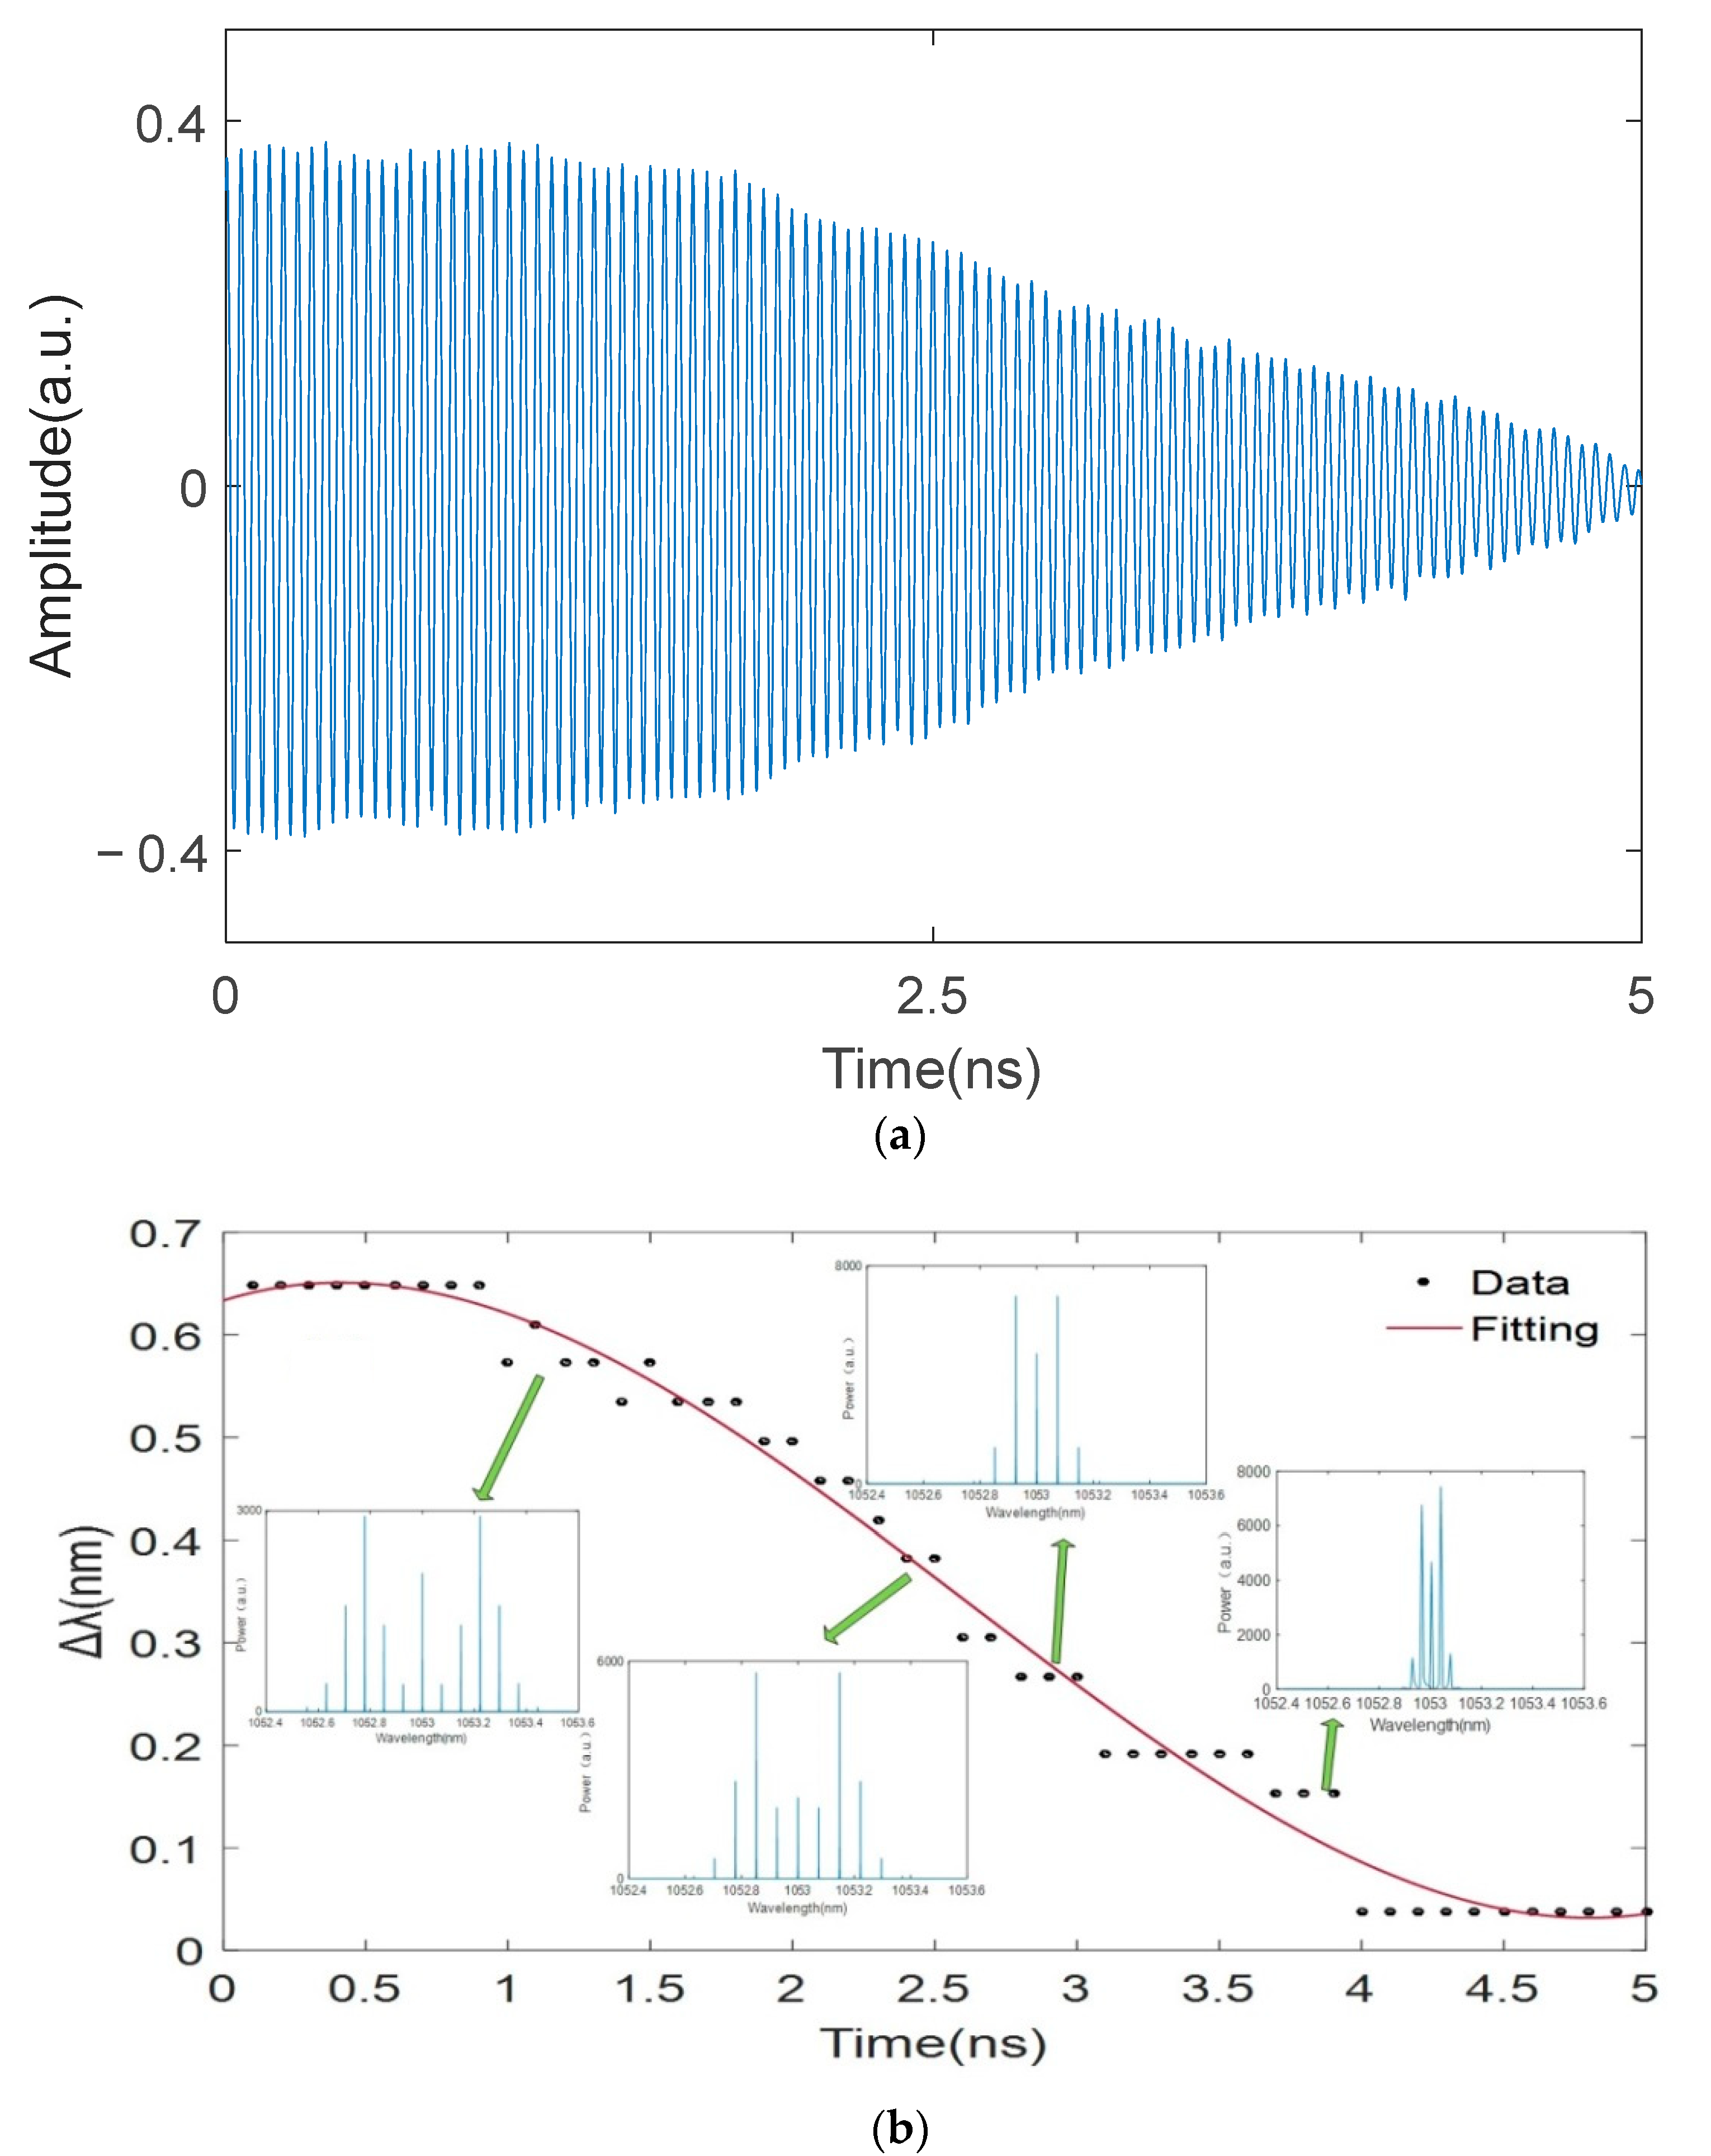
3.2. Experimental Results

Based on the high-frequency nature of the specific phase modulation, experiments need to be performed within the nanosecond laser pulse time scale to obtain the voltage value corresponding to the phase modulation function and load it onto the PM to modulate the pulse. The experimental structure of the optical part is a typical ICF front-end system, which is shown in Figure 4. The optical pulse enters PM after Amplitude modulator (AM) shaping and amplification, and is affected by the specific modulation curve at the same time, resulting in dynamic spectral broadening. An additional 100 m transmission fiber is added at the output end to increase the GVD effect and the change of FM-to-AM effect can be amplified and highlighted so that the spectral change can be measured by using the time-frequency mapping effect later. In the part of the generation of specific modulation, the Radio-frequency switch (RFS) can make modulation signals with rapid decrease or increase in amplitude according to the switching state, and output a specific modulation signal with a certain width or different shapes by adjusting the drive signal; Arbitrary function generator (AFG) is used to drive RFS to intercept the required gradient RF signal; a Delay generator (DG) and a Clock generator (CG) are used to adjust the relative delay between RF and pulse signals so that the specific part of the phase modulation curve is aligned with the optical pulse in the time domain, and to ensure that the relevant electronic components operate synchronously.
Firstly, we measure a specific modulation signal with a maximum spectral width of 0.5 nm and frequency of 19.75 GHz, which is shown in Figure 5.
Secondly, the calibrated specific modulation signal is loaded on the optical pulse with a center wavelength of 1053 nm and pulse width of 5 ns. The synchronous display diagram between the optical pulse and modulation function is shown in Figure 6a. Since the dynamic change of spectrum in the nanosecond scale is difficult to be measured in the experiments; we put forward to establishing the mapping relationship between frequency and time domain to indirectly measure and quantify the dynamic variable spectral distribution. Thus, in order to measure this change in the time domain, we add 100 m transmission fiber after PM output to increase FM-to-AM effects caused by GVD. As shown in Figure 6b, the output signal in the time domain is measured by a high-speed photo-detector with a bandwidth of 45 GHz and an oscilloscope with a bandwidth of 30 GHz.
Then, following the proposed method, the change trend of FM-to-AM depth within 5 ns after specific phase modulation can be obtained and shown in Figure 7a. The same corresponding trend of spectral width with time variation curves can be indirectly obtained based on the mapping relationship between frequency and time domain because they both vary with m(t). Combining with the calibrated maximum spectral width, the measured experimental result of dynamic variable spectral width with a range from approximately 0.5 nm to 0.1 nm is plotted in Figure 7b, which is well consistent with the simulation.
In addition, to further verify the effectiveness of the experimental method, a complementary experiment is designed to compare whether the FM-to-AM depth calculated by different spectral widths meets the trend shown in Figure 7a. We directly measure the time domain curve after phase modulation and 100 m fiber length to obtain the FM-to-AM depth of four different spectral widths. Four kinds of spectral widths and corresponding modulation curves are calibrated respectively, which are marked as A (0.53 nm); B (0.44 nm); C (0.30 nm); D (0.15 nm), mainly due to the diverse modulation index. As shown in Figure 8e, the FM-to-AM depth measured by these four modulation curves is indeed consistent well with the experimental results. Consequently, the further mutual assessments between the time and frequency domains make the proposed method feasible.

4. Discussion

Under the specific phase modulation, the overall trend of the spectrum of the pulse is consistent with the corresponding RF curve, and the width rapidly decreases or increases dynamically. In the simulation calculation of spectral width, since the time window is not short enough, the calculation results will fluctuate in a zigzag shape, so a fitting curve is a better choice to compare. Meanwhile, we preliminarily explore the change of focal spot size after SSD and CPP. The results are as expected; the radius of the far-field focal spot change is 40 μm. That is because, with the rapid reduction of spectral width, the smoothing spatial area decreases with time in SSD. In future research, these simulations are of guiding significance for realizing more flexible dynamic spatial smoothing scanning in the parameter control of high-power laser drivers.
Based on the mapping relationship between the frequency and time domain, we indirectly measure the dynamic variable spectral distribution and establish mutual assessments and verification schemes. The complete verification strategy is shown in Figure 9, which includes comparing spectral widths obtained by indirect measurement and simulation calculation, and comparing it with the FM-to-AM depth obtained by experimental measurements, respectively. Among them, the measured four depths are recorded after phase modulation and 100 m fiber length.
Due to the use of specific phase modulation, the modulation systems are different in the time domain, and the spectrum of signal light through phase modulation is variable, which can realize the rapidly changing regulation of spectral width at different times. This modulation method can complete the continuous and real-time regulation of spectral width and promises important applications in realizing the dynamic spectral dispersion smoothing effect in the laser parameter control of high-power laser drivers. However, the equal amplitude phase modulation has only a fixed spectral width and cannot realize dynamic change, which has certain limitations in practical application.

5. Conclusions

To summarize, in this work, a proposed method of dynamic variable spectral width aims to meet the requirements of SSD and the dynamic focus simultaneously. The simulation and experimental results show that under the specific phase modulation function proposed in this study, the spectral width can change dynamically on the nanosecond scale. Meanwhile, numerical simulations give a result of far-field focal spot consecutive variation with radius change of 40 μm (focal length is 2234 mm) after SSD and CPP under the contributions of spectral widths of from 0.5 nm to 0.1 nm, respectively. Due to the transient regulation of the spectrum width and the smoothing space region changes with time, this provides an idea of how to realize more flexible dynamic spatial smoothing scanning in the future. In particular, we indirectly measure this dynamic nanosecond spectral distribution based on the mapping relationship between frequency and time domain. Therefore, the study of specific phase modulation can provide a valuable reference for the exploration of dynamic focal spot control technology.

Author Contributions

Conceptualization, X.Q. and X.W.; methodology, S.Z.; software, Z.X.; validation, X.Q. and X.W.; formal analysis, X.Q. and Y.W.; investigation, S.X.; resources, W.F.; data curation, W.F.; writing—original draft preparation, X.Q.; writing—review and editing, X.Q.; visualization, W.F.; supervision, W.F.; project administration, W.F. and X.W.; funding acquisition, W.F. and X.W. All authors have read and agreed to the published version of the manuscript.

Funding

This work was supported by the Strategic Priority Research Program of the Chinese Academy of Sciences, China (Grant Nos. XDA25020303).

Institutional Review Board Statement

Not applicable.

Informed Consent Statement

Not applicable.

Data Availability Statement

The data included in this study are all owned by the research group and will not be transmitted.

Acknowledgments

The authors thank the editor and anonymous reviewers for their valuable comments. The authors also thank Wenxi Qian from Nanjing Normal University for polishing the English writing.

Conflicts of Interest

The authors declare no conflict of interest.

References

  1. Xu, D.; Tian, X.; Zhou, D.; Zong, Z.; Fan, M.; Zhang, R.; Zhu, N.; Xie, L.; Li, H.; Wang, J.; et al. Temporal pulse precisely sculpted millijoule-level fiber laser injection system for high-power laser driver. Appl. Opt. 2017, 56, 2661–2666. [Google Scholar] [CrossRef]
  2. Penninckx, D.; Beck, N.; Gleyze, J.F.; Videau, L. Signal propagation over polarization-maintaining fibers: Problem and solutions. J. Lightwave Technol. 2006, 24, 4197–4207. [Google Scholar] [CrossRef]
  3. Dorrer, C.; Roides, R.; Cuffney, R.; Okishev, A.V.; Bittle, W.A.; Balonek, G.; Consentino, A.; Hill, E.; Zuegel, J. Fiber front end with multiple phase modulations and high-bandwidth pulse shaping for high-energy laser-beam smoothing. IEEE J. Sel. Top. Quantum Electron. 2013, 19, 219–230. [Google Scholar] [CrossRef]
  4. Hocquet, S.; Penninckx, D.; Bordenave, E.; Gouédard, C.; Jaouën, Y. FM-to-AM conversion in high-power lasers. Appl. Opt. 2008, 47, 3338–3349. [Google Scholar] [CrossRef] [PubMed]
  5. Lindl, J.; Amendt, P.; Berger, R.L. The physics basis for ignition using indirect-drive targets on the national ignition facility. Phys. Plasmas 2004, 11, 339–491. [Google Scholar] [CrossRef]
  6. Dorrer, C. Spectral and temporal properties of optical signals with multiple sinusoidal phase modulations. Appl. Opt. 2014, 53, 1007–1019. [Google Scholar] [CrossRef] [PubMed]
  7. Bian, Y.; Jiao, K.; Wu, X.; Yang, H.; Zhu, R. Utilizing phase-shifted long-period fiber grating to suppress spectral broadening of a high-power fiber MOPA laser system. High Power Laser Sci. Eng. 2021, 9, e39. [Google Scholar] [CrossRef]
  8. Vidal, S.; Luce, J.; Penninckx, D. Experimental demonstration of linear precompensation of a nonlinear transfer function due to second-harmonic generation. Opt. Lett. 2011, 36, 88–90. [Google Scholar] [CrossRef]
  9. Waxer, L.J.; Kelly, J.H.; Rothenberg, J.; Babushkin, A.; Bibeau, C.; Bayramian, A.; Payne, S. Precision spectral sculpting for narrowband amplification of broadband frequency-modulated pulses. Opt. Lett. 2002, 27, 1427–1429. [Google Scholar] [CrossRef]
  10. Li, R.; Fan, W.; Jiang, Y.; Qiao, Z.; Zhang, P.; Lin, Z. Tunable compensation of GVD-induced FM-AM conversion in the front end of high-power lasers. Appl. Opt. 2017, 56, 993–998. [Google Scholar] [CrossRef]
  11. Qiao, Z.; Wang, X.; Fan, W.; Lin, Z. Demonstration of a high-energy, narrow-bandwidth, and temporally shaped fiber regenerative amplifier. Opt. Lett. 2015, 40, 4214–4217. [Google Scholar] [CrossRef]
  12. Guo, J.; Wang, J.; Pan, X.; Lu, X.; Xia, G.; Wang, X.; Zhang, S.; Fan, W.; Li, X. Suppression of FM-to-AM conversion in abroadband Nd:glass regenerative amplifierwith an intracavity birefringent filter. Appl. Opt. 2019, 58, 1261–1270. [Google Scholar] [CrossRef]
  13. Yang, X.; Ren, C.; Xu, H.; Ma, Y.; Shao, F. Transport of ultraintense laser-driven relativistic electrons in dielectric targets. High Power Laser Sci. Eng. 2020, 8, e2. [Google Scholar] [CrossRef]
  14. Park, H.S.; Hurricane, O.A.; Callahan, D.A.; Casey, D.T.; Dewald, E.L.; Dittrich, T.R.; Döppner, T.; Hinkel, D.E.; Hopkins, L.B.; Pape, S.; et al. High-adiabat high-foot inertial confinement fusion implosion experiments on the National Ignition Facility. Phys. Rev. Lett. 2014, 112, 055001. [Google Scholar] [CrossRef] [PubMed]
  15. Guardalben, M.J.; Barczys, M.; Kruschwitz, B.E.; Spilatro, M.; Waxer, L.J.; Hill, E.M. Laser-system model for en-hanced operational performance and flexibility on OMEGA EP. High Power Laser Sci. Eng. 2020, 8, e8. [Google Scholar] [CrossRef]
  16. Zhang, J.; Wang, W.; Yang, X.; Wu, D.; Ma, Y.; Jiao, J.; Zhang, Z.; Wu, F.; Yuan, X.; Li, Y.; et al. Double-cone ignition scheme for inertial confinement fusion. Phil. Trans. R. Soc. A 2020, 378, 20200015. [Google Scholar] [CrossRef] [PubMed]
  17. Bowers, M.; Cohen, S.; Erbert, G.; Heebner, J.; Hermann, M.; Jedlovec, D. The injection laser system on the National Ignition Facility. Solid State Lasers XVI Technol. Devices 2007, 6451, 399–418. [Google Scholar]
  18. Temporal, M.; Canaud, B.; Garbett, W.J.; Ramis, R.; Weber, S. Irradiation uniformity at the Laser MegaJoule facility in the context of the shock ignition scheme. High Power Laser Sci. Eng. 2014, 2, e8. [Google Scholar] [CrossRef]
  19. Rabault, M.; Luce, J.; Pennincks, D. Random and pseudo-random phase modulations for FM-to-AM reduction in high power lasers. Appl. Opt. 2018, 57, 9288–9295. [Google Scholar] [CrossRef]
  20. Huang, C.; Lu, X.; Jiang, Y.; Wang, X.; Qiao, Z.; Fan, W. Real-time characterization of FM-AM modulation in a high-power laser facility using an RF-photonics system and a denoising algorithm. Appl. Opt. 2017, 56, 1610–1615. [Google Scholar] [CrossRef]
  21. Hocquent, S.; Lacroix, G.; Pennincks, D. Compensation of frequency modulation to amplitude modulation conversion in frequency conversion systems. Appl. Opt. 2009, 48, 2515–2521. [Google Scholar] [CrossRef] [PubMed]
Figure 1. Diagram of the proposed specific phase modulation. PM: Phase modulator.
Photonics 09 00586 g001
Figure 2. Simulations results of the spectral phase modulation with dynamic width: (a) specific modulation function. (b) Change of spectral width with time.
Photonics 09 00586 g002
Figure 3. Simulations results of the far-field focal spot with different modulation indexes after SSD and CPP: (a,b) Focal spot and its light intensity at transverse plane with modulation index corresponding to spectral width = 0.1 nm. (c,d) Focal spot and its light intensity at transverse plane with modulation index corresponding to spectral width = 0.5 nm.
Photonics 09 00586 g003
Figure 4. Structure of the proposed specific phase modulation system. PM: Phase modulator; RF: Radio frequency; RFS: Radio frequency switch; RFD: Radio frequency driver; DG: Delay generator; AFG: Arbitrary function generator; CG: Clock generator; FA: Fiber amplification; AM: Amplitude modulator.
Photonics 09 00586 g004
Figure 5. Experimental results of the modulation function with a maximum spectral width of 0.5 nm.
Photonics 09 00586 g005
Figure 6. Experimental results of the specific phase modulation. (a) Synchronous display between optical pulse and modulation function. (b) Time domain curve after phase modulation and 100 m fiber length.
Photonics 09 00586 g006
Figure 7. Experimental results of the specific phase modulation. (a) Change of FM-to-AM depth. (b) Change of spectral width with time.
Photonics 09 00586 g007
Figure 8. Experimental results of the inversion verification. (a) Spectral intensity with width of 0.53 nm. (b) Spectral intensity with width of 0.44 nm. (c) Spectral intensity with width of 0.30 nm. (d) Spectral intensity with width of 0.15 nm. (e) Measured FM-to-AM depth comparison with experimental result.
Photonics 09 00586 g008aPhotonics 09 00586 g008b
Figure 9. Chart of verification strategy.
Photonics 09 00586 g009
Publisher’s Note: MDPI stays neutral with regard to jurisdictional claims in published maps and institutional affiliations.

