Article

Influence of a One-Pot Approach on a Prepared CuS Macro/Nanostructure from Various Molecular Precursors

1
Fort Hare Institute of Technology, University of Fort Hare, Private Bag X1314, Alice 5700, South Africa
2
Department of Chemistry, University of Fort Hare, Private Bag X1314, Alice 5700, South Africa
*
Author to whom correspondence should be addressed.
Inorganics 2023, 11(7), 266; https://doi.org/10.3390/inorganics11070266
Submission received: 20 April 2023 / Revised: 16 June 2023 / Accepted: 22 June 2023 / Published: 24 June 2023

Abstract

:
Nanostructured metal sulfides such as copper sulfide (CUS) form from single-source precursors (SSPs) and are cost-friendly materials that can be used in a one-pot approach with potential applications in dye-sensitizer solar cells (DSCs). This is an attractive pathway that allows the careful control of tailoring the design of the nanostructures with slight variations in the mixture conditions to form uniform nanoparticles and enhance the performance of DSCs. We report on the optical, structural, and morphological properties of CuS as photosensitizers and their application in QDSCs using characterization techniques such as cyclic voltammetry (CV), current–voltage (I-V), UV-Vis spectroscopy (UV-Vis), X-ray diffraction (XRD), high-resolution transmission electron microscopy (HRTEM), etc. The UV-Vis reveals that the band gap for the three samples is found at 2.05–2.87 eV, confirming them as suitable materials for solar cells. The XRD peaks for the three CuS nanoparticles harmonized very well with hexagonal CuS. The thermal gravimetric (TGA) suitability of the three complexes shows a two-step decomposition within the temperature range of 125–716 °C, with a final residue of 2–4%. CV curves for three samples show that none of the developed metal sulfides exhibits a peak indicative of limited catalytic activity in the iodine electrolyte. The I-V overall energy conversion efficiency (η%) of 4.63% for the CuSb photosensitizer is linked to the wide electronic absorption spectrum and better relative dye loading. The synthesis of photosensitizers from a trioctylphosphine oxide (TOPO) capping agent shows improved efficiency compared to our previous studies, which used hexadecylamine as a coordinating solvent.

1. Introduction

The extensive research and applications of nanoparticles (NPs) and quantum dots (QDs), particularly in solar cells and electronic devices in recent decades, have prompted many scientists to develop QDs with properties such as high intensity fluorescence, narrow emission, water solubility, and low toxicity. They are also employed in medicine, the detection of heavy metals, and biology as biomarkers [1,2,3,4,5]. These extensive attractions are due to their size-tunable properties, which are achieved by the quantum confinement effect and a decrease in particle size as a result of an increase in the surface-to-volume ratio [6]. CuS obtained from transition metal complexes has shown unique properties due to their low toxicity and high stability, which account for their various applications in construction, cosmetics, militaries, textiles, green technology, nanomedicine, etc. Zhou et al. [7] reported CuS nanosheets using a precursor of sulfur using vulcanized polyisoprene for hydrogen production as a better co-catalyst. Using self-doped Cu2-x E (E = Se, S) and varying its reaction time and solvent composition coordination, Liu et al. [8] synthesized CuS with control sizes between 2.8–13.5 nm. Wu et al. [9] created a hexagonal nanocrystal structure of CuS with near-infrared emission from an anhydrous solvent mixture of oleic acid and dodecanethiol at 100 °C. The studies by Tu et al. [10] and Swaidan et al. [11] show that the adoption of CuS as an enzyme mimic improves the catalytic performance of the nanoenzyme in the sensitive and selective detection of heavy metals.
Moreover, CuS with different morphologies, such as nanorods, nanoparticles, quantum dots (QDSCs), nanoribbons, nanoplates, and sphere structures, has been well documented [12,13,14,15,16]. Sonochemical, co-precipitation, solvothermal, sol–gel, dealloying, chemical vapor deposition, wet chemical, polyol, and hydrothermal techniques, among others, are used to create these structures [1,13,14,17,18,19,20,21]. Among all these approaches, single-source precursor routes have gained more interest due to their simplified procedures, scaled-up abilities, fewer reagents, and high efficiency [1,2]. SSPs use metal complexes as precursors and use thermal decomposition to obtain nanocrystals of the constituent. SSPs have a distinguished record for producing uniform QD materials with lower toxicity [22]. The most commonly used metal complex precursors in SSP techniques for binary nanomaterials are diseleno- and dithiocarbamate complexes [23], whereas chalcogenolate ligands and triphenylphosphine bimetallic complexes are used for ternary nanomaterial [24,25].
This study focuses on the effects of synthesized CuS photosensitizers’ morphology, controllable size, optical properties, and conversion efficiency in QDSCs. The present study adopted SSP techniques for the formation of CuS NPs using (anil-piper-Cu(DTC)1, anil-Cu(DTC)2 and piper-Cu(DTC)3 as molecular precursors. The fabricated QDs were characterized to obtain their structural and morphological properties using XRD, Fourier transform infrared (FTIR), HRTEM, field emission scanning electron microscopy (FESEM), energy X-ray dispersive spectroscopy (EDS), optical properties via UV-Vis spectroscopy, photoluminescence (PL), and thermal properties via thermal gravimetric (TGA) and derivative thermogravimetric (DTG) analyses and the (CV and I-V) analysis.

2. Results and Discussions

2.1. NMR Spectra Studies of Copper(II) Complexes

The NMR data from 1H and 13C of diamagnetic Cu(II) complexes 1–3 were recorded in dimethyl sulfoxide (DMSO) (see Supplementary Material Figure S1). The phenyl moiety of the aromatic protons appeared within the range of 6.95–10.29 as a singlet and a doublet. The -CH2 protons of the methylene from the piperidine moiety appeared at 4.20 ppm and 3.31 ppm as singlets and doublets due to an up-field shift as a result of the coordination between the Cu(II) ion and the ligands [26,27]. The 13C NMR data show a signal at 198 upon complexation, which could be linked to the movement of electron density from the carbon disulfide (CS2) moiety to the three Cu(II) ions, thereby causing the CS2 nuclei to be de-shielded, hence the up-field shift [28,29]. Similarly, the methylene carbons appeared around 44.9 ppm and 51.4 ppm upon complexation, affirming that there was an up-field shift in the three complexes.

2.2. Electronic Spectra of Copper(II) Complexes

Dithiocarbamate copper(II) complexes are identified to demonstrate intense absorption around 430 nm due to ligand-to-metal charge transfer and the d–d transitions around 640 nm for large absorption as a result of the delocalized d–orbitals in the sulfur atoms of the ligands. Copper(II) tetrahedral compounds typically have a single broad peak in the visible region and are not very common. The electronic spectra for complexes, as seen in Figure S2a, have a wavelength range starting at 310 nm. This is due to the intraligand transitions of π → π* and n → π* [30]. Piper + Cu(II) and Anil + Cu + piper have the same wavelength at 298 nm, which could be due to the correlation between the metal ion and sulfur atoms. While Anil + Cu at 315 nm with a high wavelength is linked to the metal-to-ligand charge transfer, the peak at 439 nm, which appears for only Piper + Cu(II), is linked to the d–d transition assigned to the 2T2g → 2Eg transition, which is specific to complexes with tetragonal structures due to the Jahn–Teller effect. The study shows that the mixed ligands, Anil + Cu + piper and Anil + Cu, did not enhance the absorption properties compared to piper + Cu(II).

2.3. FTIR Results of Copper(II) Complexes

Three vital peaks of great significance are expected from the dithiocarbamate complexes in the IR spectra (see Figure S2b). The v(C-N) stretching vibration band in the range of 1503–1505 cm−1 is the first one [31,32]. The fingerprint area associated with the v(C-S) bands between 1236 and 1237 cm−1 is the second one, appearing as single peaks in the IR spectra for the complexes. The small shift in the band observed in the three complexes could be linked to the partial double bond, confirming the complex’s formation, which is in agreement with studies by [33,34]. The important band of v(M-S) vibration occurs in far infrared areas in the range of 615–598 cm−1 as the third [35,36]. The amine v(N-H) peak was observed around 3141–3155 cm−1 in the three complexes. The shift in the amine peaks of the ligands compared to the complexes further supported the NMR results of the bis(anil-piper-Cu(DTC)1, bis(anil-Cu(DTC)2, and bis(piper-Cu(DTC)3) complexes. Tetyana et al. employed sodium diethyldithiocarbamate Cu(II), showing a similar trace in peak stretching for S-H and N-H bands to the current study [37]. The vibrational stretching of v(C-N), v(C-S), and v(M-S) observed for Anil + Cu, Piper + Cu(II), and Anil + Cu + piper confirms the formation of complexes. In comparison, the peak shift and the absent of other peaks in Piper + Cu(II) can be attributed to the ligand length.

2.4. TGA Results

The thermal suitability of the three complexes used as the pathway for the formation of copper sulfide was evaluated using thermogravimetric analysis and is illustrated in Figure 1a–c. The TGA results for the three complexes show a two-step decomposition within the temperature range of 125–716 °C. Complex 2 decomposition at 125 °C is related to the loss of organic species, while at 350 °C it is linked to the complete inorganic components, giving rise to a final residue of 2%. The TGA curves for complexes 1 and 3 show a similar characteristic, with a decomposition around 360–375 °C, which accounts for the loss of organic species. The decomposition between the temperature range of 640–716 °C correlates to the loss of an inorganic moiety with a final residual of 4% for both complexes. The high volatility observed in the three complexes implies that the precursors are suitable for the formation of nanoparticles [38,39].

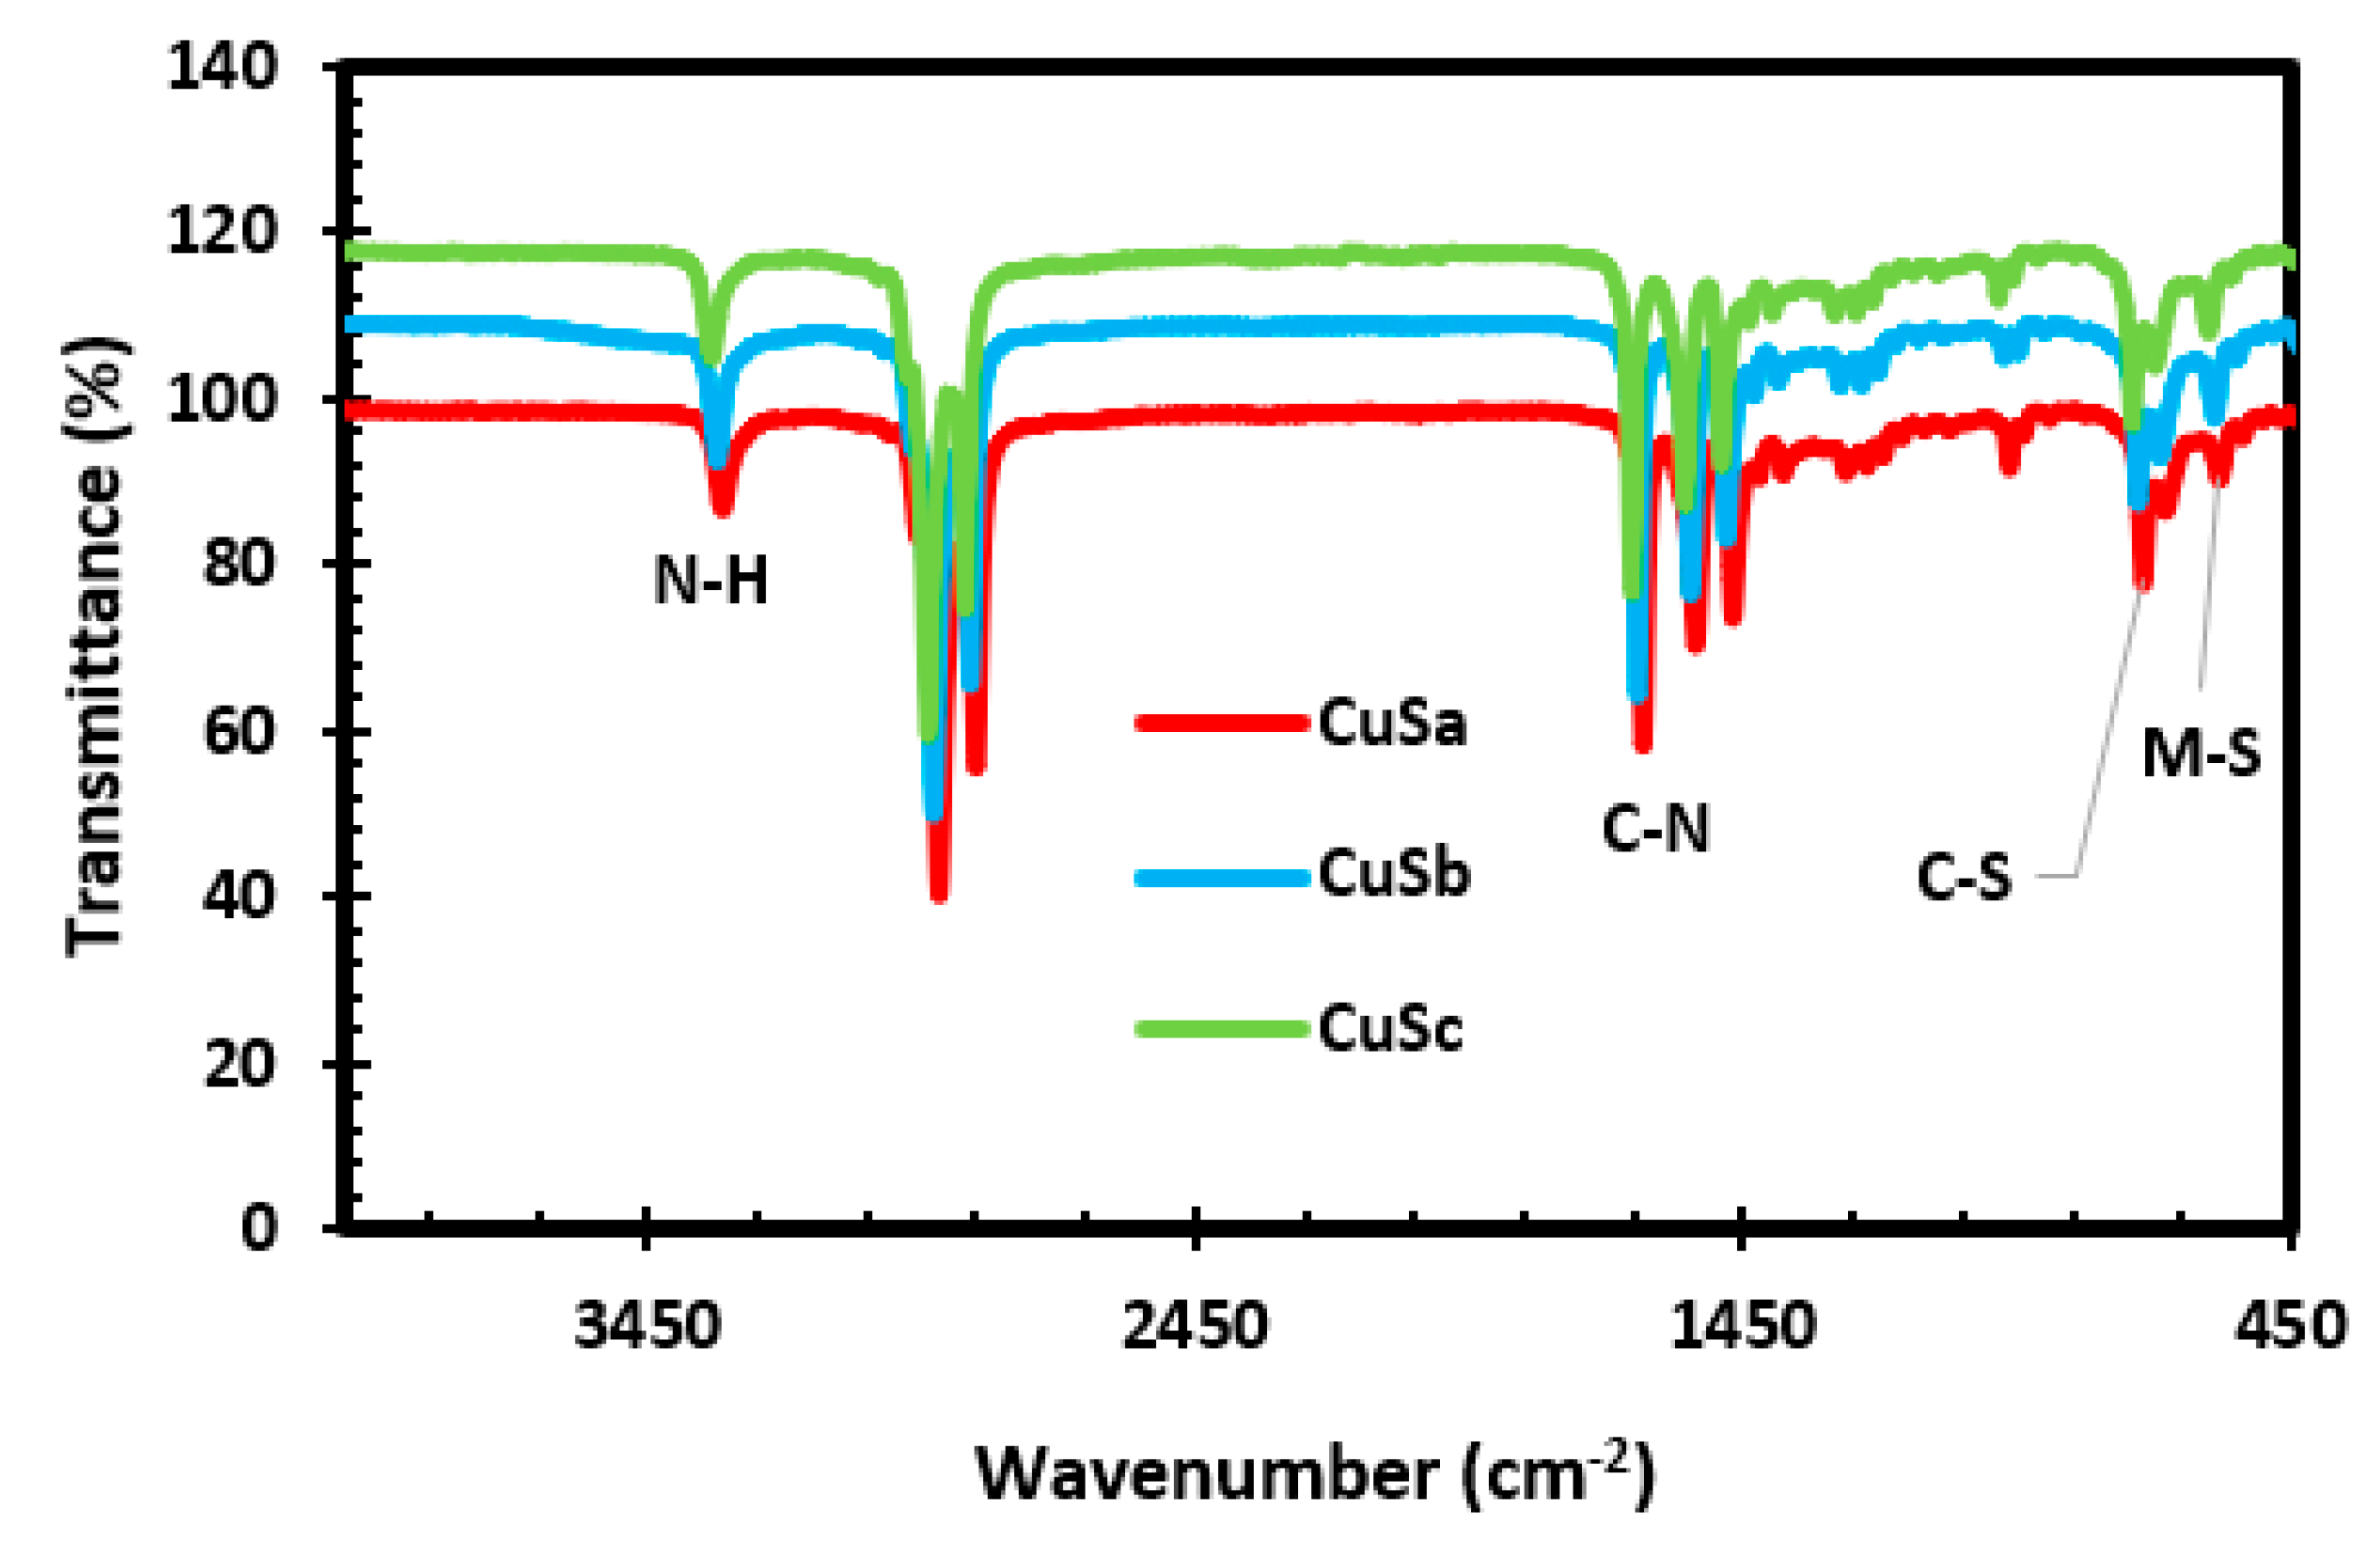
2.5. FTIR Results of CuS Nanoparticles

The FTIR spectrum, as shown in Figure 2, shows that the bands have slit shifts around 3313–3327 cm−1, which obviously correspond to the N-H vibrational stretching of amines. The broad bands at 2916–2926 and 2851–2861 cm−1 are linked to the symmetric and asymmetric vibrational stretching of ethylene groups in the molecular precursor complexes [40]. The vibrational shift toward higher wavenumbers compared with those of the complexes indicates that the N-H functional group is bound to the copper sulfide surface by electron-donating nitrogen atom coordination. The different bands observed around 1634–1653, 1558, and 1469 cm−1 are linked to the C–N stretching, which is linked to the methyl unit angular deformation. The observed peaks at 965 and 720 cm−1 are attributed to the C-S group of the asymmetric and symmetric vibration stretching. The peaks appearing at 581 cm−1 are attributed to the M-S stretching [30,41]. The appearance of these peaks proves that CuS has been successfully synthesized and is in agreement with previous studies [40,42]. Upon comparison of the CuS spectra with the Anil + Cu, piper + Cu(II), and Anil + Cu + piper complexes (see Figure S2a), it is clear that the vibrational bands at 2165–1973 cm−1 have completely vanished with no identification of other organic residues after thermolysis.

2.6. XRD Results of CuS Nanoparticles

The phase and pattern of the CuSa, CuSb, and CuSc nanoparticles were identified using XRD analysis in the 2θ range of 20–80°, as seen in Figure 3a–c. The diffraction peaks for the three CuS nanoparticles harmonized very well, with hexagonal CuS correlating to the JCPDS No. 06-0464 standard card and JCPDS card No. 00–001–1281, signifying the successful formation of CuS. The crystal planes of the diffraction peaks matched well with the following crystal planes for the three samples: (100), (101), (102), (103), (105), (110), (108), and (213). The sharp diffraction peak shown by CuSa and CuSc corresponding to (100), (105), (108), and (110) indicates a higher crystallinity, while CuSb peaks of (101), (105), and (108) are linked to their size, resulting in broadening diffraction peaks. The lower and minor phase intensities observed in this study are due to defect chemistry, the thermal gradient, and the thermodynamics of solids [6]. The full width at half maximum (FWHM) of the dominant peak was around 0.17–0.39° for the three samples. The average distribution of the NPs is about 35 nm and 26 nm for CuSa and CuSc, while, for CuSb, it is 57.25 nm, according to the calculated Debye Scherer’s formula (D = 0.89λ/βcosθ) [43]. The calculated grain size for the three samples is in good agreement with the size distribution according to [44,45,46]. Duran-García et al. [47] used three molecular complexes to form CuS and established that the disparity in the thermolysis behavior of molecular precursors in terms of their phase and size distribution is linked to the chain lengths of the alkyl group, which further supports the TGA result from this study. Also, the thermolysis of these molecular complexes with the coordination solvent to form CuS gives rise to more impurities for CuSb compared to CuSa and CuSc, which cement the UV spectra of the complexes, as seen in Figure S2.

2.7. UV-Vis of CuS Nanoparticles

The band gap of semiconducting materials determines their potential application in solar cells. These values can be obtained from the calculated UV-Vis data. Thus, the energy band gap was calculated from the UV-Vis data as shown in Table 1. The band gaps for the three samples are 2.70 eV, 2.05 eV, and 2.87 eV. The optical properties for the three samples show the first absorbance at 405 nm, 438 nm, and 390 nm for CuSa, CuSb, and CuSc, respectively (as seen in Figure 4a), while CuSb reveals additional peaks at 646 nm. Botha and Ajibade used copper(II) piperidine molecular complexes at three temperatures to form band gap energies between 2.93 and 3.73 eV [48]. The absorption peaks for CuSb indicate that the absorption band edges were a blue shift compared to CuSa and CuSc. The factors for such absorbance could be linked to the lattice strain, particle size, impurity center, band gap, and surface structure of the nanoparticles [49,50]. This implies that the electronic structure of the three samples confirms them as materials that can be used for DSCs, super-capacitors, and photocatalytic degradation, due to the choice of ligand, to control the synthesized CuS. The band gap value from this study is in good agreement with the recent literature [8].

2.8. PL Results of CuS Nanoparticles

Photoluminescence spectroscopy was used to study the emission capability of CuSa, CuSb, and CuSc at an excitation wavelength of 350 nm, as illustrated in Figure 5. The PL spectra display an emission at 393 nm for CuSc, which relates to the surface states for electron–hole recombination. CuSa and CuSb exhibit three emission peaks consisting of a green and blue shift. The emission peaks for the blue shift lie at 477 nm as a result of band-to-band transition. While the green shift peaks lie at 502 nm and 526 nm, they are linked to the radiative recombination between the conduction band and the copper-vacancy-related acceptor levels around the valence band edge. The slight variation in the decrement of intensity for the nanoparticles can be attributed to their particle size and morphological effects, which might affect their electronic transition. The emissions obtained in this study are concurrent with the reports from [51,52].

2.9. HRTEM Results of CuS Nanoparticles

TEM images of the copper sulfide nanoparticles for CuSa, CuSb, and CuSc are presented in Figure 6a–f. CuSa exhibits huge and distorted hexagonal shapes of nanoparticles overlapping on top of each other as an agglomeration characteristic, as shown in Figure 6a. The obtained shape could be linked to the coordinating solvent passivation on the surface of the materials, which is in accordance with the literature [44]. The diameter of CuSa is found to be around 54.30–167.73 nm. The image shows d-spacing of 0.33 nm, which correlates well with the (100) lattice plane of hexagonal CuS. Figure 6b, presenting the inset selected area electron diffraction (SAED) pattern, confirms the hexagonal CuS formation with a clearly ordered ring of a hexagonal spot. The TEM images of CuSb reveal the sphere morphology with agglomerations (see Figure 6c). The size distribution for CuSb ranges between 68.02 and 73.99 nm with an interplanar distance of 0.27 nm, which is indexed to the (006) plane of CuS. The crystallinity of CuSb was identified by the SAED inset image in Figure 6d, which is consistent with the XRD analysis [53]. The images of the CuSc nanoparticles obtained using TEM (Figure 6e) reveal uniformity and a hexagonal shape with a diameter of around 105.49–119.22 nm. The HRTEM results (see Figure 6f) display lattice spacing of 0.28 nm (103) corresponding to the CuS hexagonal structure. The SAED pattern, as seen from the inset in Figure 6f, clearly reveals the highly ordered rings of a hexagonal spot and the successful fabrication of hexagonal CuS. The size diameter variation in the HRTEM is linked to the carbon chain lengths. The obtained results from this study are similar to those from [44,53].

2.10. FESEM and EDS Results of CuS Macro/Nanoparticles

Figure 7a–f display the FESEM microgram for CuSa, CuSb, and CuSc at different magnifications. CuSa and CuSb clearly show that the self-assembled materials are hexagonal macro/nanoparticles, as seen in Figure 7a–d. This is achieved by end-to-end growth, which raises the Van der Waals force to form small particles. Also, an increase in the duration of the synthesis has been shown to favor the fabrication of hexagonal macro/nanoparticle CuS structures [53]. CuSc, on the other hand, is made up of rod-like macro/nanostructures, as shown in Figure 7e,f. Coz et al. [54] study showing that the change in SEM and TEM results in terms of mixing state, morphology, chemical composition, and size distribution differ vividly due to sulfur concentration, space, and time. This affirmed the sulfur concentration in the EDS analysis. The FESEM images for the three samples further cemented the TEM and XRD results. EDS analysis was employed to evaluate the semi-quantitative weight percentage of the elemental constituent as well as the purity of the three samples [44,45,46]. The EDS spectra shown in Figure 8a–c display the elemental constituents of C 90.23, Cu 5.31, and S 1.15 for CuSa; C 93.4, Cu 0.71, and S 0.4 for CuSb; and C 92.84, Cu 6.3, and S 0.35 for CuSc, thus confirming the purity of the as-prepared CuS sample. According to Kusior et al. [55] the concentration of Cu increases more than S, with an increasing ratio of copper ions at a ratio of 2:1, which is similar to the trend observed in this study. Also, the concentration of these elements implies that a significant quantity of the copper chloride was not retained during synthesis.

2.11. Cyclic Voltammetry Analysis of CuSa, CuSb, and CuSc Photosensitizers

Electrochemical properties of CuS materials prepared from molecular precursors with a coordination solvent enhance the electrochemical activities due to the presence of negatively charged sulfur atoms [54,56]. Also, differences in particle size or the quantum size effect influence the electrocatalytic behavior of the material [56]. As shown from the CV curve in Figure 9, the photosensitizers of CuSa, CuSb, and CuSc display reversible redox peaks at E1/2 = 0.11, 12, and 0.11. The redox potential of these sensitizers is strongly connected with the considerably longer lengths of Cu-S bonds. The coordination bond in CuSa and CuSc is thereby weakened at the central metal as a result of low electron density [57]. Also, the large bandgap and the surface defects could account for the low electrical conductivity observed from CuSa and CuSc. The enhanced electrochemical activities of CuSb are linked to the easy excitation of electrons into the conduction band, which promotes charge carriers to conduct electricity [53,56]. The redox potential difference observed implies that higher photovoltage is achieved by CuSb, which confirms the I-V results.

2.12. Current–Voltage Analysis of CuSa, CuSb, and CuSc Photosensitizers

The characteristics of current–voltage (J-V) QSSCSs devices for CuSa, CuSb, and CuSc are shown in Figure 10 and Table 2. The CuSa, CuSb, and CuSc photosensitizers have short circuit current (Jsc) values of 10–11 mA/cm2, open circuit voltages (Voc) of 0.58–0.63 V, fill factors (FF) of 0.64–0.76, and conversion efficiencies (η) of 3.885–4.63%. After 3 h, the catalytic activity of CuSa was reduced, and the performance decreased to 4.02%. On the other hand, the CuSb sensitizer, with a maximum of 4.63% at 0 h, decreased the cell performance after 3 h to 4.02% due to a low FF, which resulted in poor cell resistance. The FF is in agreement with the results of [57]. The better performance of the CuSb photon absorber could be attributed to its electronic absorption and favorable anchoring geometry in comparison to both CuSa and CuSc photosensitizers. These have shown light harvesting properties, which are similar to the study by [58]. The challenges associated with dyes with ultrafast injections but a low IPCE show sub-ns charge recombination (between the oxidized dye and the injected electrons in titania resulting in yield decrement [59]. A similar observation has been reported for complete DSSC with fast recombination in a series of organic dyes with the effect of the donor–acceptor distance [60]. Studies by Zhang and co-workers [61,62,63] show that ultrafast recombination can be attained using porous metal oxide from metal organic frames for high-performance and stable DSSCs.
So far, significant enhancements have been reported with the aim of improving these metal sulfide nanomaterials [64,65,66,67,68]. Jiao et al. [66] show an efficiency of 12.45% by doping with mesoporous carbon, compared to 11.44% for the one without nitrogen doping. This shows that a TOPO coordinating solvent could be used to fabricate photosensitizer with structure optimization to improve the conversion efficiency of QDSCs. Table 3 shows the summary of metal sulfide nanomaterial’s based on QDSCs. In a few years from now, new sulfide nanomaterials will be explored to enhance the efficiency of QDSCs in their current state.

3. Experimental Section

3.1. Materials

All the chemical reagents are of analytical grade. Ammonium, diethyl ether, aniline, carbon disulfide, piperidine, copper(II) chloride salt, oleic acids, tri-n-octylphosphine oxide (TOPO), and methanol, which were procured from Sigma, were used without further purification. Complete testing kits from Solaronix were purchased.

3.2. Ammonium N-Aniline-4-Dithiocarbamate and N-Piperidine-1-Dithiocarbamate Preparation

Ammonium N-anildithiocarbamate and ammonium N-piperldithiocarbamate were synthesized according to the procedure reported in [83], as seen in Scheme 1 and the Supplementary Materials.

3.3. Preparation of Copper Complexes: Anil-Piper-Cu(DTC)1, Anil-Cu(DTC)2 and Piper-Cu(DTC)3

Anil-piper-Cu (DTC) 1 was synthesized by dissolving 0.3362 g (2.5 mmol) of the metal salt of cucl2 in distilled water, followed by the addition of ammonium N-anildithiocarbamate (0.4658 g, 2.5 mmol) and ammonium N-piperlidithiocarbamate (0.4459 g, 2.5 mmol) in 15 mL of distilled water. The reaction occurred at room temperature and was stirred for 2 h. Brown solid precipitates were obtained and rinsed three times with about 30 mL of distilled water before filtration with filter paper (110 mm Whatmann). A similar approach was followed for the formation of anil-Cu (DTC)2 from ammonium N-anildithiocarbamate (0.4658 g, 2.5 mmol) at a ratio of (2:1), giving rise to a brown solid precipitate as the final product, and piper-Cu (DTC)3 from ammonium N-piperldithiocarbamate (0.4459 g, 2.5 mmol) to form a light brown solid precipitate as the end product [83], as seen in the Supplementary Materials.

3.4. Preparation of CuSa, CuSb, and CuSc Nanoparticles

CuSa QD nanomaterials were fabricated from the molecular precursors, (anil-piper-Cu(DTC)1, anil-Cu(DTC)2, and piper-Cu(DTC)3, using the SSP approach, as seen in Scheme 2. A total of 0.2 g of the metal complexes of (anil-piper-Cu(DTC)1) in 4 mL of oleic acid were mixed and injected into 3 g of TOPO as a stabilizing and coordinating solvent. The TOPO was heated to 20–30 degrees Celsius before being raised to 300 degrees Celsius. The reaction temperature reached 300 °C and was maintained for 1 h before the final product was collected by dropping the temperature to 70°C. The black final end product was separated by centrifugation at 2000 rpm for 30 min to remove the excess coordinating solvent and then rinsed three times with 10 mL of methanol each time, and finally air-dried for 24 h. CuSb and CuSc were both synthesized from molecular precursors (anil-Cu(DTC)2 and piper-Cu(DTC)3) using similar methods [83].

3.5. Assembling of DSSCs

DSSCs were assembled according to the study reported in [83], adopting TiO2 with 6 × 6 mm2 active areas and platinum electrodes. Sensitization of the prepared CuSa, CuSb, and CuSc was performed by soaking the TiO2 electrode in 10 mL of water with a co-adsorbent (chenodeoxycholic acid) for 24 h. The two FTO electrodes were held together with polyethylene and a soldering iron while the mediating HI-30 iodide electrolyte solution at 0.05 M was injected and sealed.

3.6. Physical Measurements

A Perkin Elmer Lambda 25 UV-Vis spectrophotometer was employed to evaluate the absorption properties. PL analysis was performed using a PerkinElmer LS 45 fluorimeter. A Bruker AV-500 NMR spectrometer was employed for the proton and carbon analyses, operating at 500.13 MHz, spinning at 4 kHz, and at 300 K. Chemical functional groups were identified using a Perkin Elmer Model 2 FTIR spectrophotometer. XRD was used to identify the structural properties of the synthesized materials with the aid of Cu-K radiation (λ = 0.15406 nm) from the Rigaku Ultima IV X-ray diffractometer. HRTEM running at 200 KV gave the details of the size distribution. At 30 KV, FE-SEM revealed the morphological characteristics, while EDS quantified the elemental composition of the three samples. TGA was carried out in N2 by the SDT-Q600 thermal analyzer. Cyclic voltammetry was determined at scan rates of 0.05–0.35 V s−1 with an increment of 0.05 V s−1 using the Gemry instrument E10101 Electrochemical Analyzer with silver reference electrodes. Current density–voltage parameters were evaluated using a Keithley 2401 source meter and a Thorax light power meter at 100 mW cm−2 (AM1.5) with a temperature below 25° to avoid cell degradation.

4. Conclusions

We have reported a cheap, easy, and environmentally friendly pathway to produce uniform nanomaterials with promising optical, structural, morphological, and thermal stability and lower toxicity using SSP techniques from molecular precursors and their application in DSCs. The emission peaks obtained from the PL analysis for the three samples are related to the surface states and defects that are vital for electron–hole recombination. Also, the observed energy band gap converts the length of the carbon chain as a factor for improving photon absorbers in DSCs. The enhanced electrochemical activities of CuSb are linked to the easy excitation of electrons into the conduction band, which promotes charge carriers to conduct electricity. The three photosensitizers yielded a remarkably high efficiency of 4.63%. It can be concluded that the choice of coordinating solvent (TOPO) used for the formation of CuSa, CuSb, and CuSc in this study improves the efficiency of the three photosensitizers, which is higher compared to our previous studies [1,2].

Supplementary Materials

The following supporting information can be downloaded at: https://www.mdpi.com/article/10.3390/inorganics11070266/s1, Figure S1: 1H NMR spectra for bis(anil-piper-Cu(DTC)1, bis(anil-Cu(DTC)2, bis(piper-Cu(DTC)3) complexes as (a–c) and their 13C NMR spectra as (d–f). Figure S2: UV-Vis (a) and FTIR (b) spectra for bis(anil-piper-Cu(DTC)1, bis(anil-Cu(DTC)2 and bis(piper-Cu(DTC)3) complexes.

Author Contributions

Conceptualization, M.A.A.; methodology, M.A.A.; validation, M.A.A.; formal analysis, M.A.A.; investigation, M.A.A.; resources, E.L.M.; data curation, M.A.A.; writing—original draft preparation, M.A.A.; writing—review and editing, M.A.A. and E.L.M.; supervision, E.L.M.; funding acquisition, E.L.M. All authors have read and agreed to the published version of the manuscript.

Funding

The authors are grateful to the Department of Science and Innovation and the National Research Foundation (GUN: 137944 and 118947) and the Govan Mbeki Research and Development Centre (GMRDC), University of Fort Hare, South Africa, for the financial support.

Data Availability Statement

Not applicable.

Conflicts of Interest

The authors declare no conflict of interest.

References

  1. Agoro, M.A.; Mbese, J.Z.; Meyer, E.L.; Onyenankeya, K. Electrochemical signature of CuS photosensitizers thermalized from alkyldithiocarbamato Cu(II) molecular precursors for quantum dots sensitized solar cells. Mater. Lett. 2021, 285, 129191. [Google Scholar] [CrossRef]
  2. Agoro, M.A.; Meyer, E.L.; Mbese, J.Z.; Manu, K. Electrochemical fingerprint of CuS-hexagonal chemistry from (bis(N-1,4-Phenyl-N-(4-morpholinedithiocarbamato) copper(II) complexes) as photon absorber in quantum-dot/dye-sensitised solar cells. Catalysts 2020, 10, 300. [Google Scholar] [CrossRef] [Green Version]
  3. Sáez, L.; Molina, J.; Florea, D.I.; Planells, E.M.; Cabeza, M.C.; Quintero, B. Characterization of l-cysteine capped CdTe quantum dots and application to test Cu(II) deficiency in biological samples from critically ill patients. Anal. Chim. Acta 2013, 785, 111–118. [Google Scholar] [CrossRef]
  4. Du, W.; Liao, L.; Yang, L.; Qin, A.; Liang, A. Aqueous synthesis of functionalized copper sulfide quantum dots as near-infrared luminescent probes for detection of Hg2+, Ag+ and Au3+. Sci. Rep. 2017, 7, 11451. [Google Scholar] [CrossRef] [Green Version]
  5. Zhang, L.; Chen, M.; Jiang, Y.; Chen, M.; Ding, Y.; Liu, Q. A facile preparation of montmorillonite-supported copper sulfide nanocomposites and their application in the detection of H2O2. Sens. Actuators B Chem. 2017, 239, 28–35. [Google Scholar] [CrossRef]
  6. Kaur, A.; Kaur, B.; Singh, K.; Kumar, R.; Chand, S. Study of precursor-dependent CuS nanostructures: Crystallographic, morphological, optical and photocatalytic activity. Bull. Mater. Sci. 2021, 44, 268. [Google Scholar] [CrossRef]
  7. Zhou, Y.; Lei, Y.; Wang, D.; Chen, C.; Peng, Q.; Li, Y. Ultra-thin Cu2S nanosheets: Effective cocatalysts for photocatalytic hydrogen production. Chem. Commun. 2015, 51, 13305–13308. [Google Scholar] [CrossRef]
  8. Liu, X.; Wang, X.; Zhou, B.; Law, W.C.; Cartwright, A.N.; Swihart, M.T. Size-controlled synthesis of Cu2-xE (E= S, Se) nanocrystals with strong tunable near-infrared localized surface plasmon resonance and high conductivity in thin films. Adv. Funct. Mater. 2013, 23, 1256–1264. [Google Scholar] [CrossRef]
  9. Wu, Y.; Wadia, C.; Ma, W.; Sadtler, B.; Alivisatos, A.P. Synthesis and photovoltaic application of copper(I) sulfide nanocrystals. Nano Lett. 2008, 8, 2551–2555. [Google Scholar] [CrossRef]
  10. Tu, X.; Ge, L.; Deng, L.; Zhang, L. Morphology Adjustment and Optimization of CuS as Enzyme Mimics for the High Efficient Colorimetric Determination of Cr (VI) in Water. Nanomaterials 2022, 12, 2087. [Google Scholar] [CrossRef]
  11. Swaidan, A.; Borthakur, P.; Boruah, P.K.; Das, M.R.; Barras, A.; Hamieh, S.; Toufaily, J.; Hamieh, T.; Szunerits, S.; Boukherroub, R. A facile preparation of CuS-BSA nanocomposite as enzyme mimics: Application for selective and sensitive sensing of Cr (VI) ions. Sens. Actuators B Chem. 2019, 294, 253–262. [Google Scholar] [CrossRef]
  12. Hu, X.S.; Shen, Y.; Xu, L.H.; Wang, L.M.; Lu, L.S.; Zhang, Y.T. Preparation of flower-like CuS by solvothermal method for photocatalytic, UV protection and EMI shielding applications. Appl. Surf. Sci. 2016, 385, 162–170. [Google Scholar] [CrossRef]
  13. Xu, W.; Zhu, S.; Liang, Y.; Li, Z.; Cui, Z.; Yang, X.; Inoue, A. Nanoporous CuS with excellent photocatalytic property. Sci. Rep. 2015, 5, 18125. [Google Scholar] [CrossRef] [Green Version]
  14. Zhao, S.; Han, G.; Li, M. Fabrication of copper sulfide microstructures with the bottle-and thorny rod-shape. Mater. Chem. Phys. 2010, 120, 431–437. [Google Scholar] [CrossRef]
  15. Xu, S.; Wang, Q.; Cheng, J.H.; Meng, Q.H.; Jiao, Y. Preparation and characteristics of porous CuS microspheres consisted of polycrystalline nanoslices. Powder Technol. 2010, 199, 139–143. [Google Scholar] [CrossRef]
  16. Nelwamondo, S.M.M.; Moloto, M.J.; Krause, R.W.M.; Moloto, N. Synthesis and characterization of alanine-capped water soluble copper sulphide quantum dots. Mater. Lett. 2012, 75, 161–164. [Google Scholar] [CrossRef]
  17. Chen, L.; Shang, Y.; Liu, H.; Hu, Y. Synthesis of CuS nanocrystal in cationic gemini surfactant W/O microemulsion. Mater. Des. 2010, 31, 1661–1665. [Google Scholar] [CrossRef]
  18. Ding, T.Y.; Wang, M.S.; Guo, S.P.; Guo, G.C.; Huang, J.S. CuS nanoflowers prepared by a polyol route and their photocatalytic property. Mater. Lett. 2008, 62, 4529–4531. [Google Scholar] [CrossRef]
  19. Roy, P.; Mondal, K.; Srivastava, S.K. Synthesis of twinned CuS nanorods by a simple wet chemical method. Cryst. Growth Des. 2008, 8, 1530–1534. [Google Scholar] [CrossRef]
  20. Saranya, M.; Nirmala Grace, D.A. Hydrothermal synthesis of CuS nanostructures with different morphology. J. Nano Res. 2012, 18, 43–51. [Google Scholar] [CrossRef]
  21. Saranya, M.; Ramachandran, R.; Samuel, E.J.J.; Jeong, S.K.; Grace, A.N. Enhanced visible light photocatalytic reduction of organic pollutant and electrochemical properties of CuS catalyst. Powder Technol. 2015, 279, 209–220. [Google Scholar] [CrossRef]
  22. Knapp, C.E.; Carmalt, C.J. Solution based CVD of main group materials. Chem. Soc. Rev. 2016, 45, 1036–1064. [Google Scholar] [CrossRef] [PubMed] [Green Version]
  23. Mann, P.B.; McGregor, I.J.; Bourke, S.; Burkitt-Gray, M.; Fairclough, S.; Ma, M.T.; Hogarth, G.; Thanou, M.; Long, N.; Green, M. An atom efficient, single-source precursor route to plasmonic CuS nanocrystals. Nanoscale Adv. 2019, 1, 522–526. [Google Scholar] [CrossRef] [PubMed] [Green Version]
  24. Castro, S.L.; Bailey, S.G.; Raffaelle, R.P.; Banger, K.K.; Hepp, A.F. Nanocrystalline chalcopyrite materials (CuInS2 and CuInSe2) via low-temperature pyrolysis of molecular single-source precursors. Chem. Mater. 2003, 15, 3142–3147. [Google Scholar] [CrossRef] [Green Version]
  25. Banger, K.K.; Jin, M.H.C.; Harris, J.D.; Fanwick, P.E.; Hepp, A.F. A new facile route for the preparation of single-source precursors for bulk, thin-film, and nanocrystallite I−III−VI semiconductors. Inorg. Chem. 2003, 42, 7713–7715. [Google Scholar] [CrossRef]
  26. Andrew, F.P.; Ajibade, P.A. Synthesis, characterization and anticancer studies of bis (1-phenylpiperazine dithiocarbamato) Cu(II), Zn(II) and Pt(II) complexes: Crystal structures of 1-phenylpiperazine dithiocarbamato-S, S′ zinc(II) and Pt(II). J. Mol. Struct. 2018, 1170, 24–29. [Google Scholar] [CrossRef]
  27. Agoro, M.A.; Meyer, E.L. The formation of SnS nanorods orthorhombic phases grown from different molecular precursors. Results Chem. 2023, 5, 100690. [Google Scholar] [CrossRef]
  28. Balakrishnan, S.; Duraisamy, S.; Kasi, M.; Kandasamy, S.; Sarkar, R.; Kumarasamy, A. Syntheses, physicochemical characterization, antibacterial studies on potassium morpholine dithiocarbamate nickel (II), copper (II) metal complexes and their ligands. Heliyon 2019, 5, 01687. [Google Scholar] [CrossRef] [PubMed] [Green Version]
  29. Agoro, M.A.; Meyer, E.L. Proficient One-Step Heat-Up Synthesis of Manganese Sulfide Quantum Dots for Solar Cell Applications. Molecules 2022, 27, 6678. [Google Scholar] [CrossRef]
  30. Kumar, L.V.; Nath, G.R. Synthesis and Characterization Studies of Cobalt(II), Nickel(II), Copper(II) and Zinc(II) Complexes of Carboxymethyl-N-Methyl-N-Phenyl Dithiocarbamate. Orient. J. Chem. 2018, 34, 3064. [Google Scholar] [CrossRef] [Green Version]
  31. Gopal, K.V.; Jyothi, P.S.; Raju, P.A.G.; Rameshbabu, K.; Sreeramulu, J. Synthesis and characterization of 2-amino pyridine dithiocarbamate ligand and its Cu(II), Co(II) metal complexes. J. Chem. Pharma Res. 2013, 5, 50–59. [Google Scholar]
  32. Agoro, M.A.; Meyer, E.L. Roles of TOPO Coordinating Solvent on Prepared Nano-Flower/Star and Nano-Rods Nickel Sulphides for Solar Cells Applications. Nanomaterials 2022, 12, 3409. [Google Scholar] [CrossRef]
  33. Botha, N.L.; Ajibade, P.A.; Ashafa, A.O. Synthesis, spectroscopic characterization, antifungal and antibacterial studies of copper(II) dithiocarbamate complexes. J. Pharm. Sci. 2018, 10, 2111–2114. [Google Scholar]
  34. Onwudiwe, D.C.; Ajibade, P.A. Synthesis, characterization and thermal studies of Zn(II), Cd(II) and Hg(II) complexes of N-methyl-N-phenyldithiocarbamate: The single crystal structure of [(C6H5)(CH3) NCS2] 4Hg2. Int. J. Mol. Sci. 2011, 12, 1964–1978. [Google Scholar] [CrossRef] [Green Version]
  35. Singh, N.; Bhattacharya, S. Synthesis and characterization of some triorgano, diorgano, monoorganotin and a triorganolead heteroaromatic dithiocarbamate complexes. J. Organomet. Chem. 2012, 700, 69–77. [Google Scholar] [CrossRef]
  36. Agoro, M.A.; Meyer, E.L. FeS/FeS2 nanoscale structures synthesized in one step from Fe(ll) dithiocarbamate complexes as a single source precursor. Front. Chem. 2022, 1500, 1035594. [Google Scholar] [CrossRef]
  37. Tetyana, P.; Mphuthi, N.; Jijana, A.N.; Moloto, N.; Shumbula, P.M.; Skepu, A.; Vilakazi, L.S.; Sikhwivhilu, L. Synthesis, Characterization, and Electrochemical Evaluation of Copper Sulfide Nanoparticles and Their Application for Non-Enzymatic Glucose Detection in Blood Samples. Nanomaterials 2023, 13, 481. [Google Scholar] [CrossRef] [PubMed]
  38. Jain, M.; Babar, D.G.; Garje, S.S. Ligand-based stoichiometric tuning in copper sulfide nanostructures and their catalytic ability. Appl. Nanosci. 2019, 9, 353–367. [Google Scholar] [CrossRef]
  39. Mnqiwu, K.; Xaba, T.; Moloto, M.; Mubiayi, K.; Mofokeng, T. Effect of Concentration on Synthesis of Organic Passivated Cu2-xS Nanoparticles from N-Pyrrolidine Dithiocarbamate Molecular Precursor. Asian J. Chem. 2018, 30, 1978–1982. [Google Scholar] [CrossRef]
  40. Han, L.; Li, H.; Lei, Y.; Cao, D. Preparation and transparent heat insulating properties of aqueous acrylic–amino–alkyd coatings with CuS nanoplates. J. Mater. Sci. Mater. 2017, 28, 14596–14604. [Google Scholar] [CrossRef]
  41. Matos, R.; Kuźniarska-Biernacka, I.; Rocha, M.; Belo, J.H.; Araújo, J.P.; Estrada, A.C.; Lopes, J.L.; Shah, T.; Korgel, B.A.; Pereira, C.; et al. Design and photo-Fenton performance of Graphene/CuS/Fe3O4 tertiary nanocomposites for Rhodamine B degradation. Catal. Today 2023, 418, 114132. [Google Scholar] [CrossRef]
  42. Liang, L.; Peng, S.; Yuan, Z.; Wei, C.; He, Y.; Zheng, J.; Gu, Y.; Chen, H. Biocompatible tumor-targeting nanocomposites based on CuS for tumor imaging and photothermal therapy. RSC Adv. 2018, 8, 6013–6026. [Google Scholar] [CrossRef] [PubMed] [Green Version]
  43. Zhao, J.; Yang, G.; Zhang, Y.; Zhang, S.; Zhang, P. A simple preparation of HDA-CuS nanoparticles and their tribological properties as a water-based lubrication additive. Tribol. Lett. 2019, 67, 1–11. [Google Scholar] [CrossRef]
  44. Raj, S.I.; Jaiswal, A.; Uddin, I. Ultrasmall aqueous starch-capped CuS quantum dots with tunable localized surface plasmon resonance and composition for the selective and sensitive detection of mercury(II) ions. RSC Adv. 2020, 10, 14050–14059. [Google Scholar] [CrossRef] [PubMed]
  45. Sahoo, A.K.; Tripathy, E.C. Antibacterial and Photocatalytic Properties of Wet Chemically Fabricated CuS/Graphene nanocomposite. Int. J. Sci. Technol. Res. 2020, 9, 265. [Google Scholar]
  46. Arshad, M.; Wang, Z.; Nasir, J.A.; Amador, E.; Jin, M.; Li, H.; Chen, Z.; ur Rehman, Z.; Chen, W. Single source precursor synthesized CuS nanoparticles for NIR phototherapy of cancer and photodegradation of organic carcinogen. J. Photochem. Photobiol. B, Biol. 2021, 214, 112084. [Google Scholar] [CrossRef] [PubMed]
  47. Duran-García, E.I.; Martínez-Santana, J.; Torres-Gómez, N.; Vilchis-Nestor, A.R.; García-Orozco, I. Copper sulfide nanoparticles produced by the reaction of N-alkyldithiocarbamatecopper(II) complexes with sodium borohydride. Mater. Chem. Phys. 2021, 269, 124743. [Google Scholar] [CrossRef]
  48. Botha, N.L.; Ajibade, P.A. Optical and structural characterization of copper sulphide nanoparticles from copper(II) piperidine dithiocarbamate. Opt. Quantum Electron. 2020, 52, 337. [Google Scholar] [CrossRef]
  49. Ravele, M.P.; Oyewo, O.A.; Onwudiwe, D.C. Controlled Synthesis of CuS and Cu9S5 and Their Application in the Photocatalytic Mineralization of Tetracycline. Catalysts 2021, 11, 899. [Google Scholar] [CrossRef]
  50. Ajibade, P.A.; Oluwalana, A.E. Enhanced photocatalytic degradation of ternary dyes by copper sulfide nanoparticles. Nanomaterials 2021, 11, 2000. [Google Scholar] [CrossRef]
  51. Vinoth, G.; Sakthivel, P.; Abinaya, S.; Kadiresan, M.R. Crystallographic, optical, photoluminescence and electrical properties of CuS quantum dots: Influence of ethylenediamine. Results Opt. 2022, 9, 100283. [Google Scholar] [CrossRef]
  52. Kumar, S.; Ganguli, A.K. Enhanced photoelectrochemical water splitting and mitigation of organic pollutants under visible light with NaNbO3@ CuS Core-Shell heterostructures. Appl. Surf. Sci. 2022, 9, 100239. [Google Scholar] [CrossRef]
  53. Srivishnu, K.S.; Prasanthkumar, S.; Giribabu, L. Cu(ii/i) redox couples: Potential alternatives to traditional electrolytes for dye-sensitized solar cells. Mater. Adv. 2021, 2, 1229–1247. [Google Scholar] [CrossRef]
  54. Coz, E.; Artíñano, B.; Robinson, A.L.; Casuccio, G.S.; Lersch, T.L.; Pandis, S.N. Individual particle morphology and acidity. Aerosol. Sci. Technol. 2008, 42, 224–232. [Google Scholar] [CrossRef]
  55. Kusior, A.; Jelen, P.; Mazurkow, J.; Nieroda, P.; Radecka, M. Synthesis of anisotropic Cu 2− x S-based nanostructures by thermal oxidation. J. Therm. Anal. Calorim. 2019, 138, 4321–4329. [Google Scholar] [CrossRef] [Green Version]
  56. Fayemi, O.E.; Pooe, O.G.; Adesanya, F.A.; Ejidike, I.P. Spectroscopy and Cyclic Voltammetry Properties of SPEEK/CuO Nanocomposite at Screen-Printed Gold Electrodes. Nanomaterials 2022, 12, 1825. [Google Scholar] [CrossRef]
  57. Mousavi-Kamazani, M.; Zarghami, Z.; Salavati-Niasari, M. Facile and novel chemical synthesis, characterization, and formation mechanism of copper sulfide (Cu2S, Cu2S/CuS, CuS) nanostructures for increasing the efficiency of solar cells. J. Phy. Chem. C. 2016, 120, 2096–2108. [Google Scholar] [CrossRef]
  58. Yadav, R.; Waghadkar, Y.; Kociok-Köhn, G.; Kumar, A.; Rane, S.B.; Chauhan, R. Transition metal ferrocenyl dithiocarbamates functionalized dye-sensitized solar cells with hydroxy as an anchoring group. Opt. Mater. 2016, 62, 176–183. [Google Scholar] [CrossRef]
  59. Li, X.; Huang, X.; Han, Y.; Chen, E.; Guo, P.; Zhang, W.; An, M.; Pan, Z.; Xu, Q.; Guo, X.; et al. High-performance γ-MnO2 dual-core, pair-hole fiber for ultrafast photonics. Ultrafast Sci. 2023, 3, 0006. [Google Scholar] [CrossRef]
  60. Guan, M.; Chen, D.; Hu, S.; Zhao, H.; You, P.; Meng, S. Theoretical insights into ultrafast dynamics in quantum materials. Ultrafast Sci. 2022, 2022, 9767251. [Google Scholar] [CrossRef]
  61. Zhang, C.; Liu, J.; Gao, Y.; Li, X.; Lu, H.; Wang, Y.; Feng, J.J.; Lu, J.; Ma, K.; Chen, X. Porous nickel oxide micron polyhedral particles for high-performance ultrafast photonics. Opt. Laser Technol. 2022, 146, 107546. [Google Scholar] [CrossRef]
  62. Zhang, C.; Li, X.; Chen, E.; Liu, H.; Shum, P.P.; Chen, X.H. Hydrazone organics with third-order nonlinear optical effect for femtosecond pulse generation and control in the L-band. Opt. Laser Technol. 2022, 151, 108016. [Google Scholar] [CrossRef]
  63. Li, X.; An, M.; Li, G.; Han, Y.; Guo, P.; Chen, E.; Hu, J.; Song, Z.; Lu, H.; Lu, J. MOF-Derived Porous Dodecahedron rGO-Co3O4 for Robust Pulse Generation. Adv. Mater. Interfaces 2022, 9, 2101933. [Google Scholar] [CrossRef]
  64. Yu, J.; Wang, W.; Pan, Z.; Du, J.; Ren, Z.; Xue, W.; Zhong, X. Quantum dot sensitized solar cells with efficiency over 12% based on tetraethyl orthosilicate additive in polysulfide electrolyte. J. Mater. Chem. A 2017, 5, 14124–14133. [Google Scholar] [CrossRef]
  65. Zhang, H.; Yang, C.; Du, Z.; Pan, D.; Zhong, X. Graphene hydrogel-based counter electrode for high efficiency quantum dot-sensitized solar cells. J. Mater. Chem. A 2017, 5, 1614–1622. [Google Scholar] [CrossRef]
  66. Jiao, S.; Du, J.; Du, Z.; Long, D.; Jiang, W.; Pan, Z.; Li, Y.; Zhong, X. Nitrogen-doped mesoporous carbons as counter electrodes in quantum dot sensitized solar cells with a conversion efficiency exceeding 12%. J. Phys. Chem. 2017, 8, 559–564. [Google Scholar] [CrossRef]
  67. Kottayi, R.; Maurya, D.K.; Sittaramane, R.; Angaiah, S. Recent Developments in Metal Chalcogenides based Quantum Dot Sensitized Solar Cells. ES Energy Environ. 2022, 18, 1–40. [Google Scholar] [CrossRef]
  68. Jun, H.K.; Tung, H.T. A Short Overview on Recent Progress in Semiconductor Quantum Dot-Sensitized Solar Cells. J. Nanomater. 2022, 2022, 1382580. [Google Scholar] [CrossRef]
  69. Kim, H.J.; Myung-Sik, L.; Gopi, C.V.; Venkata-Haritha, M.; Rao, S.S.; Kim, S.K. Cost-effective and morphology controllable PVP based highly efficient CuS counter electrodes for high-efficiency quantum dot-sensitized solar cells. Dalton Trans. 2015, 44, 11340–11351. [Google Scholar] [CrossRef]
  70. Punnoose, D.; Kumar, C.S.P.; Rao, S.S.; Varma, C.V.T.; Naresh, B.; Reddy, A.E.; Kundarala, N.; Lee, Y.S.; Kim, M.Y.; Kim, H.J. In situ synthesis of CuS nano platelets on nano wall networks of Ni foam and its application as an efficient counter electrode for quantum dot sensitized solar cells. Org. Electron. 2017, 42, 115–122. [Google Scholar] [CrossRef]
  71. Kim, H.J.; Ko, B.; Gopi, C.V.; Venkata-Haritha, M.; Lee, Y.S. Facile synthesis of morphology dependent CuS nanoparticle thin film as a highly efficient counter electrode for quantum dot-sensitized solar cells. J. Electroanal. Chem. 2017, 791, 95–102. [Google Scholar] [CrossRef]
  72. Zhang, Y.; Wang, D.; Wang, Q.; Zheng, W. One-step synthesized CuS and MWCNTs composite as a highly efficient counter electrode for quantum dot sensitized solar cells. Mater. Des. 2018, 160, 870–875. [Google Scholar] [CrossRef]
  73. Palve, B.M.; Kadam, V.S.; Jagtap, C.V.; Jadkar, S.R.; Pathan, H.M. A simple chemical route to synthesis the CuSe and CuS counter electrodes for titanium oxide based quantum dot solar cells. J. Mater. Sci. Mater. Electron. 2017, 28, 14394–14401. [Google Scholar] [CrossRef]
  74. Punnoose, D.; Rao, S.S.; Kim, S.K.; Kim, H.J. Exploring the effect of manganese in lead sulfide quantum dot sensitized solar cell to enhance the photovoltaic performance. RSC Adv. 2015, 5, 33136–33145. [Google Scholar] [CrossRef]
  75. González-Pedro, V.; Sima, C.; Marzari, G.; Boix, P.P.; Giménez, S.; Shen, Q.; Dittrich, T.; Mora-Seró, I. High performance PbS Quantum Dot Sensitized Solar Cells exceeding 4% efficiency: The role of metal precursors in the electron injection and charge separation. Phys. Chem. Chem. Phys. 2013, 15, 13835–13843. [Google Scholar] [CrossRef] [PubMed] [Green Version]
  76. Muthalif, M.P.A.; Lee, Y.S.; Sunesh, C.D.; Kim, H.J.; Choe, Y. Enhanced photovoltaic performance of quantum dot-sensitized solar cells with a progressive reduction of recombination using Cu-doped CdS quantum dots. Appl. Surf. Sci. 2017, 396, 582–589. [Google Scholar] [CrossRef]
  77. Dou, Y.; Zhou, R.; Wan, L.; Niu, H.; Zhou, J.; Xu, J.; Cao, G. Nearly monodisperse PbS quantum dots for highly efficient solar cells: An in situ seeded ion exchange approach. Chem. Commun. 2018, 54, 12598–12601. [Google Scholar] [CrossRef]
  78. Ahmed, R.; Zhao, L.; Mozer, A.J.; Will, G.; Bell, J.; Wang, H. Enhanced electron lifetime of CdSe/CdS quantum dot (QD) sensitized solar cells using ZnSe core–shell structure with efficient regeneration of quantum dots. J. Phys. Chem. C. 2015, 119, 2297–2307. [Google Scholar] [CrossRef]
  79. Gao, B.; Shen, C.; Yuan, S.; Zhang, B.; Zhang, M.; Yang, Y.; Chen, G. Influence of nanocrystal size on the quantum dots sensitized solar cells’ performance with low temperature synthesized CdSe quantum dots. J. Alloy. Compd. 2014, 612, 323–329. [Google Scholar] [CrossRef]
  80. Gao, B.; Shen, C.; Zhang, B.; Zhang, M.; Yuan, S.; Yang, Y.; Chen, G. Green synthesis of highly efficient CdSe quantum dots for quantum-dots-sensitized solar cells. J. Appl. Phys. 2014, 115, 193104. [Google Scholar] [CrossRef]
  81. Quan, L.; Li, W.; Zhu, L.; Geng, H.; Chang, X.; Liu, H. A new in-situ preparation method to FeS counter electrode for quantum dots-sensitized solar cells. J. Power Sources 2014, 272, 546–553. [Google Scholar] [CrossRef]
  82. Li, Y.; Yin, J.; Chu, C.; Sui, N.; Shi, S.; Wei, J.; Di, F.; Guo, J.; Wang, C.; Xu, W.; et al. Earth-abundant Fe1− x S@ S-doped graphene oxide nano–micro composites as high-performance cathode catalysts for green solar energy utilization: Fast interfacial electron exchange. RSC Adv. 2018, 8, 4340–4347. [Google Scholar] [CrossRef] [Green Version]
  83. Agoro, M.A.; Meyer, E.L.; Mbese, J.Z.; Fuku, X.; Ahia, C.C. Aliphatic mixed ligands Sn(II) complexes as photon absorbers in quantum dots sensitized solar cell. J. Solid State Chem. 2022, 308, 122890. [Google Scholar] [CrossRef]
Figure 1. TGA and DTG analysis for bis(anil-piper-Cu(DTC)1 (a), bis(anil-Cu(DTC)2 (b), and bis(piper-Cu(DTC)3) (c) complexes.
Inorganics 11 00266 g001
Figure 2. FTIR spectra of CuSa, CuSb, and CuSc nanoparticles.
Inorganics 11 00266 g002
Figure 3. XRD spectra of CuS a–c with reference to JCPDS card no. 060464 and JCPDS card no. 00–001-1281.
Inorganics 11 00266 g003
Figure 4. UV-vis spectra (a) and Tauc plot (b) of CuSa, CuSb, and CuSc.
Inorganics 11 00266 g004
Figure 5. PL spectra of CuSa, CuSb, and CuSc nanoparticles.
Inorganics 11 00266 g005
Figure 6. HRTEM images of CuSa (a,b), CuSb (c,d), and CuSc (e,f) and inset SAED and d-spacing spectra.
Inorganics 11 00266 g006
Figure 7. FESEM images of CuSa (a,b), CuSb (c,d), CuSc (e,f) nanoparticles.
Inorganics 11 00266 g007
Figure 8. EDS spectra of CuSa (a), CuSb (b), CuSc (c) nanoparticles.
Inorganics 11 00266 g008
Figure 9. CV curve of CuSa, CuSb, and CuSc photosensitizers.
Inorganics 11 00266 g009
Figure 10. I−V of CuSa, CuSb, and CuSc photosensitizers.
Inorganics 11 00266 g010
Scheme 1. Synthesis of bis(N-anil-N-piperldithiocarbamato)copper(II) complexes.
Inorganics 11 00266 sch001
Scheme 2. Preparation of CuSa, CuSb, and CuSc nanoparticles.
Inorganics 11 00266 sch002
Table 1. Summary of dominant peaks of copper metal sulfide nanoparticles prepared from various approaches.
Samples2-ThetaMiller’s Index
(Lattice Plane)
FWHMAverage Size (nm) from XRDTEM Particle Size (nm)Atomic Percentage from EDSBand Gap (eV)
CuS
CuSa26.2°(101)0.1934.8854.30–167.735.311.152.70
38.6°(105)0.23
52.3°(108)0.26
CuSb27.3°(101)0.1957.2563.02–73.990.710.42.05
38.5°(105)0.29
52.3°(108)0.25
CuSc26.34°(101)0.2125.08105.49–119.226.30.352.87
38.78°(105)0.39
48.96°(110)0.31
Table 2. Electrochemical data and J–V parameters of CuSa, CuSb, and CuSc photosensitizers.
Parameters
SensitizersEp,a (V)Ep,c (V)∆Ep = Ep,a – Ep,c (V)E° = ½(Ep,a – Ep,c) (V)ip,a/ip,cJSC (mA/cm2)VOC (V)FFη (%)
CuSa 0 hr0.170.390.220.111.85110.600.684.48
3 hr 100.600.674.02
CuSb 0 hr0.150.390.240.120.47100.610.764.63
3 hr 100.600.674.02
CuSc 0 hr0.170.390.220.110.44100.630.644.03
3 hr 100.580.673.88
Table 3. The summary of metal sulfide nanomaterial’s based on QDSCs.
SensitizersJSC (mA/cm2)VOC (V)FFη (%)Ref.
CuS12.360.5910.4353.18[68]
CuS17.80.610.544.93[69]
CuS2h15.520.6120.4524.29[70]
CuS/MWCNTs18.6800.6180.4555.254[71]
CuS0.710.58481.38[72]
Mn-PbS17.340.530.484.25[73]
Pb(Ac)–Cd(Ac)22.280.4160.4534.20[74]
CdCuS39.400.6370.5013.00[75]
PbS QD25.010.5667.39.43[76]
CdSe/CdS13.45800.513.99[77]
CdSe10.580.60.5643.7[78]
CdSe11.86549.31523.39[79]
SnS170.720.678.20[80]
FeS20.400.420.403.34[81]
Fe1−xS14.080.720.727.23[82]
CuSb 0 hr100.610.764.63Present study
Disclaimer/Publisher’s Note: The statements, opinions and data contained in all publications are solely those of the individual author(s) and contributor(s) and not of MDPI and/or the editor(s). MDPI and/or the editor(s) disclaim responsibility for any injury to people or property resulting from any ideas, methods, instructions or products referred to in the content.

