Article

Effect of Sintering Temperature on the Magnetic Properties of Fe3Mn3Co60.66Si33.34

1
College of Big Data and Information Engineering, Guizhou University, Guiyang 550025, China
2
School of Physics and Electronic Science, Zunyi Normal College, Zunyi 563006, China
*
Author to whom correspondence should be addressed.
Inorganics 2023, 11(7), 272; https://doi.org/10.3390/inorganics11070272
Submission received: 21 April 2023 / Revised: 15 June 2023 / Accepted: 19 June 2023 / Published: 25 June 2023
(This article belongs to the Section Inorganic Materials)

Abstract

:
With the rapid development of society, the demand for information storage is increasing. Hence, research involving magnetic storage materials is gaining importance. In this study, Fe 3 Mn 3 Co 60.66 Si 33.34 powders were prepared via mechanical alloying and sintering. The effect of the sintering temperature on the crystal structure was analyzed by X-ray diffraction, and the results showed that doped Co 2 Si powder was successfully prepared. Vibrating sample magnetometry was used to investigate the magnetic properties of Fe 3 Mn 3 Co 60.66 Si 33.34 , and showed that the coercivity of the samples decreased with increasing sintering temperature. Fe 3 Mn 3 Co 60.66 Si 33.34 sintered at 950 °C yielded a magnetic saturation strength of 36.42 emu/g, coercivity of 135.92 Oe, and remanent magnetization of 4.97 emu/g. Electron microscopy analyses showed that the prepared particles were spherical, and the average grain size increased with increasing sintering temperature. The electromagnetic loss was analyzed by simulating electromagnetic parameters, which revealed that the electromagnetic loss tangent decreased with increasing sintering temperature. Hence, it is inferred that Fe 3 Mn 3 Co 60.66 Si 33.34  powder materials sintered at high temperatures are expected to have suitable properties for magnetic storage applications.

1. Introduction

Magnetic materials used in engineering are broadly classified as magnetic materials, hard magnetic materials, and semi-hard magnetic materials. Magnetic materials are mainly used in the core of transformers, motors, and inductance coils. Hard magnetic materials are often used in permanent magnets; and semi-hard magnetic materials are mostly used in magnetic recording devices. Therefore, it is necessary to obtain sufficiently high coercivity and remanence [1]. Co-based alloys are widely used as magnetic materials because of their advantages such as low coercivity, high permeability, and low saturation magnetostriction coefficient [2].
In a previous study, the extended plane-wave plus local-orbit method and the generalized gradient approximation was used to theoretically calculate the electronic structures and electronic energy loss near-edge structures of three different cobalt-silicon systems, Co 2 Si, CoSi, and CoSi 2 [3]. The results showed that Co 2 Si had metallic properties, but its magnetic properties were not considered. Liu et al. [4] prepared Co 2 Si nanowires with different morphologies and structures by chemical vapor deposition by changing the reaction conditions and using different substrates. By analyzing the magnetic properties of single Co 2 Si nanowires, they observed that a single-domain structure existed in the nanowires and that the residual magnetization was 217.7 emu/g. Zhang et al. [5] synthesized a thin layer of silicide with good performance by injecting cobalt metal ions with a beam density of 0.25–1.25 A/m 2 and an injection amount of 5 × 10 17 cm 2 into silicon. The structure of the implanted layer was analyzed by transmission electron microscopy (TEM) and electron diffraction, and the results showed that three types of cobalt silicides, namely, Co 2 Si, CoSi, and CoSi 2 , were formed in the implanted layer.
Yuan et al. [6] prepared Co 43 Fe 20 Ta 5.5 B 31.5 amorphous alloy ribbons using a single-ro-ller melt-spinning method. The effects of crystallization on the microstructure and magnetic properties under isothermal and non-isothermal crystallization conditions were studied using differential thermal analysis, X-ray diffraction (XRD), and vibrating sample magnetometry (VSM). The results showed that after crystallization treatment, the magnetic saturation strength (M s ) value of the alloy increased from 37.2 A·m 2 /kg to 58.4 A·m 2 /kg, and the coercivity (H c ) also increased from 1.25 × 79.6 A/m to 634.45 × 79.6 A/m. Lei et al. [7] prepared a Co 73 Si 10 B 17 amorphous material using a single-roll rapid solidification method, and studied its glass-forming ability and magnetic properties. Their results showed that the Co 73 Si 10 B 17 amorphous alloy had excellent soft magnetic properties with a saturation magnetic induction intensity of 1.04 T and zero power loss, remanence, as well as coercivity. Makino et al. [8] systematically studied the influence of the composition of Co-Fe-Si-B amorphous alloys on their magnetic properties. The lowest H c and highest permeability were obtained at (Si+B) fractions of 25% and 60%, and the structure had high thermal stability, similar to Co 70.5 Fe 4.5 Si 5 B 20 and Co 70.5 Fe 4.5 Si 15 B 10 amorphous alloys. The H c was 0.96 A/m, M s was 116 × 10 6 Wbm/kg, and the maximum permeability was 18,700 at a frequency of 0.3 kHz. High H s and permeability, and low H c values indicated that the material was suitable for use with amorphous head materials. Li et al. [9] synthesized Co 2 Si nanowires by chemical vapor deposition and studied their morphology and crystal structure by scanning electron microscopy and TEM. The results showed that the Co 2 Si nanowires possessed a highly crystalline structure, but their magnetic properties were not studied.
Zou et al. [10] prepared Co 2 Si, Fe, and Mn single-doped Co 2 Si and Fe-Mn co-doped Co 2 Si powder materials by mechanical alloying and thermal sintering. They reported that doping can effectively improve the magnetic properties of Co 2 Si. Moreover, Fe-Mn co-doped Co 2 Si exhibited the best soft magnetic properties. However, the effect of the sintering temperature on the microstructure and magnetic properties of Fe 3 Mn 3 Co 60.66 Si 33.34 was not studied. Therefore, this study mainly investigates the effect of different sintering temperatures on the magnetic properties of Fe-Mn co-doped Co 2 Si.

2. Experiment

Commercially available Fe, Mn, Co, and Si powders of 99.9% purity were used to prepare 10 g samples with a molar fraction ratio of 3:3:60.66:33.34 [11]. The weighed powder was mixed and placed in a stainless-steel omni-directional ball mill (OECO-PBM-AD-6-L, Hunan Deke). Stainless steel balls with diameters of 1.5 cm, 1 cm, and 0.3 cm were used, and the total mass was 500 g. To reduce the difference caused by ball milling, the number of balls with diameters of 1.5 cm and 1 cm were left unchanged, and the rest were filled with balls. The ball mill speed was 400 r/min, the ball-to-powder ratio was 50:1, and the ball milling time was 30 h. To prevent the powder from being oxidized during the ball milling process, the ball mill was vacuumed, and the degree of vacuum was below 5 Pa. To prevent the powder from being oxidized during the ball milling process, stainless-steel ball milling was conducted under vacuum. The alloyed powder was annealed in a tube furnace (GSL-1500). To prevent oxidation during annealing, nitrogen was used as a protective gas, and the sintering time was 2 h. To obtain Fe-Mn co-doped Co 2 Si samples, the samples were heat-treated at the sintering temperatures of 600 °C, 700 °C, 800 °C, 900 °C, and 950 °C. The structures of the sintered samples were characterized by XRD (D8 ADVANCE, Bruker, Germany) [12], and the magnetic properties were measured by VSM (7404, LakeShore, LA, America) [13]. The microstructures of the samples were visualized by TEM [14], and the electromagnetic parameters were obtained by vector network analysis. Then, the electromagnetic loss was simulated and analyzed using the electromagnetic parameters [15].

3. Results and Analysis

3.1. XRD Analysis

Figure 1 show the XRD patterns of Fe 3 Mn 3 Co 60.66 Si 33.34 sintered at temperatures from 600 to 950 °C. The XRD pattern of ball milling was added to the original XRD pattern, and the results show that the diffraction peaks of all group elements disappeared and formed a large wave packet, which indicates the formation of a solid solution. The XRD pattern after heat treatment was fitted by JADE 6.5, and the Co 2 Si phase precipitated from the solid solution of the ball-milled powder after sintering at different temperatures. This is in perfect agreement with the standard PDF#98-005-2281. The crystal structure is an orthorhombic crystal system with space group Pbnm and lattice constants a, b, and c of 4.9180 Å, 3.7380 Å, and 7.1090 Å, respectively. The exposed weaves are (210), (202), (013), (211), (020), and (203) with 100% intensity of the strongest peak and 22.6% intensity of the weakest peak.
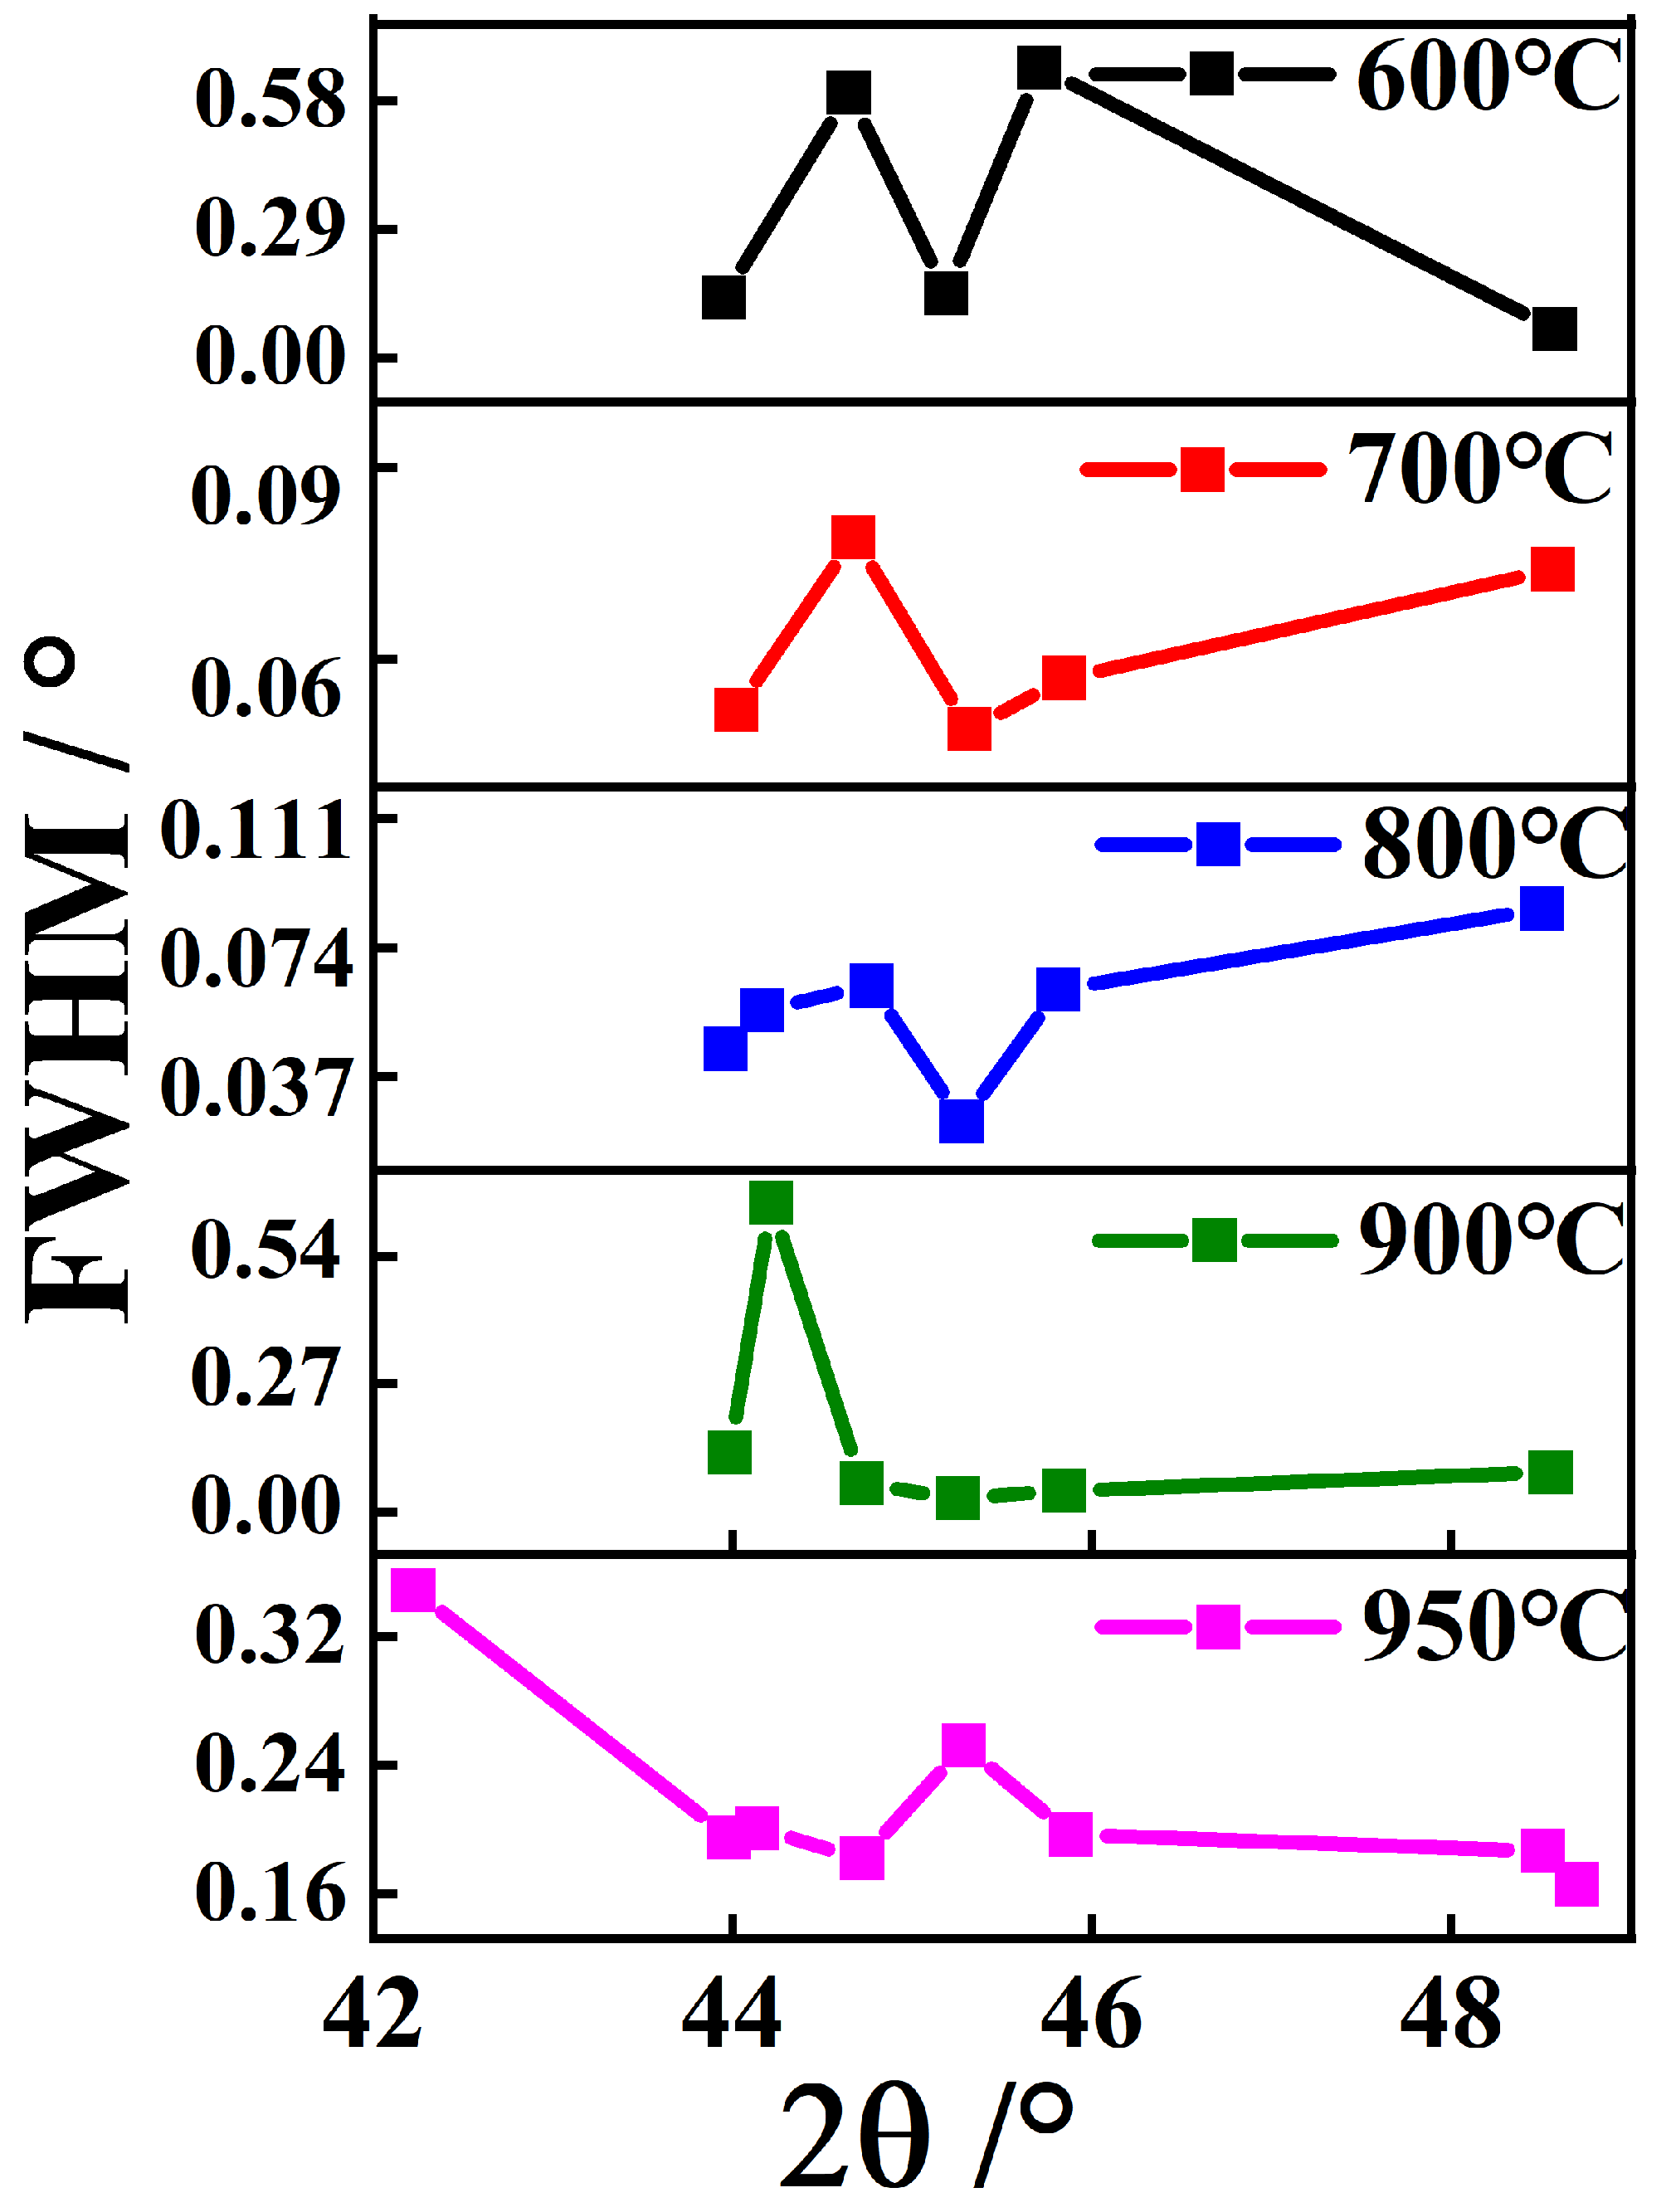
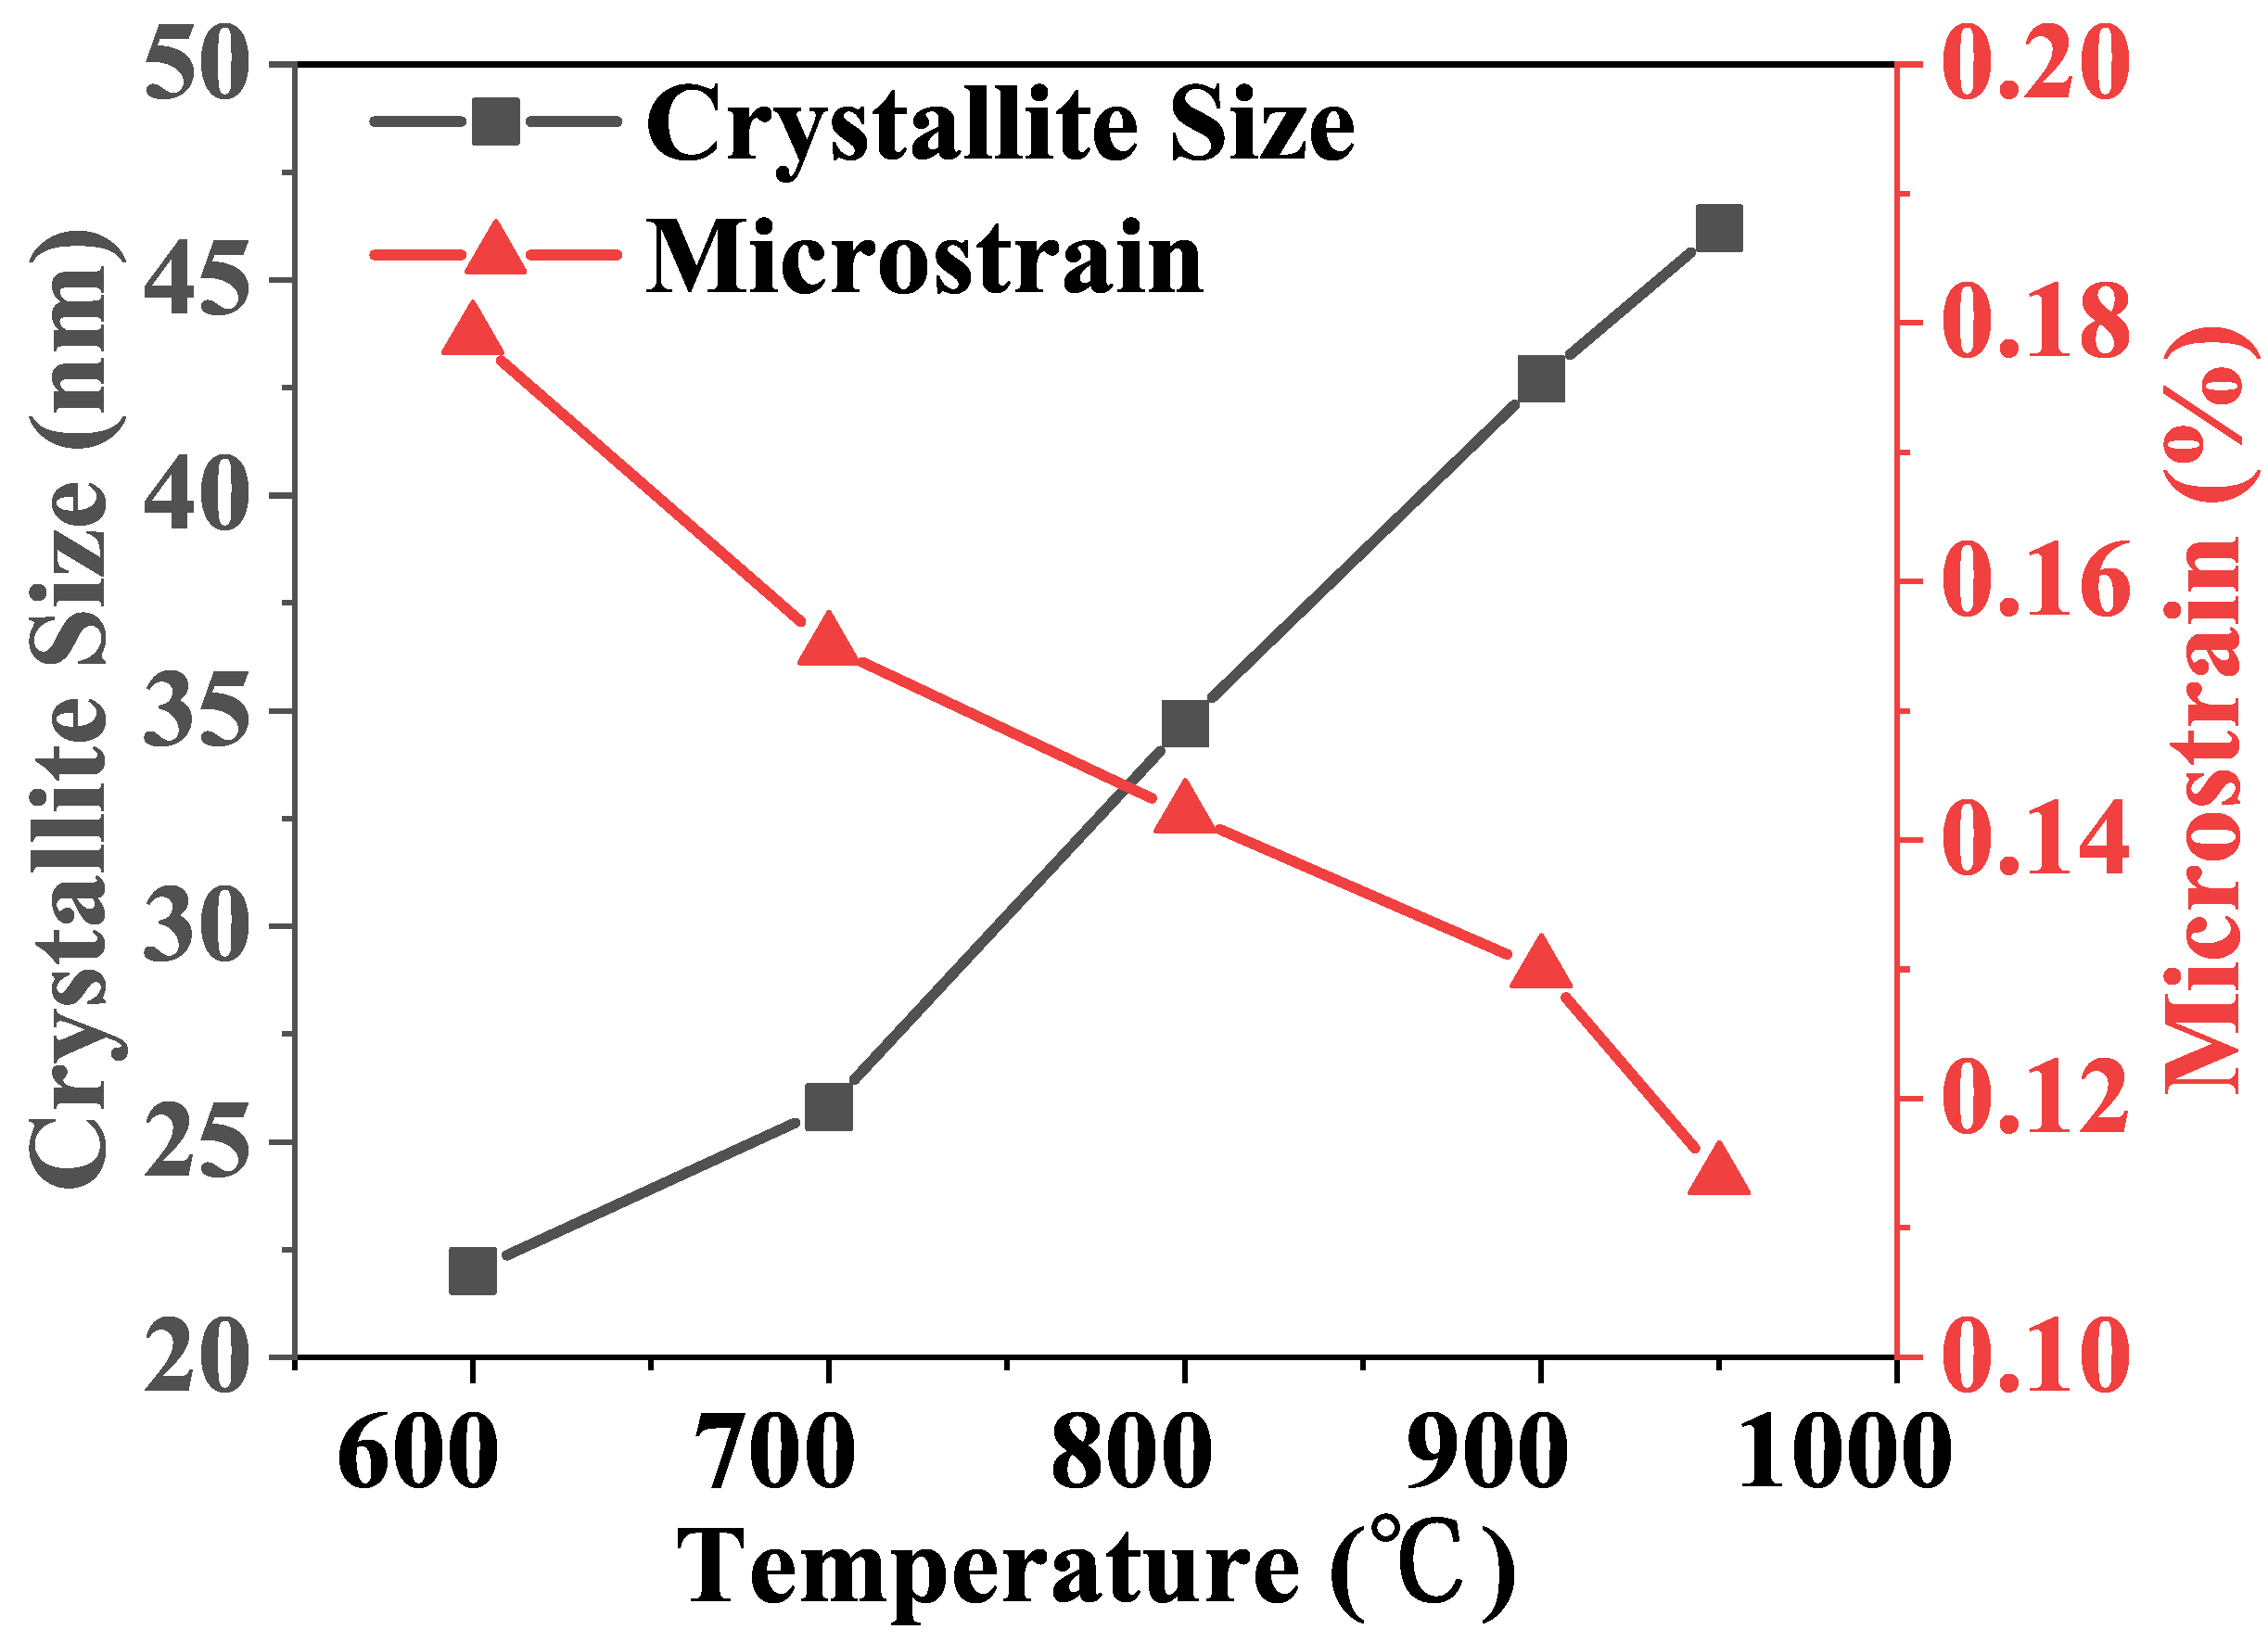
After comparison with the standard PDF card, it is evident that there is a slight shift in the peak position of the diffraction peak, and the broadening behavior of the diffraction peak persists even after the low-temperature heat treatment. According to the W-H method, grain refinement and an increase in microstrain can cause broadening of the diffraction peak. Therefore, we calculated the grain size and microscopic strain using the W-H method [16]. Figure 2 shows the full width at half maximum (FWHM) of the diffraction peaks of the samples sintered at different temperatures, in the range 41°–51° as obtained by JADE 6.5 [17]. Figure 3 shows the crystallite sizes and microstrain. The results show that the grain size increases and the microscopic strain decreases with increasing sintering temperature, which is consistent with the XRD pattern exhibited by Tupou. The diffraction peaks exhibit broadening even after sintering, which may be due to the short sintering time. The sintering temperature is not sufficiently high to completely release the internal stress during heat treatment. The HRTEM image shows that the powder is still amorphous, which may also be the reason for the broadening of the diffraction peaks.
β h k l = β s + β D
β h k l = k λ D c o s θ + 4 ε t a n θ
β s = 4 ε t a n θ
where, D is the grain size (nm), β h k l is the FWHM, λ is the wavelength, k is a constant equal to 0.94, ε is the strain, β D is the broadening of the diffraction peaks due to size, β S is the broadening of the diffraction peaks due to strain, and θ is the peak position.

3.2. Microscopic Morphology Analysis

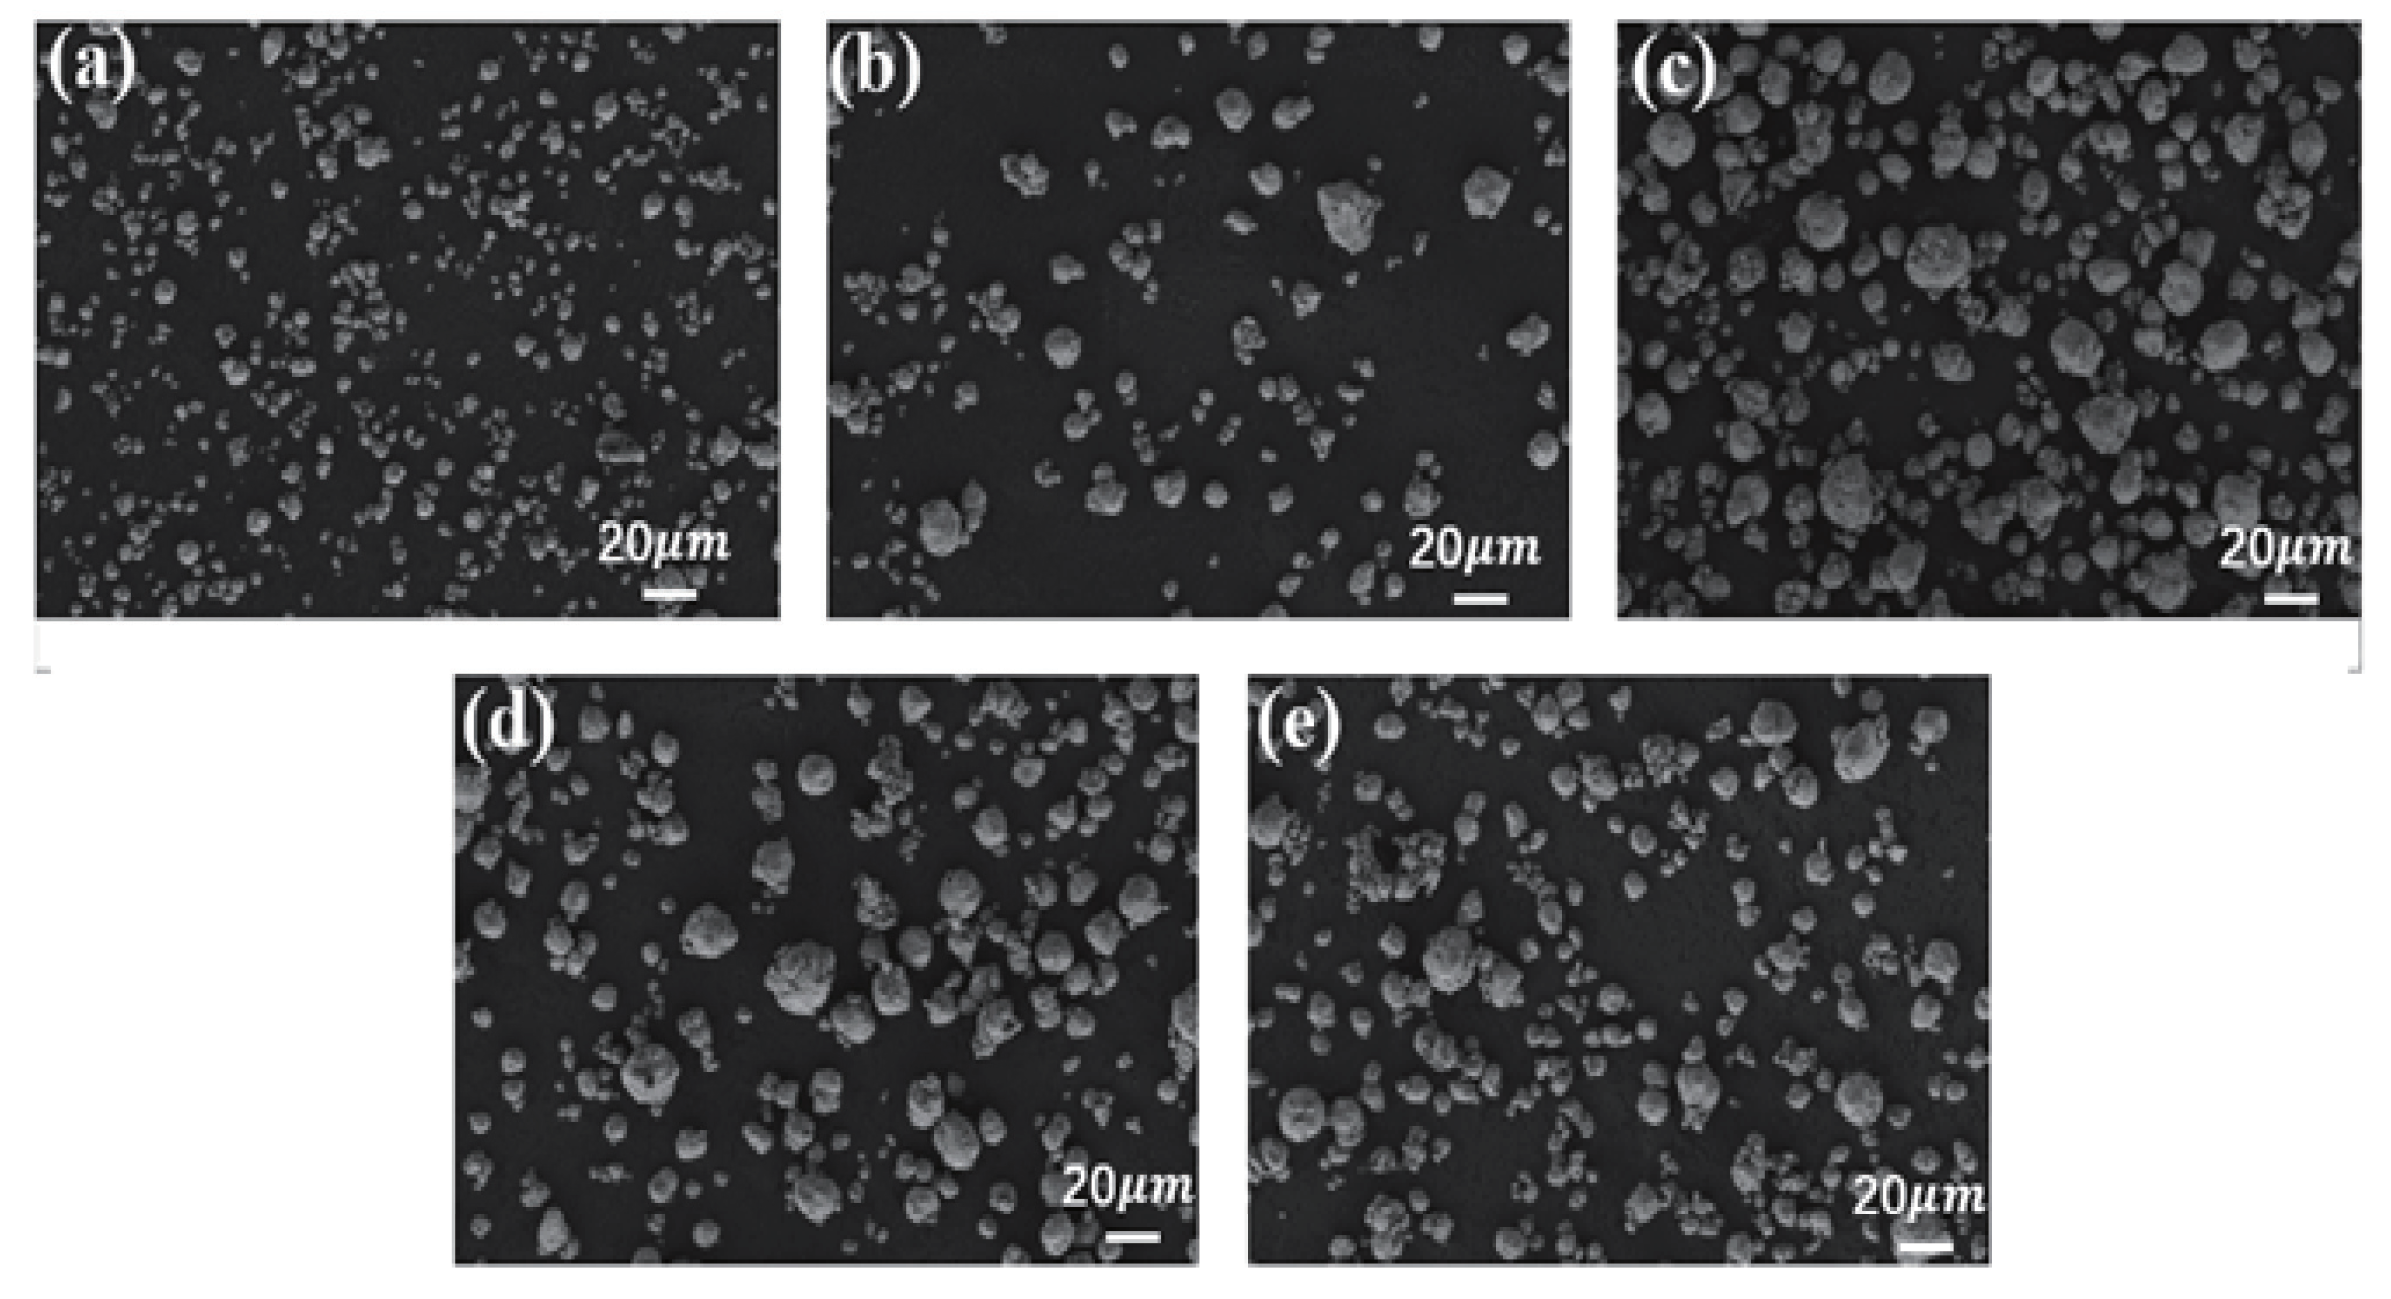
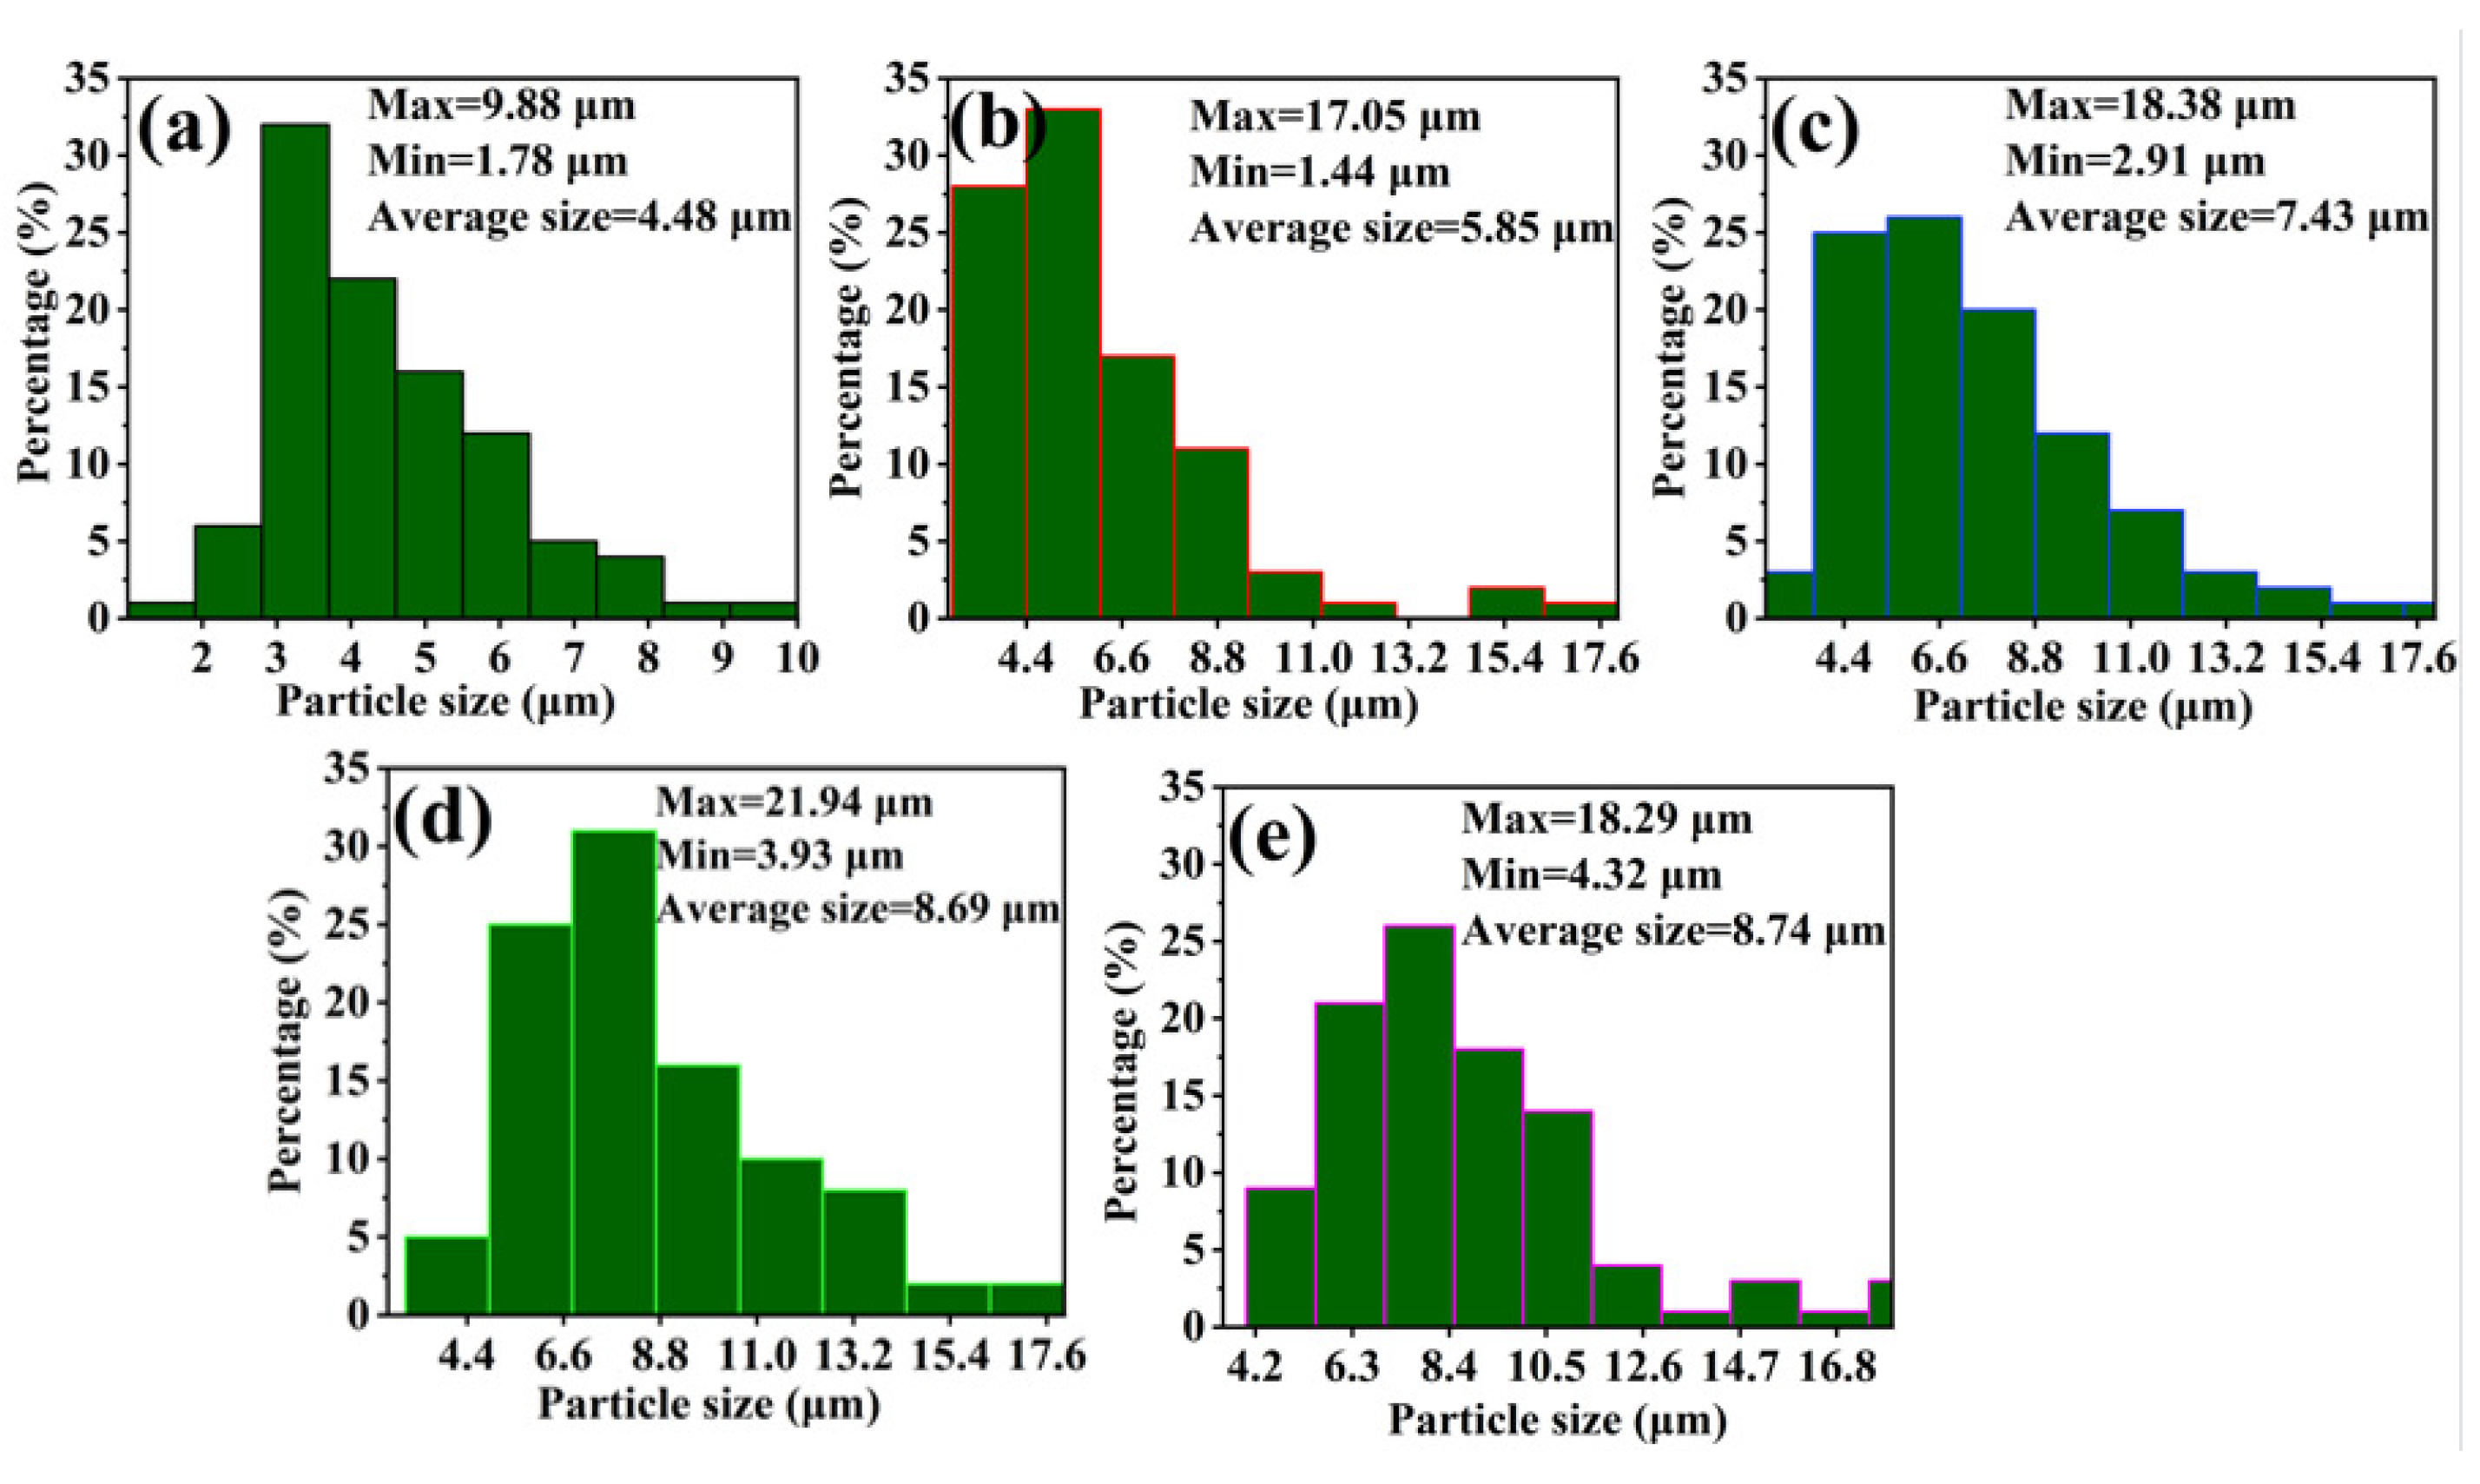
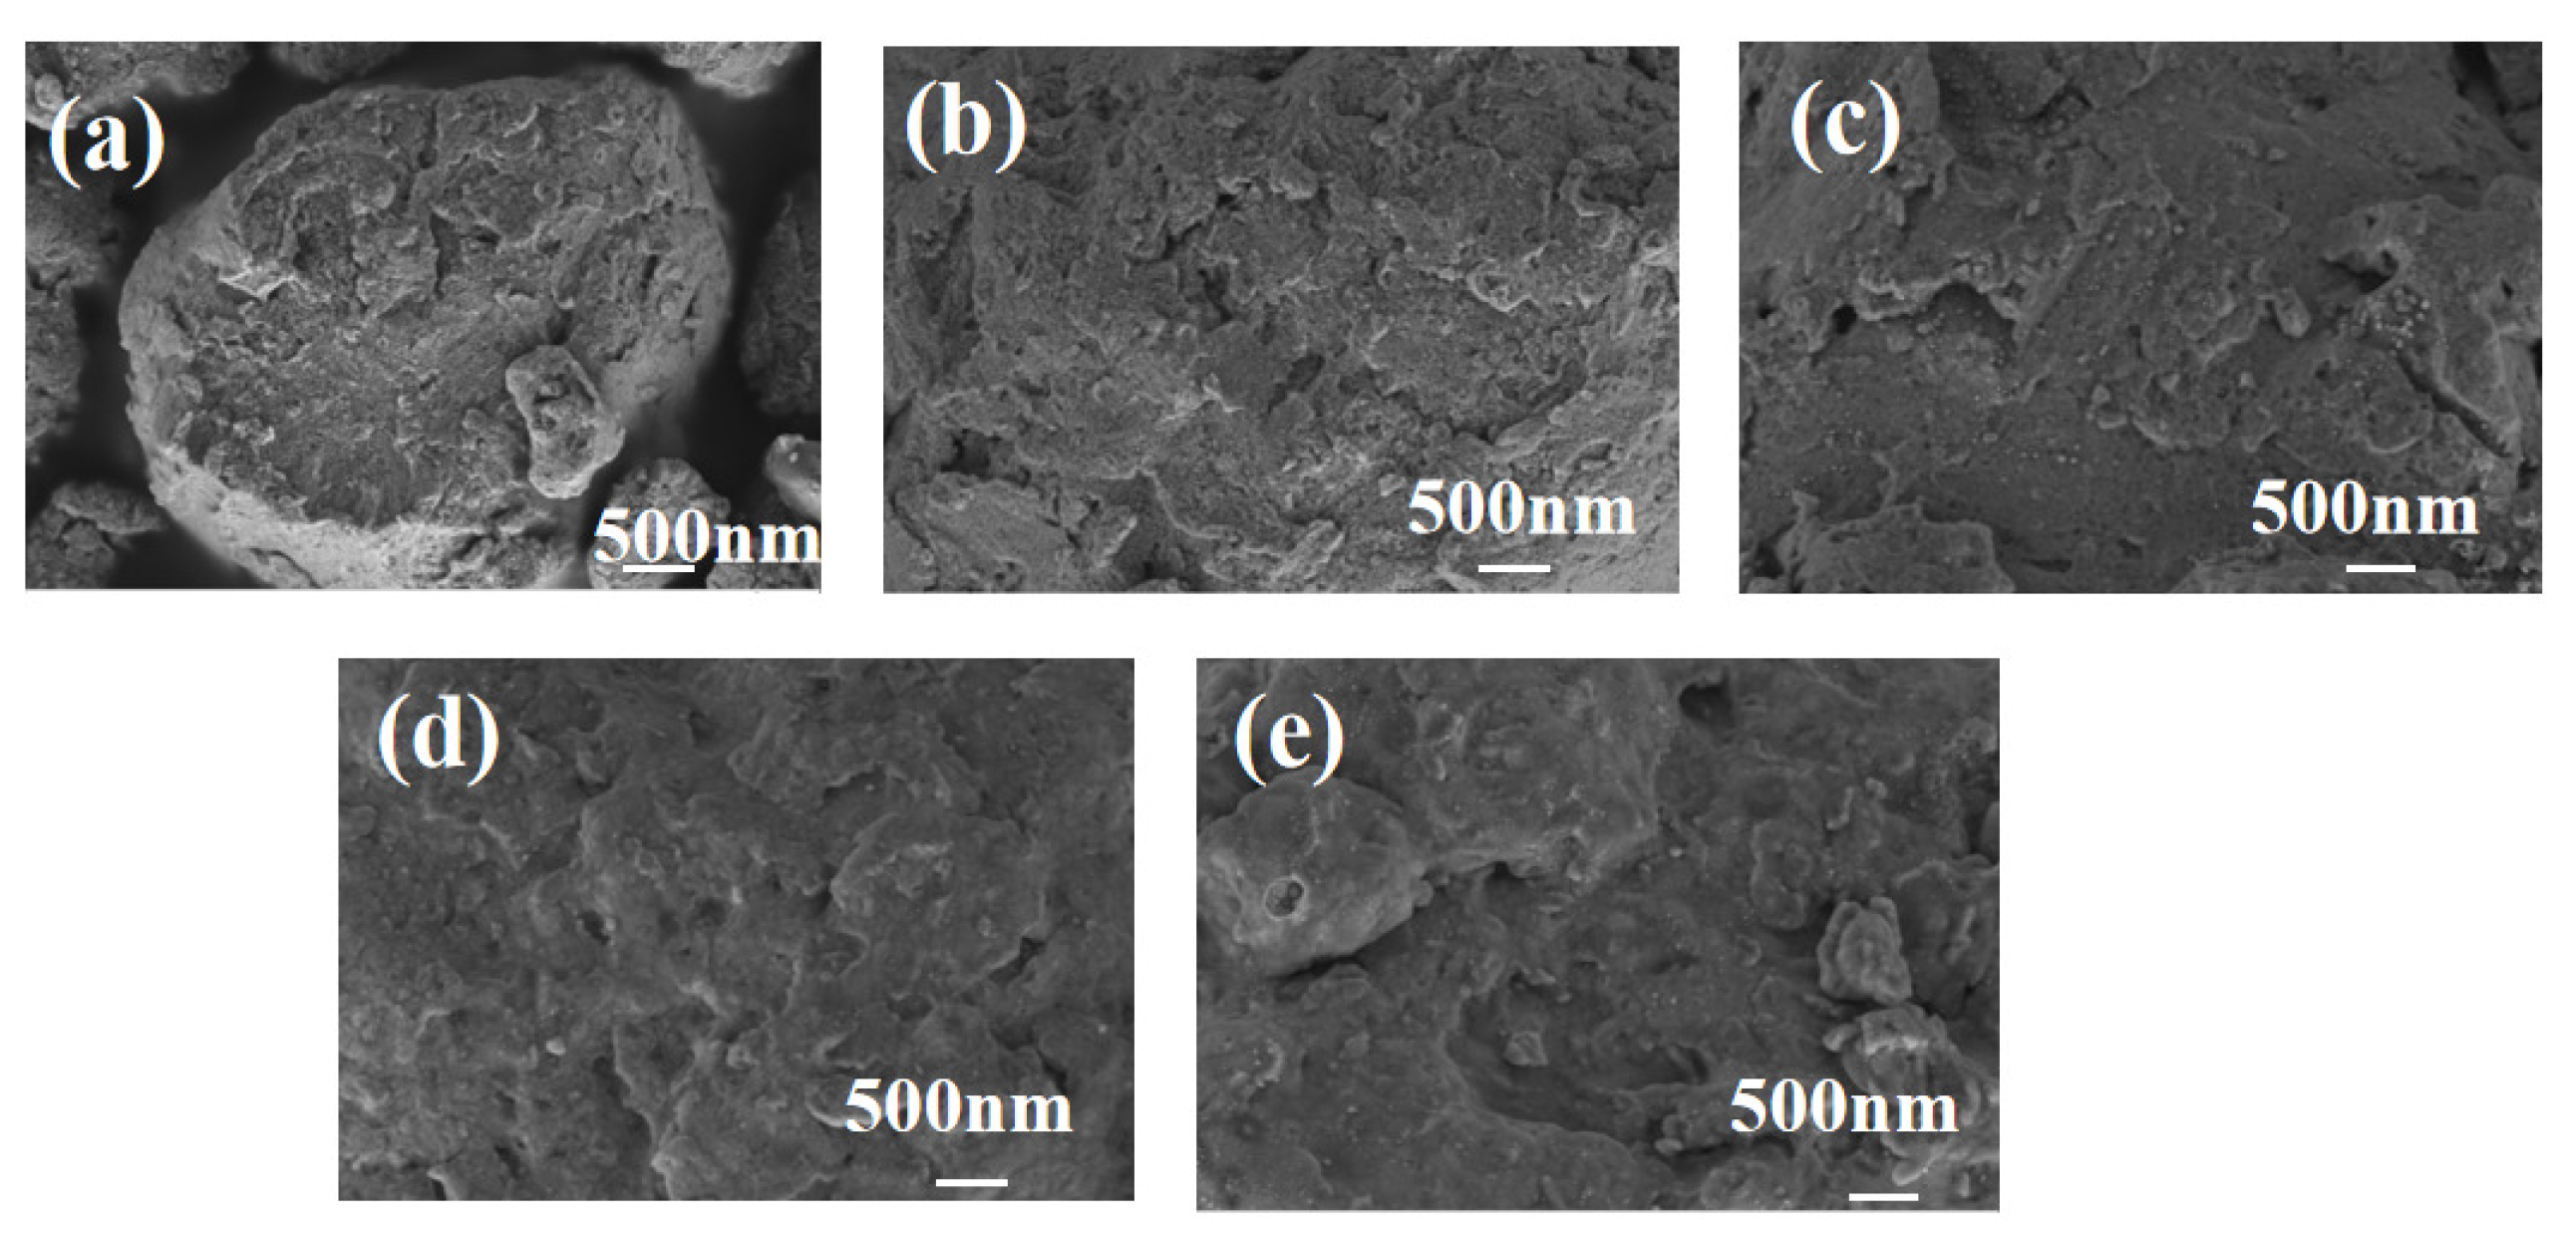
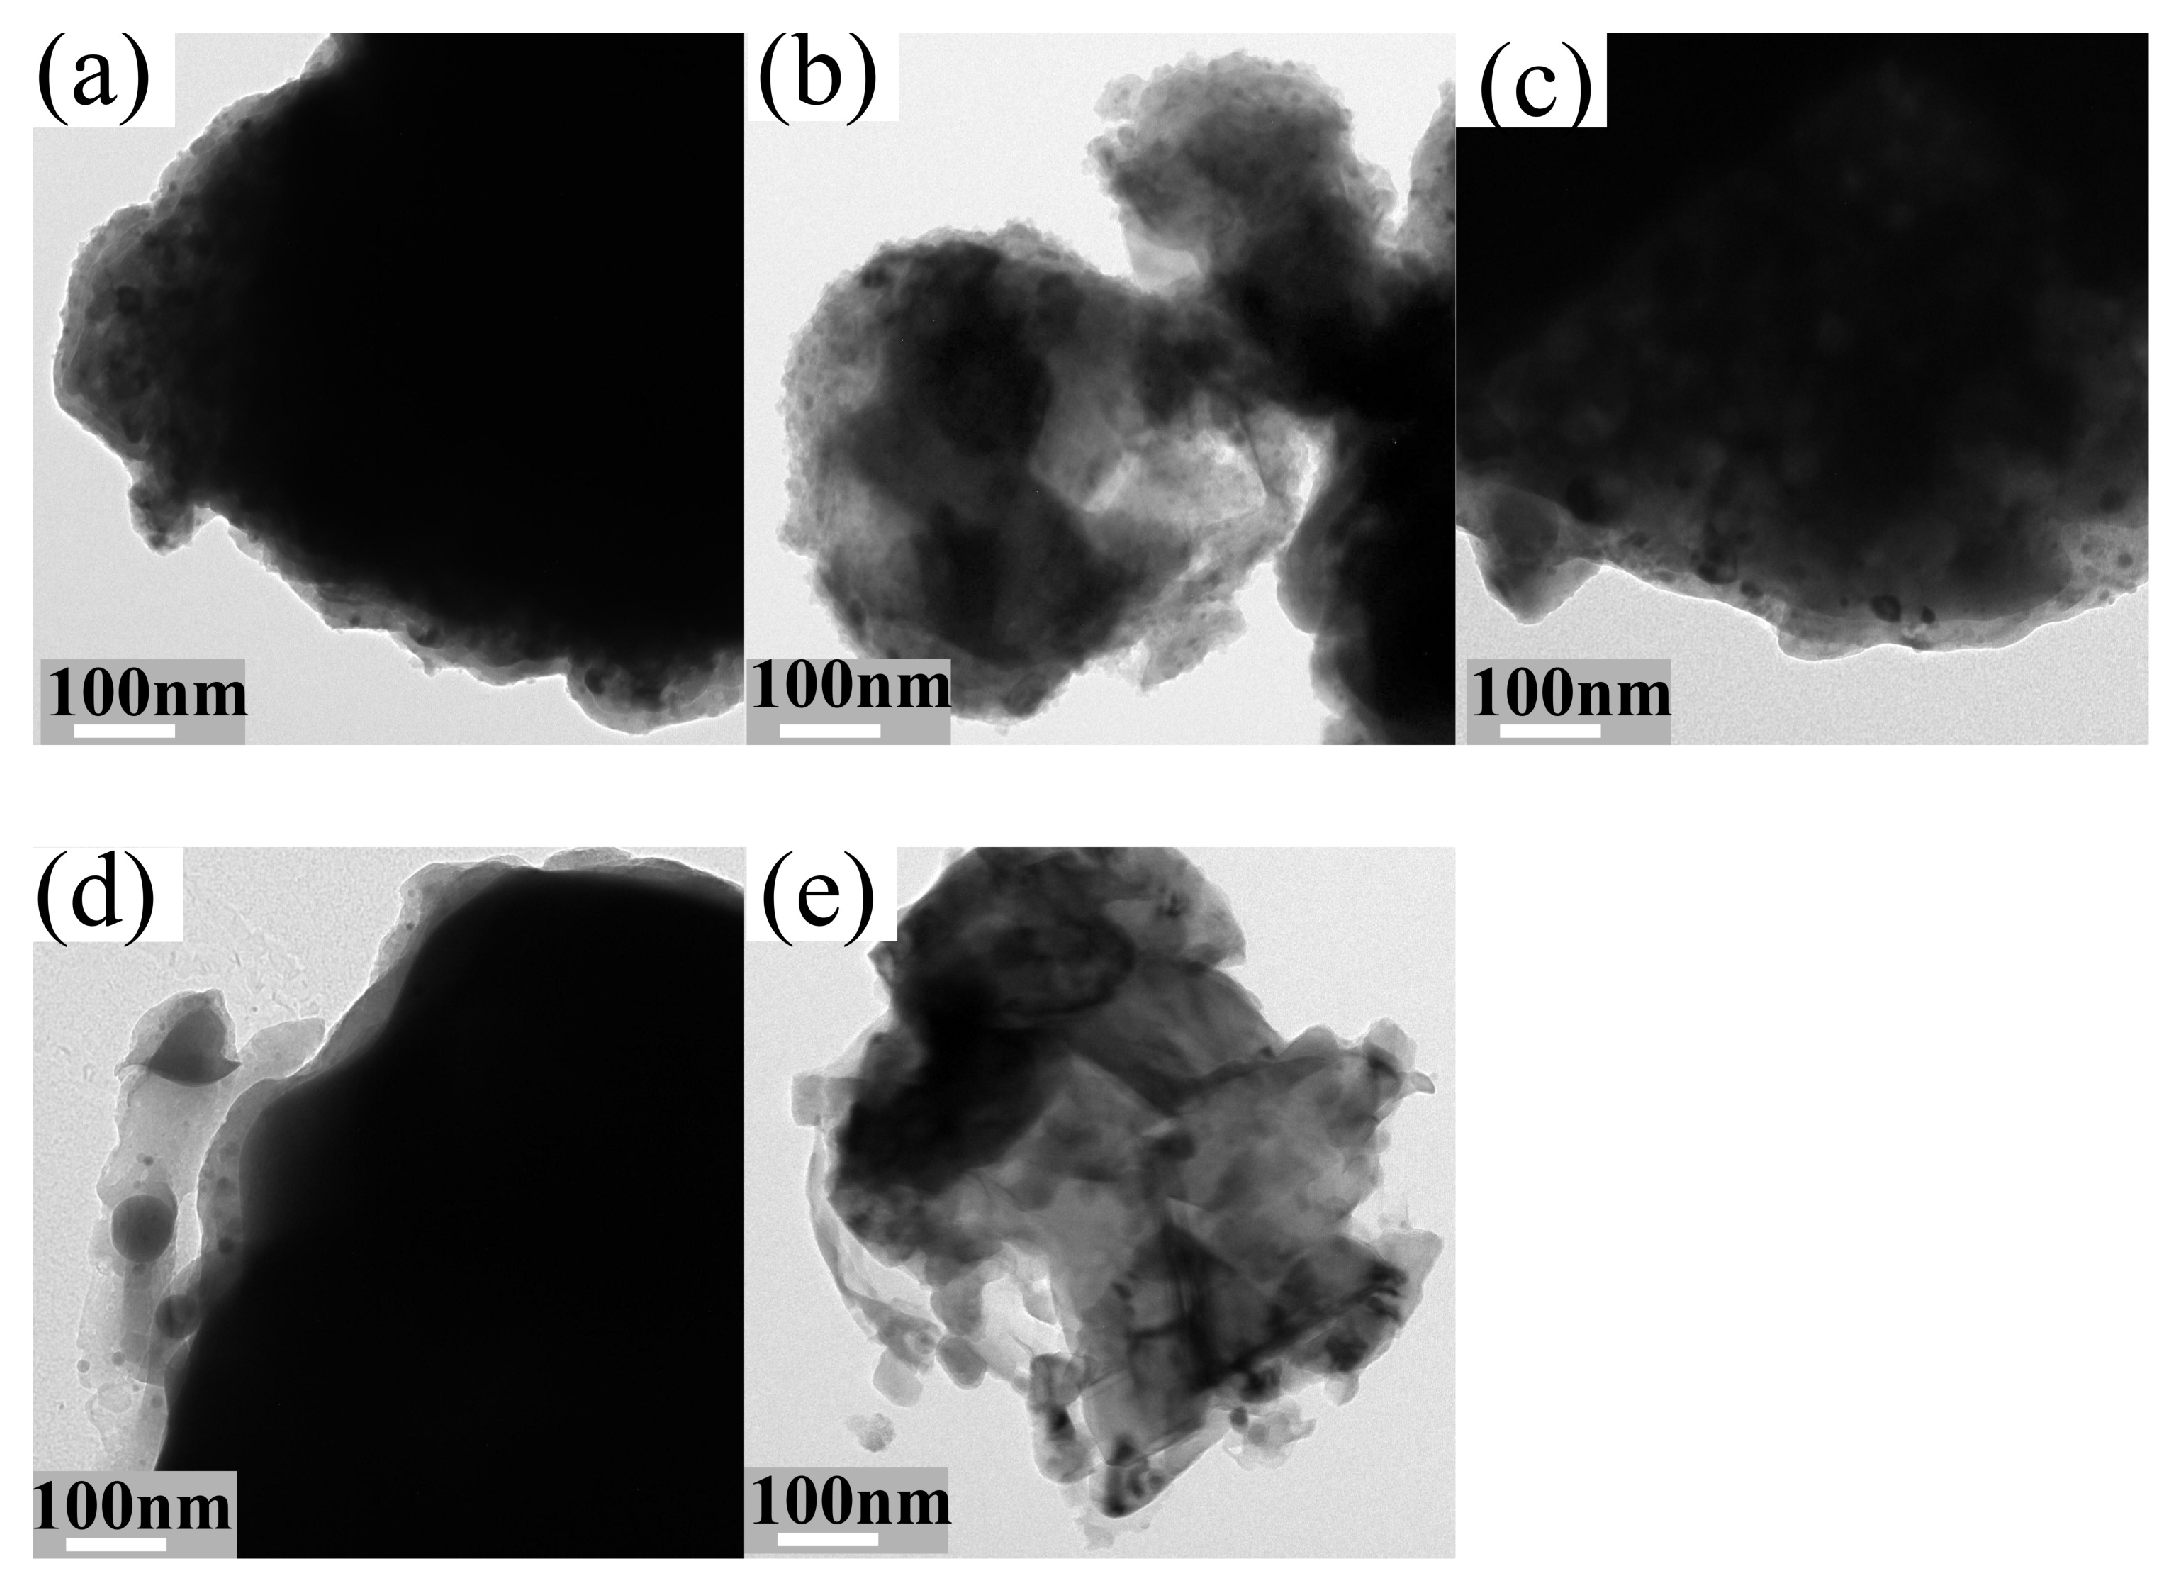
Figure 4 shows the SEM images of Fe 3 Mn 3 Co 60.66 Si 33.34 sintered at (a) 600 °C, (b) 700 °C, (c) 800 °C, (d) 900 °C, and (e) 950 °C, respectively, on a scale of 20 µm. It is observed that the powder is spherical and dispersed in space. One hundred particles were selected from each image, and the size distribution was plotted as shown in Figure 5, which indicates the maximum, minimum, and average sizes. At 600 °C and 700 °C, the powder particle size is mainly distributed in the range 3–6 µm, and from 800 to 950 °C, the powder particles are mainly distributed in the range 4–11 µm. As the sintering temperature increases, the average particle size of the powder also increases. Figure 6 shows the SEM images of Fe 3 Mn 3 Co 60.66 Si 33.34 sintered at (a) 600 °C, (b) 700 °C, (c) 800 °C, (d) 900 °C, and (e) 950 °C on a scale of 500 nm. These results indicate that the size of the powder particles should be at the micron level. After heat treatments at different temperatures, only the average size of the powder particles changes, and the morphology does not change significantly. Figure 7 shows the microstructures of Fe 3 Mn 3 Co 60.66 Si 33.34 sintered at different temperatures from 600 °C to 950 °C. The scale bars are equal to 100 nm.
Figure 8 shows the HRTEM images of Fe 3 Mn 3 Co 60.66 Si 33.34 sintered at (a) 600 °C, (b) 700 °C, (c) 800 °C, (d) 900 °C, and (e) 950 °C. Figure 8(a1–e1) show the plots of HRTEM at the corresponding temperatures after Fourier transform (FFT) [18] and inverse Fourier transform to calculate the crystal plane spacing [19]. The crystal plane spacings are all slightly smaller than the theoretical value of the (020) crystal plane (d = 0.1869 nm). The radius of the Co atom is slightly larger than the radii of Fe and Mn atoms. Therefore, it is inferred that in a small amount of Fe and Mn co-doped Co 2 Si, Fe and Mn replace the Co atoms, such that the actual value is smaller than the theoretical value. Insets Figure 8(a2–e2) show the FFT images in the localized region. All images show the Mann scattering halo, which means that the atoms are arranged in a disordered state in this region, and this amorphous phase exists in all the samples.

3.3. Magnetic Performance Analysis

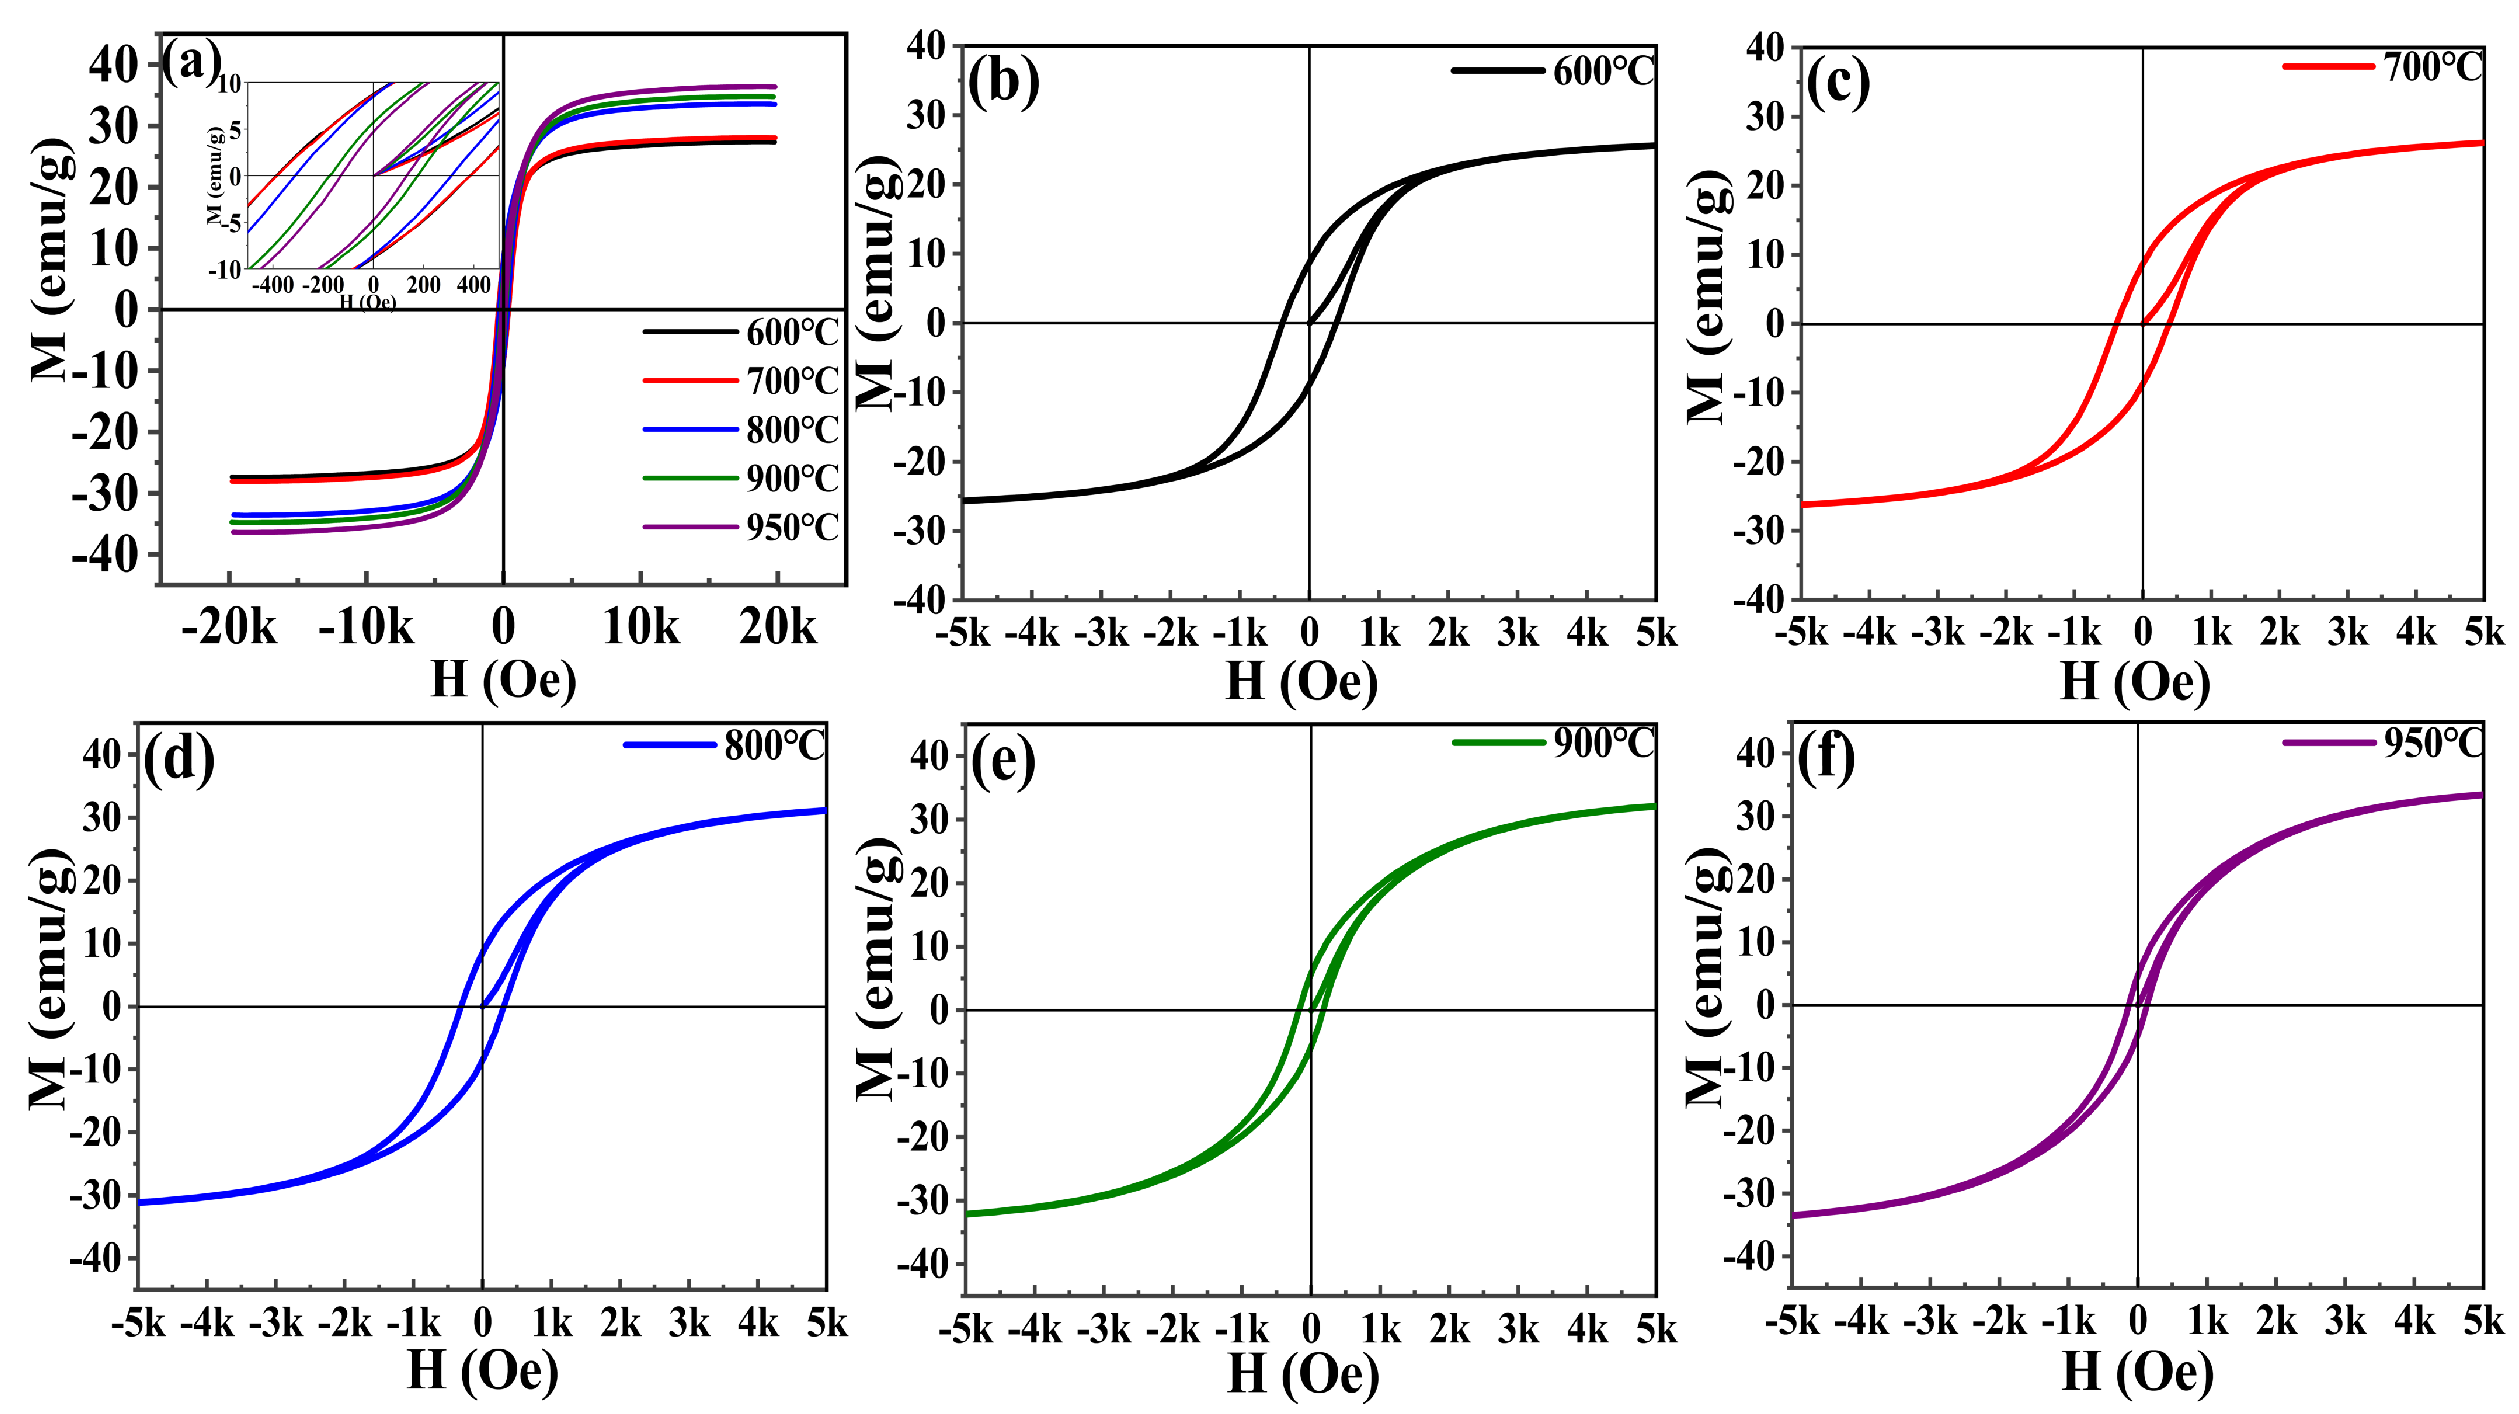
Figure 9a shows the hysteresis loops of Fe 3 Mn 3 Co 60.66 Si 33.34 sintered at different temperatures. Figure 9b–d are the hysteresis loops at 600 °C, 700 °C, 800 °C, 900 °C, and 950 °C, respectively. The hysteresis loop of Fe 3 Mn 3 Co 60.66 Si 33.34 basically remains unchanged regardless of the sintering temperature, thereby demonstrating the characteristics of soft magnetic materials. With an increase in the sintering temperature, the hysteresis loop shows a more inclined and narrow shape, smaller residual magnetization, and lower hysteresis loss. Evidently, the sintering temperature is an important factor affecting the magnetic properties of magnetic materials.
Figure 10a–d shows the curves of the magnetic saturation strength (M s ), coercivity (H c ), remanent magnetization (M r ), and remanence ratio for different sintering temperatures. In Figure 10a, the magnetic saturation intensity increases with an increase in the sintering temperature, with the values 27.40 emu/g, 28.092 emu/g, 33.59 emu/g, 34.81 emu/g, and 36.42 emu/g obtained at 600 °C, 700 °C, 800 °C, 900 °C, and 950 °C, respectively. According to the basic theory of magnetism, the saturation magnetic induction intensity, indicated by M s , is primarily affected by the structure of the material. As the sintering temperature increases, the average grain size increases while the internal stress decreases. Furthermore, M s increases with an increase in the material grain size [20].
As evident in Figure 10b,c, H c and M r decrease with increasing sintering temperature. At the sintering temperatures of 600 °C, 700 °C, 800 °C, 900 °C, and 950 °C, the H c values are 386.86 Oe, 386.61 Oe, 324.13 Oe, 177.74 Oe, and 135.92 Oe, respectively, while the M r values are 8.55 emu/g, 8.37 emu/g, 8.26 emu/g, 5.83 emu/g, and 4.97 emu/g, respectively. With increasing sintering temperature, the magnetic properties of the samples improve mainly because the sample powder is continuously deformed and broken during ball milling. Thus, the powder is refined. However, ball milling also leads to abundant defects and internal stresses, which results in resistance to the movement of the magnetic domain wall. With increasing sintering temperature, for smaller resistance, the movement of the magnetic domain wall is easier. Simultaneously, the size effect has an important impact on the process.
As shown in Figure 10d, the remanence ratio decreases with increasing sintering temperature, achieving maximum and minimum values of 0.3120 and 0.1364, respectively. Therefore, the magnetic properties improve with increasing sintering temperature. The best magnetic properties of Fe 3 Mn 3 Co 60.66 Si 33.34 are obtained at 950 °C. The magnetic saturation strength reaches the maximum value (36.42 emu/g), while the coercivity and remanence reach the minimum values (135.92 Oe and 4.97 emu/g, respectively).

3.4. Electromagnetic Loss Analysis

Fe 3 Mn 3 Co 60.66 Si 33.34 powder has magnetic and electric losses. The magnitude of the electromagnetic wave loss can be expressed by the loss tangent ( tan δ ), which includes the electrical loss ( tan δ e ) and magnetic loss ( tan δ μ ) tangents [21]. The relationship is calculated as:
tan δ e = ε r / ε r
tan δ μ = μ / μ
tan δ = tan δ e + tan δ μ
where, ε r and ε r are the real and imaginary parts of the relative complex permittivity of the material, respectively; and μ and μ are the real and imaginary parts of the relative complex permeability of the material, respectively. As evident from the images, for a larger imaginary part of the relative complex permittivity and relative complex permeability of the material, there is greater absorption loss of the electromagnetic wave and better absorption efficiency.
In Figure 11a, the electrical loss tangent angle of all samples decreases with an increase in frequency, but eventually increases in the frequency range of 13–14 GHz. The tangent angles of the electric loss of all samples are virtually unchanged at the other test frequencies, except for marked decreases and increases in the ranges of 1–4 and 13–14 GHz, respectively. As shown in Figure 11b, the magnetic loss tangent of all samples decreases with increasing frequency. In Figure 11c, the loss tangent of all samples decreases significantly with an increase in frequency in the test range of 1–4 GHz. In contrast, the loss tangent of all samples at the other test frequencies remains almost unchanged. The change trends of the electric loss tangent, magnetic loss tangent, and loss tangent angles of all samples are the same with minor differences, indicating that the sintering temperature has a significant influence on the electromagnetic parameters of the magnetic material.

4. Conclusions

In this study, the effects of the sintering temperature of Fe 3 Mn 3 Co 60.66 Si 33.34 on its crystal structure, microstructure, and magnetic properties were studied. The results show that Co 2 Si powder material is successfully prepared by mechanical alloying and sintering treatment. The H c , M r , and M r /M s decrease with increasing sintering temperature. The decrease in M r /M s indicates that the sintering temperature has a significant effect on the crystal structure and magnetic properties of Fe 3 Mn 3 Co 60.66 Si 33.34 . With increasing sintering temperature, although M r decreases, the coercivity control is better. In the case of the sample sintered at 600 °C, the H c is almost 3 times that of the sample sintered at 950 °C, while the M r is 1.7 times higher. For all Fe 3 Mn 3 Co 60.66 Si 33.34 samples, regardless of the sintering temperature, the electromagnetic loss decreases with increasing frequency, and is quite stable at high frequencies. Therefore, Fe 3 Mn 3 Co 60.66 Si 33.34 prepared at high temperatures is expected to be suitable for use as a magnetic recording material, and the H c value can be optimized for the particular application through the sintering temperature. In the future, the M r value of the material must be regulated to prepare semi-hard magnetic materials that are more suitable for magnetic recording.

Author Contributions

Methodology: J.Z. and Q.X.; Software: Z.Z.; Data curation: J.Z., Z.Z. and X.Z.; Writing—original draft preparation: J.Z. and Q.X.; Writing—review and editing: J.Z. and Q.X. All authors have read and agreed to the published version of the manuscript.

Funding

This work was supported by the Industry and Education Combination Innovation Platform of Intelligent Manufacturing and Graduate Joint Training Base at Guizhou University (Grant No. 2020-520000-83-01-324061), High-level Creative Talent Training Program in Guizhou Province of China (Grant No. [2015]4015) and Guizhou Engineering Research Center for smart services (Grant No. 2203-520102-04-04-298868). Academic green Seedling Cultivation Project of Zunyi Normal College (Grant No. ZS XM[2021]1-9). Zunyi City School Joint Fund (Grant No. Zunshi Kehe HZ [2022]122) and District School Joint Fund (Grant No. ZunHongKeHeShi [2022]7).

Data Availability Statement

The data presented in this study are available on request from the corresponding author.

Conflicts of Interest

The authors declare no conflict of interest. The authors claim that none of the material in our manuscript has been published or is under consideration for publication elsewhere. This manuscipt is our original work.

References

  1. Ji, Z.; Wang, Q.; Ma, Y.; Dong, C. Research progress of high-performance soft magnetic alloys. J. Mater. Eng. 2022, 50, 69–80. [Google Scholar]
  2. He, K.; Zhao, Y. Research progress of Co-based nanocrystalline soft magnetic alloys. Met. Funct. Mater. 2001, 8, 1–5. [Google Scholar]
  3. Xing, H.; Yao, Q.; Sun, J.; Liu, S. Theoretical electron energy loss spectroscopy of cobalt silicides. J. Chin. Electron Microsc. Soc. 2006, 25, 468–471. [Google Scholar]
  4. Liu, X. Fabrication and Magnetic Performance of Co Based Magnetic Nanowires. Master’s Thesis, Ningbo University, Ningbo, China, 2016. [Google Scholar]
  5. Zhang, T.; Wu, Y.; Qian, W.; Liu, A. Formation of cobalt silicide by cobalt ion implantation and characteristics of microwave power tube preparation. Sci. China Ser. E 2002, 32, 442–446. [Google Scholar]
  6. Yuan, Z.; Bao, S.; Tong, Y.; Yao, L. Effect of crystallization on magnetic properties of Co43fe20ta5.5b31.5 amorphous alloy. Rare Met. Mater. Eng. 2009, 38, 851–856. [Google Scholar]
  7. Hao, L.; Chen, X.; Yuan, Z.; Chen, X. Glass forming ability and magnetic property of Co-based amorphous alloy. J. Lanzhou Univ. Technol. 2005, 31, 19–22. [Google Scholar]
  8. Makino, A.; Inoue, A.; Masumoto, T. Compositional effect on the soft magnetic properties of Co-Fe-Si-B amorphous alloys with zero magnetostriction. Mater. Trans. JIM 1990, 31, 884–890. [Google Scholar] [CrossRef]
  9. Liu, G.; Lin, Y.C.; Liao, L.; Liu, L.; Chen, Y.; Liu, Y.; Weiss, N.O.; Zhou, H.; Huang, Y.; Duan, X. Domain wall motion in synthetic Co2Si nanowires. Nano Lett. 2012, 12, 972–1976. [Google Scholar] [CrossRef] [PubMed]
  10. Zou, J.; Wang, L.; He, J.; Wu, B.; Xie, Q. Effects of Fe, Mn individual doping and (Fe, Mn) co-doping on ferromagnetic properties of Co2Si powders. Nanomaterials 2022, 12, 293. [Google Scholar] [CrossRef] [PubMed]
  11. Cheng, X.; Huang, H.; Li, F. Phase transformation in β-FeSi2 thermoelectric material during mechanical alloying and heat treatment. J. Southeast Univ. Nat. Sci. Ed. 2008, 38, 898–901. [Google Scholar]
  12. Zhang, X.; Ma, R.; Xie, Q. Effects of Ni doping amount on the microwave absorptive properties of Fe3Si alloy. Electron. Compon. Mater. 2014, 33, 38–41, 52. [Google Scholar]
  13. Kai, H.; Liu, X.; Zhou, S.; Wang, Y.; Cai, X.; Sun, H.; Ma, B. Effects of La, Co substitution on the structure and magnetic properties of M-type strontium ferrites. J. Magn. Mater. Devices 2006, 37, 17–19, 29. [Google Scholar]
  14. Qiu, J. Preparation and Application of Ni-Co Heterojunctions Based on Metal-Organic Frameworks. Master’s Thesis, Guizhou University, Guizhou, China, 2019. [Google Scholar]
  15. Zhuang, J.; Chen, X.; Chi, Y.; Liu, Y. Synthesis by solid state reaction and electromagnetic loss property of nano meter Ni0.5Zn0.5Fe2O4 ferrite. J. Funct. Mater. 2006, 37, 43–46. [Google Scholar]
  16. Sapna; Budhiraja, N.; Kumar, V.; Singh, S.K. X-ray analysis of NiFe2O4 nanoparticles by the Williamson–Hall and size-strain plot method. J. Adv. Phys. 2017, 6, 492–495. [Google Scholar] [CrossRef]
  17. Yang, W.; Zou, Y.; Zhang, L.; Li, J.; Wang, J.; Li, Y. Calculating and Analyzing the Influence of Fabrication Conditions on the Structure of Carbonated Hydroxyapatite. Chin. J. Inorg. Chem. 2009, 25, 223–230. [Google Scholar]
  18. Luis, D.C.; Katherine, S.; Catherine, G.; Scott, M. Synthetic Data Curation Sategies for Robust Model Development: A Case Study with HRTEM Micrograph Segmentation. Microsc. Microanal. 2022, 28, 3098–3100. [Google Scholar] [CrossRef]
  19. Tonejc, E.M.; Djerdj, I.; Tonejc, A. Structure of ball milled ZrO2 AND ZrO2–10 mol % Y2O3 powders revealed by hrtem image processing. Fiz. A 2001, 4, 177–190. [Google Scholar]
  20. Vadivel, M.; Gopalakrishnan, S.; Babu, R.R.; Pandian, M.S.; Ramasamy, P. Influence of Bi Doping Concentrations on the Structural, Morphological, Dielectric, Optical and Magnetic Properties of ZnO Nanoparticles. J. Supercond. Nov. Magn. 2022, 35, 3647–3659. [Google Scholar] [CrossRef]
  21. Dong, L.; Liu, C.; Shen, Z.; Zhou, B.; Zheng, T.; Li, Q.; Zhong, Y. Influence of annealing temperature on the magnetic properties of one-dimensional diluted magnetic semiconductor Zn0.95Mn0.05O tuning with vacuum atmospheric annealing. J. Supercond. Nov. Magn. 2022, 36, 189–196. [Google Scholar] [CrossRef]
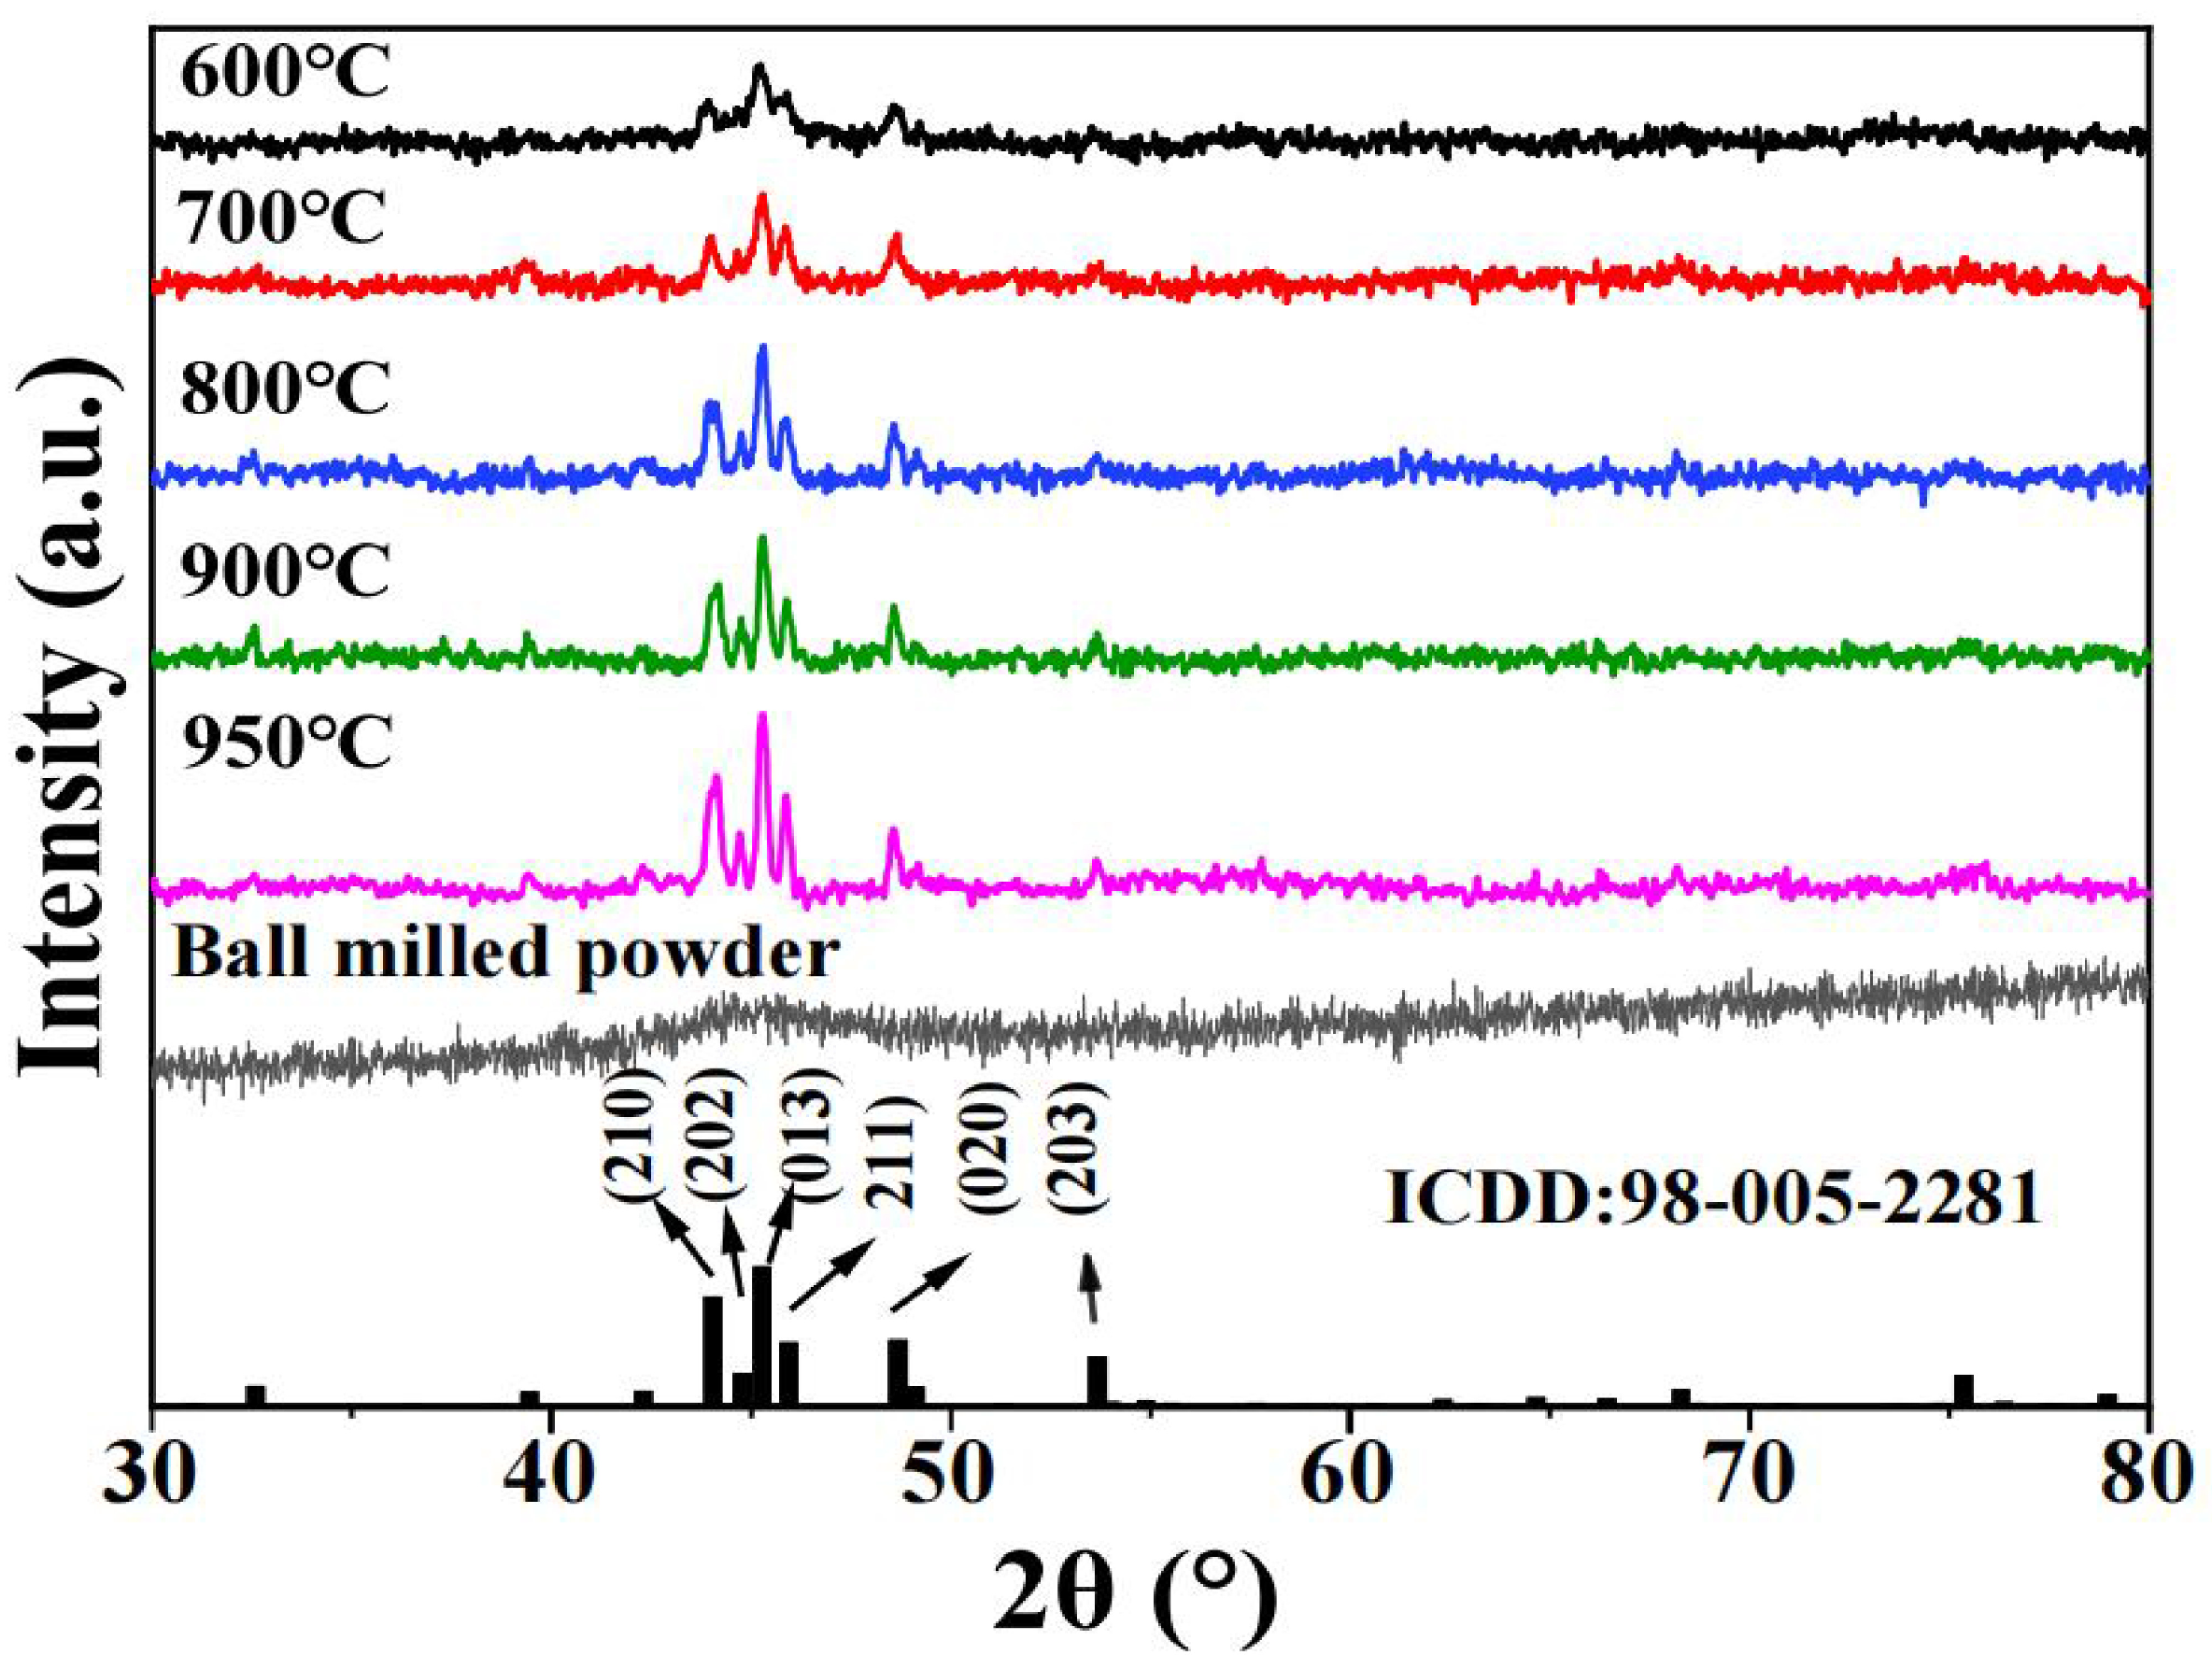
Figure 1. XRD of Fe 3 Mn 3 Co 60.66 Si 33.34 at different sintering temperatures.
Inorganics 11 00272 g001
Figure 2. Full width at half maximum (FWHM) of Fe 3 Mn 3 Co 60.66 Si 33.34 at different sintering temperatures.
Inorganics 11 00272 g002
Figure 3. Average grain size of Fe 3 Mn 3 Co 60.66 Si 33.34 sintered at different temperatures.
Inorganics 11 00272 g003
Figure 4. Scanning electron microscopy images of Fe 3 Mn 3 Co 60.66 Si 33.34 sintered at (a) 600 °C, (b) 700 °C, (c) 800 °C, (d) 900 °C, and (e) 950 °C. Scale bars are equal to 20 µm.
Inorganics 11 00272 g004
Figure 5. Particle size distribution of Fe 3 Mn 3 Co 60.66 Si 33.34 sintered at (a) 600 °C, (b) 700 °C, (c) 800 °C, (d) 900 °C, and (e) 950 °C.
Inorganics 11 00272 g005
Figure 6. Scanning electron microscopy images of Fe 3 Mn 3 Co 60.66 Si 33.34 sintered at (a) 600 °C, (b) 700 °C, (c) 800 °C, (d) 900 °C, and (e) 950 °C. Scale bars are equal to 500 nm.
Inorganics 11 00272 g006
Figure 7. (ae) Microstructures of Fe 3 Mn 3 Co 60.66 Si 33.34 sintered at different temperatures from 600 °C to 950 °C. Scale bars are equal to 100 nm.
Inorganics 11 00272 g007
Figure 8. HRTEM electron microscopy images of Fe 3 Mn 3 Co 60.66 Si 33.34 sintered at (a) 600 °C, (b) 700 °C, (c) 800 °C, (d) 900 °C, and (e) 950 °C. Scale bars are equal to 5 nm.
Inorganics 11 00272 g008
Figure 9. (af) Magnetic hysteresis loops of Fe 3 Mn 3 Co 60.66 Si 33.34 sintered at different temperatures.
Inorganics 11 00272 g009
Figure 10. (a) M s , (b) H c , (c) M r , and (d) M r /M s curves of Fe 3 Mn 3 Co 60.66 Si 33.34 sintered at different temperatures.
Inorganics 11 00272 g010
Figure 11. Relationship between the (a) electrical loss tangent and frequency, (b) magnetic loss tangent and frequency, (c) frequency and loss tangent for all samples sintered at different temperatures.
Inorganics 11 00272 g011
Disclaimer/Publisher’s Note: The statements, opinions and data contained in all publications are solely those of the individual author(s) and contributor(s) and not of MDPI and/or the editor(s). MDPI and/or the editor(s) disclaim responsibility for any injury to people or property resulting from any ideas, methods, instructions or products referred to in the content.