Article

Dependence of Ge/Si Avalanche Photodiode Performance on the Thickness and Doping Concentration of the Multiplication and Absorption Layers

Department of Quantum Electronics and Photonics, Faculty of Radiophysics, National Research Tomsk State University, 634050 Tomsk, Russia
*
Author to whom correspondence should be addressed.
Inorganics 2023, 11(7), 303; https://doi.org/10.3390/inorganics11070303
Submission received: 26 June 2023 / Revised: 13 July 2023 / Accepted: 14 July 2023 / Published: 15 July 2023
(This article belongs to the Special Issue Advanced Inorganic Semiconductor Materials)

Abstract

:
In this article, the performance and design considerations of the planar structure of germanium on silicon avalanche photodiodes are presented. The dependences of the breakdown voltage, gain, bandwidth, responsivity, and quantum efficiency on the reverse bias voltage for different doping concentrations and thicknesses of the absorption and multiplication layers of germanium on the silicon avalanche photodiode were simulated and analyzed. The study revealed that the gain of the avalanche photodiode is directly proportional to the thickness of the multiplication layer. However, a thicker multiplication layer was also associated with a higher breakdown voltage. The bandwidth of the device, on the other hand, was inversely proportional to the product of the absorption layer thickness and the carrier transit time. A thinner absorption layer offers a higher bandwidth, but it may compromise responsivity and quantum efficiency. In this study, the dependence of the photodetectors’ operating characteristics on the doping concentration used for the multiplication and absorption layers is revealed for the first time.

1. Introduction

Infrared photo-electronics is one of the most technologically advanced and rapidly developing areas of modern optoelectronics. Of particular interest are studies on the creation of highly sensitive and high-speed detectors for the fields of fiber communications [1,2,3,4,5,6,7], spectroscopy [8], and imaging systems [9,10]. Thus, avalanche photodetectors (APDs) have been very attractive with respect to high-sensitivity systems due to their intrinsic ability to enhance receiver sensitivity through internal avalanche gain [11].
The separate-absorption-charge-multiplication (SACM) germanium on silicon avalanche photodiode (Ge-on-Si APD) is an advanced photodetector structure that combines the properties of germanium and silicon to achieve efficient light detection and signal amplification [12,13,14,15,16,17]. In the SACM Ge-on-Si APD, the separate absorption and multiplication regions are designed to optimize the absorption of incident light and the multiplication of charge carriers, respectively. The absorption region is responsible for efficiently converting photons into electron–hole pairs, while the multiplication region provides the electric field required to accelerate the charge carriers and initiate the avalanche multiplication process. The integration of germanium with a silicon substrate enables compatibility with standard silicon fabrication processes, thereby facilitating large-scale production and integration with existing technology [18]. Moreover, the SACM Ge-on-Si APD benefits from the unique properties of germanium, such as its band gap (0.66 eV), which provides effective absorption at wavelengths in the entire visible and infrared ranges up to a maximum wavelength of approximately 1600 nm, while the fast mobility of electrons and holes offers the potential for fast response times.
Ongoing research and development efforts focus on further improving the performance of Ge-on-Si APDs. This includes enhancing charge multiplication efficiency, reducing dark current levels, and optimizing the device’s response time [19,20,21,22]. Several studies have made notable contributions in this field. Kim et al. [23] demonstrated enhanced performance of a vertical illumination-type Ge-on-Si APD by leveraging internal RF-gain effects. The fabricated APD exhibited a negative differential resistance (NDR) beyond the avalanche breakdown voltage. This NDR allowed the device to achieve eye-opening results, corresponding to the minimal signal distortion, at up to 50 Gb/s accompanied by improved signal-to-noise ratios and signal amplitudes. Huang et al. [24] reported the development of a waveguide Ge/Si APD with 3 dB bandwidths of 56 GHz and 36 GHz, with responsivities of 1.08 A/W and 6 A/W at a wavelength of 1310 nm, respectively. Zeng et al. [25] focused on the effects of bias voltage and incident power on the bandwidth of Ge/Si APDs. In addition to the widely discussed space charge effect in the multiplication layer, Zeng argued that an increase in incident power leads to excess holes in the absorption layer, resulting in a significant reduction in the strength of the electric field in the multiplication layer. They introduced the concept of an effective equivalent voltage to quantitatively describe this incident power effect. Zhang et al. [26] investigated the influence of surface defects and the width of the guard ring on the sidewall leakage current in Ge/Si APDs with a mesa structure. The study identified high-density surface defects and a strong electric field at the sidewall as the primary contributors to the large sidewall leakage current. Accordingly, further advancements can be made in the design, optimization, and fabrication of Ge/Si APDs, with the goal of achieving improved performance.
In this work, we focus on investigating the performance characteristics of SACM Ge-on-Si APDs, specifically their dependence on the thicknesses of the multiplication and absorption layers. Breakdown voltage, multiplication gain, bandwidth, responsivity, and quantum efficiency are among the performance parameters examined. The thickness and doping concentration of both the multiplication layer, which is responsible for internal gain generation through impact ionization, and the absorption layer, which is responsible for photon absorption and the generation of electron–hole pairs, strongly influence the APD’s performance characteristics. By studying the performance characteristics and their dependence on layer thickness, this research aims to contribute to the optimization and design of Ge-on-Si APDs, with the ultimate goal of achieving improved performance in high-speed and high-sensitivity optoelectronic applications.

2. Device Structure and TCAD Physical Simulation Models

Figure 1a depicts a cross-sectional diagram of the simulated cylindrical Ge/Si APD with a diameter of 30 μm.
The structure of the device includes a p-type heavily doped ( 5 × 10 19   c m 3 ) Ge contact layer, a p-Ge absorption layer, a p-type doped Si charge layer, an n-Si multiplication layer, and an n-type heavily doped ( 5 × 10 19   c m 3 ) Si contact layer. The charge layer controls the electric field distribution in the device by making the electric field in the multiplication layer large enough to cause avalanche breakdown while also ensuring that the electric field in the absorption layer remains as low as possible without triggering an avalanche and with the carriers moving at saturation speed, thus reducing the tunneling probability caused by the narrow bandgap [16].
In order to simulate the properties of the avalanche photodetector, the threading dislocations (TDs) and their energy level distributions in the Ge layer (constituting 4.2% of the lattice mismatch between the Ge and Si) should be taken into consideration. The TDs in an epitaxial Ge layer act as the acceptor-like defects, with energy levels located in the forbidden bandgap [27]. One of the proposed methods for decreasing TDs is the two-step epitaxial growth of germanium on silicon. In this work, we suppose that a 90 nm thick low-temperature Ge seed layer has first been grown on the Si layer to confine most of the TDs in this layer (about 1 × 1010 cm−2). As a result, the TD density decreases in the upper high-temperature epitaxial Ge layer to about 2 × 106 cm−2 [28]. These TDs are located at 0.36 eV below the conduction band [29]. In addition, the discontinuities between the valence bands and conduction bands of Ge and Si are set to 0.35 and 0.1 eV, respectively, as shown in Figure 1b.
The simulation of avalanche photodiodes (APDs) involves the utilization of Synopsys Sentaurus Technology computer-aided design (TCAD) software, which is grounded in the Poisson equation, continuity equations, and carrier transport equations. The Poisson equation establishes a relationship between changes in electrostatic potential and the distribution of local charge densities, while the continuity equations and transport equations depict the mechanisms governing carrier transport, generation, and recombination processes [30].
As carriers experience acceleration in an electric field, their velocity reaches a saturation point when the electric field magnitude becomes substantial. To address this effect, the degree of effective mobility needs to be adjusted by considering that the magnitude of the drift velocity is the product of the mobility and the electric field component in the direction of current flow. To account for this behavior, the Caughey and Thomas expression [31] is utilized to incorporate field-dependent mobility. This expression enables a seamless transition between low-field and high-field behaviors:
μ n ( E ) = μ n 0 [ 1 1 + ( μ n 0 E ϑ s a t , n ) β n ] 1 β n
μ p ( E ) = μ p 0 [ 1 1 + ( μ p 0 E ϑ s a t , p ) β p ] 1 β p
where E is the parallel electric field (the electric field component in the direction of the current flow); μ n 0 and μ p 0 are the values of the low-field electron and hole mobility, respectively; and ( β n = 2 ,   β p = 1 ). The saturated velocities for the electrons and holes in the Si material are ϑ s a t , n = 1 × 10 7   c m / s ,   ϑ s a t , p = 7 × 10 6   c m / s , respectively, and those in the Ge material are ϑ s a t , n = 7 × 10 6   c m / s and ϑ s a t , p = 6.3 × 10 6   c m / s [32].
Carrier generation recombination refers to the mechanism by which a semiconductor material attempts to restore its equilibrium state after being perturbed. Phonon transitions take place when there is a trap or defect present within the forbidden energy band of the semiconductor. As previously discussed, threading dislocations (TDs) within an epitaxial Ge layer serve as acceptor-like defects, occupying energy levels within the forbidden bandgap. The defect centers enhance the level of carrier recombination due to the trap-assisted tunneling mechanism, which is described by the Shockley–Read–Hall (SRH) model [29]:
G S R H = p n n i e 2 τ p n + n ie exp E T E i k T L + τ n p + n i e exp ( E T E i k T L )
where n and p are electron and hole concentrations,   n i e is the intrinsic carrier concentration, E i is the intrinsic energy, E T is the energy level of the TD, and τ n and τ p are electron and hole lifetimes, which are related to the threading dislocation density [29]:
τ n = 1 σ n v n N                                     τ p = 1 σ p v p N
where N is the TD density in the Ge layer; v n and v p are the thermal velocities, whose values are v n = 3.1 × 10 5   m / s ,   v p = 1.9 × 10 5   m / s , respectively; and σ n and σ p are electron and hole capture cross sections, whose values are σ n = 3 × 10 14   c m 2   ,   σ p = 5 × 10 14   c m 2 [33].
In order to simulate the surface recombination of the side walls of the cylindrical device structure, the surface recombination velocity, namely, S n = S p = 1 × 10 7 c m / s , at the side walls is set in the surface recombination model [34].
In a strong electric field, electrons can tunnel through the bandgap via trap states. This trap-assisted tunneling (TAT) mechanism is accounted for by using the TAT model. Also, if a sufficiently high electric field exists within a device, the level of local band bending may be sufficient to allow electrons to tunnel, via internal field emission, from the valence band into the conduction band. In this study, this generation mechanism is implemented using the band-to-band tunneling (BBT) model [33].
The avalanche simulation of the Ge/Si APD Is based on Selberherr’s impact-ionization model. The electron and hole ionization rates can be expressed as follows:
α n = A n exp B n E C n
α p = A p exp B p E C p
For the Si material, A n = 7.03 × 10 5   c m 1 , A p = 1.58 × 10 6   c m 1 , B n = 1.231 × 10 6   c m 1 , and B p = 2.036 × 10 6   c m 1 for E < 4 × 10 5   V . c m 1 . A n = 7.03 × 10 5   c m 1 , A p = 6.71 × 10 5   c m 1 , B n = 1.231 × 10 6   c m 1 , and B p = 1.693 × 10 6   c m 1 for E 4 × 10 5   V . c m 1 . For the Ge material, A n = 1.55 × 10 7   c m 1 , A p = 1 × 10 7   c m 1 , B n = 156 × 10 6   c m 1 , and B p = 1.28 × 10 6   c m 1 for E < 4 × 10 5   V . c m 1 . C n and C p are both set to 1 [35].

3. The Simulation Results of APD Characteristics

In order to examine the impact of different parameters in the absorption and multiplication layers on the properties of the avalanche photodiode, modifications were made to the thickness and doping concentration of both layers. Subsequently, the resulting performance was analyzed, focusing on several characteristics such as breakdown voltage, multiplication gain, bandwidth, responsivity, and quantum efficiency. The characteristics of the avalanche photodiodes were modeled and simulated under an optical input power illumination of −20 dBm at 1310 nm.

3.1. The Effect of Multiplication Layer Parameters

To explore the impact of the multiplication layer thickness and doping concentration on the performance of the avalanche photodiode, a series of simulations was conducted using ten different structures. The simulations involved varying the thickness of the multiplication layer from 0.5 µm to 1.5 µm with a step increment of 0.25 µm. Simultaneously, two distinct values were assigned to the doping concentrations of the absorption and multiplication layers: 1 × 10 15 c m 3 and 5 × 10 15 c m 3 . The devices’ parameters used for this case study are presented in Table 1.

3.1.1. The Multiplication Gain and Breakdown Voltage

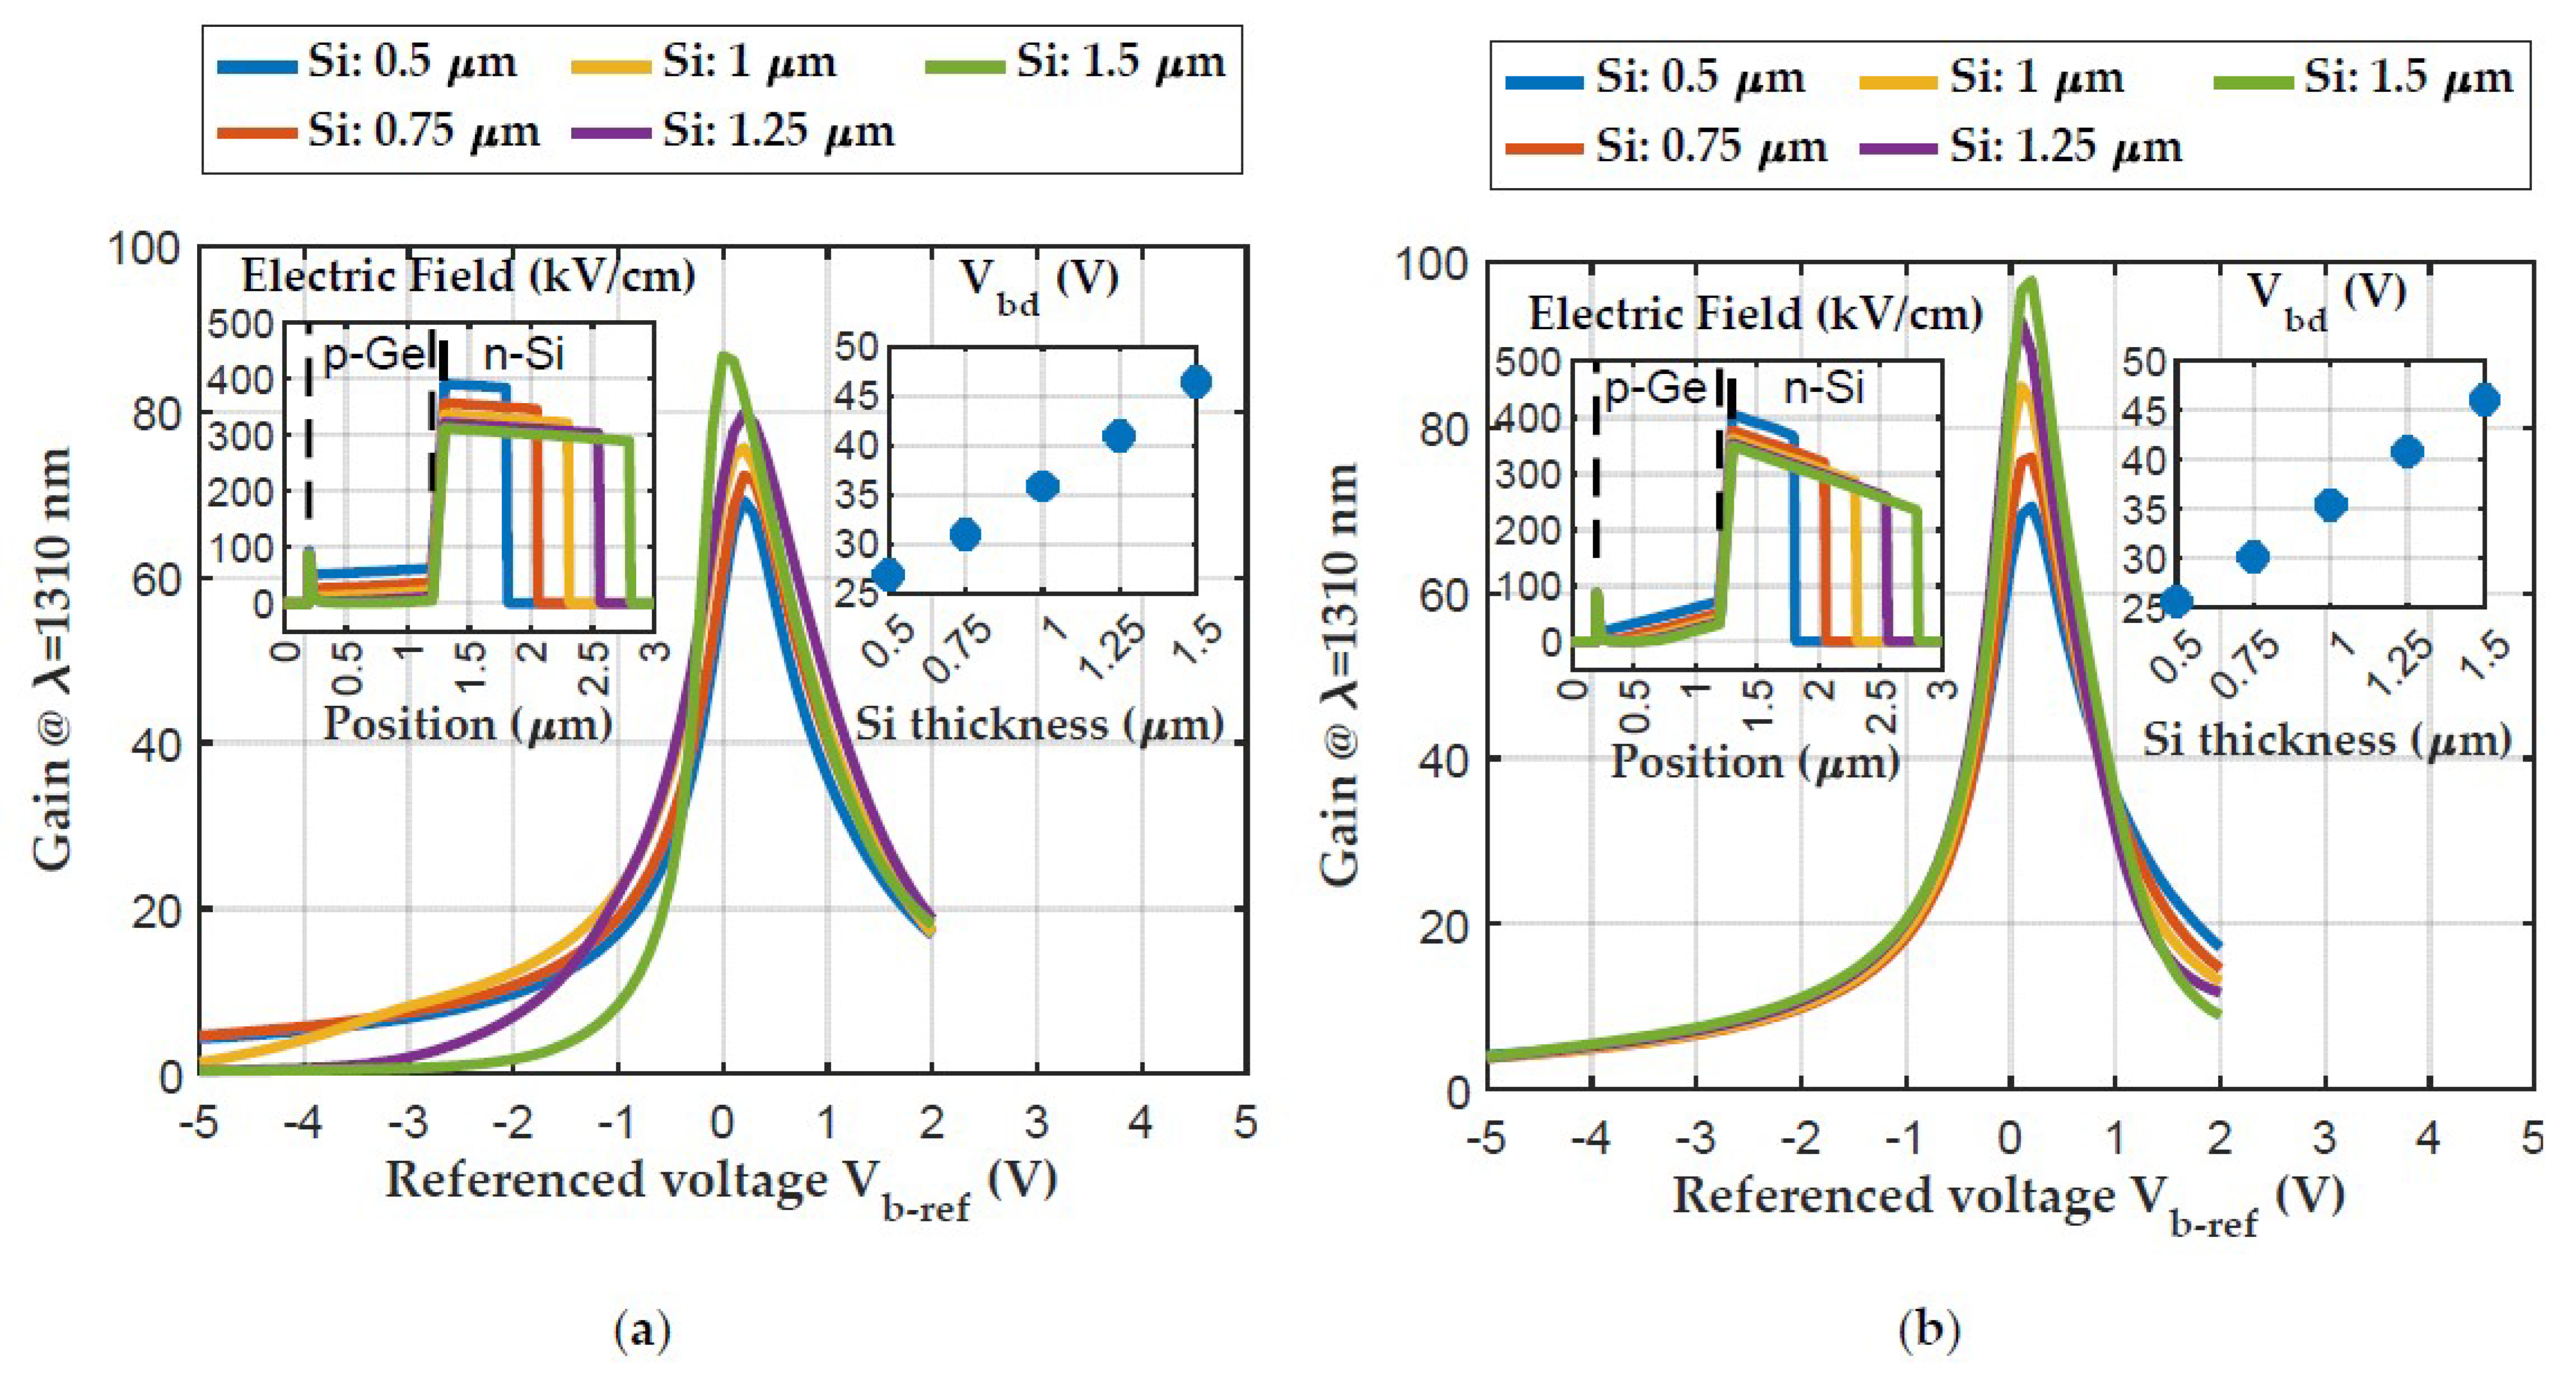
Figure 2 shows the dependence of the multiplication gain (M) and the breakdown voltage on the thickness of the multiplication layer versus bias voltage for the APD structures with different doping concentrations and thicknesses of multiplication layers. To ensure a reliable comparison between the devices, the difference between the breakdown voltage (Vbd) and the bias voltage (Vbias) is used and assigned to the referenced voltage (Vb-ref): Vb-ref = Vbd − Vbias.
By referring to the insets Figure 2a,b, it can be observed that an increase in the thickness of the multiplication layer leads to an increase in the breakdown voltage, and modifying the doping concentration in the absorption and multiplication layers from 1 × 10 15   c m 3 to 5 × 10 15   c m 3 does not significantly impact the breakdown voltage. As the thickness of the multiplication layer increases, the electric field is distributed over a larger distance, leading to a lower electric field strength across the layer. Consequently, a higher voltage is required to initiate the avalanche breakdown, leading to an increase in the breakdown voltage.
In the linear mode region where Vb-ref is less than −0.5 V, for the low-level-doped absorption and multiplication layer ( 1 × 10 15   c m 3 ) structures, the multiplication gain is influenced by the bias voltage and the impact generation rate, which are determined by the thickness of the multiplication layer and the resulting electric field strength throughout the structures, as depicted in Figure 2a. On the other hand, if we consider the 5 × 10 15   c m 3 doping concentration in the linear mode region, the higher doping concentration would cause the electric field lines to concentrate in specific regions, resulting in a non-uniform field distribution. In such a case, the electric field strength may not be effectively distributed across the entire multiplication layer, thereby limiting the potential for carrier multiplication and reducing the overall multiplication gain. Consequently, even with an increased thickness of the multiplication layer, as depicted in Figure 2b, the gain remains relatively unchanged.
Near the breakdown point, where the absolute value of Vb-ref is less than 0.5 V, it can be seen that the electric field for all structures is higher than the breakdown field of silicon. By increasing the thickness of the multiplication layer, the avalanche region within the APD expands. This extended region allows for a larger number of carriers to participate in the multiplication process, leading to higher gain near the breakdown voltage. Therefore, an increase in the thickness of the multiplication layer leads to an increase in the multiplication gain near the breakdown voltage, as depicted in Figure 2. When the bias voltage exceeds the breakdown voltage in an avalanche photodiode, the density of electrons and holes becomes comparable to the density of donors in the multiplication region. This leads to an influence on the electric field profile due to the space charge of these electrons and holes. At the boundary between the charge and multiplication layers, there is a net excess of holes, which results in an increased magnitude of the electric field in that region. Conversely, within the multiplication region and at the edge adjacent to the n+-contact layer, there is a net excess of electrons. This excess of electrons causes a decrease in the magnitude of the electric field and, consequently, a decrease in the multiplication gain.

3.1.2. The Bandwidth

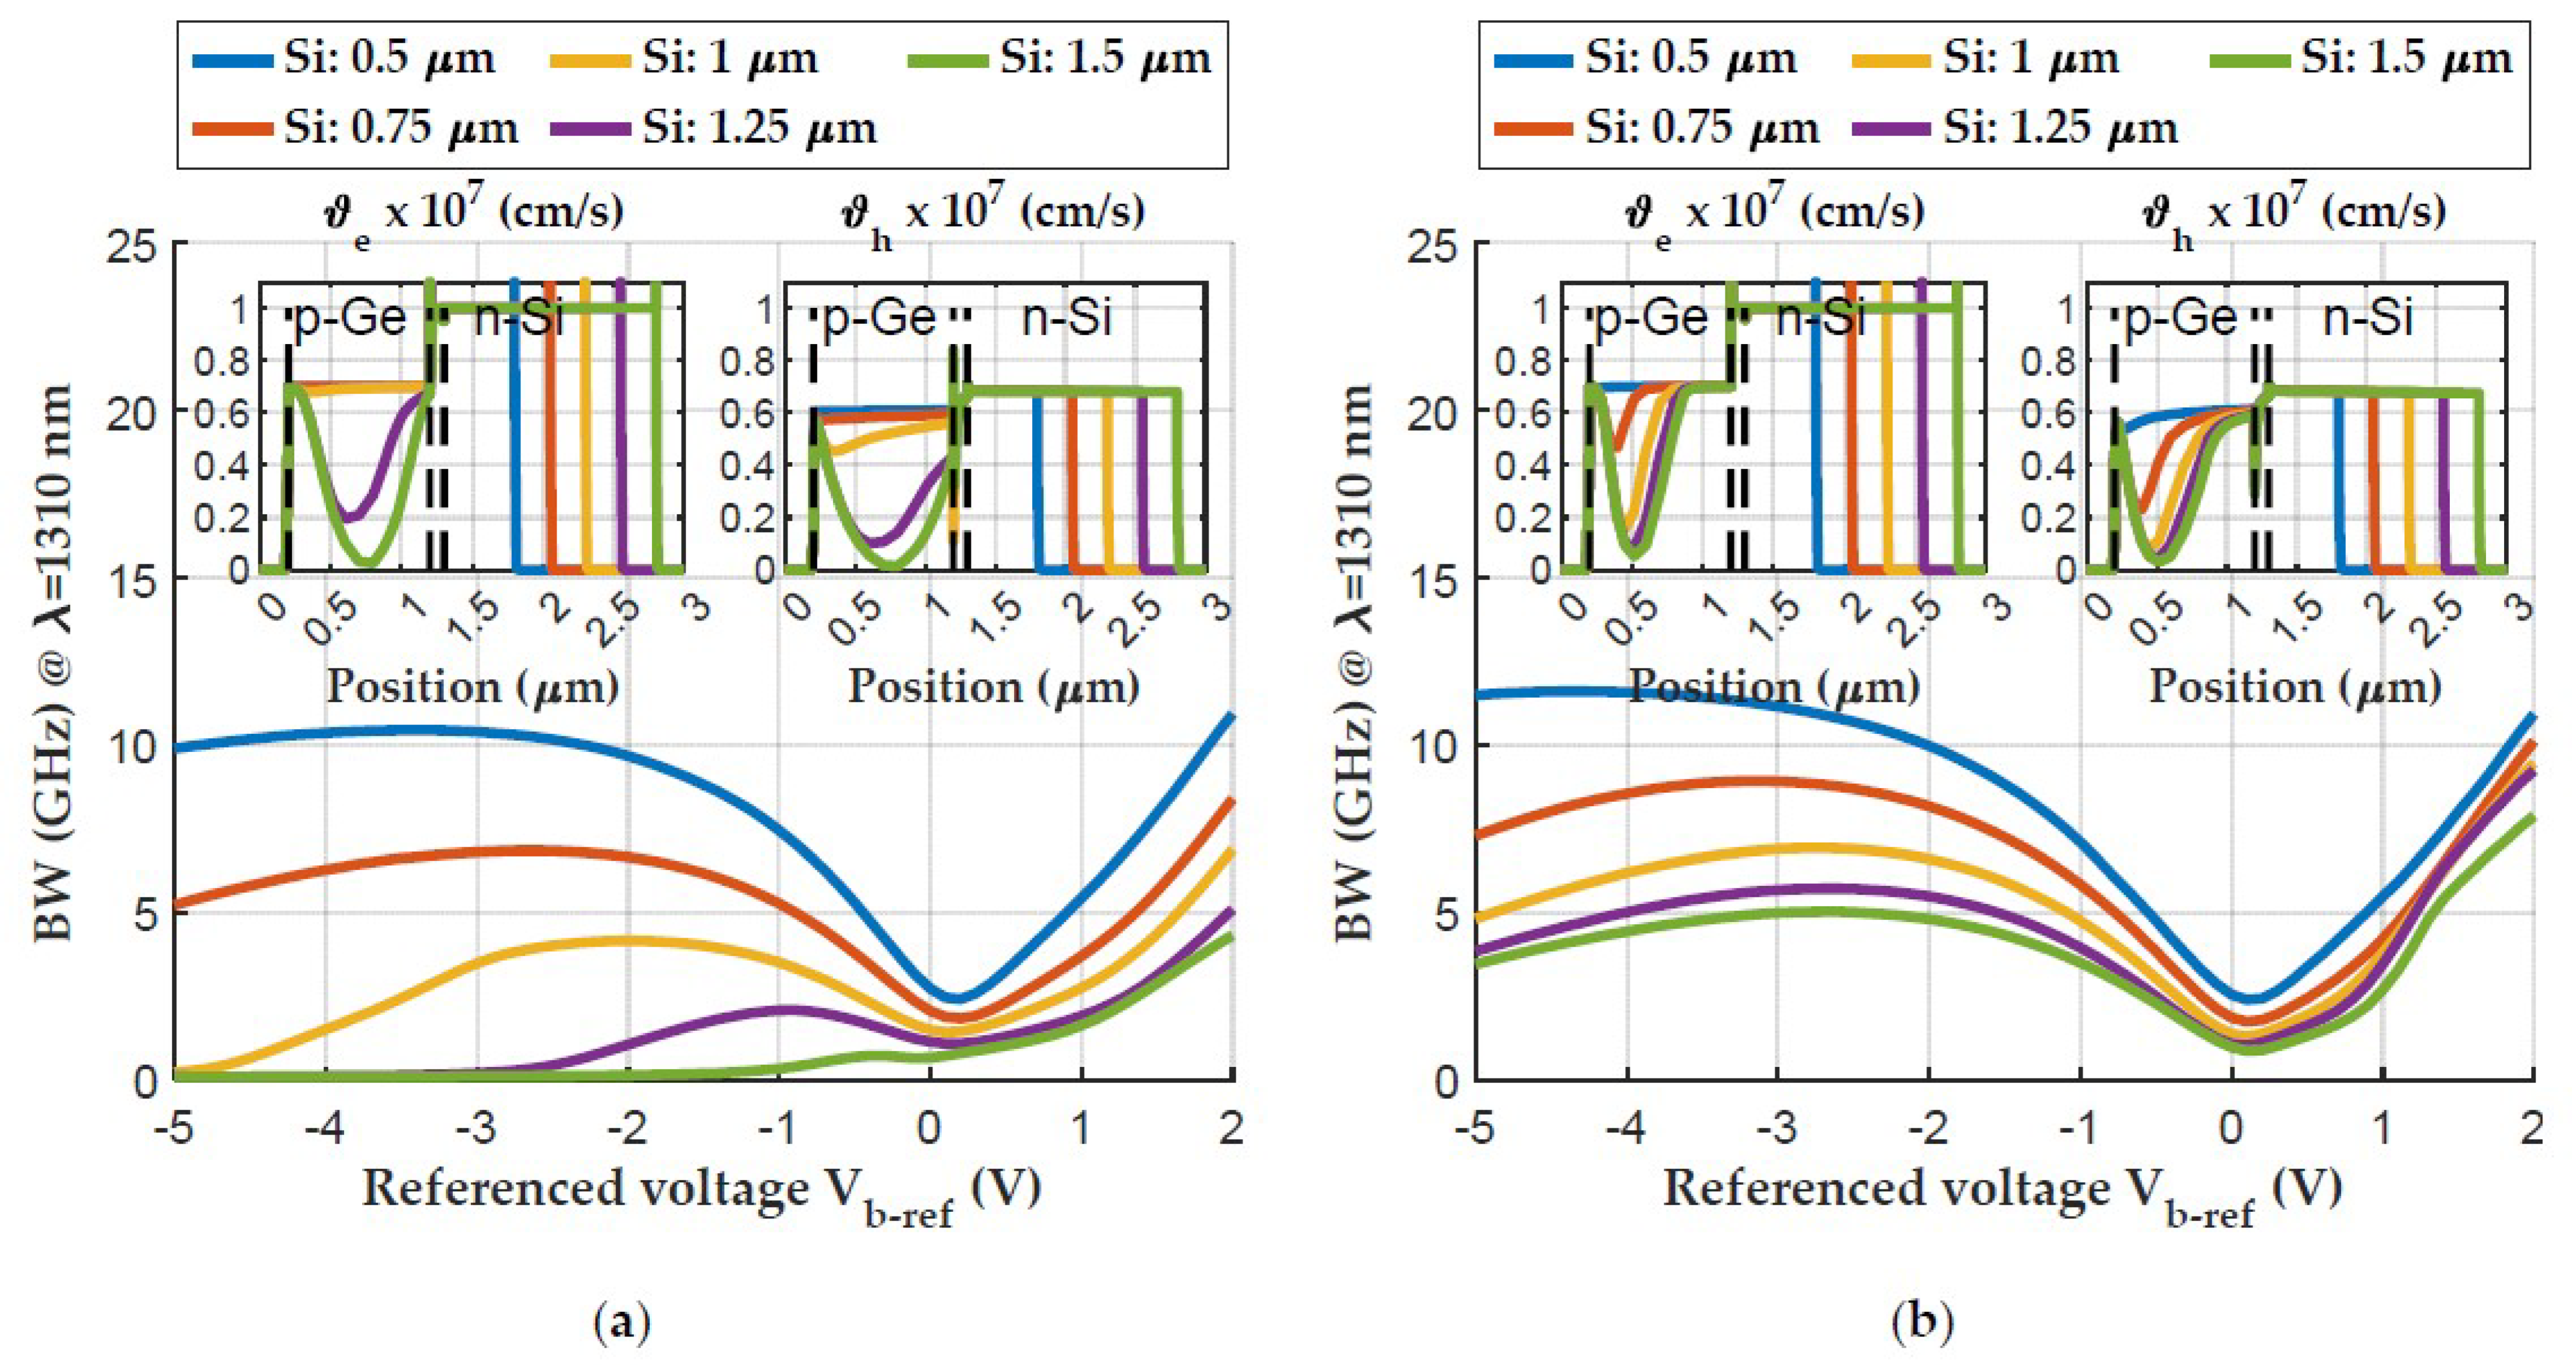
Figure 3 shows the dependence of the bandwidth on the reverse bias voltage for the APD structures with different doping concentrations and thicknesses of the multiplication layer. It can be seen that the bandwidth decreases as the thickness of the multiplication layer increases. The thicker multiplication layer introduces a longer path for carriers to traverse before reaching the collection region. As carriers travel across this increased distance, their transit time increases. This prolonged transit time results in a slower response time of the device, thus limiting the bandwidth. On the other hand, if we consider the electron and hole drift velocity in the simulated structures (as depicted in the insets of Figure 3a,b), it can be seen that the electrons and holes in the n-Si multiplication layer drift at their saturation velocities due to the high electric field, but in the p-Ge absorption layer, the electron and hole drift velocities change depending on the strength of the electric field. For the low-doped absorption and multiplication layer ( 1 × 10 15   c m 3 ) structures, increasing the multiplication layer thickness beyond 1 µm leads to an electric field value less than 30 kV/cm in the absorption layer (as shown in Figure 2 inset); thus, the carriers do not reach their saturation speeds. As a result, the drift time increases and the bandwidth decreases (Figure 3a) compared to the higher-doped absorption and multiplication layer ( 5 × 10 15   c m 3 ) structures (Figure 3b). In the latter case, the electric field at the edges between the absorption layer and the charge layer exceeds 30 kV/cm, causing the carriers to drift partially at their saturation velocities. This leads to a higher bandwidth. However, as the thickness of the multiplication layer increases, the drift time increases, resulting in a reduction in bandwidth.

3.1.3. The Gain Bandwidth Product, Responsivity, and Quantum Efficiency

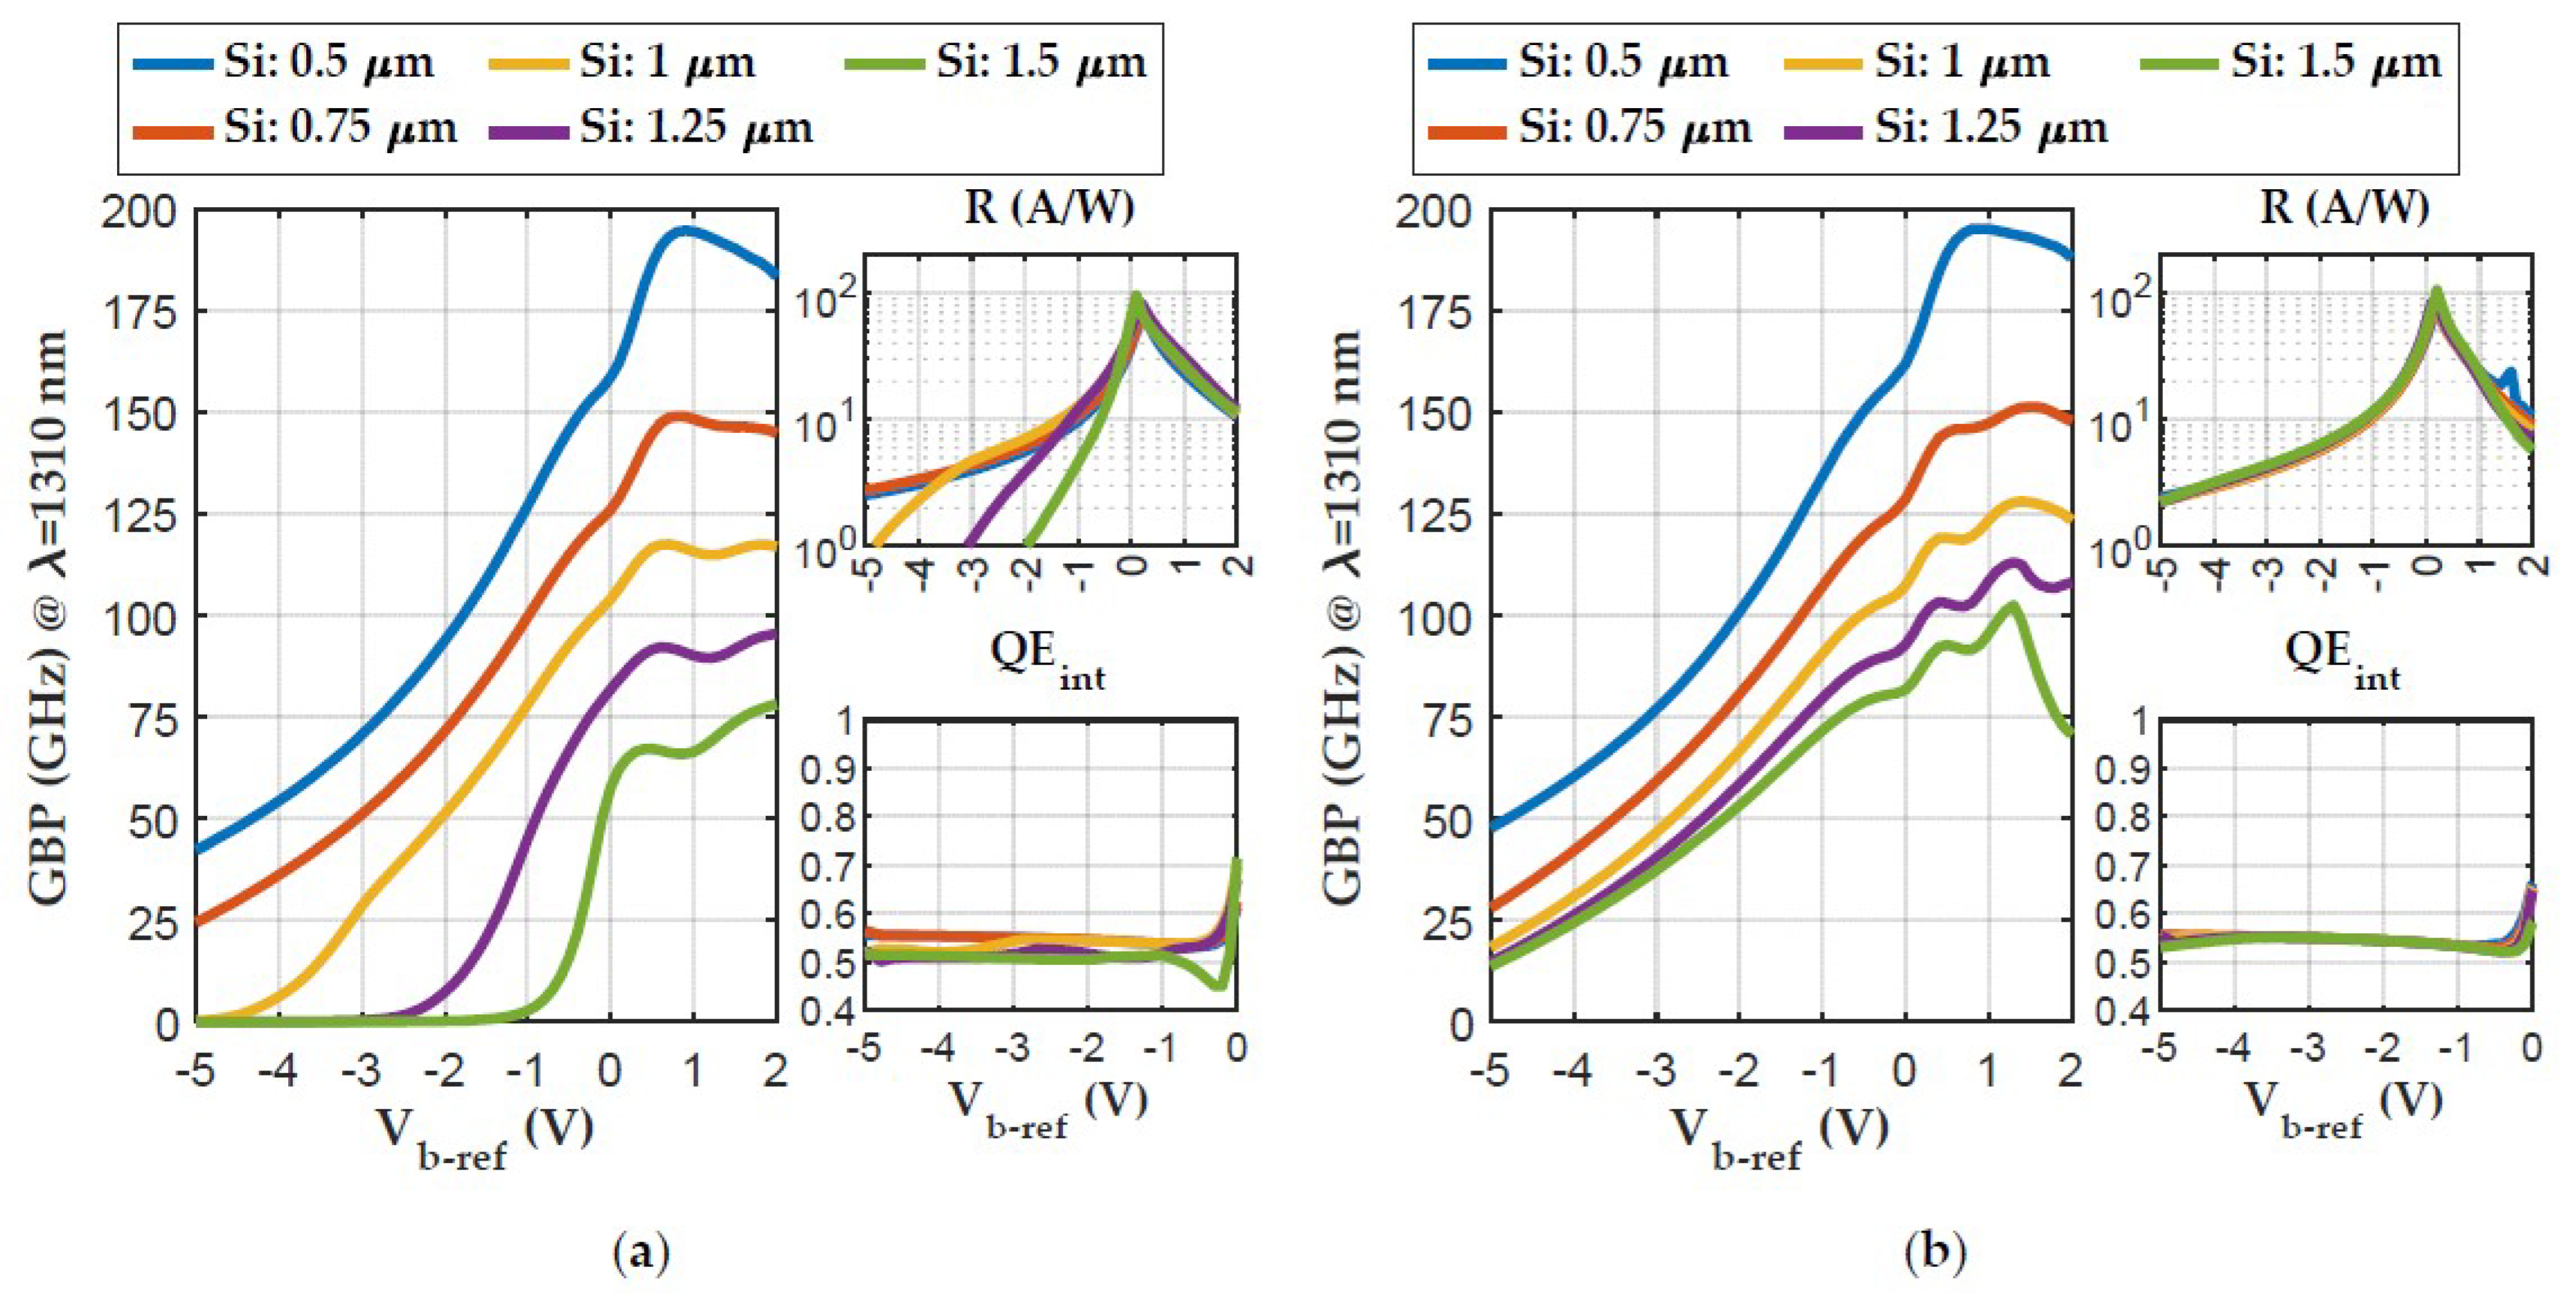
In applications that involve pulse detection or timing, the gain bandwidth product (GBP) plays a crucial role. It determines the speed at which the APD can respond to rapid changes in the input signal. A higher gain bandwidth product allows for faster rise and fall times of pulses, thereby ensuring accurate detection and precise timing measurements. Figure 4 shows the dependence of the gain bandwidth product (GBP) on the reverse bias voltage for the APD structures with different doping concentrations and thicknesses of the multiplication layer. It can be seen that with a thinner multiplication layer, the APD typically exhibits a higher gain bandwidth product. Increasing the thickness of the multiplication layer leads to a decrease in the gain bandwidth product. This is due to the extended transit time of carriers, resulting in a limited frequency response and a reduced gain bandwidth product. Beyond the breakdown voltage, which corresponds to the gain peak, the gain bandwidth product exhibits an increase. This increase is primarily attributed to two factors: the widening of the bandwidth and a gradual decrease in gain. Now, if we consider responsivity and internal quantum efficiency, it can be seen that the structures with the higher-doped absorption and multiplication layers ( 5 × 10 15   c m 3 ) (shown in Figure 4b) exhibit similar levels of responsivity and quantum efficiency due to the consistent thickness of the Ge absorption layer (1 µm) across these structures. However, in the linear mode region of the structures with lower densities ( 1 × 10 15   c m 3 ) (shown in Figure 4a), a thinner multiplication layer tends to result in higher responsivity. This is because, as mentioned above, increasing the multiplication layer thickness beyond 1 µm leads to an electric field strength of less than 30 kV/cm in the absorption layer. Consequently, this reduction in field strength diminishes the number of drifted electron–hole pairs while augmenting the recombination rate.

3.1.4. The Photodiode Spectral Response

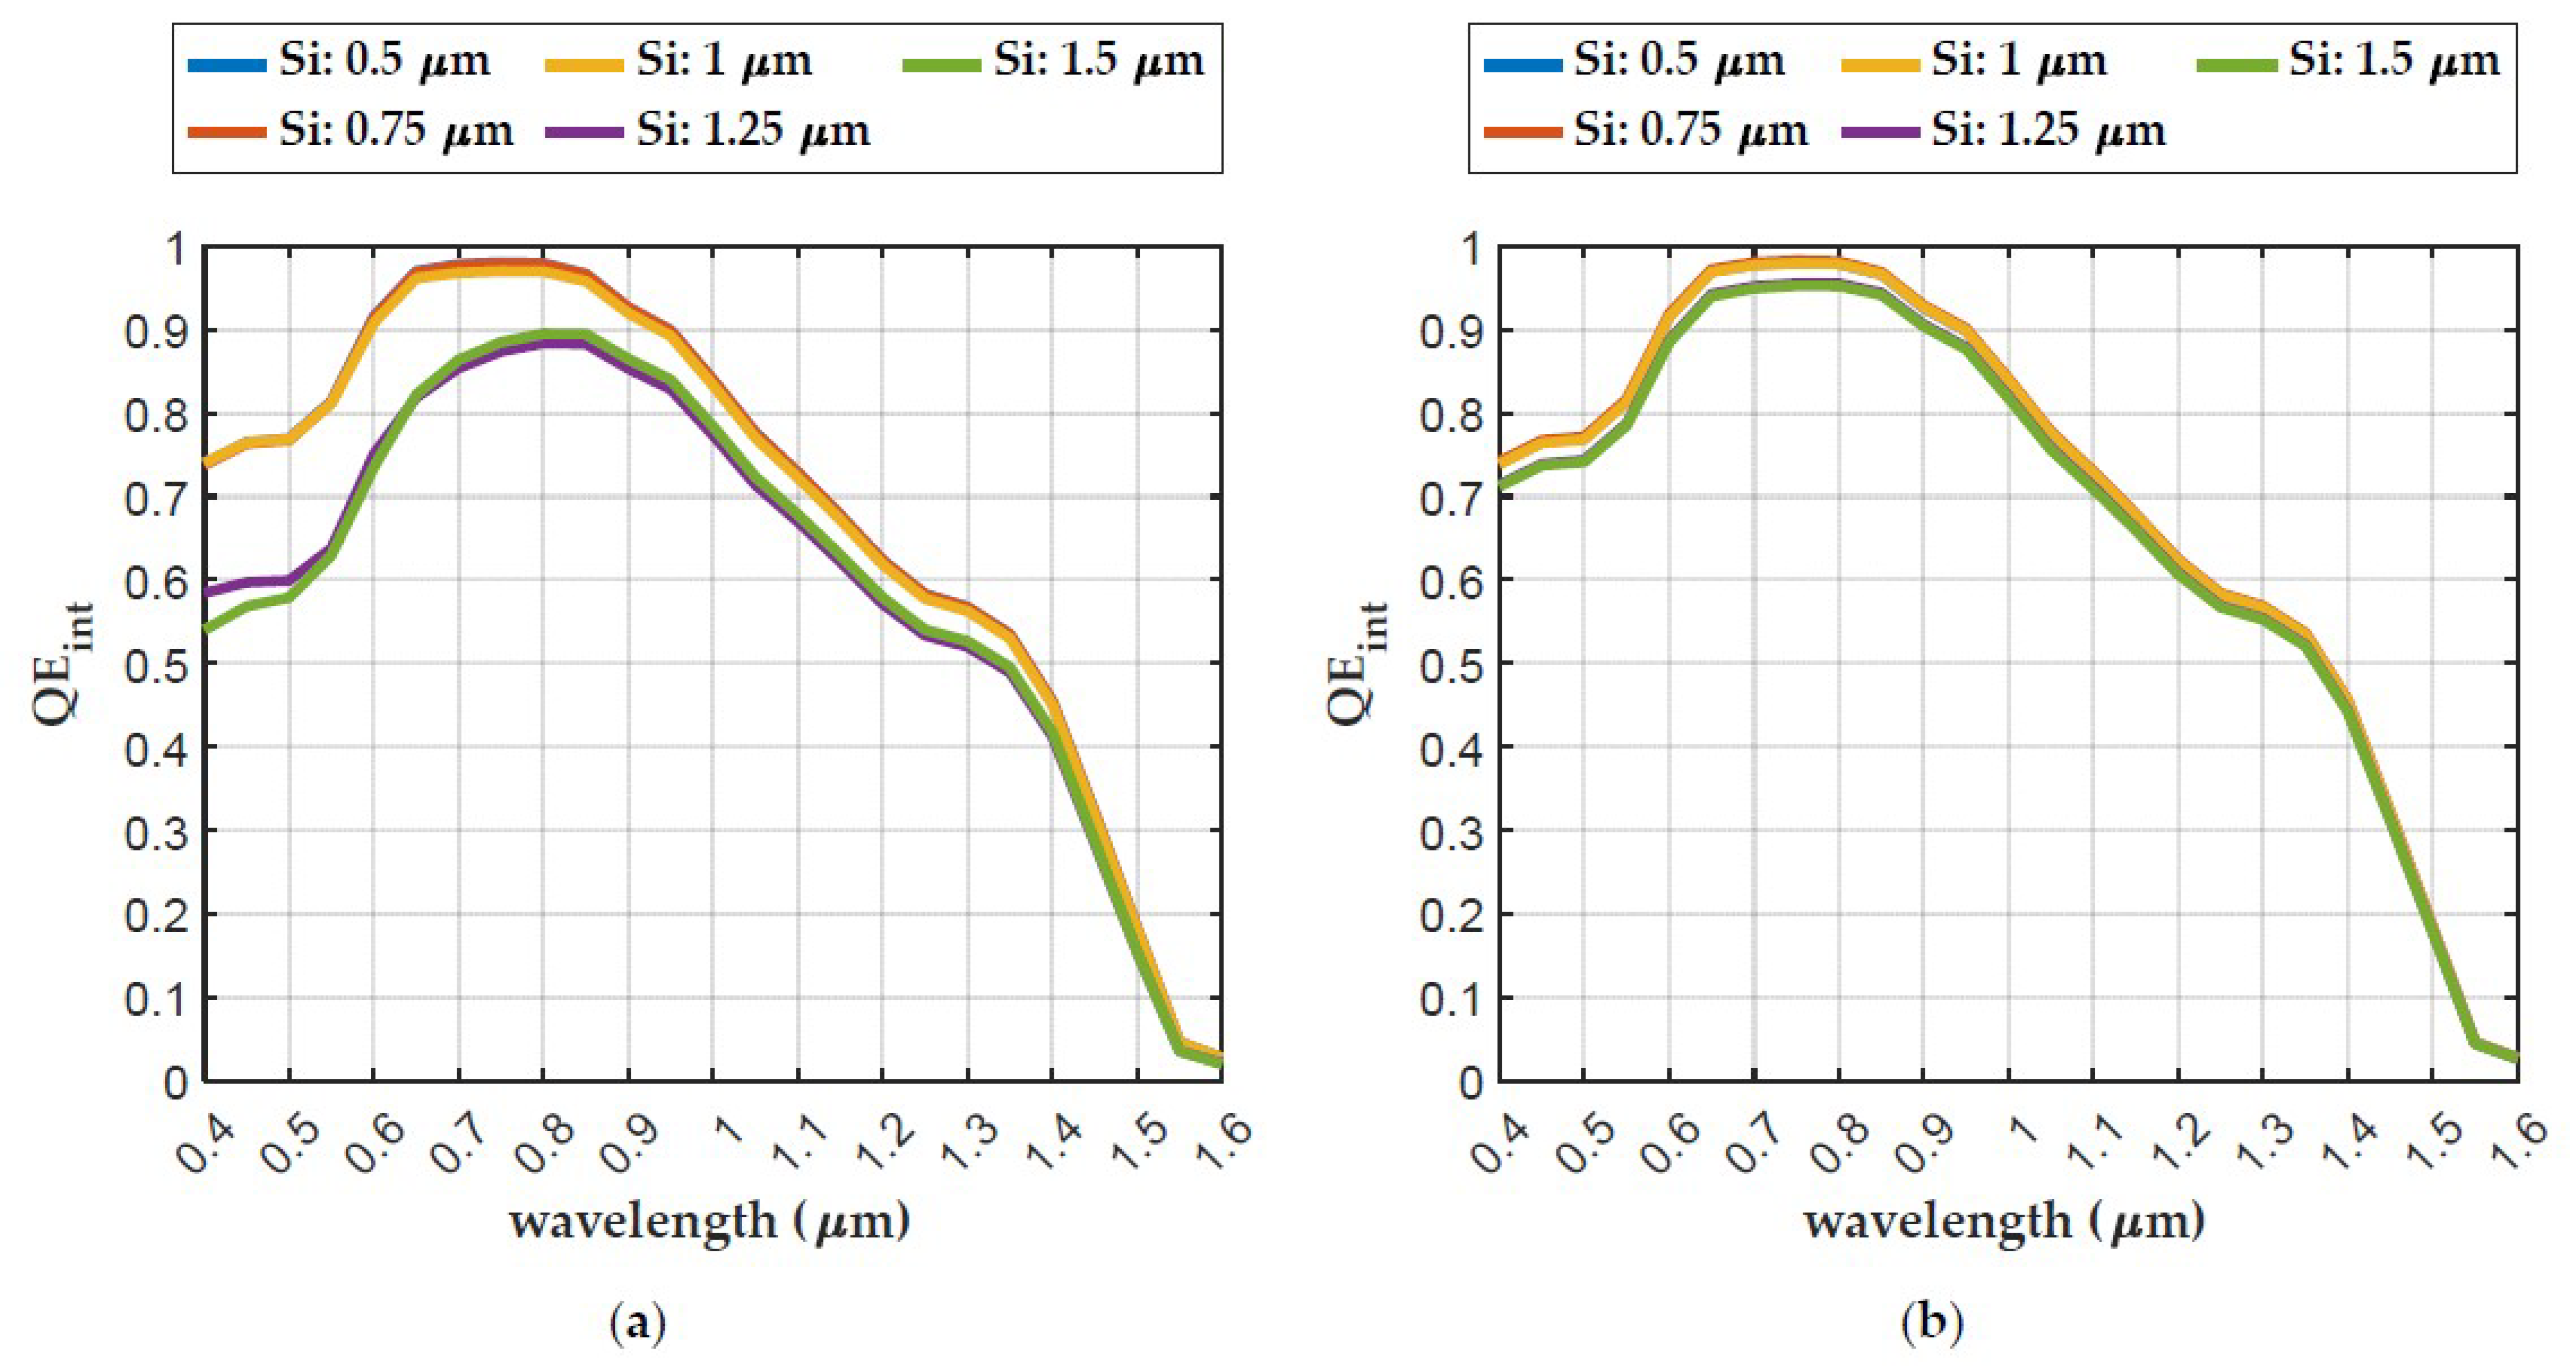
The spectral response is vital for characterizing and optimizing the performance of avalanche photodiodes, enabling their efficient use in various applications that require the precise detection and measurement of light across different wavelengths. Figure 5 shows the dependence of the internal quantum efficiency (QE) on the thickness of the multiplication layer versus the wavelength at the biasing voltage corresponding to the unity gain.
All the simulated structures share a common feature: a 1 µm thick Ge absorption layer. As a result, they are expected to exhibit a similar response to incident light with wavelengths greater than the cut-off wavelength of silicon (1.1 µm) when the thickness of the Si multiplication layer is increased. This similarity arises because only the Ge layer absorbs photons, and changing the doping concentration of the multiplication and absorption layers has a minor impact on the spectral response in this range due to the corresponding variation in the recombination rate along the structure.
On the other hand, incident light with wavelengths ranging from 0.4 µm to 1.1 µm is absorbed in the Ge layer, but some photons are also absorbed in the silicon layers. This absorption in the silicon layers enhances the quantum efficiency within this range. Altering the thickness and doping concentration of the multiplication and absorption layers affects the spectrum response in the wavelength range of 0.4 µm to 1.1 µm due to the resulting distribution of the electric field and the recombination of carriers with surface states and the bulk material. Consequently, a thinner multiplication layer tends to yield a higher spectral response.
In conclusion, increasing the thickness of the multiplication layer leads to an increase in the breakdown voltage and gain, as more electron–hole pairs undergo the avalanche multiplication process. However, the bandwidth of the photodiode decreases with thicker multiplication layers due to the longer carrier transit times. Considering the gain bandwidth product and breakdown voltage as a figure of merit, it can be concluded, based on the simulated results, that an optimal SACM Ge/Si APD structure should have a multiplication layer thickness of 0.5 µm and a doping concentration of 5 × 10 15   c m 3 for both the multiplication and absorption layers; these optimal values are related to the higher GBP, better spectral response, and lower breakdown voltage.

3.2. The Effect of Absorption Layer Parameters

In order to investigate the impact of absorption layer thickness and doping concentration on the performance of the avalanche photodiode, a series of simulations was conducted on eight different structures. These simulations involved varying the thickness of the absorption layer in increments of 0.5 µm, ranging from 0.5 µm to 2 µm. Simultaneously, the multiplication layer was maintained at a constant thickness of 0.5 µm, while the absorption and multiplication layers were assigned two distinct doping concentration values: 1 × 10 15 c m 3 and 5 × 10 15 c m 3 . The devices’ parameters used for this case study are presented in Table 2.

3.2.1. The Multiplication Gain and Breakdown Voltage

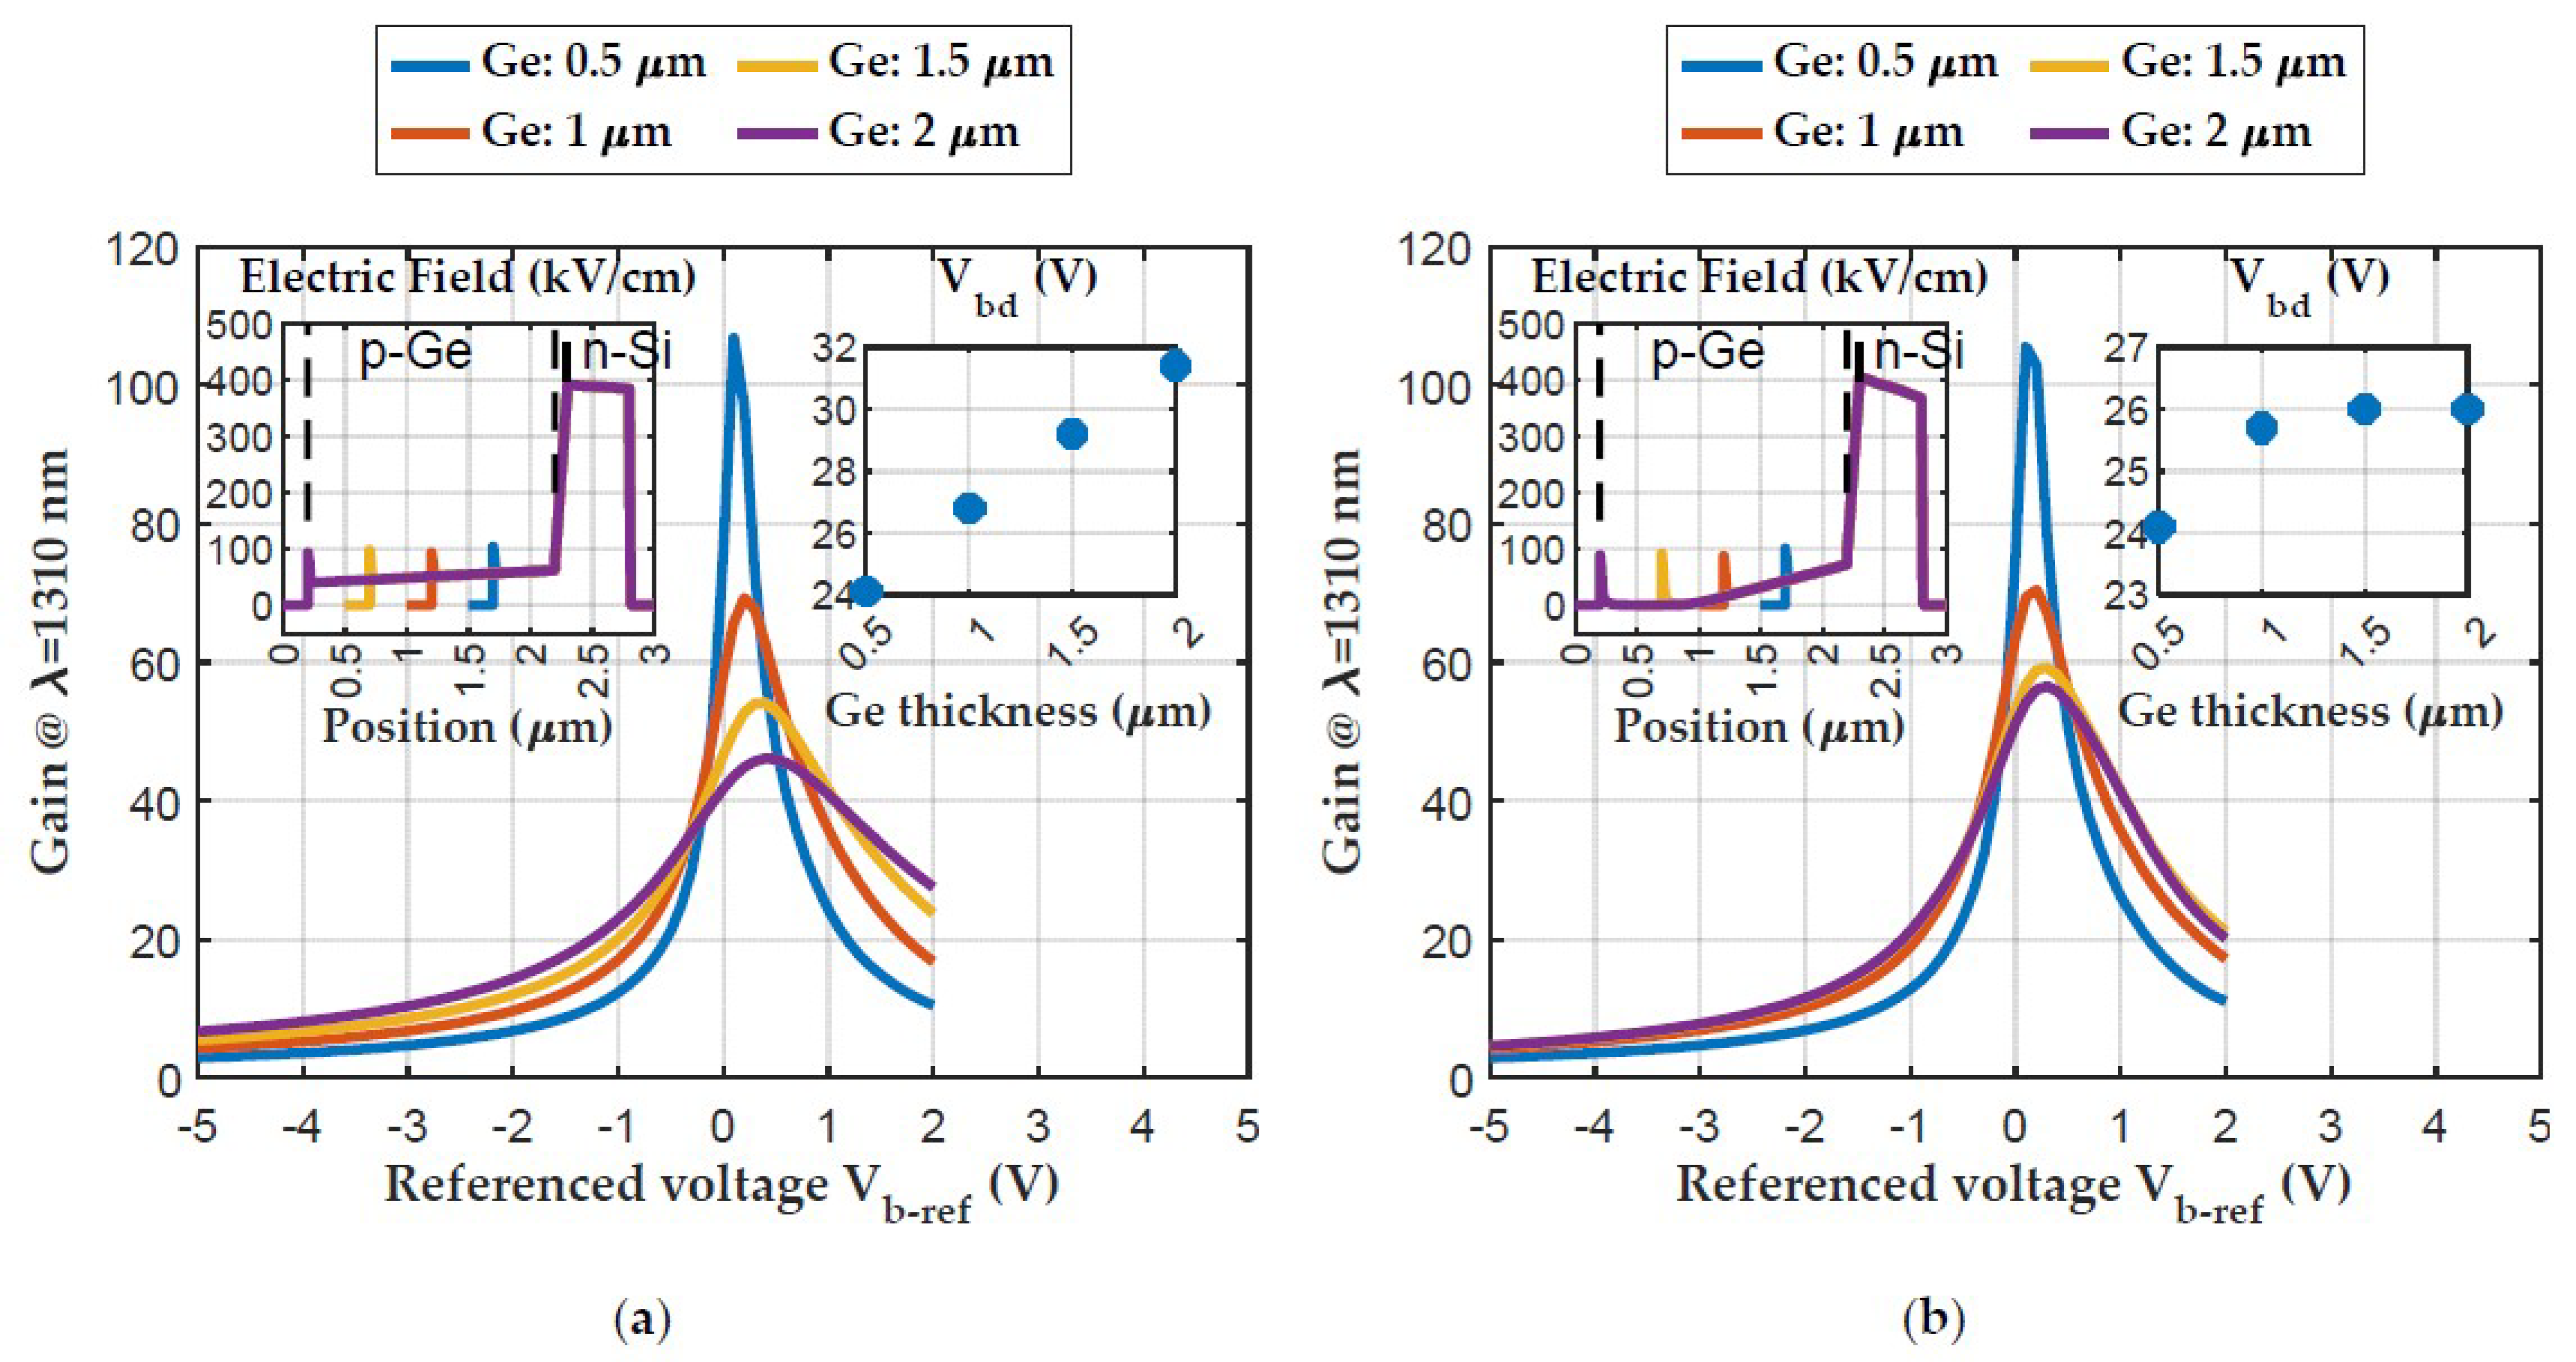
Figure 6 depicts the relationship between the thickness of the absorption layer, bias voltage, and the corresponding dependence of the multiplication gain (M) and breakdown voltage for different APD structures with varying doping concentrations and absorption layer thicknesses. Referring to the inset Figure 6a, it can be observed that an increase in the thickness of the absorption layer from 0.5 µm to 2 µm results in a corresponding increase in the breakdown voltage. Additionally, by changing the doping concentration in the absorption and multiplication layers from 1 × 10 15   c m 3 to 5 × 10 15   c m 3 , the breakdown voltage saturates beyond the 1 µm thickness of the Ge absorption layer, as indicated in the inset in Figure 6b. This saturation phenomenon can be explained by considering the electric field profiles within these structures. Upon observing the electric field profile in the inset in Figure 6b, it can be observed that the Ge absorption layer undergoes partial depletion when the thickness is extended beyond 1 µm. Consequently, this partial depletion causes the breakdown voltage to remain unchanged despite the increase in Ge thickness.
In the linear mode region where Vb-ref is less than –0.5 V, as the thickness of the absorption layer increases, there is a corresponding increase in the multiplication gain. This relationship suggests that a thicker germanium absorption layer allows for a greater number of electron–hole pairs to be generated, leading to higher multiplication gain, as shown in Figure 6. On the other hand, increasing the thickness of the absorption layer results in a decrease in the multiplication gain near the breakdown voltage due to the increase in the build-up time. The build-up time refers to the time required for the avalanche multiplication process to reach its maximum gain. When the thickness of the absorption layer is increased, the build-up time tends to be prolonged. This is because a thicker absorption layer requires a longer time for the carriers to travel and accumulate energy before the avalanche multiplication process reaches its peak gain.

3.2.2. The Bandwidth

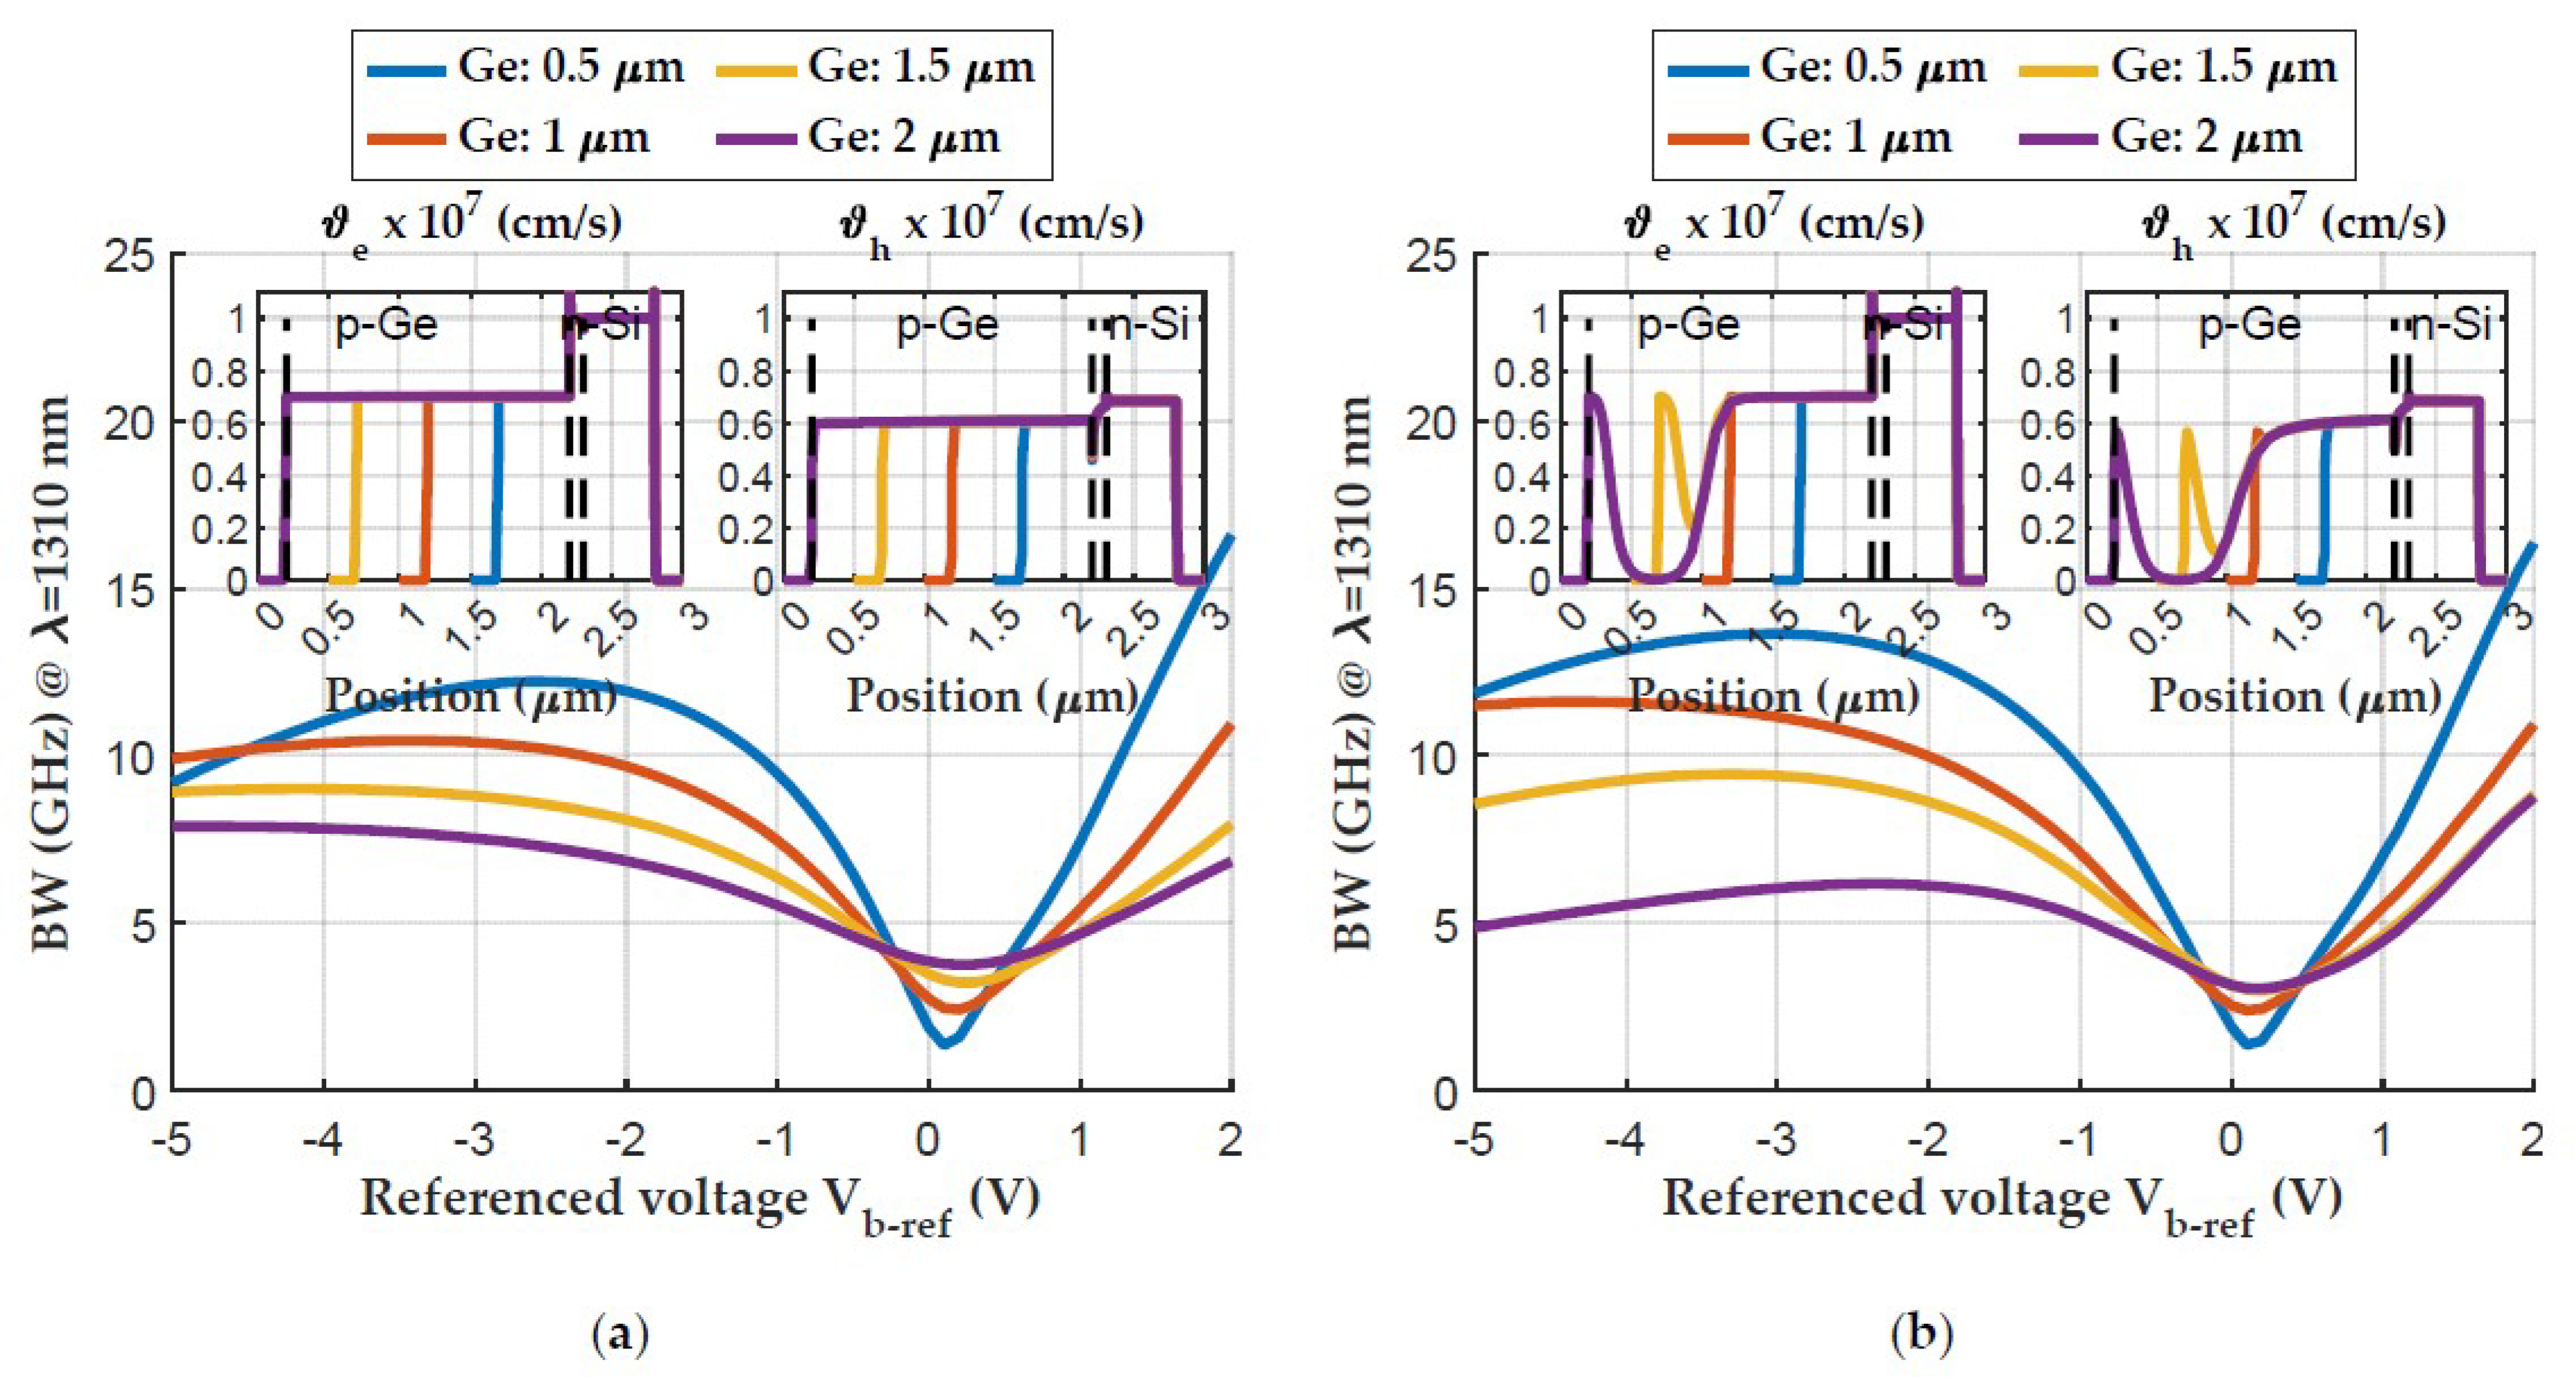
Figure 7 illustrates the relationship between the bandwidth and reverse bias voltage for the APD structures with different doping concentrations and thicknesses of the absorption layer. In the linear mode region, it can be seen that the bandwidth decreases as the thickness of the absorption layer increases. As the absorption layer becomes thicker, the carriers need more time to traverse the absorption region before reaching the multiplication layer. This increased transit time results in a slower response to high-frequency optical signals, thereby reducing the bandwidth. Conversely, for structures with a doping concentration of 1 × 10 15   c m 3 in the absorption and multiplication layers, the insets in Figure 7a demonstrate that the electrons and holes drift at their saturation velocities. However, by altering the doping concentration to 5 × 10 15   c m 3 , it becomes apparent, as shown in the insets of Figure 7b, that the carriers in the structures with an absorption layer thickness exceeding 1 µm do not reach their saturation velocities. Consequently, the bandwidth decreases compared to the corresponding structures with a doping concentration of 1 × 10 15   c m 3 .
The dependence of bandwidth on the gain and build-up time near the breakdown voltage is more significant than the dependence of bandwidth on transit time. This relationship can be expressed as B W = ( 2 π M τ ) 1 [36], where M denotes multiplication gain and τ is the avalanche build-up time. Consequently, the increase in the absorption layer’s thickness results in an increase in bandwidth due to the higher gain achieved with the thinner absorption layer near the breakdown voltage.

3.2.3. The Gain Bandwidth Product, Responsivity, and Quantum Efficiency

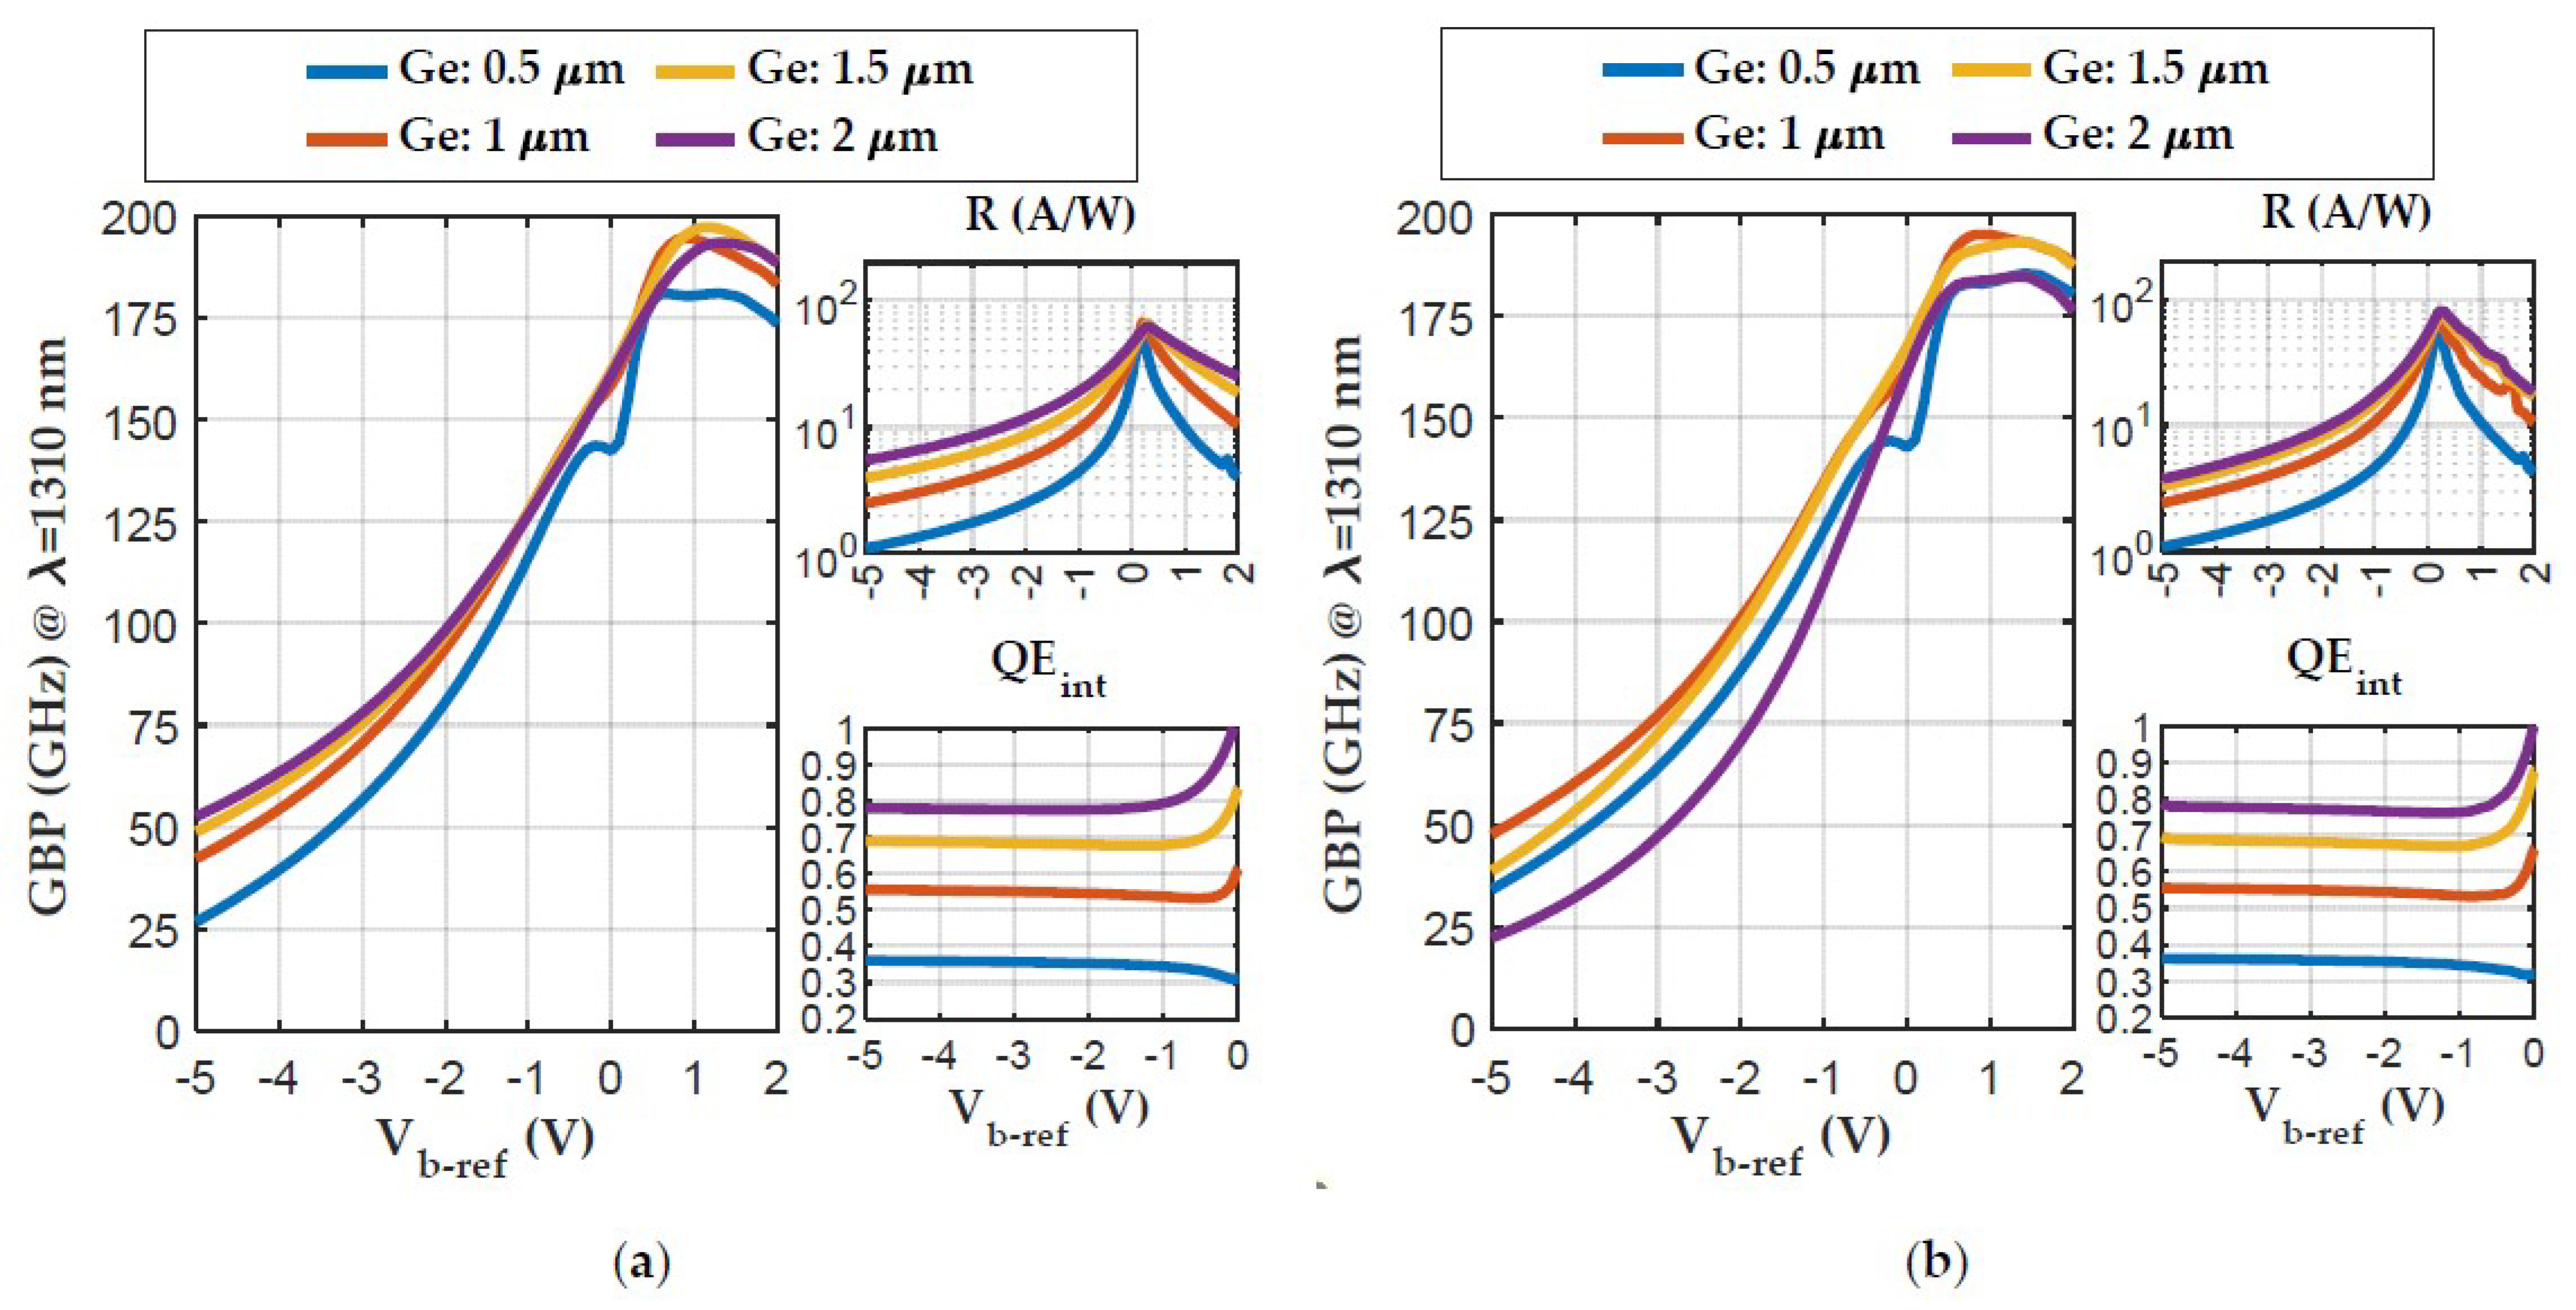
In Figure 8, the relationship between the gain bandwidth product (GBP) and reverse bias voltage is demonstrated for various APD structures with differing doping concentrations and absorption layer thicknesses. The findings indicate that the GBP is linked to the gain increase in the linear mode region due to a consistent bandwidth. Additionally, as the gain grows nearer to the breakdown voltage, there is a significant increase that outweighs the drops in bandwidth caused by the growing avalanche build-up time. If we examine the responsivity and internal quantum efficiency, thicker absorption layers demonstrate increased values for both. This outcome is due to the fact that thicker absorption layers increase the likelihood of photon absorption, resulting in a larger number of electron–hole pairs. This generates more charge carriers that are available for the multiplication process, resulting in higher values of responsivity and internal quantum efficiency.

3.2.4. The Photodiode Spectral Response

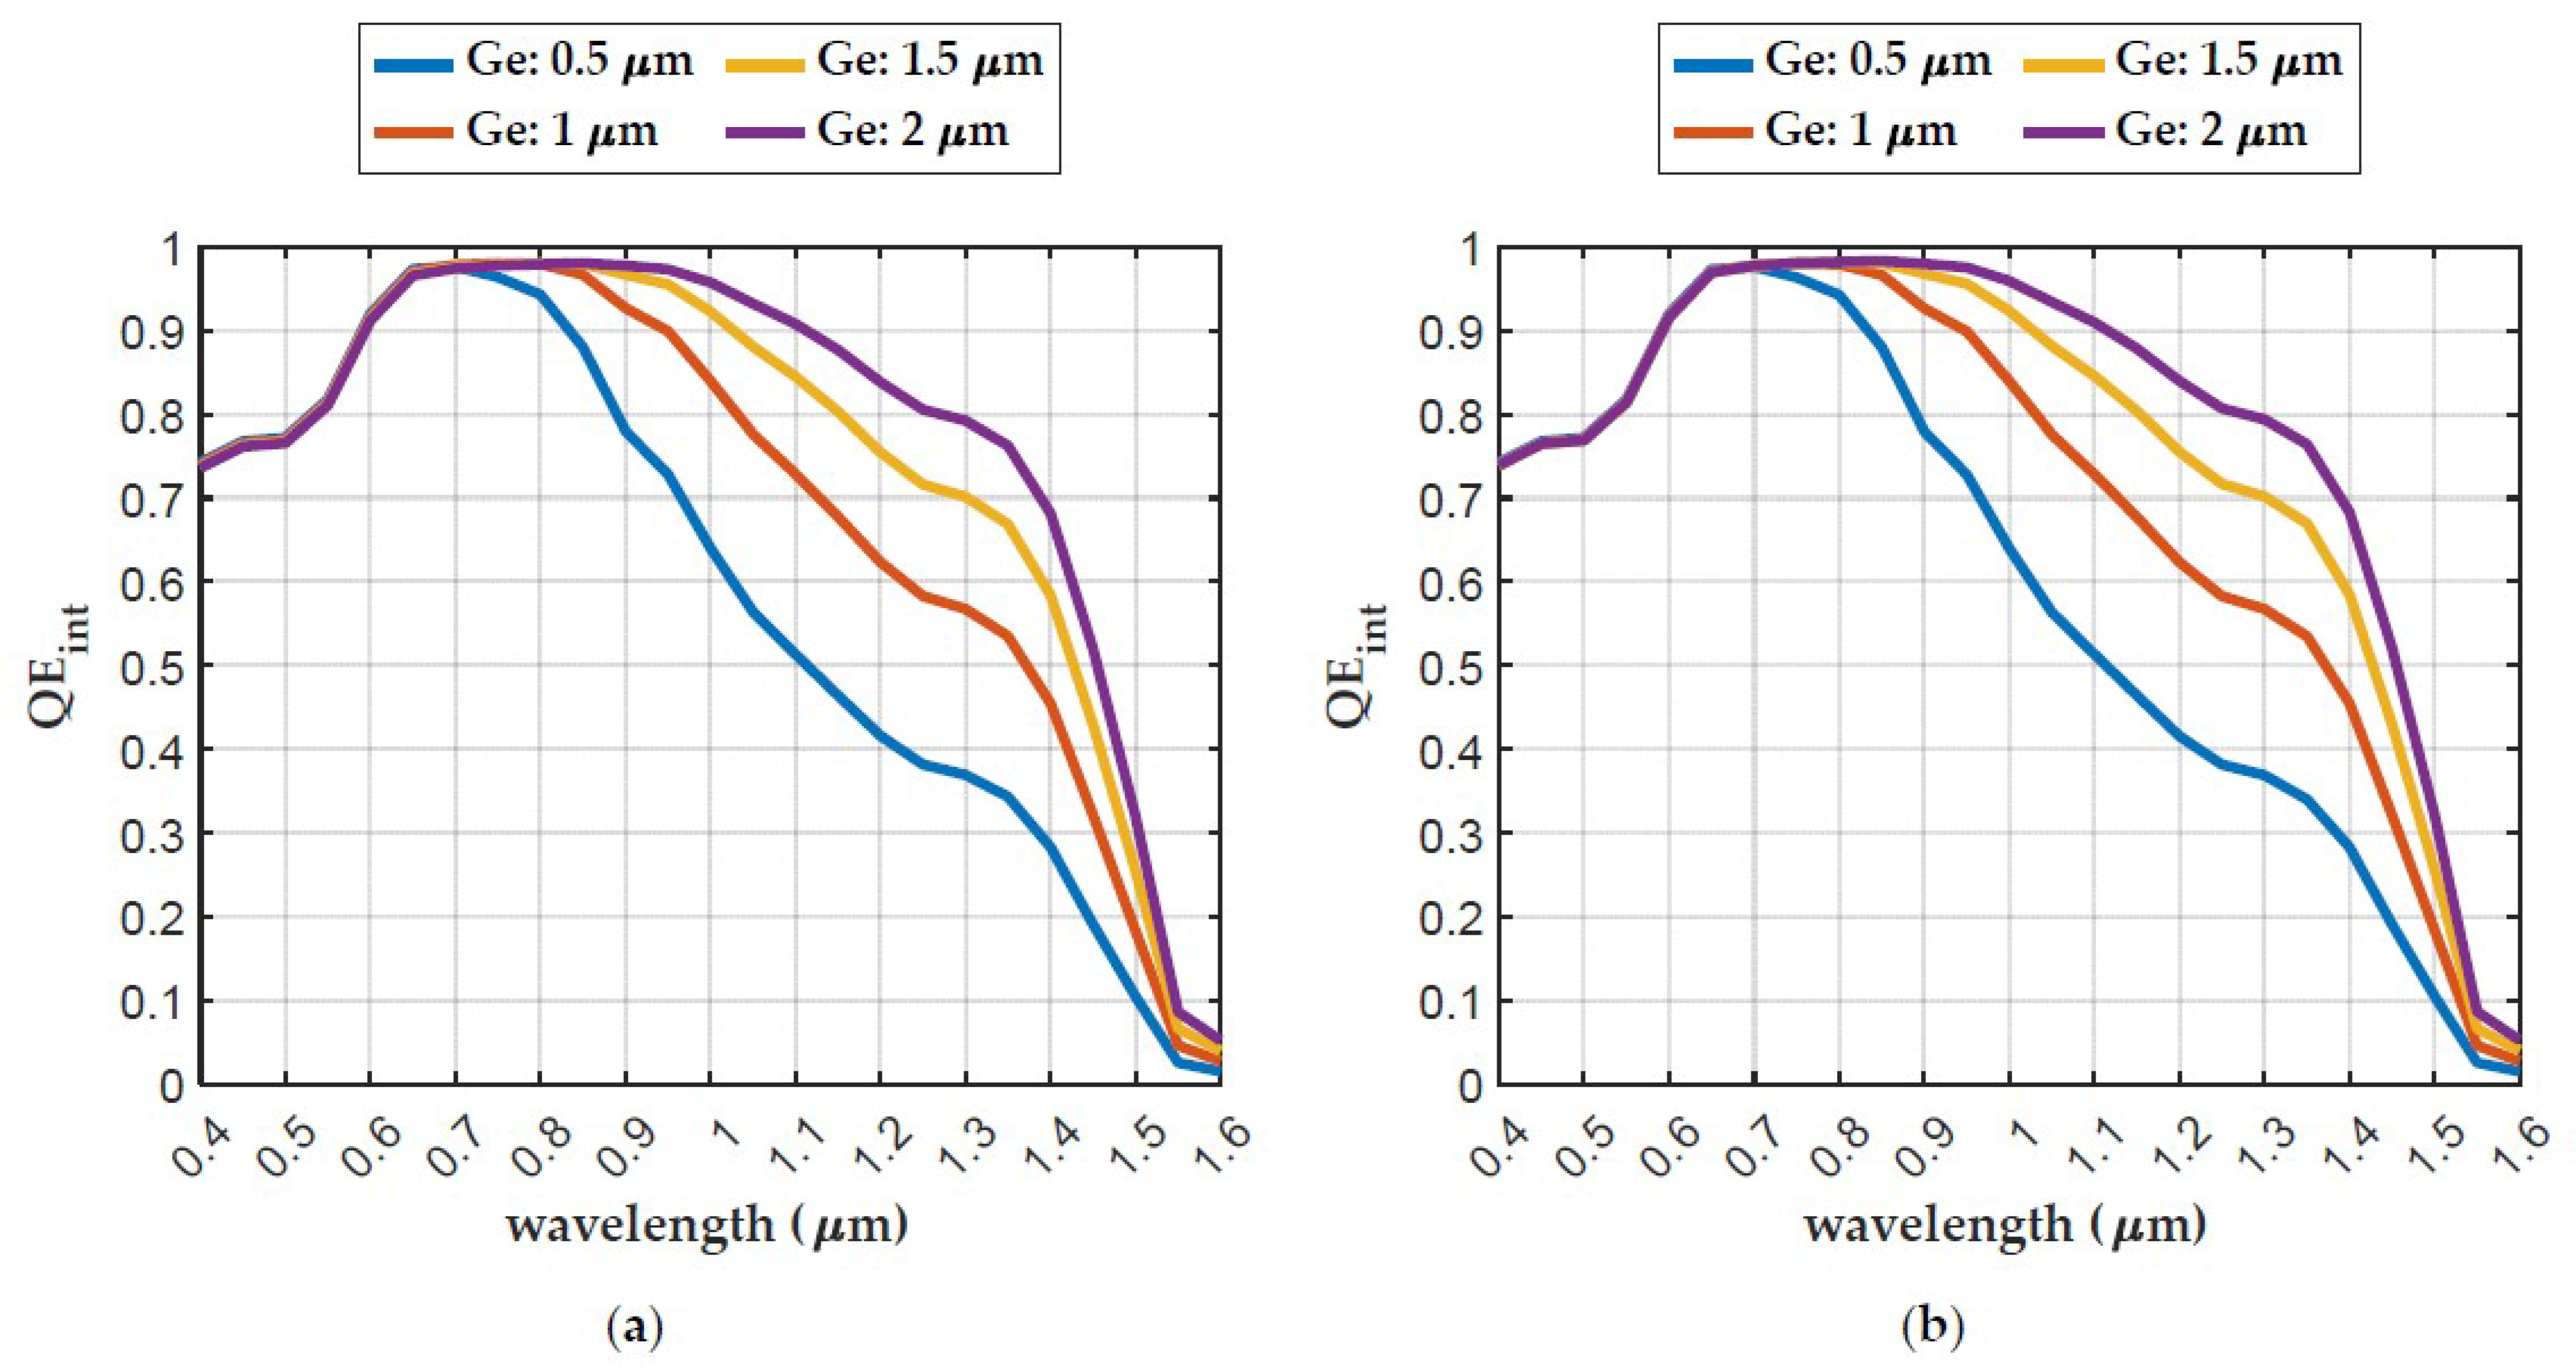
The dependence of the internal quantum efficiency (QE) on the thickness of the absorption layer versus the wavelength at the biasing voltage corresponding to unity gain is illustrated in Figure 9. It is evident that all structures exhibit a comparable spectral response for incident light with wavelengths less than 0.7 µm, as the majority of photons are effectively absorbed in the silicon material. Moreover, these structures share the same silicon layer thickness.
On the other hand, the spectral response is highly influenced by the thickness of the Ge absorption layer for incident light with wavelengths ranging from 0.7 µm to 1.6 µm. As the thickness of the Ge absorption layer increases, the quantum efficiency also increases due to the increased number of absorbed photons. Figure 9a,b demonstrate that modifying the doping concentration of the multiplication and absorption layers does not impact the spectral response. This is attributed to the similar recombination rates along the structure at the relevant bias voltage corresponding to unity gain. Consequently, increasing the thickness of the absorption layer enhances the spectral response by capturing a greater number of absorbed photons.
In summary, the dependence of various performance parameters on the thickness of the absorption layer in a SACM Ge/Si avalanche photodiode has been investigated. It has been observed that the gain, bandwidth, responsivity, and quantum efficiency show a clear dependence on the absorption layer thickness. A thinner absorption layer results in higher bandwidth, indicating a faster response to high-frequency optical signals. However, this also leads to a decrease in responsivity and quantum efficiency. By considering factors such as breakdown voltage, GBP, responsivity, and quantum efficiency, we can determine the optimal design for a SACM Ge/Si APD. Our simulations suggest that an optimal configuration would involve a 0.5 µm thick multiplication layer, a 1.5 µm thick absorption layer, and a doping concentration of 5 × 10 15   c m 3 for both layers.

4. Conclusions

The separate-absorption-charge-multiplication (SACM) germanium on silicon avalanche photodiode structure has been designed, modeled, and analyzed to investigate the performance dependences on the doping concentrations and thicknesses of the absorption and multiplication layers. These performance characteristics include breakdown voltage, gain, bandwidth, responsivity, and quantum efficiency. The simulations were performed by comparing various multiplication and absorption layers’ thicknesses, whereas the other structural and material parameters were left unchanged.
In general, optimizing the thickness of the multiplication and absorption layers in an APD requires a compromise between gain, bandwidth, responsivity, and quantum efficiency in order to balance the characteristics of the device. The dimensions that will ensure optimal performance depend on the specific requirements for the device and the operating conditions. Based on our analysis and modeling results, we can deduce that an optimal design for an SACM Ge/Si APD would feature a multiplication layer with a thickness of 0.5 µm, an absorption layer with a thickness of 1.5 µm, and a doping concentration of 5 × 10 15   c m 3 for both layers.

Author Contributions

Conceptualization, H.D., K.K., A.K., R.D. and K.L.; writing—original draft preparation, H.D. and K.K.; writing—review and editing, H.D., K.K., A.K., R.D. and K.L.; supervision, A.K.; project administration A.K.; funding acquisition, A.K. All authors have read and agreed to the published version of the manuscript.

Funding

The reported study was supported by the Tomsk State University Development Programme (Priority 2030, No. 2.0.6.22).

Data Availability Statement

The authors declare that the data supporting the findings of this study are available within the article.

Conflicts of Interest

The authors declare no conflict of interest.

References

  1. Benedikovic, D.; Aubin, G.; Haetmann, J.-M.; Amar, F.; Le Roux, X.; Alonso-Ramos, C.; Cassan, É.; Marris-Morini, D.; Boeuf, F.; Fédéli, J.-M.; et al. Silicon-Germanium Avalanche Receivers with fJ/bit Energy Consumption. IEEE J. Sel. Top. Quantum Electron. 2022, 28, 3802508. [Google Scholar] [CrossRef]
  2. Srinivasan, S.A.; Lambrecht, J.; Guermandi, D.; Lardenois, D.; Berciano, M.; Absil, P.; Bauwelinck, J.; Yin, X.; Pantouvaki, M.; Campenhout, J.V. 56 Gb/s NRZ O-Band Hybrid BiCMOS-Silicon Photonics Receiver Using Ge/Si Avalanche Photodiode. J. Light. Technol. 2021, 39, 1409–1415. [Google Scholar] [CrossRef]
  3. Zhang, J.; Kuo, B.P.-P.; Radic, S. 64 Gb/s PAM4 and 160 Gb/s 16QAM modulation reception using a low-voltage Si-Ge waveguide-integrated APD. Opt. Express 2020, 28, 23266. [Google Scholar] [CrossRef]
  4. Wang, B.; Huang, Z.; Sorin, W.V.; Zeng, X.; Liang, D.; Fiorentino, M.; Beausoleil, R.G. A Low-Voltage Si-Ge Avalanche Photodiode for High-Speed and Energy Efficient Silicon Photonic Links. J. Light. Technol. 2020, 38, 3156–3163. [Google Scholar] [CrossRef]
  5. Chen, H.T.; Verheyen, V.P.; De Heyn, P.; Lepage, G.; De Coster, J.; Absil, P.; Yin, X.; Bauwelinck, J.; Van Campenhout, J.; Roelkens, G. High sensitivity 10 Gb/s Si photonic receiver based on a low-voltage waveguide-coupled Ge avalanche photodetector. Opt. Express 2015, 23, 815–822. [Google Scholar] [CrossRef] [PubMed] [Green Version]
  6. Izhnin, I.I.; Lozovoy, K.A.; Kokhanenko, A.P.; Khomyakova, K.I.; Douhan, R.M.H.; Dirko, V.V.; Voitsekhovskii, A.V.; Fitsych, O.I.; Akimenko, Y.N. Single-photon avalanche diode detectors based on group IV materials. Appl. Nanosci. 2022, 12, 253–263. [Google Scholar] [CrossRef]
  7. Douhan, R.; Lozovoy, K.; Kokhanenko, A.; Deeb, H.; Dirko, V.; Khomyakova, K. Recent Advances in Si-Compatible Nanostructured Photodetectors. Technologies 2023, 11, 17. [Google Scholar] [CrossRef]
  8. Hakkel, K.D.; Petruzzella, M.; Ou, F.; van Klinken, A.; Pagliano, F.; Liu, T.; van Veldhoven, R.P.J.; Fiore, A. Integrated near-infrared spectral sensing. Nat. Commun. 2022, 13, 69. [Google Scholar] [CrossRef]
  9. Liu, D.; Li, T.; Tang, B.; Zhang, P.; Wang, W.; Liu, M.; Li, Z. A Near-Infrared CMOS Silicon Avalanche Photodetector with Ultra-Low Temperature Coefficient of Breakdown Voltage. Micromachines 2022, 13, 47. [Google Scholar] [CrossRef]
  10. Li, Y.; Luo, X.; Liang, G.; Lo, G.-Q. Demonstration of Ge/Si Avalanche Photodetector Arrays for Lidar Application. In Proceedings of the 2019 Optical Fiber Communications Conference and Exhibition (OFC), San Diego, CA, USA, 3–7 March 2019; pp. 1–3. [Google Scholar]
  11. Campbell, J.C.; Demiguel, S.; Ma, F.; Beck, A. Recent Advances in Avalanche Photodiodes. J. Light. Technol. 2016, 34, 278–285. [Google Scholar] [CrossRef]
  12. Lacaita, A.; Francese, P.A.; Zappa, F.; Cova, S. Single-photon detection beyond 1 μm: Performance of commercially available germanium photodiodes. Appl. Opt. 1994, 33, 6902–6918. [Google Scholar] [CrossRef]
  13. Zaoui, W.S.; Chen, H.-W.; Bowers, J.E.; Kang, Y.; Morse, M.; Paniccia, M.J.; Pauchard, A.; Campbell, J.C. Frequency response and bandwidth enhancement in Ge/Si avalanche photodiodes with over 840 GHz gain-bandwidth-product. Opt Express 2009, 17, 12641–12649. [Google Scholar] [CrossRef] [PubMed]
  14. Kang, Y.; Liu, H.-D.; Morse, M.; Paniccia, M.J.; Zadka, M.; Litski, S.; Sarid, G.; Pauchard, A.; Kuo, Y.-H.; Chen, H.-W.; et al. Monolithic germanium/silicon avalanche photodiodes with 340 GHz gain-bandwidth product. Nat. Photonics 2009, 3, 59–63. [Google Scholar] [CrossRef]
  15. Duan, N.; Liow, T.-Y.; Lim, A.E.-J.; Ding, L.; Lo, G.Q. 310 GHz gain-bandwidth product Ge/Si avalanche photodetector for 1550 nm light detection. Opt. Express 2012, 20, 11031–11036. [Google Scholar] [CrossRef]
  16. Warburton, R.E.; Intermite, G.; Myronov, M.; Allred, P.; Leadley, D.R.; Gallacher, K.; Paul, D.J.; Pilgrim, N.J.; Lever, L.J.M.; Ikonic, Z.; et al. Ge-on-Si single-photon avalanche diode detectors: Design, modeling, fabrication, and characterization at wavelengths 1310 and 1550 nm. IEEE Trans. Electron Devices 2013, 60, 3807–3813. [Google Scholar] [CrossRef]
  17. Huang, Z.; Li, C.; Liang, D.; Yu, K.; Santori, C.; Fiorentino, M.; Sorin, M.; Palermo, S.; Beausoleil, R.G. 25 Gbps low-voltage Waveguide Si-Ge Avalanche Photodiode. Optica 2016, 3, 793–798. [Google Scholar] [CrossRef]
  18. Kang, Y.; Zadka, M.; Litski, S.; Sarid, G.; Morse, M.; Paniccia, M.J.; Kuo, Y.-H.; Bowers, J.; Beling, A.; Liu, H.-D.; et al. Epitaxially-grown Ge/Si avalanche photodiodes for 1.3 μm light detection. Opt. Express 2008, 16, 9365–9371. [Google Scholar] [CrossRef]
  19. Zeng, X.; Huang, Z.; Wang, B.; Liang, D.; Fiorentino, M.; Beausoleil, R.G. Silicon–germanium avalanche photodiodes with direct control of electric field in charge multiplication region. Optica 2019, 6, 772–777. [Google Scholar] [CrossRef]
  20. Wang, B.; Huang, Z.; Yuan, Y.; Liang, D.; Zeng, X.; Fiorentino, M.; Beausoleil, R.G. 64 Gb/s low-voltage waveguide SiGe avalanche photodiodes with distributed Bragg reflectors. Photonics Res. 2020, 8, 1118–1123. [Google Scholar] [CrossRef]
  21. Samani, A.; Carpentier, O.; El-Fiky, E.; Jacques, M.; Kumar, A.; Wang, Y.; Guenin, L.; Gamache, C.; Koh, P.-C.; Plant, D.V. Highly Sensitive, 112 Gb/s O-band Waveguide Coupled Silicon-Germanium Avalanche Photodetectors. In Proceedings of the 2019 Optical Fiber Communications Conference and Exhibition (OFC), San Diego, CA, USA, 3–7 March 2019; pp. 1–3. [Google Scholar]
  22. Carpentier, O.; Samani, A.; Jacques, M.; El-Fiky, E.; Alam, S.; Wang, Y.; Koh, P.-C.; Calvo, N.A.; Plant, D. High Gain-Bandwidth Waveguide Coupled Silicon Germanium Avalanche Photodiode. In Proceedings of the 2020 Conference on Lasers and Electro-Optics (CLEO), San Jose, CA, USA, 10–15 May 2020; pp. 1–2. [Google Scholar]
  23. Kim, G.; Kim, S.; Kim, S.A.; Oh, J.H.; Jang, K.-S. NDR-effect vertical-illumination-type Ge-on-Si avalanche photodetector. Opt. Lett. 2018, 43, 5583–5586. [Google Scholar] [CrossRef]
  24. Huang, M.; Cai, P.; Li, S.; Hou, G.; Zhang, N.; Su, T.-I.; Hong, C.; Pan, D. 56 GHz Waveguide Ge/Si Avalanche Photodiode. In Proceedings of the 2018 Optical Fiber Communications Conference and Exhibition (OFC), San Diego, CA, USA, 11–15 March 2018; pp. 1–3. [Google Scholar]
  25. Zeng, Q.Y.; Pan, Z.X.; Zeng, Z.H.; Wang, J.T.; Guo, C.; Gong, Y.F.; Liu, J.C.; Gong, Z. Space charge effects on the bandwidth of Ge/Si avalanche photodetectors. Semicond. Sci. Technol. 2020, 35, 035026. [Google Scholar] [CrossRef]
  26. Zhang, J.; Lin, H.; Liu, M.; Yang, Y. Research on the leakage current at sidewall of mesa Ge/Si avalanche photodiode. AIP Adv. 2021, 11, 075320. [Google Scholar] [CrossRef]
  27. Masini, G.; Colace, L.; Assanto, G.; Luan, H.-C.; Kimerling, L.C. High-performance p-i-n Ge on Si photodetectors for the near infrared: From model to demonstration. IEEE Trans. Electron Devices 2001, 48, 1092–1096. [Google Scholar] [CrossRef]
  28. Huang, S.; Li, C.; Zhou, Z.; Chen, C.; Zheng, Y.; Huang, W.; Lai, H.; Chen, S. Depth-dependent etch pit density in Ge epilayer on Si substrate with a self-patterned Ge coalescence island template. Thin Solid Films 2012, 520, 2307–2310. [Google Scholar] [CrossRef]
  29. Wei, Y.; Cai, X.; Ran, J.; Yang, J. Analysis of dark current dependent upon threading dislocations in Ge/Si heterojunction photodetectors. Microelectron. Int. 2012, 29, 136–140. [Google Scholar] [CrossRef]
  30. Synopsys and Inc. Sentaurus Device User Guide Version H-2020.03; Synopsys: Mountain View, CA, USA, 2017. [Google Scholar]
  31. Caughey, D.M.; Thomas, R.E. Carrier mobilities in silicon empirically related to doping and field. Proc. IEEE 1967, 55, 2192–2193. [Google Scholar] [CrossRef]
  32. Ke, S.; Lin, S.; Mao, D.; Ji, X.; Huang, W.; Xu, J.; Li, C.; Chen, S. Interface State Calculation of the Wafer-Bonded Ge/Si Single-Photon Avalanche Photodiode in Geiger Mode. IEEE Trans. Electron Devices 2017, 64, 2556–2563. [Google Scholar] [CrossRef]
  33. Xu, Y.; Xiang, P.; Xie, X.; Huang, Y. A new modeling and simulation method for important statistical performance prediction of single photon avalanche diode detectors. Semicond. Sci. Technol. 2016, 31, 065024. [Google Scholar] [CrossRef]
  34. Ke, S.; Lin, S.; Mao, D.; Ye, Y.; Ji, X.; Huang, W.; Li, C.; Chen, S. Design of wafer-bonded structures for near room temperature Geiger-mode operation of germanium on silicon single-photon avalanche photodiode. Appl. Opt. 2017, 56, 4646. [Google Scholar] [CrossRef]
  35. Selberherr, S. Analysis and Simulation of Semiconductor Devices; Springer: New York, NY, USA, 1984. [Google Scholar] [CrossRef]
  36. Ando, H.; Kanbe, H. Effect of avalanche build-up time on avalanche photodiode sensitivity. IEEE J. Quantum Electron. 1985, 21, 251–255. [Google Scholar] [CrossRef]
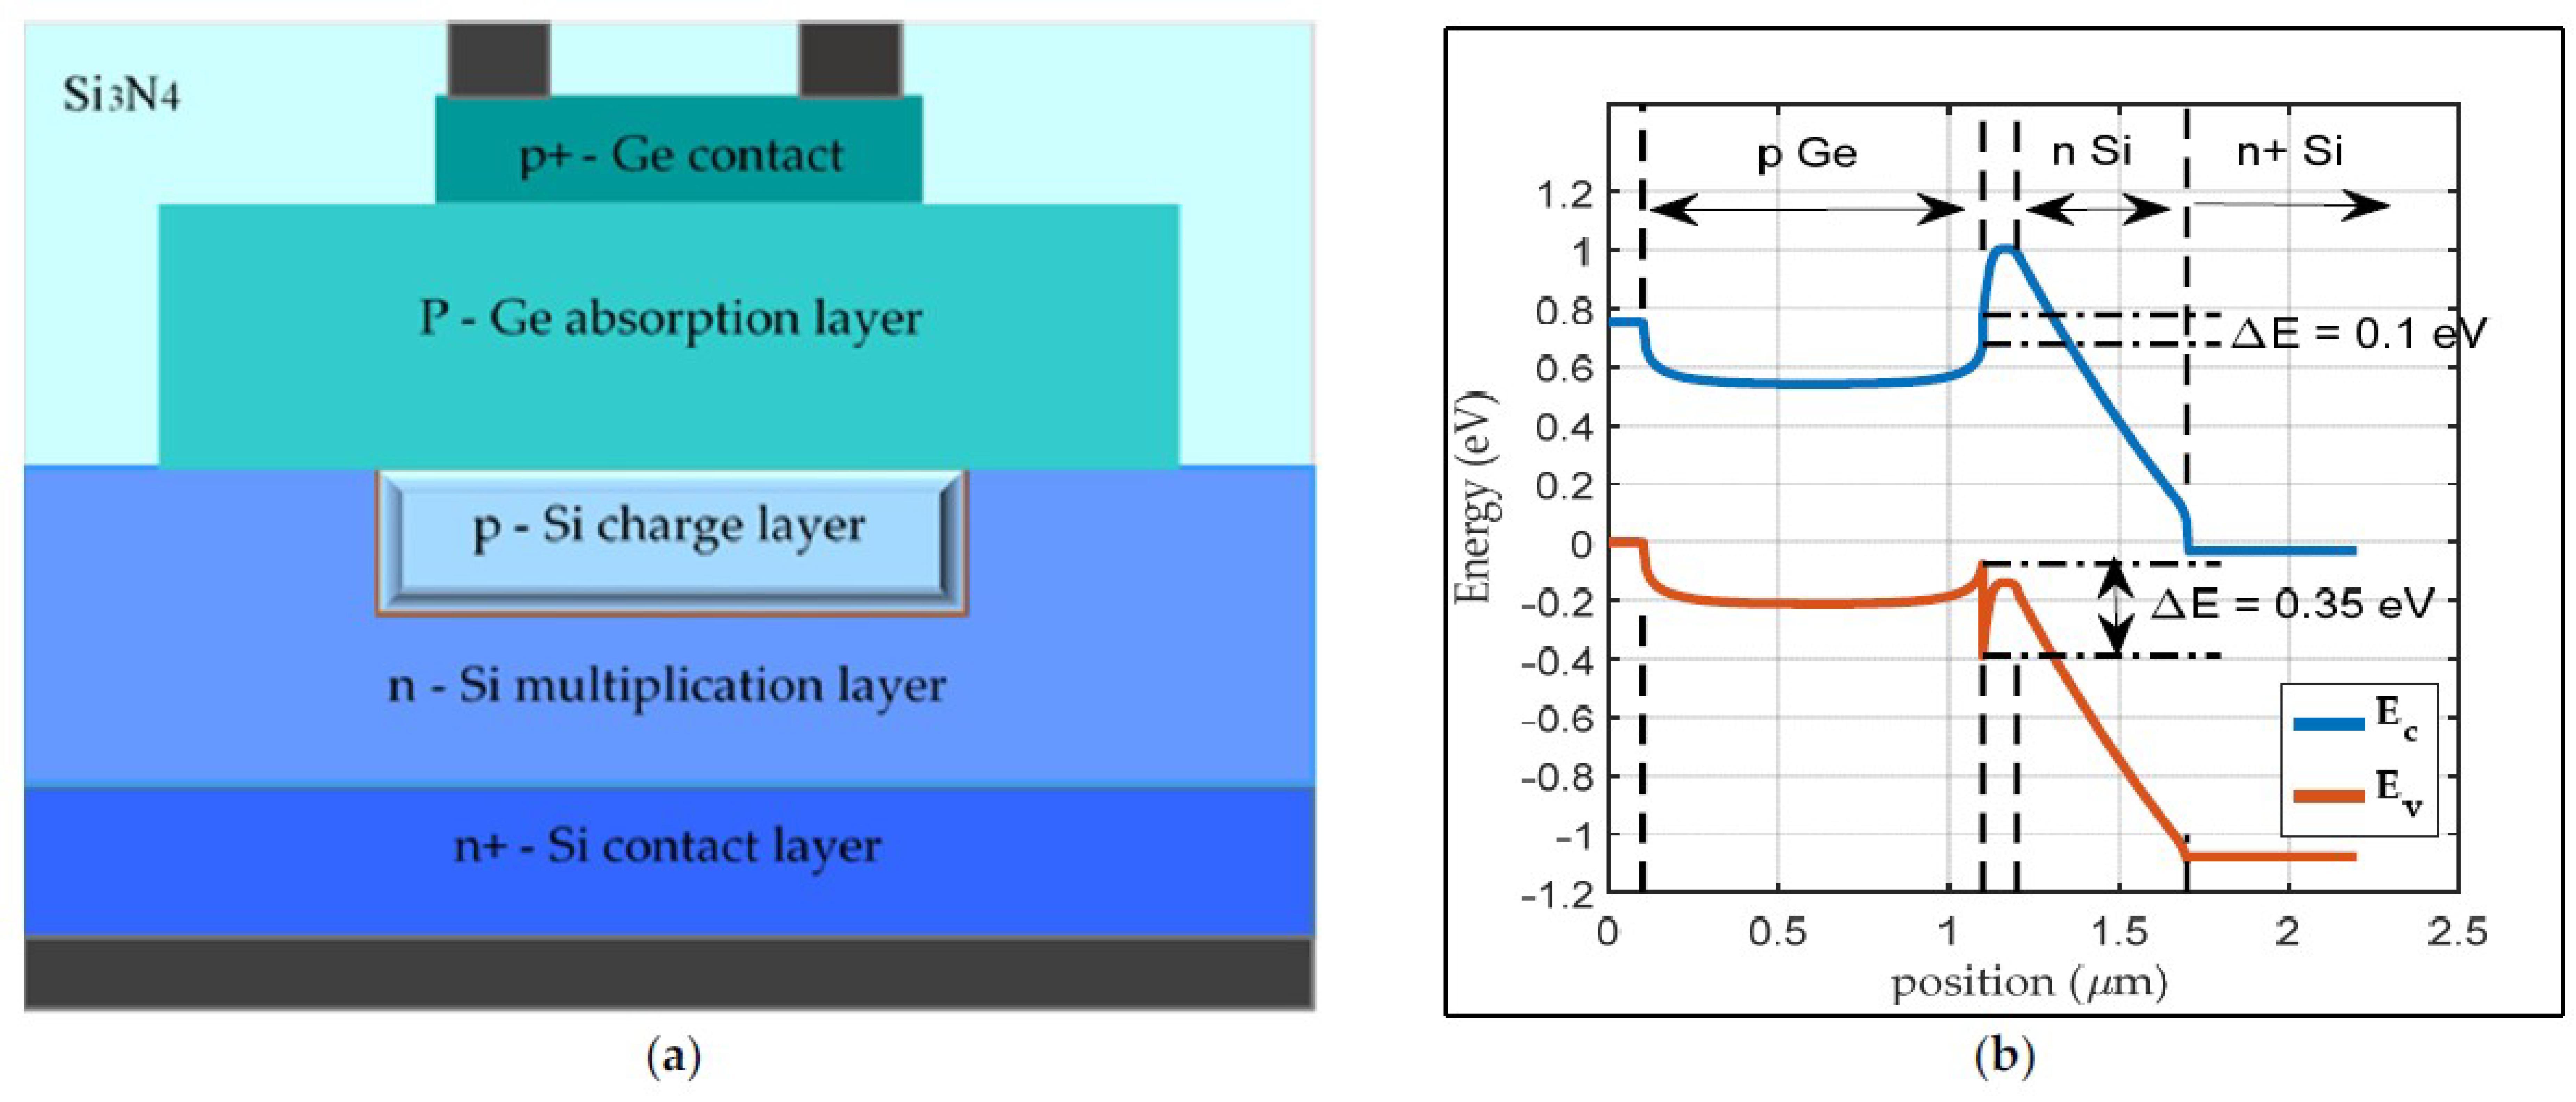
Figure 1. (a) The cross-sectional diagram of the Ge/Si APD; (b) band diagram of the center of the Ge/Si APD.
Inorganics 11 00303 g001
Figure 2. Dependence of the gain on the thickness of the multiplication layer versus the referenced bias voltage. The insets show the breakdown voltage and the electric field profile in the center of the devices at the respective breakdown voltages. Two different multiplication and absorption layer doping concentration densities were simulated: (a) 1 × 1015 cm−3; (b) 5 × 1015 cm−3.
Inorganics 11 00303 g002
Figure 3. Dependence of the bandwidth on the thickness of the multiplication layer versus referenced bias voltage. The insets show the drift velocity for the electrons ϑ e and for the holes ϑ h through the center of the devices at Vb-ref = −2 V. Two different multiplication and absorption layer doping concentration densities were simulated: (a) 1 × 1015 cm−3; (b) 5 × 1015 cm−3.
Inorganics 11 00303 g003
Figure 4. Dependence of the gain bandwidth product (GBP), responsivity (R), and quantum efficiency (QE) on the thickness of the multiplication layer versus referenced bias voltage. Two different multiplication and absorption layer doping densities were simulated: (a) 1 × 1015 cm−3; (b) 5 × 1015 cm−3.
Inorganics 11 00303 g004
Figure 5. Dependence of the internal quantum efficiency (QE) on the thickness of the multiplication layer versus wavelength at unity gain. Two different multiplication and absorption layer doping densities were simulated: (a) 1 × 1015 cm−3; (b) 5 × 1015 cm−3.
Inorganics 11 00303 g005
Figure 6. Dependence of gain on the thickness of the absorption layer versus referenced bias voltage. The insets show the breakdown voltage and the electric field profile through the center of the devices at the respective breakdown voltages. Two different multiplication and absorption layer doping concentration densities were simulated: (a) 1 × 1015 cm−3; (b) 5 × 1015 cm−3.
Inorganics 11 00303 g006
Figure 7. Dependence of the bandwidth on the thickness of the absorption layer versus referenced bias voltage. The insets show the drift velocity for the electrons ϑ e and for the holes ϑ h through the center of the devices at Vb-ref = –2 V. Two different multiplication and absorption layer doping concentration densities were simulated: (a) 1 × 1015 cm−3; (b) 5 × 1015 cm−3.
Inorganics 11 00303 g007
Figure 8. The dependence of the gain bandwidth product (GBP), responsivity (R), and internal quantum efficiency (QE) on the thickness of the absorption layer versus referenced bias voltage. Two different multiplication and absorption layer doping concentrations were simulated: (a) 1 × 1015 cm−3; (b) 5 × 1015 cm−3.
Inorganics 11 00303 g008
Figure 9. Dependence of the internal quantum efficiency (QE) on the thickness of the absorption layer versus wavelength at unity gain. Two different multiplication and absorption layer doping concentrations were simulated: (a) 1 × 1015 cm−3; (b) 5 × 1015 cm−3.
Inorganics 11 00303 g009
Table 1. Structural parameters of the Ge/Si APD related to the multiplication layer effect case study.
Layerp+-Gep-Gep-Sin-Sin+-Si
Thickness (µm)0.110.10.5; 0.75; 1; 1.25; 1.50.5
Doping concentration ( c m 3 ) 5 × 10 19 1 × 10 15 2 × 10 17 1 × 10 15 5 × 10 19
5 × 10 15 5 × 10 15
Table 2. Structural parameters of the Ge/Si APD related to the absorption layer effect case study.
Layerp+-Gep-Gep-Sin-Sin+-Si
Thickness (µm)0.10.5; 1; 1.5; 20.10.50.5
Doping Concentration ( c m 3 ) 5 × 10 19 1 × 10 15 2 × 10 17 1 × 10 15 5 × 10 19
5 × 10 15 5 × 10 15
Disclaimer/Publisher’s Note: The statements, opinions and data contained in all publications are solely those of the individual author(s) and contributor(s) and not of MDPI and/or the editor(s). MDPI and/or the editor(s) disclaim responsibility for any injury to people or property resulting from any ideas, methods, instructions or products referred to in the content.