Article

Synthesis and Characterization of Zn-Salophen Complexes with Different D–A Distances: An Approach to Tuning the Intersystem-Crossing Process

1
College of Materials Science and Opto-Electronic Technology, University of Chinese Academy of Sciences, Beijing 100049, China
2
Beijing National Laboratory for Molecular Sciences, College of Chemistry and Molecular Engineering, Peking University, Beijing 100871, China
*
Authors to whom correspondence should be addressed.
Inorganics 2024, 12(4), 108; https://doi.org/10.3390/inorganics12040108
Submission received: 26 February 2024 / Revised: 27 March 2024 / Accepted: 6 April 2024 / Published: 8 April 2024

Abstract

:
A series of novel zinc-salophen (salophen = N, N′-phenylenebis(salicylimine)) complexes (Zn-1–4) with electron donor–acceptor (D–A) structure were synthesized and characterized using a triphenylamine structure as the electron donor. Zn-salophen complexes with the same substituent sites have been reported to exhibit significant CT properties. The design of the D–A structure and the increase in the number of benzene rings to increase the length of bridging groups have led to a reduction in the energy difference between charge separation singlet and triplet states, resulting in the production of reactive oxygen species (ROS) under light irradiation. The ability has been enhanced (in terms of the production of singlet oxygen (1O2), compared with Zn-salophen, Zn-4 is 1.58 times higher). This method has been reported to enhance the intersystem crossing process of compounds, thereby enabling them to reach a triple excited state, but the generation of ROS has not been studied. Although the enhancement is not very significant, it has expanded the medical application prospects of these types of complexes and has provided a new strategy to enhance the production of ROS.

1. Introduction

Metallosalen/salophen (bis(salicylidene)ethylenediamine and bis(salicylidene)phenyldiamine) complexes have attracted considerable attention due to their versatile applications in catalysis [1,2,3,4,5,6,7,8,9,10], supramolecular chemistry [11,12,13,14,15,16,17,18], optical materials [19,20,21], and biological sensors or therapeutics [22,23] because of their rich chemistry and ease of manipulation of organic ligands. Among these complexes, zinc (II) salen/salophen complexes are of particular interest due to the non-redox nature and d10 closed-shell configuration of the Zn2+ ion, making them suitable for ligand-dependent fluorescent materials [24]. However, very few Zn-salen/salophen complexes have been found to generate reactive oxygen species (ROS), a capability which is essential to expanding their scope beyond fluorescence imaging to theranostics, a growing field of biomedical materials that combines imaging with therapeutics. Although charge transfer has been found in salophen complexes of various metals [25], currently only Saumi Ray et al. have synthesized zinc complexes with m-phenylenediamine and salicylaldehyde and found the presence of charge transfer. Cell experiments have demonstrated the production of ROS; compared with empty ligands, Zn complexes have a stronger ability to produce ROS [24]. This is due to the relatively weaker “heavy atom effect” associated with the zinc ion, resulting from the less pronounced spin–orbital coupling of this ion compared with the second and third transition metals. As a consequence, the photophysical properties and the reactivity of the excited states of Zn-salen/salophen complexes strongly depend on the nature and position of the substituents on the ligand skeleton. In this work, we report the design of Zn-salophen as fluorescent probes capable of generating reactive oxygen species (ROS).
Light irradiation of the photosensitizer (PS) to generate the triplet state with a high yield of intersystem crossing (ISC) is important for the sensitization of singlet oxygen (1O2) or a superoxide anion radical [26]. We design organic chromophore ligands with donor–acceptor (D–A) structures, in which an intramolecular A with intrinsic ISC property is used as a spin converter with a D, allowing the design of new triplet PSs without heavy atoms [27,28,29]. Tuning the charge separation between the highest occupied molecular orbital (HOMO) and the lowest unoccupied molecular orbital (LUMO) of different moieties helps reduce the electron–electron exchange energy and increase the population of the triplet state. Thus, the fabrication of D–A structures makes it possible to promote intersystem crossing and enhance the ability to sensitize oxygen. Hsien Hsin Chou et al. studied the different substitution sites and electron donor substituents of Zn-salophen and found that the charge separation properties of TPA-substituted complexes were more pronounced with the same substitution sites. However, under the same substitution group, the effect of para-substitution of C=N was more pronounced [30]. Our approach was to design and synthesize a series of Zn-salophen complexes (Zn-14) with D–A structures (Figure 1), varying the bridges of groups such as 1,4-phenyl or/and 2,7-fluorenyl between the electron donor (triphenylamine, TPA) and the electron acceptor (Zn-salophen) [31,32]. The aim was to increase the efficiency of oxygen photosensitization, which could be useful for biomedicine.

2. Results and Discussion

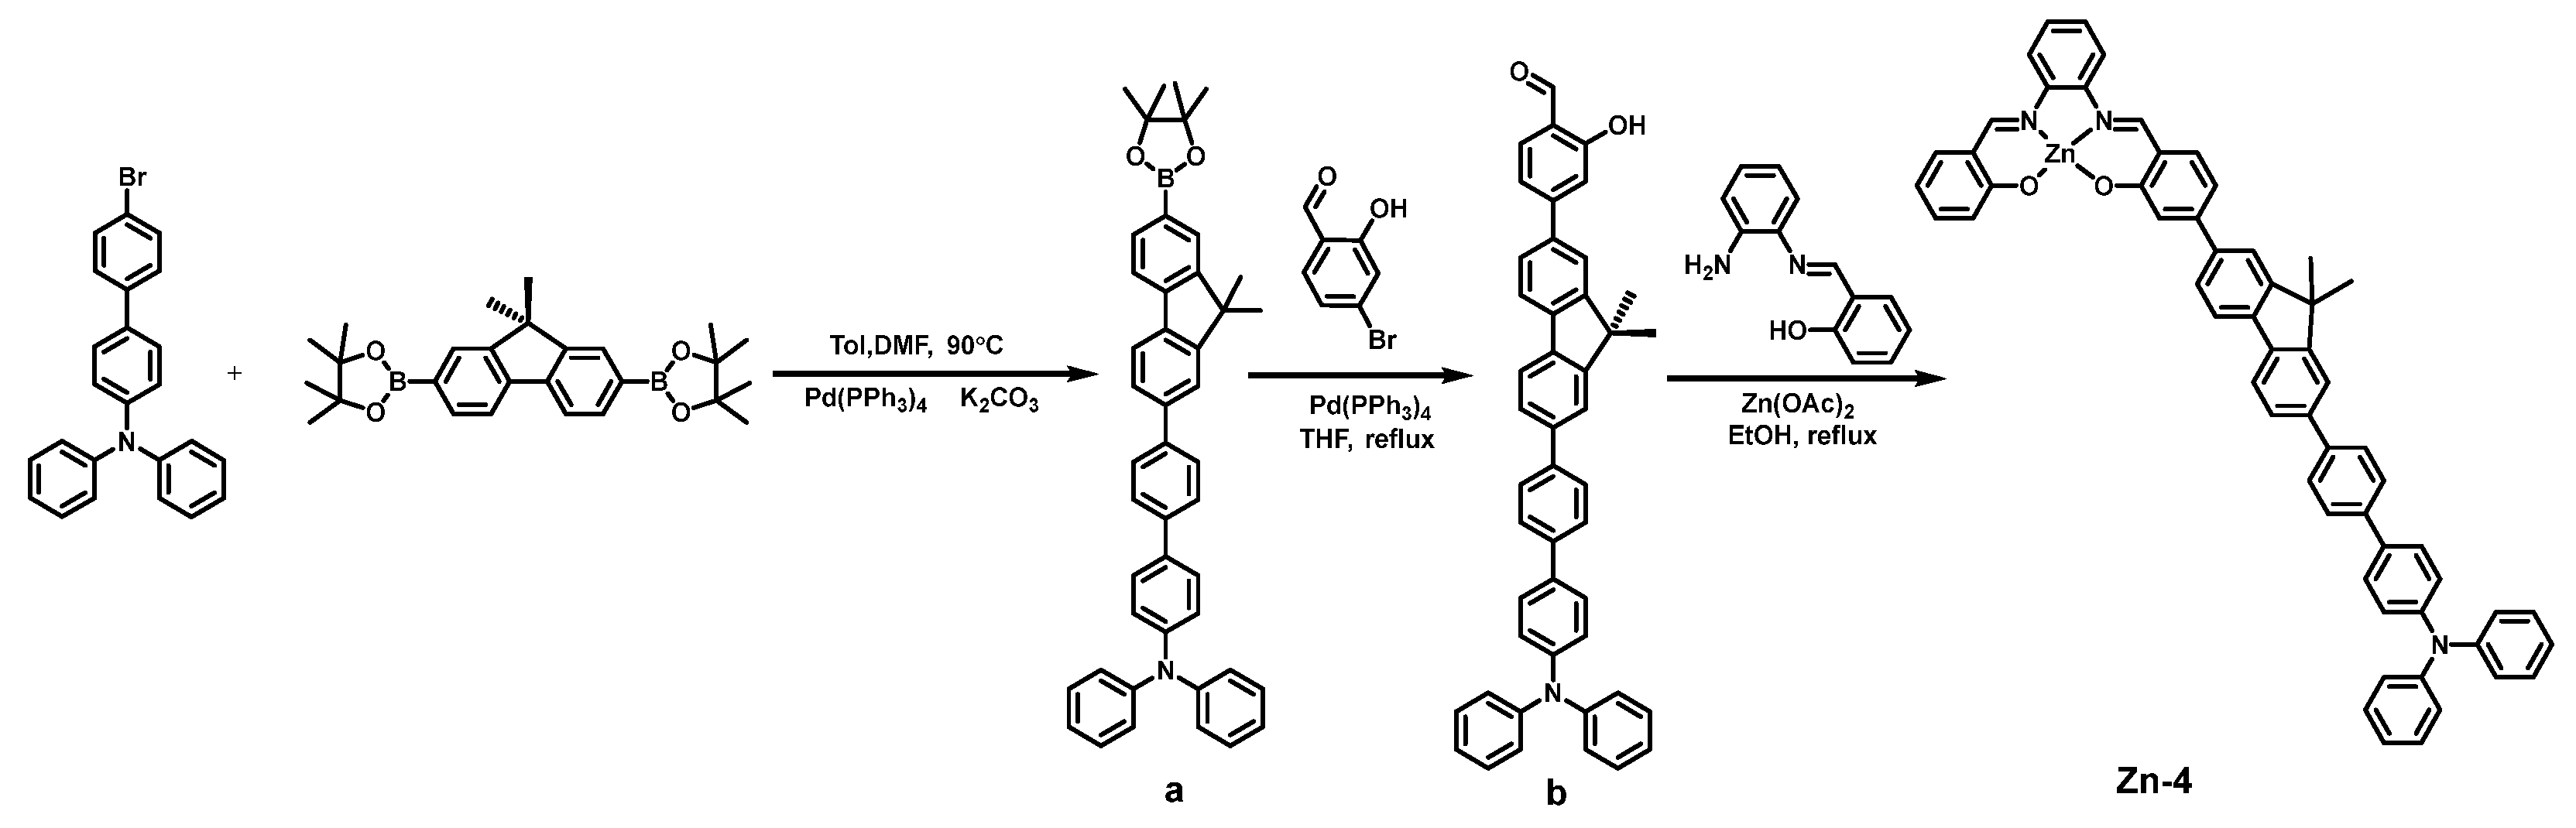
2.1. Synthesis and Characterization

We designed and synthesized a series of Zn-salophen complexes with D–A structures (Zn-14, Figure 1). The compounds were easily synthesized in two steps with good overall yields (40–90%) (Figure 2). The first step entailed Suzuki coupling reactions using 1.2–1.5 equivalents of arylboronic acid ester compounds in refluxed tetrahydrofuran in the presence of Pd(PPh3)4, giving 5-phenyl or/and 2,7-fluorenyl bridged salicylaldehydes in a 70–90% yield. Due to the air sensitivity of the catalyst, this first step needed to be carried out under nitrogen conditions. This step was then followed by condensation of 1,2-phenyl diamine and the corresponding salicylaldehydes in refluxed ethanol, which afforded Zn-14 after recrystallization in yields of 50–90% (Supplementary Materials).
Compounds Zn-14 were characterized by 1H NMR (Figures S1, S2, S6, S10, S14, S18, S22, S26, S30 and S34) and 13C NMR spectroscopies (Figures S3, S7, S11, S15, S19, S23, S27, S31 and S35), high-resolution mass spectrometry (HRMS) (Figures S4, S8, S12, S16, S20, S24, S28, S32 and S36), and Fourier transform infrared (FTIR) spectroscopy (Figures S5, S9, S13, S17, S21, S25, S29, S33 and S37). In the mass spectra, peaks were found at m/s = 680.15, 698.17, 848.18, and 889.49, corresponding to [Zn-1+AcOH-H], [Zn-2+H]+, [Zn-3+HCl-H], and [Zn-4], respectively. The complexes exhibited a certain solubility in dimethyl sulfoxide (DMSO, Tianjin, China). As the distance between D and A increased, the solubility of the complexes in DMSO decreased. The dissolution of the complexes could be promoted by adding a small amount of pyridine, which may have been related to the aggregation and depolymerization of the complexes in pyridine.

2.2. NMR Spectroscopy

The 1H NMR spectrum of the Zn-14 complexes in DMSO-d6 shows that, for Zn-1, the single peak in the low field region of 9.03 and 9.02 ppm is H on the carbon atom in C=N, while the hydroxyl and aldehyde peaks of its precursor 1a disappear at 10.86 and 10.23 ppm, indicating the formation of the zinc complex. For Zn-2 at 9.07 and 9.03 ppm, the hydroxyl and aldehyde peaks disappeared at 10.87 and 10.27 ppm; for Zn-3 at 9.09 and 9.04 ppm, they disappeared at 11.15 and 9.94 ppm; and for Zn-4 at 8.72 and 8.70 ppm, the peaks disappeared at 11.16 and 9.94 ppm. These data support the synthesis of the complex. 13C NMR is well supported by 1H NMR spectral data.

2.3. FTIR Spectroscopy Studies

The Fourier transform infrared spectrum of the complexes shows that there is no vibration of aldehyde groups near 1660 cm−1 in the spectrum, with a peak located at 1610 cm−1 (assigned to C=N stretching). C-H stretching at N=C-H is around 2950 cm−1, and some peaks in the wavelength range of 550–700 cm−1 indicate the presence of Zn-O and Zn-N stretching. These facts determine the coordination between the nitrogen of the aldehyde imine group and the oxygen of the phenolic hydroxyl group of the ligand with the zinc metal center, thus supporting the formation of Zn (II) salophen complexes (Table 1).

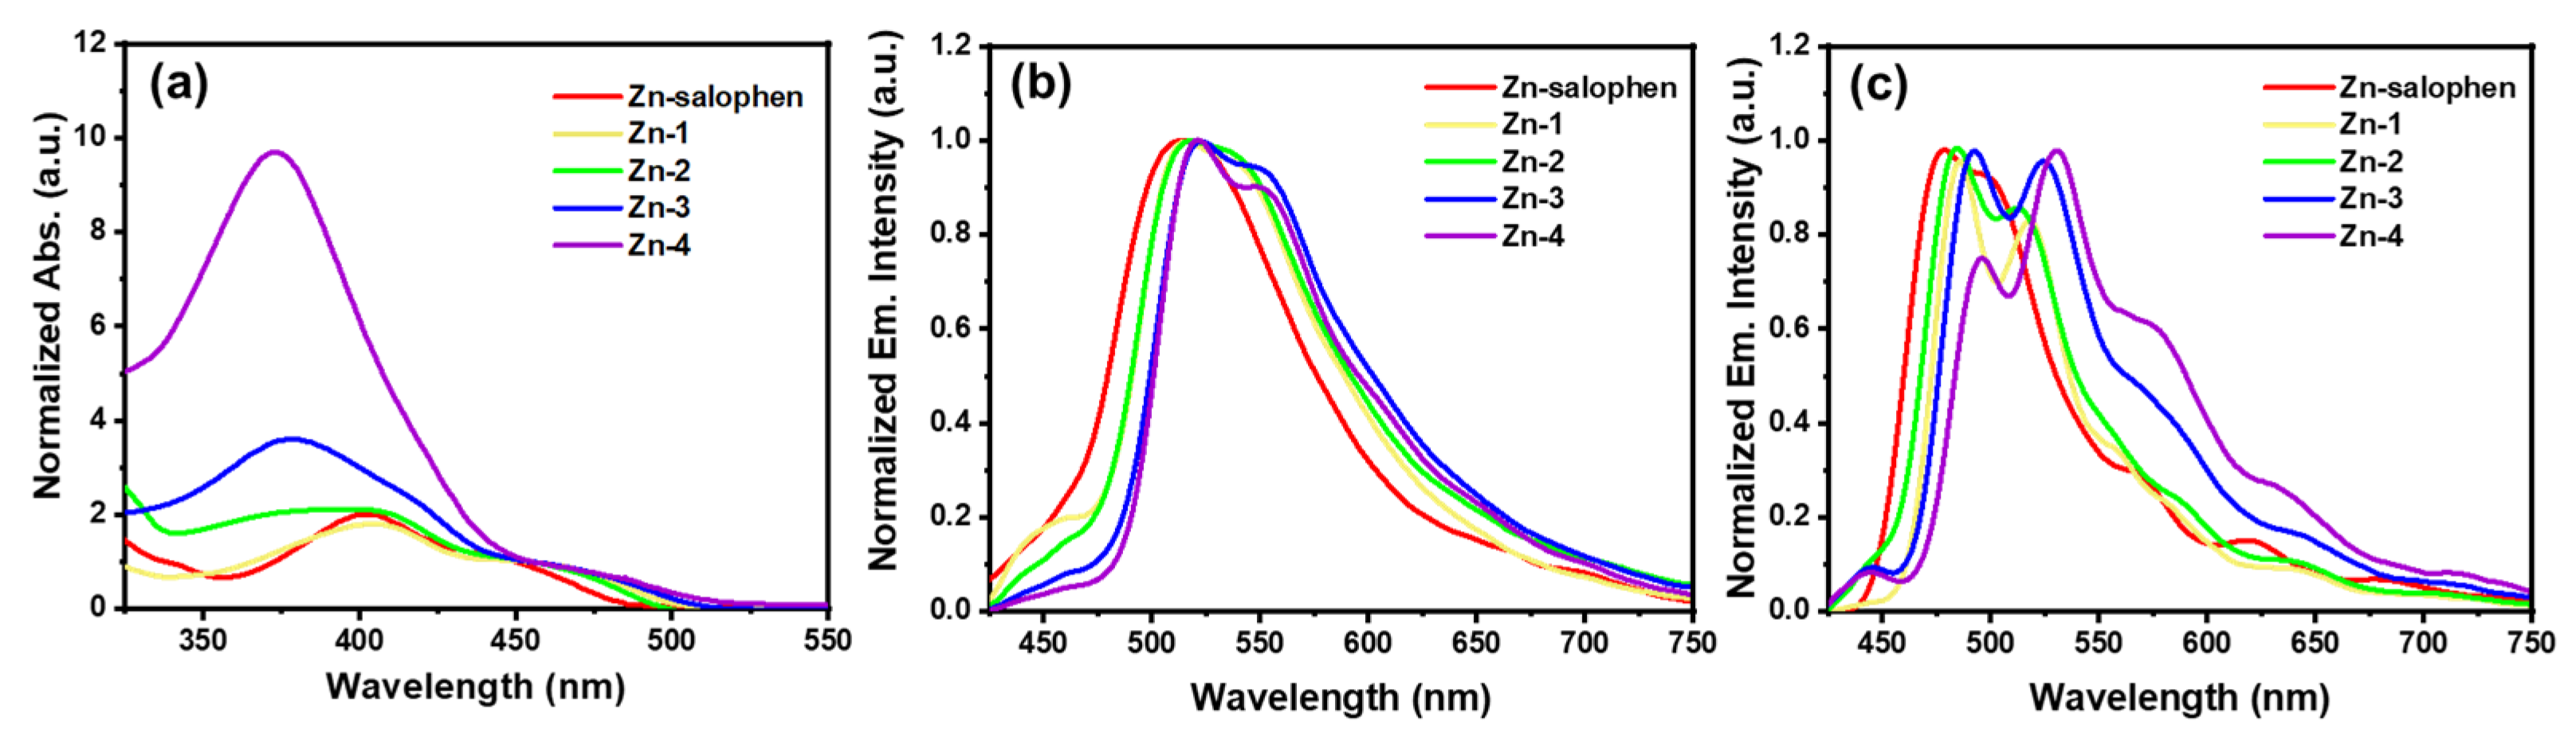
2.4. Absorbance and Emission

The UV–vis absorption and emission spectra for Zn-14 are shown in Figure 3, and relevant optical data are given in Table 2. The absorption spectra were measured in dimethyl sulfoxide (DMSO) due to better solubility compared with the commonly used solvents such as dichloromethane (CH2Cl2) and tetrahydrofuran (THF). Zn-14 exhibited similar absorption with an absorption peak at 370~405 nm and another peak centered at 455 nm. The high-energy region of the spectrum (370~405 nm) of Zn-24 showed a significant blueshift concerning those of Zn-1, which gradually increased the extinction coefficients (logε = 4.65, 4.61, 4.92, and 4.72 M−1 cm−1) with the lengths of the bridge groups increasing (Figure S38 and Table S1). These transitions are ascribed to π-π* transitions localized predominantly on the Zn-salophen, which aligns with similar bands observed for other previously reported bridge groups [34]. Next, the small redshift in the charge transfer (CT) band (482–488 nm) of Zn-24 concerning the bands on Zn-1, which are part of the principal CT band centered at 480 nm, indicates that the increased donor strength of the diphenylamino group nevertheless narrows the energy gap between D and A, which is supported by the calculation of the HOMO-LUMO gap (ΔEHOMO-LUMO) that decreases with the increasing distance between D and A, except for Zn-3 (Figure S39).
Determination of the extinction coefficient indicates that the absorption of Zn-salophen occurred at 400 nm and as the bridge group increased. Compared with 450 nm, the absorption at 370 nm increased and the absorption peak exhibited a blueshift, reflecting the influence of the bridging group on absorption. Two inseparable emission peaks at 500~520 nm and 540~555 nm occurred in the emission spectra. As the length of the bridge group increased, there was a redshift at the emission peak. Such spectral changes may suggest the effects of bridge substitutions that result in charge transfer. Unlike the emission peaks at a low temperature (77 K) where the suppression in vibration at low temperature occurred, the emission peaks at room temperature (RT) showed a significant redshift and broadening compared with 77 K. No emission peaks with a long lifetime (>10 ns) were detected. Compared with Zn-salophen, Zn-14 showed redshifts of the emission peaks as the donor–acceptor distance increased (Figure 3c).
The lifetimes for the emission (centered at 520~555 nm) and the tail of emission (centered at 650~680 nm) were measured and summarized in Table 2. In addition to the first two shorter lifetime components, like those at the short wave (520~555 nm), there was also a longer third lifetime component at the long tail wave (650~680 nm). When the distance between the donor and acceptor increased from Zn-1 to Zn-4, the first component of lifetimes for the emission centered at 550 nm decreased from 52.98 to 3.13%, while the second component increased from 47.02% to 96.87%. Similarly, for the tail of emission (measured at 680 nm), the second component of lifetimes increased from 40.50% to 89.28%, resulting in the slower total fluorescence decay (Figure S39a). The first component of lifetimes was the fluorescence of the locally excited singlet state (1LE) returning to the ground state, while the second component of lifetimes was the fluorescence of the singlet charge-separated state (1CS) returning to 1LE through charge recombination and ultimately returning to the ground state.

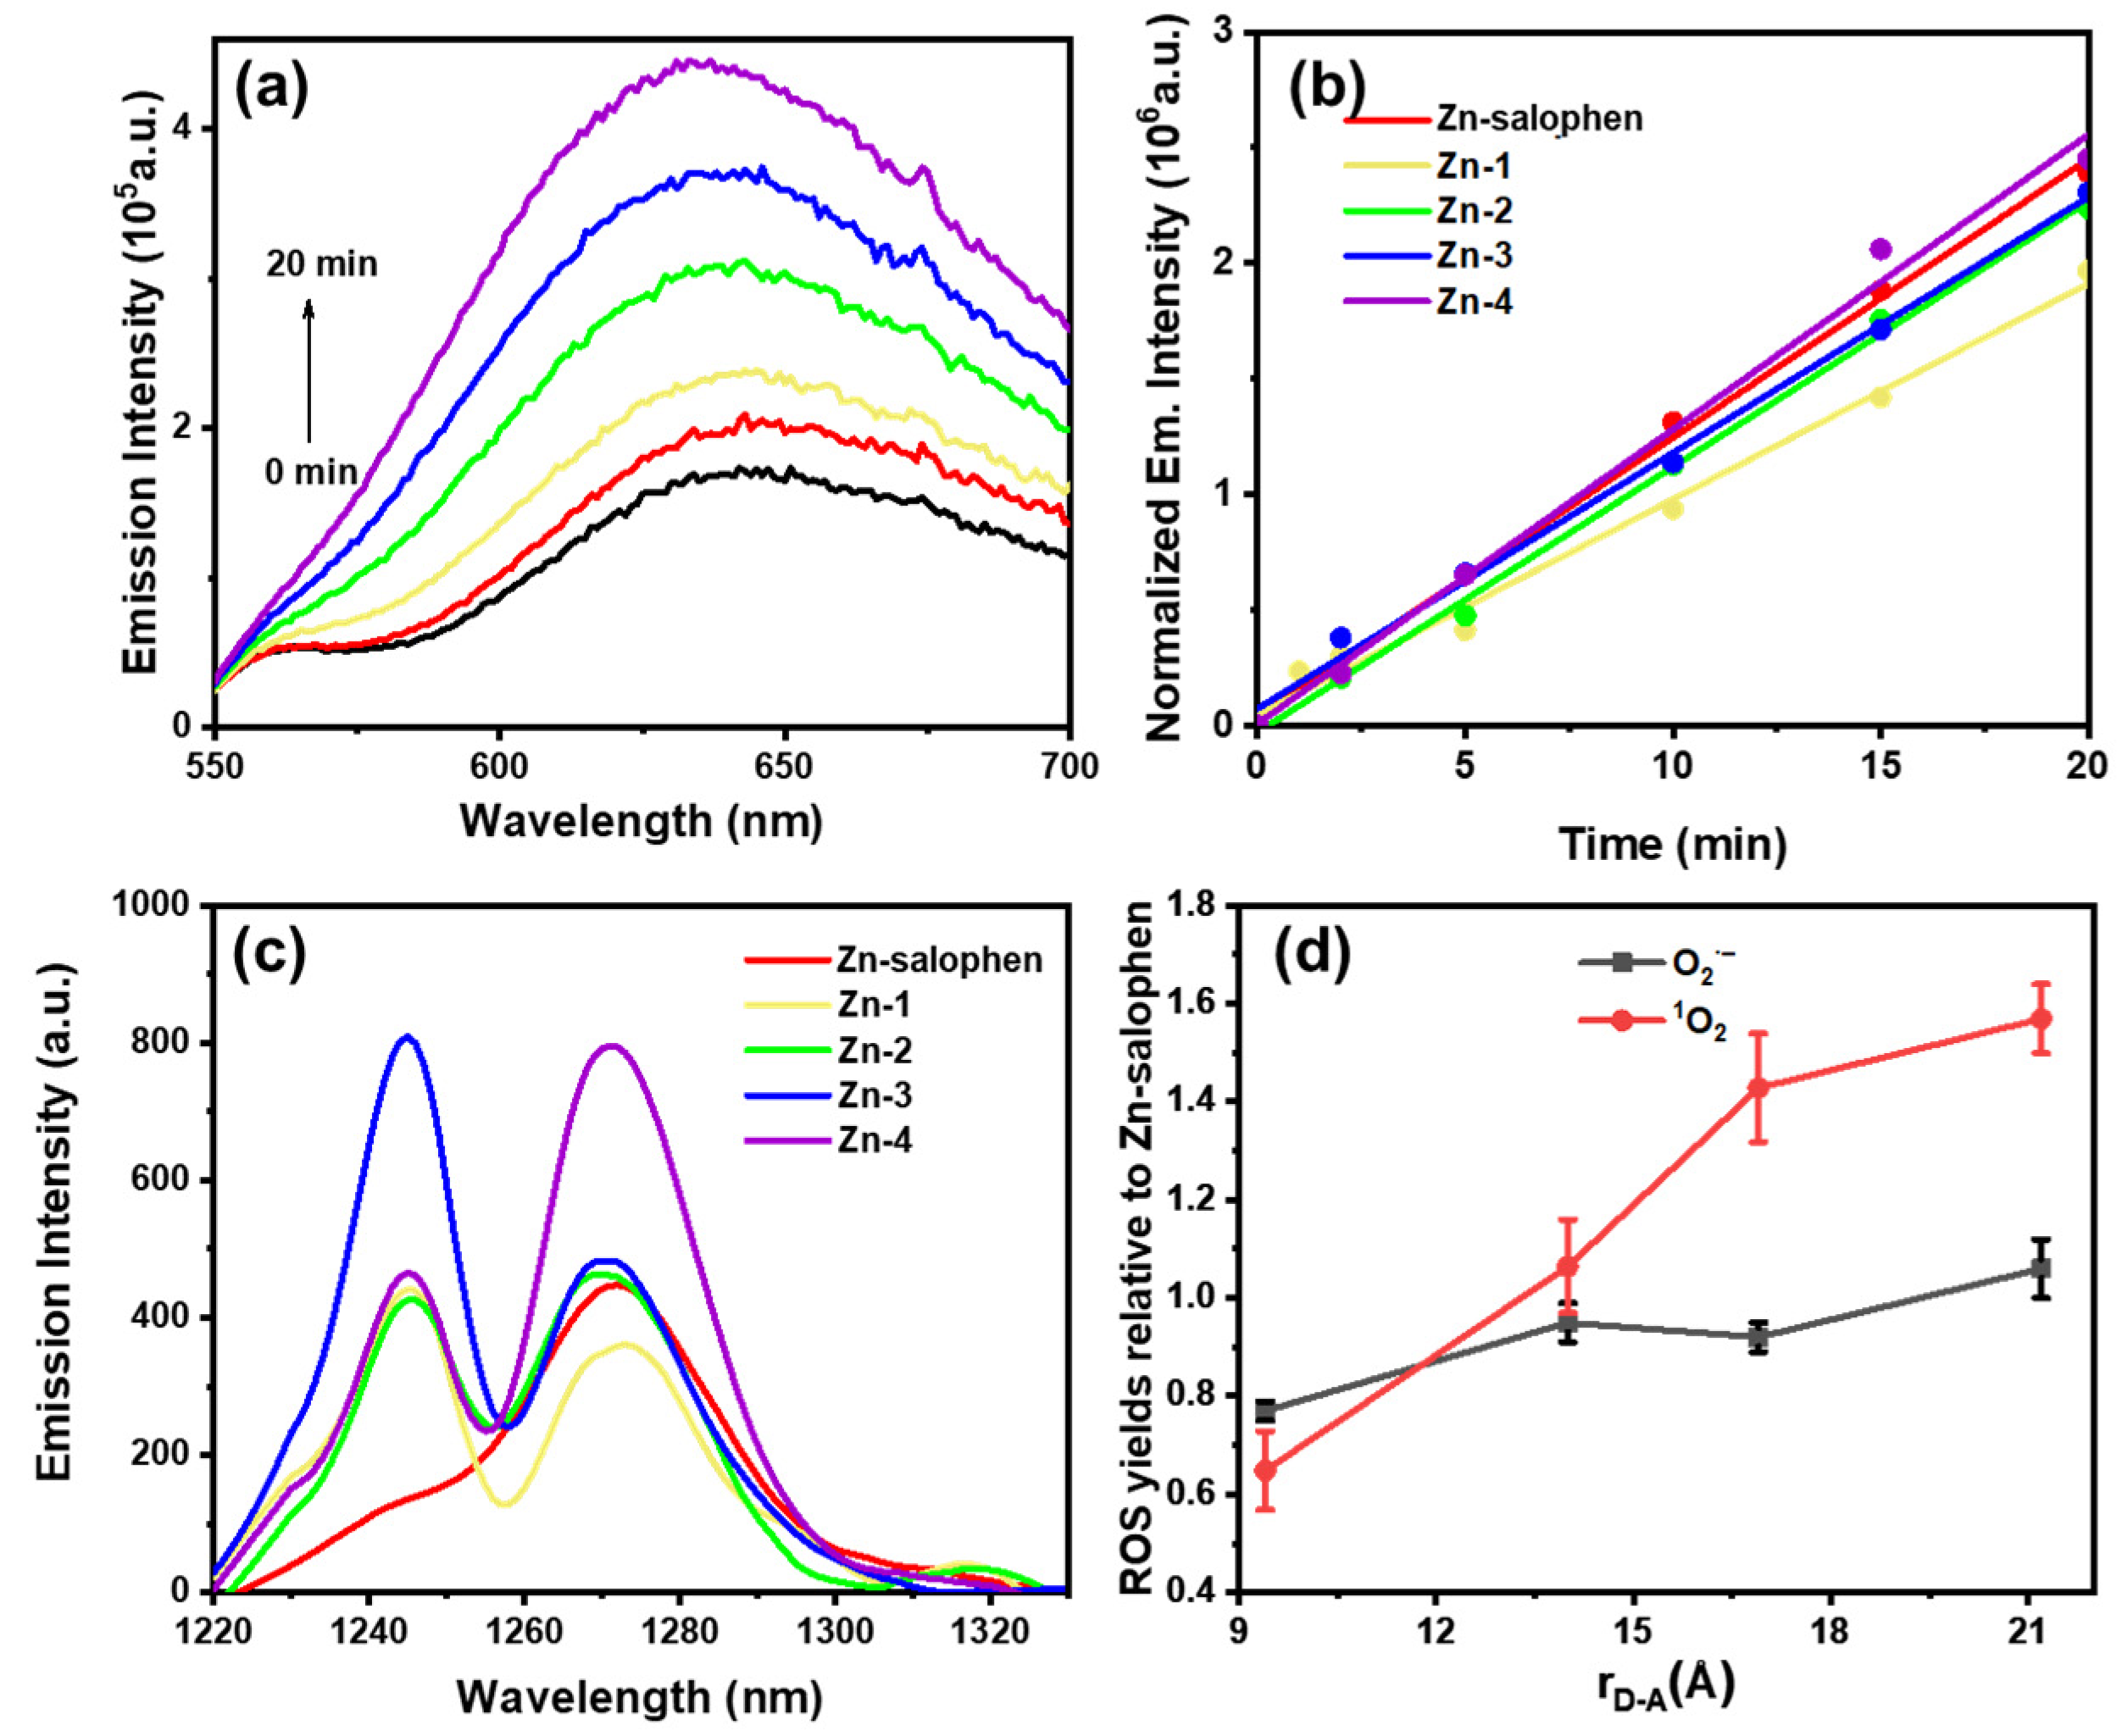
2.5. Air Quenches Emission

To investigate the possible quenching of oxygen, we compared the emission of Zn-salophens (Zn-14) in the presence/absence of air. As shown in Figure 4, Zn-3 and Zn-4 exhibit air-sensitive emission, and Zn-4 showed half the emission intensity under air than under nitrogen conditions. We found that as the distance between D and A increased, the air quenching effect became more pronounced. The lifetime under nitrogen conditions also differs from that in air (Table S2). As shown in Figure 5a, the proportions of short lifetime (Rel1%) under air and nitrogen conditions can be fitted to the donor–acceptor distances (rD-A); the proportion of short lifetime components decreases along with the increasing distances between D and A, and the proportion of short lifetime components in the air is larger. Under nitrogen conditions, good exponential fitting was obtained; in air, however, the fitting was not good. The physical significance of each fitting parameter needs to be explored (Figure 5b).

2.6. Reactive Oxygen Species (ROS)

To verify the generation of reactive oxygen species, for type I ROS, we used a fluorescent probe DHE to detect superoxide anions (O2·), which shows the fluorescence changes when DHE reacts with O2· within 20 min in ethanol solution (Figure 6a). The fluorescence intensity time was plotted and fitted at 610 nm in order to obtain the relative quantum yield of O2· for Zn-14, using Zn-salophen as a reference (Figure 6b). The result is the average of three statistical tests. Compared with Zn-salophen, the ratio of producing O2· in Zn-14 was determined. As the distance between D and A increased, the relative quantum yield of super oxide anions gradually increased from 0.77 to 1.06. This may reflect that the energy gap between the singlet charge-separated state and the triplet charge-separated state decreased as the bridging group increased, making the ISC process more likely to occur and promoting O2· production (Figure 6d and Table 3).
For type II ROS, by utilizing the characteristic emission of singlet oxygen at 1270 nm, the singlet oxygen (1O2) quantum yields of Zn-salophen and Zn-14 were measured in trichloromethane (Figure 6c) using tetraphenylporphyrin (TPP) as a reference (Table 3). The emission peak at 1240 nm may be referred to as the frequency multiplication of zinc complex luminescence since there are emission peaks at approximately 620 nm at 77 K. The quantum yield of 1O2 for Zn-1 is lower than that of Zn-salophen. It was observed that when the bridging group increased, the ability of Zn-14 to produce 1O2 was enhanced; the quantum yield of 1O2 increased from 1.2% to 3.0%; and Zn-4 was 1.58 times that of Zn-salophen—which is consistent with the results of the air quenching effect on emissions.
The relative quantum yield of 1O2 and the distance between D and A were plotted (Figure 6d), and the results showed that as the bridging group increased, the ability of Zn-14 to sensitize oxygen to produce O2· and 1O2 was enhanced. The changes in the quantum yield of 1O2 were more significant than those of the superoxide anion. As the distance between D and A increased, the triplet CS state become more stable, and the ability to sensitize oxygen was enhanced.
Based on the experimental results, we conclude that Zn-14 in their ground states are excited to form a locally excited singlet state (1LE), which undergoes a photoinduced electron transfer to form a singlet charge-separated state (1CS). Due to the generation of the charge-separated state, the energy gap between the singlet state and triplet state is decreased [32]. Some parts of the 1CS undergo an ISC process to form a triplet charge-separated state (3CS) and ultimately interact with oxygen to produce ROS, while another part undergoes charge recombination to return to the 1LE and returns to the ground state in the form of fluorescence. This process may be related to RP-ISC. Previous studies on the ISC process in charge transfer (CT) excited states showed us that the triplet formation could undergo a radical-pair intersystem crossing (RP-ISC) mechanism in donor–acceptor (D–A) molecules, which required rapid formation of a radical pair upon charge separation and occurred through quantum mechanical mixing of the singlet and triplet state under hyperfine coupling effects [35]. As the distance between the electron donor and acceptor increases, the energy gap between 1CS and 3CS decreases, making ISC more likely to occur and the quantum yield of ROS to increase (Figure 7).

3. Materials and Methods

All reagents were commercially purchased with a purity ≥97% (Bide Pharmatech Ltd., Shanghai, China and Konoscience, Beijing, China). Commonly used solvents purchased from Concord Technology (Tianjin, China). The use of boric acid or boric acid ester compounds was 1.2–1.5 equivalent, and the dissolution of 2,2′-(9,9-Dimethyl-9H-fluorene-2,7-diyl) bis(4,4,5,5-tetramethyl-1,3,2-dioxaborolane) required the addition of a small amount of DMF in toluene. Based on different solubility, the compound characterization of 1H NMR was performed using a 400 M nuclear magnetic resonance spectrometer (Fällanden, Switzerland), while a 400 M or 600 M nuclear magnetic resonance spectrometer was selected for 13C NMR (Fällanden, Switzerland). Fourier transform infrared spectroscopy (FTIR) was measured using a Spotlight200 Fourier transform infrared spectrometer in the range of 4000–400 cm−1, with 2200 cm−1–1800 cm−1 being the inherent noise of the instrument—which was artificially removed; a wavenumber accuracy of ≤0.4 cm−1 was obtained (PerkinElmer, Waltham, MA, USA). Mass spectrometry was characterized using a Bruker Solarix XR FTMS (Fourier Transform Ion Cyclotron Resolution Mass Spectrometer, Karlsruhe, Germany).

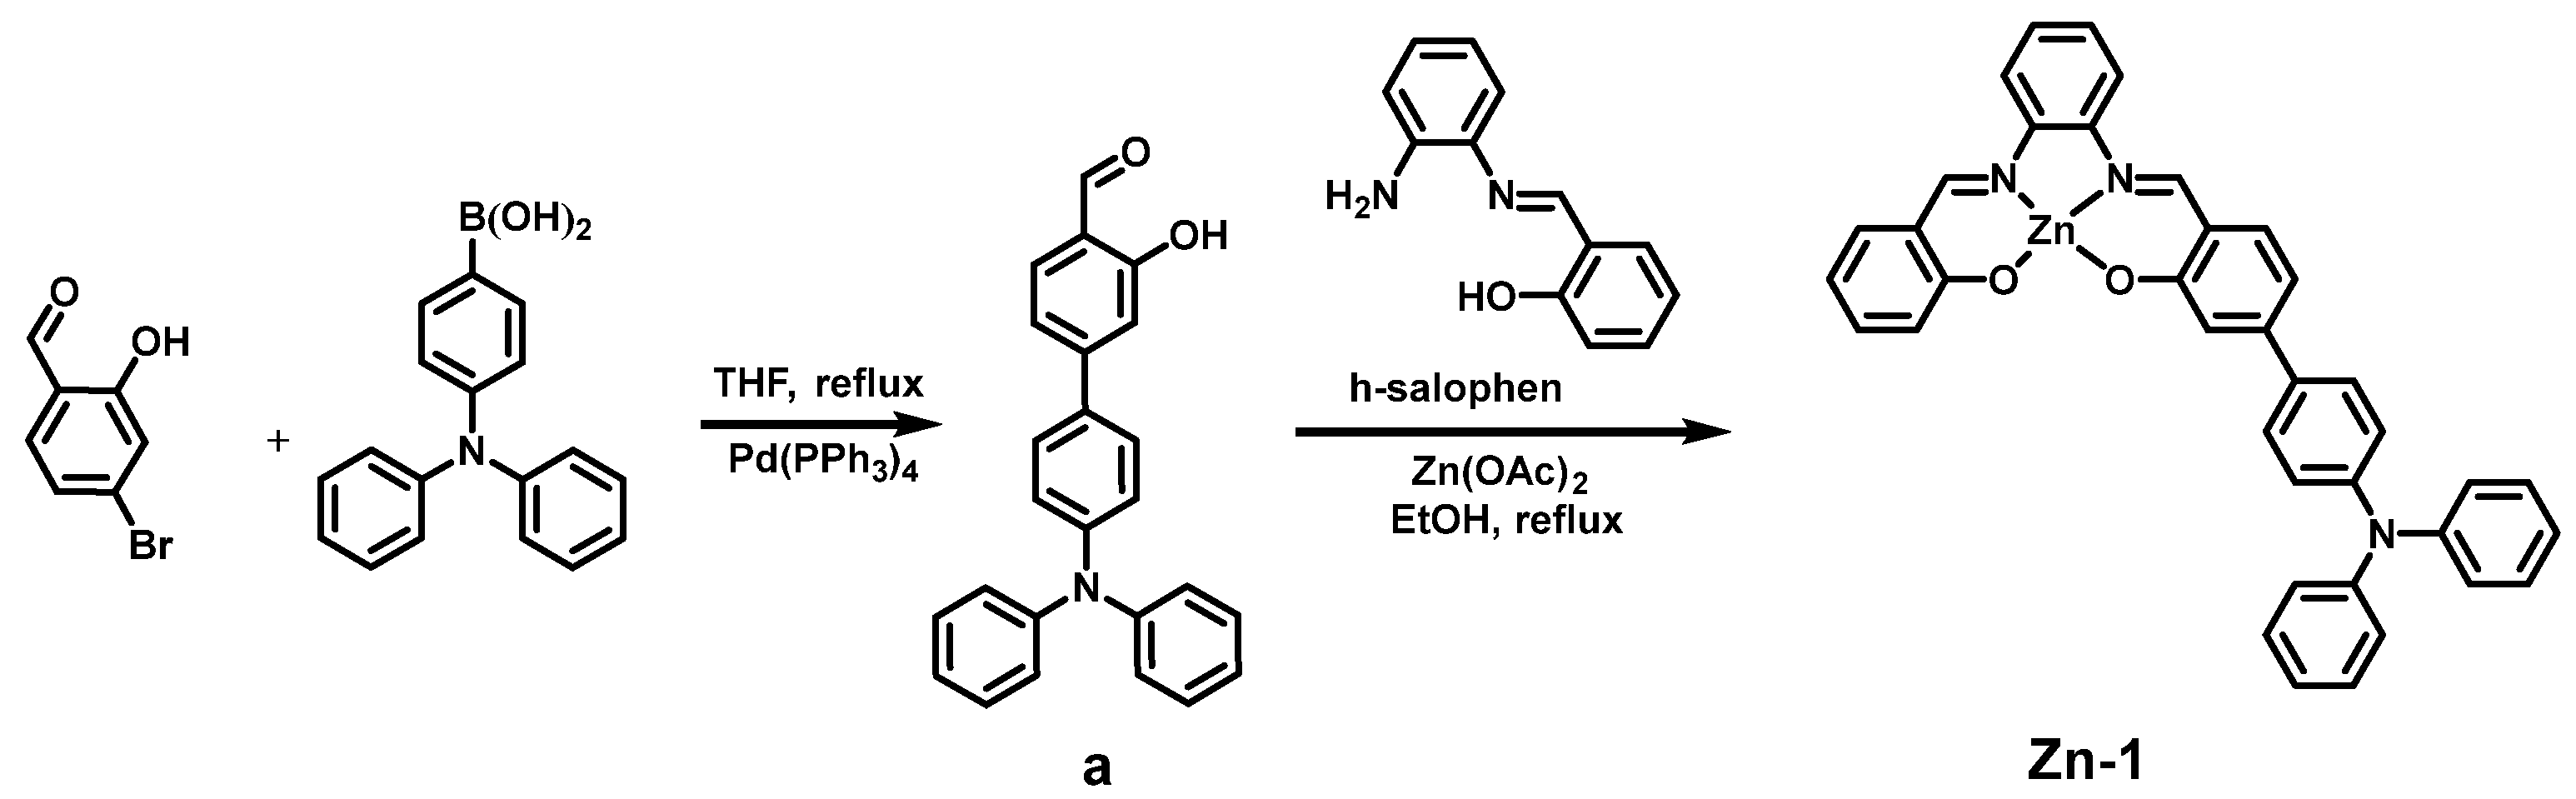
3.1. Synthesis of Zn-1

A quantity of 5 mL toluene was mixed with 330 μL Na2CO3 aqueous solution (2 mol L−1) as solvent, and triphenylamine 4-boric acid (173.48 mg 0.6 mmol), 4-bromo-2-hydroxybenzaldehyde (100.51 mg 0.5 mmol), phase transfer catalyst: tetrabutylammonium bromide (TBAB) (80 mg), and catalyst: tetrakis (triphenylphosphine) palladium (Pd(PPh3)4) (10 mg) were added together to a Schlenk tube (Figure 8). Three repetitions of air exchanges with nitrogen under the cryogenic liquid nitrogen cooling were performed. Afterwards, the prepared solution was placed in a dark place at 80 °C and allowed to react overnight. The solvent was evaporated under reduced pressure and extracted three times with DCM and saturated salt water. The organic phase was collected and passed through a silica gel column with PE:DCM = 4:1 (v/v). The yellow product a was collected and dried, producing a yield of 168.37 mg (92.15%). 1H NMR (400 MHz, DMSO-d6) δ 10.86 (s, 1H), 10.23 (s, 1H), 7.72 (d, J = 8.2 Hz, 1H), 7.63 (d, J = 8.7 Hz, 2H), 7.36 (t, J = 7.8 Hz, 4H), 7.26 (d, J = 8.3 Hz, 1H), 7.22 (s, 1H), 7.11 (m, 6H), 7.03 (d, J = 8.6 Hz, 2H).
Ethanol (5 mL) as a solvent, a (18.28 mg 0.05 mmol), h-salophen [36] (10.62 mg 0.05 mmol), and zinc acetate (11.75 mg 0.06 mmol) were added to a Schlenk tube, and the reaction was carried out overnight at 82 °C. After reaction, the solid was obtained by centrifugation, recrystallized with ether three times, and dried to obtain the yellow product Zn-1, producing a yield of 26.88 mg (80.68%). 1H NMR (400 MHz, DMSO-d6) δ 9.03 (d, J = 5.2 Hz, 2H), 7.91 (dd, J = 5.0, 2.6 Hz, 2H), 7.68 (d, J = 8.7 Hz, 2H), 7.48 (d, J = 8.4 Hz, 1H), 7.45–7.28 (m, 7H), 7.27–7.22 (m, 1H), 7.16–6.96 (m, 9H), 6.85 (dd, J = 8.3, 1.7 Hz, 1H), 6.71 (d, J = 8.4 Hz, 1H), 6.52 (t, J = 6.9 Hz, 1H), 1.80 (s, 3H). 13C{1H} NMR (101 MHz, DMSO-d6) δ 172.66, 163.25, 162.50, 147.78, 147.42, 145.36, 139.95, 139.80, 137.24, 136.70, 134.78, 133.74, 130.13, 128.16, 127.75, 127.60, 124.89, 123.93, 123.57, 123.18, 120.03, 119.95, 118.92, 116.94, 116.86, 113.48, 112.09. IR (cm−1): 3058.55 (Ar C-H), 2911.99 (H-C=N), 1610.27 (C=N), 1579.41 (Ar C=C), 1498.42 (Ar C=C), 1428.99 (Ar C=C), 1297.86 (C-O), 752.10 (Ar C-H), 696.18 (Ar C-H). MS (ESI-, DMSO-d6): m/z calcd for C38H27N3O2Zn (+AcOH 681.16), found 680.15450 ([M − H]). The amount (wt%) of zinc metal in the Zn-14 was determined by atomic absorption spectroscopy (AAS); zinc (wt%): 8.35%.

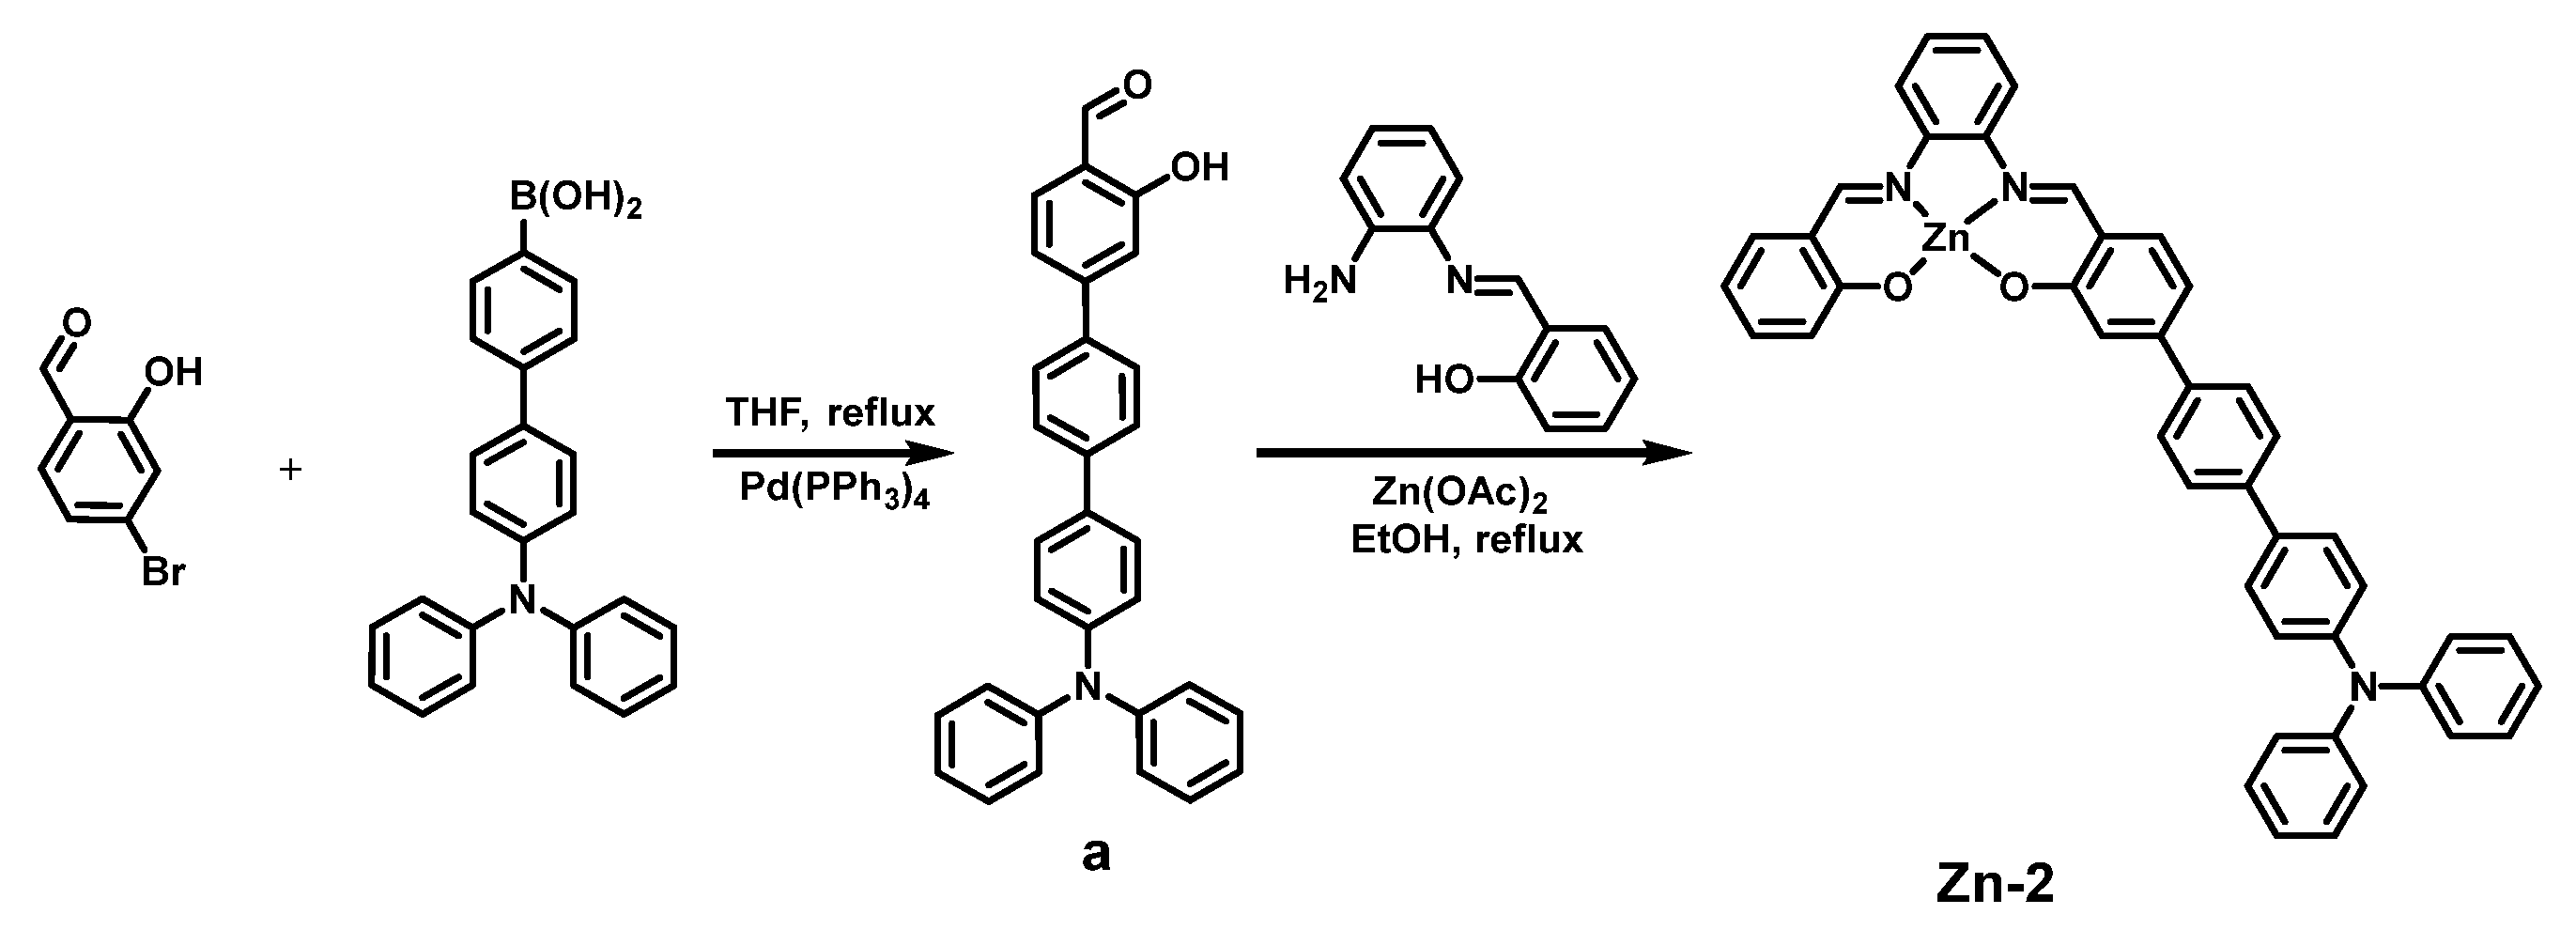
3.2. Synthesis of Zn-2

Reference 1a for the synthesis process of 4-(diphenylamino) phenylboronic acid (119.75 mg 0.33 mmol), 4-bromo-2-hydroxybenzaldehyde (65.91 mg 0.33 mmol), TBAB (40 mg 0.12 mmol), and catalyst: Pd(PPh3)4 (50 mg 0.04 mmol) (Figure 9). The solvent was evaporated under reduced pressure and extracted three times with DCM and saturated salt water. The organic phase was collected and pass through a silica gel column with PE:DCM = 2:1 (v/v). The yellow product a was collected and dried, producing a yield of 137.00 mg (94.63%). 1H NMR (400 MHz, DMSO-d6) δ 10.87 (s, 1H), 10.27 (s, 1H), 7.77–7.75 (m, 5H), 7.68 (d, J = 8.0 Hz, 2H), 7.36–7.32 (m, 5H), 7.30 (s, 1H), 7.11–7.05 (m, 8H). 13C{1H} NMR (101 MHz, DMSO-d6) δ 191.71, 161.36, 147.85, 147.57, 147.44, 147.04, 140.33, 137.49, 133.37, 130.13, 128.08, 127.93, 127.19, 124.80, 123.89, 123.53, 121.71, 118.38, 115.11, 99.98. MS (ESI+, DMSO-d6): m/z calcd for C31H23NO2 (441.17), found 442.18006 ([M + H]+).
Ethanol (7 mL) as a solvent, a (60 mg 0.14 mmol), h-salophen (32 mg 0.15 mmol), and zinc acetate (32.92 mg 0.15 mmol) were added to a Schlenk tube, and the reaction was carried out overnight at 82 °C. After reaction, the solid was obtained by centrifugation, recrystallized with ether three times, and dried to obtain the yellow product Zn-2, producing a yield of 88.26 mg (90.17%). 1H NMR (400 MHz, DMSO-d6) δ 9.07 (s, 1H), 9.03 (s,1H), 7.90–7.94 (m, 2H), 7.80 (d, J = 8.0 Hz, 2H), 7.75 (d, J = 8.0 Hz, 2H), 7.69 (d, J = 12.0 Hz, 2H), 7.44–7.32 (m, 7H), 7.26 (dd, 1H), 7.10–7.05 (m, 9H), 6.92 (d, J = 8.0 Hz, 1H), 6.72 (d, J = 8.0 Hz, 1H), 6.52 (t, J = 8.0, 8.0 Hz, 1H). 13C{1H} NMR (101 MHz, DMSO-d6) δ 177.28, 172.60, 163.31, 162.60, 147.49, 147.37, 145.45, 139.89, 139.85, 139.55, 138.70, 137.32, 136.73, 134.82, 133.77, 130.10, 127.97, 127.79, 127.67, 126.97, 124.71, 123.79, 123.69, 123.57, 120.65, 119.97, 119.28, 116.90, 113.57, 112.39, 31.42, 23.06, 22.53. IR (cm−1): 3027.69 (Ar C-H), 1610.27 (C=N), 1579.41 (Ar C=C), 1490.71 (Ar C=C), 1280.50 (C-O), 750.17 (Ar C-H), 694.25 (Ar C-H). MS (ESI+, DMSO-d6): m/z calcd for C44H31N3O2Zn (697.17), found 698.17362 ([M + H]+). Zinc (wt%): 8.01%.

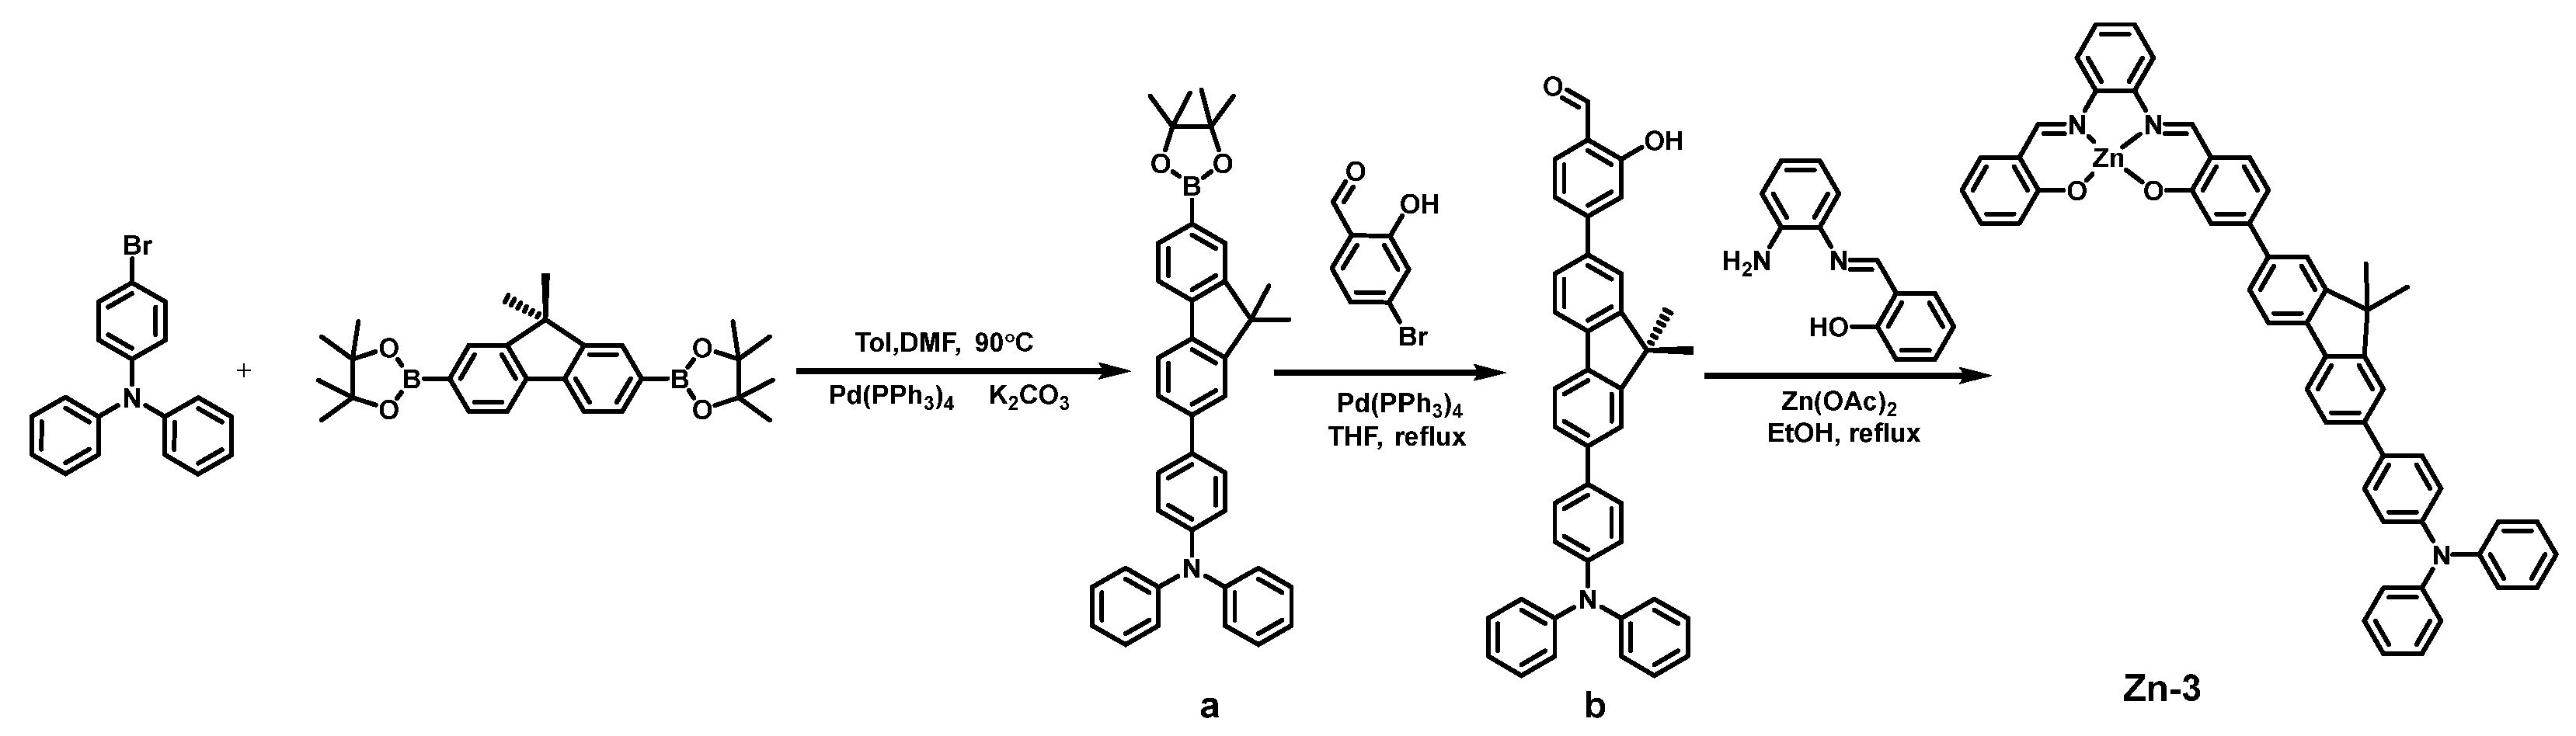
3.3. Synthesis of Zn-3

Using toluene:DMF:water = 10:5:1 (v/v/v) as the solvent, with toluene at a quantity of 5 mL, the following were added to a Schlenk tube: (4-Bromophenyl) diphenylamine (140 mg 0.43 mmol), 2,2′-(9,9-dimethyl9H-fluorene-2,7-diyl) bis (4,4,5,5-tetramethyl-1,3,2-dioxaborolane) (245 mg 0.55 mmol), K2CO3 (2 mol L−1), TBAB (30 mg 0.09 mmol), and Pd(PPh3)4 (60 mg 0.05 mmol) (Figure 10). Three repetitions of air exchanges with nitrogen were performed, and the solution was reacted at 90 °C overnight in dark. The solvent was evaporated under reduced pressure and extracted three times with dichloromethane and saturated salt water. The organic phase was collected and passed through a silica gel column with PE:DCM = 3:2 (v/v). The white product a was collected and dried, producing a yield of 173.43 mg (71.61%). 1H NMR (400 MHz, CDCl3) δ 7.89 (s, 1H), 7.83 (d, J = 8.0 Hz, 1H), 7.78 (d, J = 8.0 Hz, 1H), 7.74 (d, J = 8.0 Hz, 1H), 7.62 (s, 1H), 7.56–7.53 (m, 3H), 7.27 (t, J = 8.0, 8.0 Hz, 4H), 7.17–7.14 (m, 6H), 7.04 (t, J = 4.0, 7.3 Hz, 2H), 1.54 (s, 6H), 1.38 (s, 12H). 13C{1H} NMR (101 MHz, CDCl3) δ 154.99, 153.00, 147.72, 147.18, 141.98, 140.43, 137.82, 135.55, 134.01, 129.30, 128.76, 127.89, 125.73, 124.43, 124.00, 122.95, 120.96, 120.75, 119.36, 83.77, 46.96, 29.73, 27.21, 24.95. MS (ESI+, CDCl3): m/z calcd for C39H38BNO2 (563.30), found 564.30421 ([M + H]+).
Reference 1a for the synthesis process of a (173.43 mg 0.36 mmol), 4-bromo-2-hydroxybenzaldehyde (72.41 mg 0.36 mmol), TBAB (24 mg), and catalyst: Pd(PPh3)4 (50 mg)—this product was passed through a silica gel column with PE:DCM = 3:1 (v/v). The yellow product b was collected and dried, producing a yield of 173.08 mg (83.21%). 1H NMR (400 MHz, CDCl3) δ 11.15 (s, 1H), 9.94 (s, 1H), 7.80 (t, J = 8.0, 4.0 Hz, 2H), 7.69 (s, 1H), 7.65–7.63 (m, 3H), 7.58 (dd, J = 8.0 Hz, 1H), 7.55 (d, J = 8.0 Hz, 2H), 7.35 (dd, J = 4.0, 4.0 Hz, 1H), 7.28 (m, 5H), 7.16 (m, 6H), 7.04 (t, J = 8.0, 4.0 Hz, 2H), 1.58 (s, 6H). 13C{1H} NMR (101 MHz, CDCl3) δ 191.97, 164.94, 161.54, 160.42, 155.16, 155.00, 148.72, 148.55, 147.54, 147.14, 146.51, 139.46, 138.25, 137.31, 137.24, 134.96, 130.58, 130.09, 128.30, 126.71, 125.90, 124.52, 123.96, 123.69, 121.92, 121.55, 121.43, 121.25, 118.81, 115.38. MS (ESI+, CDCl3): m/z calcd for C40H31NO2 (557.24), found 558.24387 ([M + H]+).
Ethanol (6 mL) as a solvent, b (39 mg 0.07 mmol), h-salophen (14.86 mg 0.07 mmol), and zinc acetate (15.37 mg 0.07 mmol) were added to a Schlenk tube, and the reaction was carried out overnight at 82 °C. The post-processing method was the same as before, and the solution was dried to obtain the yellow product Zn-3, producing a yield of 37 mg (68.50%). 1H NMR (400 MHz, DMSO-d6) δ 9.09 (s, 1H), 9.04 (s, 1H), 7.94 (m, 5H), 7.86 (s, 1H), 7.74 (d, J = 8.0 Hz, 1H), 7.70 (d, J = 8.0 Hz, 2H), 7.65 (d, J = 8.0 Hz, 1H), 7.54 (d, J = 8.0 Hz, 1H), 7.41–7.32 (m, 7H), 7.26 (t, J = 8.0, 8.0 Hz, 1H), 7.16–7.07 (m, 9H), 6.98 (d, J = 8.0 Hz, 1H), 6.72 (d, J = 8.0 Hz, 1H), 6.53 (t, J = 4.0, 4.0 Hz, 1H), 1.57 (s, 6H). 13C{1H} NMR (151 MHz, DMSO-d6) δ 172.78, 163.30, 162.59, 155.15, 154.84, 147.57, 147.05, 146.32, 139.94, 139.85, 139.55, 139.40, 138.76, 137.57, 137.52, 137.20, 136.74, 135.09, 134.94, 134.85, 134.83, 130.10, 128.30, 127.76, 127.67, 126.36, 126.32, 125.85, 124.51, 124.03, 123.68, 123.58, 121.66, 121.25, 121.01, 120.93, 119.94, 119.91, 119.19, 117.00, 116.92, 113.45, 112.61, 112.60, 47.25, 27.33. MS (ESI-, DMSO-d6): m/z calcd for C53H39N3O2Zn (+HCl 849.21), found 848.17725 ([M − H]). Zinc (wt%): 6.71%.

3.4. Synthesis of Zn-4

Reference 3a for the synthesis process of 4′-bromo-N, N-diphenyl-[1,1′-biphenyl]-4-amine (180 mg 0.45 mmol), 2,2′-(9,9-dimethyl9H-fluorene-2,7-diyl)bis(4,4,5,5-tetramethyl-1,3,2-dioxaborolane) (268.93 mg 0.60 mmol), TBAB (30 mg 0.09 mmol), and Pd(PPh3)4 (63 mg 0.05 mmol)—this product was passed through a silica gel column with PE:DCM = 3:2 (v/v) (Figure 11). The white product a was collected and dried, producing a yield of 118 mg (41.03%). 1H NMR (400 MHz, CDCl3) δ 7.89 (s, 1H), 7.83 (d, J = 8.0 Hz, 1H), 7.78 (d, J = 8.0 Hz, 1H), 7.74 (d, J = 8.0 Hz, 1H), 7.62 (s, 1H), 7.56–7.53 (m, 3H), 7.27 (t, J = 8.0, 8.0 Hz, 4H), 7.17–7.14 (m, 6H), 7.04 (t, J = 4.0, 7.3 Hz, 2H), 1.56 (s, 6H), 1.39 (s, 12H). 13C{1H} NMR (101 MHz, CDCl3) δ 155.03, 153.06, 147.70, 147.31, 141.90, 140.46, 139.96, 139.55, 138.28, 134.57, 134.03, 129.33, 128.80, 127.68, 127.56, 127.00, 126.07, 124.51, 123.91, 123.01, 121.28, 120.82, 119.46, 83.80, 47.01, 29.73, 27.21, 24.96. MS (ESI, CDCl3): m/z calcd for C45H42BNO2 (639.33), found 639.33198.
Using Tol:THF:water = 5:2:1 (v/v/v) as the solvent, with toluene at a quantity of 5 mL, the following were added to a Schlenk tube: a (118 mg 0.18 mmol), 4-bromo-2-hydroxybenzaldehyde (38.19 mg 0.19 mmol), TBAB (15 mg), and catalyst: Pd(PPh3)4 (25 mg).The post-processing method was the same as before, and the organic phase was collected and passed through a silica gel column with PE:DCM = 3:1 (v/v). The yellow product b was collected and dried, producing a yield of 53.86 mg (46.07%). 1H NMR (400 MHz, CDCl3) δ 11.16 (s, 1H), 9.94 (s, 1H), 7.83 (d, J = 8.0Hz, 2H), 7.75–7.63 (m, 9H), 7.54 (d, J = 8.0Hz, 2H), 7.35 (dd, J = 4.0, 4.0 Hz, 1H), 7.31–7.26 (m, 5H), 7.18–7.15 (m, 6H), 7.05 (t, J = 8.0, 8.0 Hz, 2H), 1.60 (s, 6H). 13C{1H} NMR (101 MHz, CDCl3) δ 195.93, 161.97, 154.72, 150.21, 147.68, 147.27, 140.48, 139.85, 139.71, 139.61, 138.22, 137.65, 134.39, 134.09, 129.32, 127.66, 127.54, 127.02, 126.64, 126.25, 124.51, 123.87, 123.02, 121.62, 121.31, 120.71, 120.53, 119.49, 118.93, 115.73, 47.15, 37.45, 37.09, 32.76, 31.95, 30.08, 29.72, 29.35, 27.28, 22.71, 19.70, 14.14. MS (ESI+, CDCl3): m/z calcd for C46H35NO2 (633.27), found 634.27029([M + H]+).
Ethanol (5 mL) as a solvent, b (25 mg 0.04 mmol), h-salophen (8.37 mg 0.04 mmol), and zinc acetate (8.78 mg 0.04 mmol) were added to a Schlenk tube, and the reaction was carried out overnight at 82 °C. The post-processing method was the same as before, and the yellow product Zn-4 was obtained, producing a yield of 17 mg (48.35%). 1H NMR (400 MHz, DMSO-d6) δ 8.70 (s, 1H), 8.67 (s, 1H), 7.80 (dd, J = 4.0, 4.0 Hz, 2H), 7.72 (s, 1H), 7.64 (s,2H), 7.58 (s, 1H), 7.56 (d, J = 8.0 Hz, 2H), 7.48 (t, J = 8.0, 8.0 Hz, 1H), 7.42–7.37 (m, 3H), 7.30–7.27 (m,7H), 7.16 (t, J = 8.0, 8.0 Hz, 6H), 7.04 (t, J = 8.0, 4.0 Hz, 3H), 7.00 (s, 1H), 6.94 (t, J = 8.0, 8.0 Hz, 1H), 1.58 (s, 6H). 13C{1H} NMR (151 MHz, DMSO-d6) δ 150.09, 147.51, 130.12, 128.02, 127.76, 127.09, 124.66, 124.41, 123.78, 121.50. MS (ESI, DMSO-d6): m/z calcd for C59H43N3O2Zn (889.26), found 889.49449. Zinc (wt%): 5.88%.

3.5. Measurement

3.5.1. Measurement of Absorption Spectrum and Extinction Coefficient

Determination of the UV–visible absorption spectrum was completed using the Agilent8453 UV–visible absorption spectrometer (Santa Clara, CA, USA). The test optical path was 1 cm, and the sample concentration and solution volume were determined based on the maximum absorption of the compound, with a maximum absorption of 0.8~1.2. The sample absorption value was divided by the sample concentration to obtain the sample extinction coefficient.

3.5.2. Measurement of Excitation and Emission Spectroscopy

Measurements of excitation and emission spectroscopy were completed using the Edinburgh FLS980 steady-state transient fluorescence/phosphorescence spectrometer (Edinburgh, UK), with a 450W Xe lamp as the light source and a visible region photomultiplier tube (R928 PMT) or near-infrared photomultiplier tube (R5509 NIR PMT, cooled to −80 °C in liquid nitrogen 2 h in advance) as the detector. The absorption at the observed excitation position of the solution was approximately 0.1, and the width of the slit was adjusted to increase the luminescence intensity sufficiently while the maximum number of photons was below 106.

3.5.3. Measurement of the Fluorescence Lifetime

Measurement of the fluorescence lifetime was completed using the Edinburgh FLS980 steady-state transient fluorescence/phosphorescence spectrometer and Time Correlated Single Photon Counting (TCSPC), with a short-lived pulse laser (EPLED) EPL-405 (Edinburgh, UK) as the light source. The slit was adjusted so that the emission intensity was approximately 6000–7000 Hz, with a maximum photon count of 3000. The corresponding emission wavelength was scanned for photon decay, and exponential fitting was performed using F980 software (version 1.3.1) for FLS980 load to obtain the lifetime.
For multi-exponential fitting, calculate multiple lifetime components:
F ( t ) = i A i e t / τ i
  • t: decay time
  • F(t): fluorescence emission intensity
  • τi, Ai: the lifetime and amplitude of the i-th lifespan component
Calculate the proportion of lifetime:
R e l j % = A j τ j i A i τ i

3.5.4. Measurement of the Low Temperature (77 K) Emission Spectroscopy

The emission spectrum was measured at low temperature (77 K), and the sample was placed in a nuclear magnetic tube. The tube was immersed in liquid nitrogen to freeze the solution, and the solvent was 2-methyltetrahydrofuran (2-MeTHF).

3.5.5. Freeze Extraction Deoxygenation

A specially designed deoxygenated fluorescence sample cell was used. The solution was placed on one side of the circular bottom sample cell and immersed in liquid nitrogen to freeze completely. The system was connected to a single row of pipes and underwent vacuum pump degassing for 30 min; liquid nitrogen was used to provide a cold trap.
After 30 min, the sample cell was completely thawed, injected with nitrogen gas, and then immersed again in liquid nitrogen. A vacuum pump was used to extract air; this was repeated 4 times, extracting air for 10 min each time. Finally, the plug was tightened; the deoxygenated fluorescence sample cell was thawed, removed, and tilted onto one side of the quartz fluorescence cell for absorption or emission spectrum measurement.

3.5.6. Measurement of the ns-TA

The nanosecond transient absorption spectroscopy was measured using the Edinburgh LP980 transient absorption spectrometer (Edinburgh, UK), with a 355 nm OPO laser as the excitation source, a 450 W Xe lamp as the detection source, and a photomultiplier tube (PMT) as the dynamic detector. The transient spectroscopy was measured using an enhanced charge-coupled device (ICCD). After subtracting the dark background and detector background, the steady-state transient absorption spectrum difference was scanned at 550 nm as the central wavelength. Degassing was performed prior to testing.

3.5.7. Measurement of Superoxide Anion Radical

Using DHE as a probe for the superoxide anion radical, the relative yield of the superoxide anion radical was measured based on the rate of change in product luminescence at 532 nm and 610 nm excitation.
The sample was dissolved in 1–2 mL of pyridine and a 1 mM (or 0.5 mM) concentrated solution was prepared for storage. During measurement, the DHE was weighed and then dissolved in 1–2 mL of DMSO in order to prepare a 1 mM concentrated solution. A pipette of 10 μL (or 20 μL) of the concentrated sample solution was added to 2 mL of anhydrous ethanol and diluted to 5 μM. The absorption spectrum was measured, and the absorption value was recorded at 405 nm. A quantity of 20 μL of DHE concentrated solution was added, thus being diluted to 10 μM.
The solution was illuminated with a 405 nm laser, and an irradiance meter was used to detect a light intensity of approximately 10.0 mW/cm2 at the center of the solution. After being illuminated for a certain period of time, the illumination was stopped, and the solution was excited at 532 nm. The emission spectrum was scanned, and the variation of the emission intensity was recorded with time at 610 nm. Use linear fitting:
Δ I   =   k t   +   b
  • ΔI: the variation of emission intensity at 610 nm relative to the initial moment
  • t: total illumination time of 405 nm laser
The yield of superoxide anions in each sample was compared by comparing the slope k, which is the initial rate of product production kt=0.

3.5.8. Measurement of Singlet Oxygen

Quantum yields of singlet oxygen in trichloromethane were determined based on the emission at 1270 nm. Tetraphenylporphyrin (TPP) was used as the reference (ΦΔ,r = 0.55 in CHCl3). All samples were excited at 415 nm. Quantum yields of singlet oxygen (ΦΔ,x) were calculated by equation:
Φ Δ ,   x = Φ Δ ,   r S x S r A b s r A b s x
where Sx and Sr are the integration of the emission peak at 1270 nm of the samples and the reference, respectively. Absx and Absr are the absorbance of the samples and reference at 415 nm.

3.5.9. Computations

Computations were carried out with Gaussian16 [37]. Geometry optimizations of the ground states were performed using the B3LYP [38] functional with “D3BJ” dispersion corrections in density functional theory (DFT) calculations. The 6–311G(d) basis set [39] was used for all atoms except the Zn atom, which was described by the LanL2DZ [40] pseudopotential and its accompanying basis set, respectively. The solvent effects were considered using the integral equation formalism of the polarizable continuum model (IEFPCM) for solvation in DMSO [41].

4. Conclusions

In summary, we synthesized Zn-14 complexes and characterized them in terms of photophysical properties. By designing the Zn-salophen complex as a D–A structure, it generates a charge-separated state and has the ability to sensitize oxygen. By increasing the distance between the electron donor and acceptor by adding benzene, the energy gap between the singlet and triplet state of the complexes is smaller; the triplet state is more stable; and the sensitivity to oxygen is stronger. In comparing Zn-4 with Zn-1, it was found that the quantum yield of singlet oxygen in Zn-4 is 2.51 times that of Zn-1, and the superoxide anion is 1.38 times that of Zn-1. Compared with Zn-salophen, which can produce ROS (with only about 1.2 times the change in ROS) [25], this strategy has a better effect on enhancing ROS generation. The experimental results indicate that increasing the distance between D and A has a more significant impact on the production of ROS. Further exploration is needed to improve the structure of these complexes and expand their application in phototherapy.

Supplementary Materials

The following supporting information can be downloaded at: https://www.mdpi.com/article/10.3390/inorganics12040108/s1, 1H NMR, 13C NMR, MS, FTIR of Zn-14, Extinction coefficient, Fluorescence decay, Lifetime of Zn-1–4 (in nitrogen), and DFT calculations.

Author Contributions

Conceptualization of the project, J.-L.Z.; methodology, Z.-H.L., J.-L.Z. and J.Z.; validation, Z.-H.L., Z.-Y.T. and J.-L.Z.; resources, J.-L.Z. and J.Z.; formal analysis, Z.-H.L., Z.-Y.T. and J.-L.Z.; writing–original draft preparation, Z.-H.L. and Z.-Y.T.; review and editing, J.-L.Z. and J.Z. All authors have read and agreed to the published version of the manuscript.

Funding

This research was funded by the National Natural Science Foundation of China. Grant Numbers: 21571007, 21621061, 21778002, and 21861162008.

Data Availability Statement

The original contributions presented in the study are included in the article/Supplementary Materials, further inquiries can be directed to the corresponding authors.

Conflicts of Interest

The authors declare no conflicts of interest.

References

  1. Langellotti, V.; Melchiorre, M.; Cucciolito, M.E.; Esposito, R.; Grieco, D.; Pinto, G.; Ruffo, F. Biodiesel from Waste Cooking Oil: Highly Efficient Homogeneous Iron (III) Molecular Catalysts. Catalysts 2023, 13, 1496. [Google Scholar] [CrossRef]
  2. Hong, L.; Liu, X.; Chi, B.; Xia, G.; Wang, H. Diatomic molecule catalysts toward synergistic electrocatalytic carbon dioxide reduction. J. Mater. Chem. A 2023, 11, 6321–6328. [Google Scholar] [CrossRef]
  3. Gupta, K.C.; Sutar, A.K. Catalytic activities of Schiff base transition metal complexes. Coord. Chem. Rev. 2008, 252, 1420–1450. [Google Scholar] [CrossRef]
  4. Gupta, K.C.; Kumar Sutar, A.; Lin, C.-C. Polymer-supported Schiff base complexes in oxidation reactions. Coord. Chem. Rev. 2009, 253, 1926–1946. [Google Scholar] [CrossRef]
  5. Jacobsen, E.N. Asymmetric catalysis of epoxide ring opening reactions. Acc. Chem. Res. 2000, 33, 421–431. [Google Scholar] [CrossRef] [PubMed]
  6. Liu, W.; Groves, J.T. Manganese Catalyzed C-H Halogenation. Acc. Chem. Res. 2015, 48, 1727–1735. [Google Scholar] [CrossRef] [PubMed]
  7. Liu, X.; Manzur, C.; Novoa, N.; Celedón, S.; Carrillo, D.; Hamon, J.-R. Multidentate unsymmetrically-substituted Schiff bases and their metal complexes: Synthesis, functional materials properties, and applications to catalysis. Coord. Chem. Rev. 2018, 357, 144–172. [Google Scholar] [CrossRef]
  8. Zhang, X.; Hou, Y.; Ettelaie, R.; Guan, R.; Zhang, M.; Zhang, Y.; Yang, H. Pickering Emulsion-Derived Liquid-Solid Hybrid Catalyst for Bridging Homogeneous and Heterogeneous Catalysis. J. Am. Chem. Soc. 2019, 141, 5220–5230. [Google Scholar] [CrossRef] [PubMed]
  9. Liu, Y.; Li, S.; Yu, X.; Chen, Y.; Tang, X.; Hu, T.; Shi, L.; Pudukudy, M.; Shan, S.; Zhi, Y. Cellulose nanofibers (CNF) supported (Salen) Cr (III) composite as an efficient heterogeneous catalyst for CO2 cycloaddition. Mol. Catal. 2023, 547, 113344. [Google Scholar] [CrossRef]
  10. Lu, S.; Ge, Q.; Fan, C.; Wang, X.; Chen, Y.; Lin, S.; Pan, Q. Synthesis of sulfur-containing polycarbonate block copolymers via Salen-metal catalyzed copolymerization of CO2, propylene oxide, and phthalic thioanhydride. J. Macromol. Sci. A 2023, 60, 484–491. [Google Scholar] [CrossRef]
  11. Wang, B.; Wang, X.-Z.; Luo, D.; Zhou, X.-P.; Li, D. A chiral Salen-based Zn (II)-Cd (II) heterometallic metal-organic framework: Synthesis, crystal structure, and optical properties. J. Coord. Chem. 2022, 75, 1670–1678. [Google Scholar] [CrossRef]
  12. Wang, X.-Z.; Zhou, C.-W.; Wang, B.; Lai, Y.-L.; Lian, Z.-X.; Liu, Y.-T.; Li, Y.Y.; Zhou, X.-P. Chiral two-dimensional metal-organic frameworks based on Zn(salen) ligands: Subcomponent self-assembly and circularly polarised luminescence. CrystEngComm 2023, 25, 484–489. [Google Scholar] [CrossRef]
  13. Song, F.; Wang, C.; Falkowski, J.M.; Ma, L.; Lin, W. Isoreticular Chiral Metal-Organic Frameworks for Asymmetric Alkene Epoxidation: Tuning Catalytic Activity by Controlling Framework Catenation and Varying Open Channel Sizes. J. Am. Chem. Soc. 2010, 132, 15390–15398. [Google Scholar] [CrossRef] [PubMed]
  14. He, T.; Guo, J.; Qi, C.; Feng, R.; Yang, B.; Zhou, Y.; Tian, L.; Cui, J. Core-shell structure flame retardant Salen-PZN-Cu@Ni-Mof microspheres enhancing fire safety of epoxy resin through the synergistic effect. J. Polym. Res. 2022, 29, 27. [Google Scholar] [CrossRef]
  15. Fan, Y.; Zhang, W.; He, K.; Wang, L.; Wang, Q.; Liu, J. Half-salen Fe(III) covalently post-modified MIL-125(Ti)-NH2 MOF for effective photocatalytic peroxymonosulfate activation. Appl. Surf. Sci. 2022, 591, 153115. [Google Scholar] [CrossRef]
  16. Shultz, A.M.; Sarjeant, A.A.; Farha, O.K.; Hupp, J.T.; Nguyen, S.T. Post-Synthesis Modification of a Metal-Organic Framework to Form Metallosalen-Containing MOF Materials. J. Am. Chem. Soc. 2011, 133, 13252–13255. [Google Scholar] [CrossRef] [PubMed]
  17. Wang, J.; Yang, M.; Dong, W.; Jin, Z.; Tang, J.; Fan, S.; Lu, Y.; Wang, G. Co(II) complexes loaded into metal-organic frameworks as efficient heterogeneous catalysts for aerobic epoxidation of olefins. Catal. Sci. Technol. 2016, 6, 161–168. [Google Scholar] [CrossRef]
  18. Wang, Z.; Zeng, L.; He, C.; Duan, C. Metal-Organic Framework-Encapsulated Anthraquinone for Efficient Photocatalytic Hydrogen Atom Transfer. ACS Appl. Mater. Interfaces 2022, 14, 7980–7989. [Google Scholar] [CrossRef] [PubMed]
  19. He, Y.; Liu, L.; Fu, G.; Li, W.; Lü, X.; He, H.; Wong, W.-Y. Efficient white polymer light-emitting diodes (WPLEDs) based on double emitting layers of a PVK:Eu(III)-complex and Alq(3). J. Mater. Chem. C 2019, 7, 4800–4807. [Google Scholar] [CrossRef]
  20. Kim, H.; Lee, Y.S. Quantum chemical analysis of salen-aluminum complexes for organic light emitting diodes. Chem. Phys. Lett. 2013, 585, 143–148. [Google Scholar] [CrossRef]
  21. Li, X.-X.; Ma, C.-Y.; Du, M.-X.; Dong, W.-K.; Ding, Y.-J. A rare salamo-salophen type “on-off-on” fluorescent probe for relay recognition of Hg2+ and phosphate ions and its applications. J. Mol. Struct. 2024, 1299, 137188. [Google Scholar] [CrossRef]
  22. Yin, H.; Gao, J.; Chen, X.; Ma, B.; Yang, Z.; Tang, J.; Wang, B.; Chen, T.; Wang, C.; Gao, S.; et al. A Gallium(III) Complex that Engages Protein Disulfide Isomerase A3 (PDIA3) as an Anticancer Target. Angew. Chem. Int. Ed. 2020, 59, 20147–20153. [Google Scholar] [CrossRef] [PubMed]
  23. Peng, X.-X.; Zhang, H.; Zhang, R.; Li, Z.-H.; Yang, Z.-S.; Zhang, J.; Gao, S.; Zhang, J.-L. Gallium Triggers Ferroptosis through a Synergistic Mechanism. Angew. Chem. Int. Ed. 2023, 62, e202307838. [Google Scholar] [CrossRef] [PubMed]
  24. Sakshi, S.; Dey, S.; Chowdhury, S.; Ray, S. Characterization of a Zeolite-Y-Encapsulated Zn(II)Salmphen Complex with Targeted Anticancer Property. ACS Appl. Mater. Interfaces 2023, 15, 55518–55532. [Google Scholar] [CrossRef] [PubMed]
  25. Di Bella, S.; Fragala, I.; Ledoux, I.; Marks, T.J. Role of Metal Electronic Properties in Tuning the Second-Order Nonlinear Optical Response of Coordination Complexes. A Combined Experimental and Theoretical Investigation of a Homologous Series of (N,N′-Disalicylidene-1,2-phenylenediaminato)M(II) (M = Co, Ni, Cu) Complexes. J. Am. Chem. Soc. 1995, 117, 9481–9485. [Google Scholar]
  26. Yang, Z.; Zhang, Z.; Sun, Y.; Lei, Z.; Wang, D.; Ma, H.; Tang, B.Z. Incorporating spin-orbit coupling promoted functional group into an enhanced electron D-A system: A useful designing concept for fabricating efficient photosensitizer and imaging-guided photodynamic therapy. Biomaterials 2021, 275, 120934. [Google Scholar] [CrossRef] [PubMed]
  27. Filatov, M.A.; Karuthedath, S.; Polestshuk, P.M.; Savoie, H.; Flanagan, K.J.; Sy, C.; Sitte, E.; Telitchko, M.; Laquai, F.; Boyle, R.W.; et al. Generation of triplet excited states via photoinduced electron transfer in meso-anthra-BODIPY: Fluorogenic response toward singlet oxygen in solution and in vitro. J. Am. Chem. Soc. 2017, 139, 6282–6285. [Google Scholar] [CrossRef] [PubMed]
  28. Hou, Y.; Zhang, X.; Chen, K.; Liu, D.; Wang, Z.; Liu, Q.; Zhao, J.; Barbon, A. Charge separation, charge recombination, long-lived charge transfer state formation and intersystem crossing in organic electron donor/acceptor dyads. J. Mater. Chem. C 2019, 7, 12048–12074. [Google Scholar] [CrossRef]
  29. Kc, C.B.; Lim, G.N.; Nesterov, V.N.; Karr, P.A.; D’Souza, F. Phenothiazine–BODIPY–fullerene triads as photosynthetic reaction center models: Substitution and solvent polarity effects on photoinduced charge separation and recombination. Chem. Eur. J. 2014, 20, 17100–17112. [Google Scholar] [CrossRef]
  30. Liao, J.-M.; Chin, Y.-K.; Wu, Y.-T.; Chou, H.-H. Effect of regio-specific arylamine substitution on novel π-extended zinc salophen complexes: Density functional and time-dependent density functional study on DSSC applications. RSC Adv. 2023, 13, 2501–2513. [Google Scholar] [CrossRef]
  31. Wiederrecht, G.P.; Svec, W.A.; Wasielewski, M.R.; Galili, T.; Levanon, H. Novel mechanism for triplet state formation in short distance covalently linked radical ion pairs. J. Am. Chem. Soc. 2000, 122, 9715–9722. [Google Scholar] [CrossRef]
  32. Dance, Z.E.X.; Mi, Q.X.; McCamant, D.W.; Ahrens, M.J.; Ratner, M.A.; Wasielewski, M.R. Time-resolved EPR studies of photogenerated radical ion pairs separated by p-phenylene oligomers and of triplet states resulting from charge recombination. J. Phys. Chem. B 2006, 110, 25163–25173. [Google Scholar] [CrossRef] [PubMed]
  33. Zhang, G.-L.; Yang, M.; Shen, X.; Chen, L.; Liao, L.-F. Study on spectral properties of Salophen-fluorescein and its uranyl complex. Appl. Chem. Ind. 2013, 42, 549–551. [Google Scholar]
  34. Buck, J.T.; Wilson, R.W.; Mani, T. Intramolecular long-range charge-transfer emission in donor-bridge-acceptor systems. J. Phys. Chem. Lett. 2019, 10, 3080–3086. [Google Scholar] [CrossRef] [PubMed]
  35. Wang, X.; Song, Y.; Pan, G.; Han, W.; Wang, B.; Cui, L.; Ma, H.; An, Z.; Xie, Z.; Xu, B.; et al. Exploiting radical-pair intersystem crossing for maximizing singlet oxygen quantum yields in pure organic fluorescent photosensitizers. Chem. Sci. 2020, 11, 10921–10927. [Google Scholar] [CrossRef]
  36. Lee, J.; Song, I.; Warkad, S.D.; Yeom, G.S.; Shinde, P.B.; Song, K.; Nimse, S.B. Synthesis and evaluation of 2-aryl-1H-benzo[d]imidazole derivatives as potential microtubule targeting agents. Drug Dev. Res. 2022, 83, 769–782. [Google Scholar] [PubMed]
  37. Frisch, M.J.; Trucks, G.W.; Schlegel, H.B.; Scuseria, G.E.; Robb, M.A.; Cheeseman, J.R.; Scalmani, G.; Barone, V.; Petersson, G.A.; Nakatsuji, H.; et al. Gaussian 16 Rev. B.01; Gaussian, Inc.: Wallingford, CT, USA, 2016. [Google Scholar]
  38. Stephens, P.J.; Devlin, F.J.; Chabalowski, C.F.; Frisch, M.J. Ab-initio calculation of vibrational absorption and circular-dichroism spectra using density-functional force-fields. J. Phys. Chem. 1994, 98, 11623–11627. [Google Scholar] [CrossRef]
  39. Krishnan, R.; Binkley, J.S.; Seeger, R.; Pople, J.A. Self-consistent molecular orbital methods. XX. A basis set for correlated wave functions. J. Chem. Phys. 1980, 72, 650–654. [Google Scholar] [CrossRef]
  40. Hay, P.J.; Wadt, W.R. Ab initio effective core potentials for molecular calculations—Potentials for the transition metal atoms Sc to Hg. J. Chem. Phys. 1985, 82, 270–283. [Google Scholar] [CrossRef]
  41. Miertuš, S.; Scrocco, E.; Tomasi, J. Electrostatic interaction of a solute with a continuum. A direct utilizaion of AB initio molecular potentials for the prevision of solvent effects. Chem. Phys. 1981, 55, 117–129. [Google Scholar] [CrossRef]
Figure 1. Molecular formula of the designed and synthesized Zn-salophen complexes. The green part is the electron acceptor (A), the yellow part is the electron donor (D), and the red part is the bridge group.
Inorganics 12 00108 g001
Figure 2. The synthesis route of the Zn-14.
Inorganics 12 00108 g002
Figure 3. The absorption and emission spectra of Zn-14. (a) The absorption spectra of Zn-14 (Solvent: DMSO). (b) The emission spectra of Zn-14 at 298 K (Solvent: DMSO, λex = 405 nm). (c) The emission spectra of Zn-14 at 77 K (Solvent: 2-MeTHF, λex = 405 nm).
Inorganics 12 00108 g003
Figure 4. Emission spectra of (a) Zn-salophen, (b) Zn-1, (c) Zn-2, (d) Zn-3, and (e) Zn-4 in deaerated (N2) and aerated (air) DMSO (λex = 405 nm).
Inorganics 12 00108 g004
Figure 5. (a) Relationship between the proportion of shorter fluorescence lifetime (Rel1%) and donor-acceptor distance (rD-A). (b) Schematic diagram of fluorescence lifetime; τF1 represents fluorescence with a shorter lifetime. The green part is the electron acceptor (A) and the yellow part is the electron donor (D).
Inorganics 12 00108 g005
Figure 6. The ROS generation of Zn-salophen and Zn-14. (a) The variation of emission intensity with laser illumination time in Zn-1 with DHE, showing the generation of O2· (Solvent: anhydrous ethanol, λex = 532 nm). (b) The variation of emission intensity at 610 nm with laser illumination time and linear fitting of Zn-salophen and Zn-14 with DHE (Solvent: anhydrous ethanol, λex = 532 nm). (c) The emission of 1O2 in Zn-salophen and Zn-14 (Solvent: CHCl3, λex = 415 nm). (d) The relationship between ROS relative yield and donor–acceptor distance. The vertical axis represents the ratio of ROS quantum yields of Zn-14 and Zn-salophen.
Inorganics 12 00108 g006
Figure 7. Proposed mechanism.
Inorganics 12 00108 g007
Figure 8. Zn-1 synthesis route.
Inorganics 12 00108 g008
Figure 9. Zn-2 synthesis route.
Inorganics 12 00108 g009
Figure 10. Zn-3 synthesis route.
Inorganics 12 00108 g010
Figure 11. Zn-4 synthesis route.
Inorganics 12 00108 g011
Table 1. FTIR data of salophen ligand, 3b, and Zn-14.
Compoundsν(O-H)ν(C=O)ν(C=N)ν(C=C)ν(C-O)ν(C-H)
salophen [33]3500 16061566, 149712631406
3b34501660 1585, 148712731377
Zn-1 16101579, 149812981385
Zn-2 16101579, 149112811385
Zn-3 16161589, 148712821385
Zn-4 16181589, 149112901367
Table 2. Fluorescence lifetimes of Zn-14.
Compoundsλ (nm) [a]τ (ns) (Rel%) [b]λ (nm)τ (ns) (Rel%)
Zn-salophen5200.21 (35.78%)6500.22 (28.37%)
2.56 (64.22%)2.45 (51.75%)
10.40 (19.87%)
Zn-15400.33 (52.98%)6800.27 (20.16%)
2.84 (47.02%)2.31 (40.50%)
14.97 (39.34%)
Zn-25400.24 (56.09%)6800.27 (45.12%)
2.23 (43.91%)2.48 (42.69%)
23.54 (12.19%)
Zn-35500.26 (23.40%)6800.31 (17.75%)
2.43 (76.60%)2.44 (75.50%)
11.85 (6.75%)
Zn-45550.39 (3.13%)6800.41 (3.45%)
2.45 (96.87%)2.44 (89.28%)
13.62 (7.27%)
[a] Measured at emission peak (520~555 nm) and tail (650~680 nm) to make the effect of charge transfer more significant; bi- and tri-exponential fitting due to the two or three emission components. [b] Measurement condition: 298 K, Solvent: DMSO, λex = 405 nm. The absorption at the observed excitation position of the solution is approximately 0.1 and the emission intensity is approximately 6000–7000 Hz, with a maximum photon count of 3000. Fluorescence decay curve fitted with double exponential model to obtain fluorescence lifetime and value (percentage).
Table 3. The ROS yields of Zn-14.
Compoundkt=0 (min–1) [a]The Ratio of O2· Yield Relative to Zn-Salophen [b]1O2 Yield [c]The Ratio of 1O2 Yield Relative to Zn-Salophen [d]
Zn-salophen120,4781.000.0191.00
Zn-193,3120.770.0120.63
Zn-2114,8450.950.0201.05
Zn-3110,6430.920.0271.42
Zn-4127,4201.060.0301.58
[a] Plot the excitation peak intensities at 610 nm for 1, 2, 5, 10, 15, and 20 min and perform linear fitting. [b] Dissolve the sample in pyridine and DHE in DMSO; the testing solvent is ethanol. [c] Measurement condition: 298 K. Solvent: CHCl3. Tetraphenylporphyrin (TPP) was used as the reference ( Φ Δ , r = 0 . 55 in CHCl3). Calculate the ratio of peak intensity at 1270 nm. [d] Calculate the relative quantum yield of 1O2 using the value of Zn-salophen as 1.
Disclaimer/Publisher’s Note: The statements, opinions and data contained in all publications are solely those of the individual author(s) and contributor(s) and not of MDPI and/or the editor(s). MDPI and/or the editor(s) disclaim responsibility for any injury to people or property resulting from any ideas, methods, instructions or products referred to in the content.

