Article

N-S-co-Doped Carbon Dot Blue Fluorescence Preparation and Baicalein Detection

1
Mechanical and Electrical Engineering Institute, University of Electronic Science and Technology of China, Zhongshan Institute, Zhongshan 528400, China
2
School of Materials and Energy, University of Electronic Science and Technology of China, Chengdu 610000, China
*
Author to whom correspondence should be addressed.
Inorganics 2024, 12(6), 154; https://doi.org/10.3390/inorganics12060154
Submission received: 30 March 2024 / Revised: 24 April 2024 / Accepted: 30 April 2024 / Published: 31 May 2024
(This article belongs to the Special Issue Synthesis and Application of Luminescent Materials)

Abstract

:
Carbon dots (CDs) have emerged as significant fluorescent nanomaterials due to their bright, stable fluorescence, good biocompatibility, facile synthesis, etc. They are widely used in various scientific and practical applications, particularly in combination with mesoporous, florescent, or magnetic nanomaterials to enhance their properties. Recent research has focused on employing CDs and their composites in drug analysis, drug loading, biological imaging, disease diagnosis, and temperature sensing, with a growing interest in their biological and medical applications. In this study, we synthesized blue-fluorescent S, N-co-doped CDs (cys-CDs) using hydrothermal synthesis with L-cysteine and sodium citrate. These resulting cys-CD particles were approximately 3.8 nm in size and exhibited stable fluorescence with a quantum yield of 0.66. By leveraging the fluorescence quenching of the cys-CDs, we developed a rapid and sensitive method for baicalein detection, achieving high sensitivity in the low micromolar range with a detection limit for baicalein of 33 nM. Our investigation revealed that the fluorescence-quenching mechanism involved static quenching and inner-filter effect components. Overall, cys-CDs proved to be effective for accurate quantitative baicalein detection in real-world samples.

1. Introduction

Carbon dots (CDs) are a type of nanomaterial known for their advantageous fluorescent characteristics. These materials boast exceptional fluorescence performance, featuring bright, stable emission within narrow bandwidths, alongside notable biocompatibility and straightforward modification and functionalization [1,2,3]. Their utility spans various domains including drug testing, sensing biological small molecules, detecting ions, biological imaging, diagnosing diseases, and fabricating electro-optical devices. The research involving CDs has become increasingly diverse, with one notable focus being the enhancement of their fluorescence quantum yield (FQY) [4,5]. Heteroatom doping has emerged as a promising strategy for optimizing the fluorescence properties of CDs, proving to be an effective means to increase their FQY.
Baicalein, a flavonoid compound (C15H10O5) with antibacterial and antiviral properties, is derived from the roots of Scutellaria baicalensis (S. baicalensis). Its chemical structure is illustrated in Figure 1. S. baicalensis can contain up to 5.41% baicalein. Given its potential for clinical applications, extensive research has been conducted on its structure, properties, modes of pharmacological mechanisms, and clinical uses. Several quantitative detection methods for baicalein have also been developed [6,7,8].
Currently used detection methods, such as capillary electrophoresis–electrochemical analysis, high-performance liquid chromatography (HPLC), liquid chromatography-mass spectroscopy (LC-MS) detection, and liquid–liquid micro-extraction, involve complex sample preparation, resulting in high costs and low throughput [9]. Conversely, fluorescence detection offers numerous advantages, including real-time response, direct visualization and detection, low cost, the ease of operation, and the ability to develop high-throughput methodologies [10]. As a result, fluorescence detection is widely employed in various detection schemes.
In this study, we produced S, N-co-doped cysteine-modified carbon dots (cys-CDs) through hydrothermal synthesis, utilizing L-cysteine and sodium citrate as starting materials [11,12]. To analyze the particle size distribution, morphology, structure, composition, and fluorescence properties of the CDs, we employed techniques like infrared (IR) spectroscopy, UV-Vis absorption spectroscopy, transmission electron microscopy (TEM), X-ray photoelectron spectroscopy (XPS), and fluorescence measurements [13,14,15].
Subsequently, we investigated the fluorescence quenching of cys-CDs as a sensitive method for detecting baicalein. To validate the efficacy of our approach in real-world scenarios, we tested human blood and urine samples spiked with known concentrations of baicalein. Our results demonstrate that the detection of baicalein using cys-CDs is both sensitive and accurate in complex biological matrices. The overall methodology is illustrated in Figure 2.

2. Results and Discussion

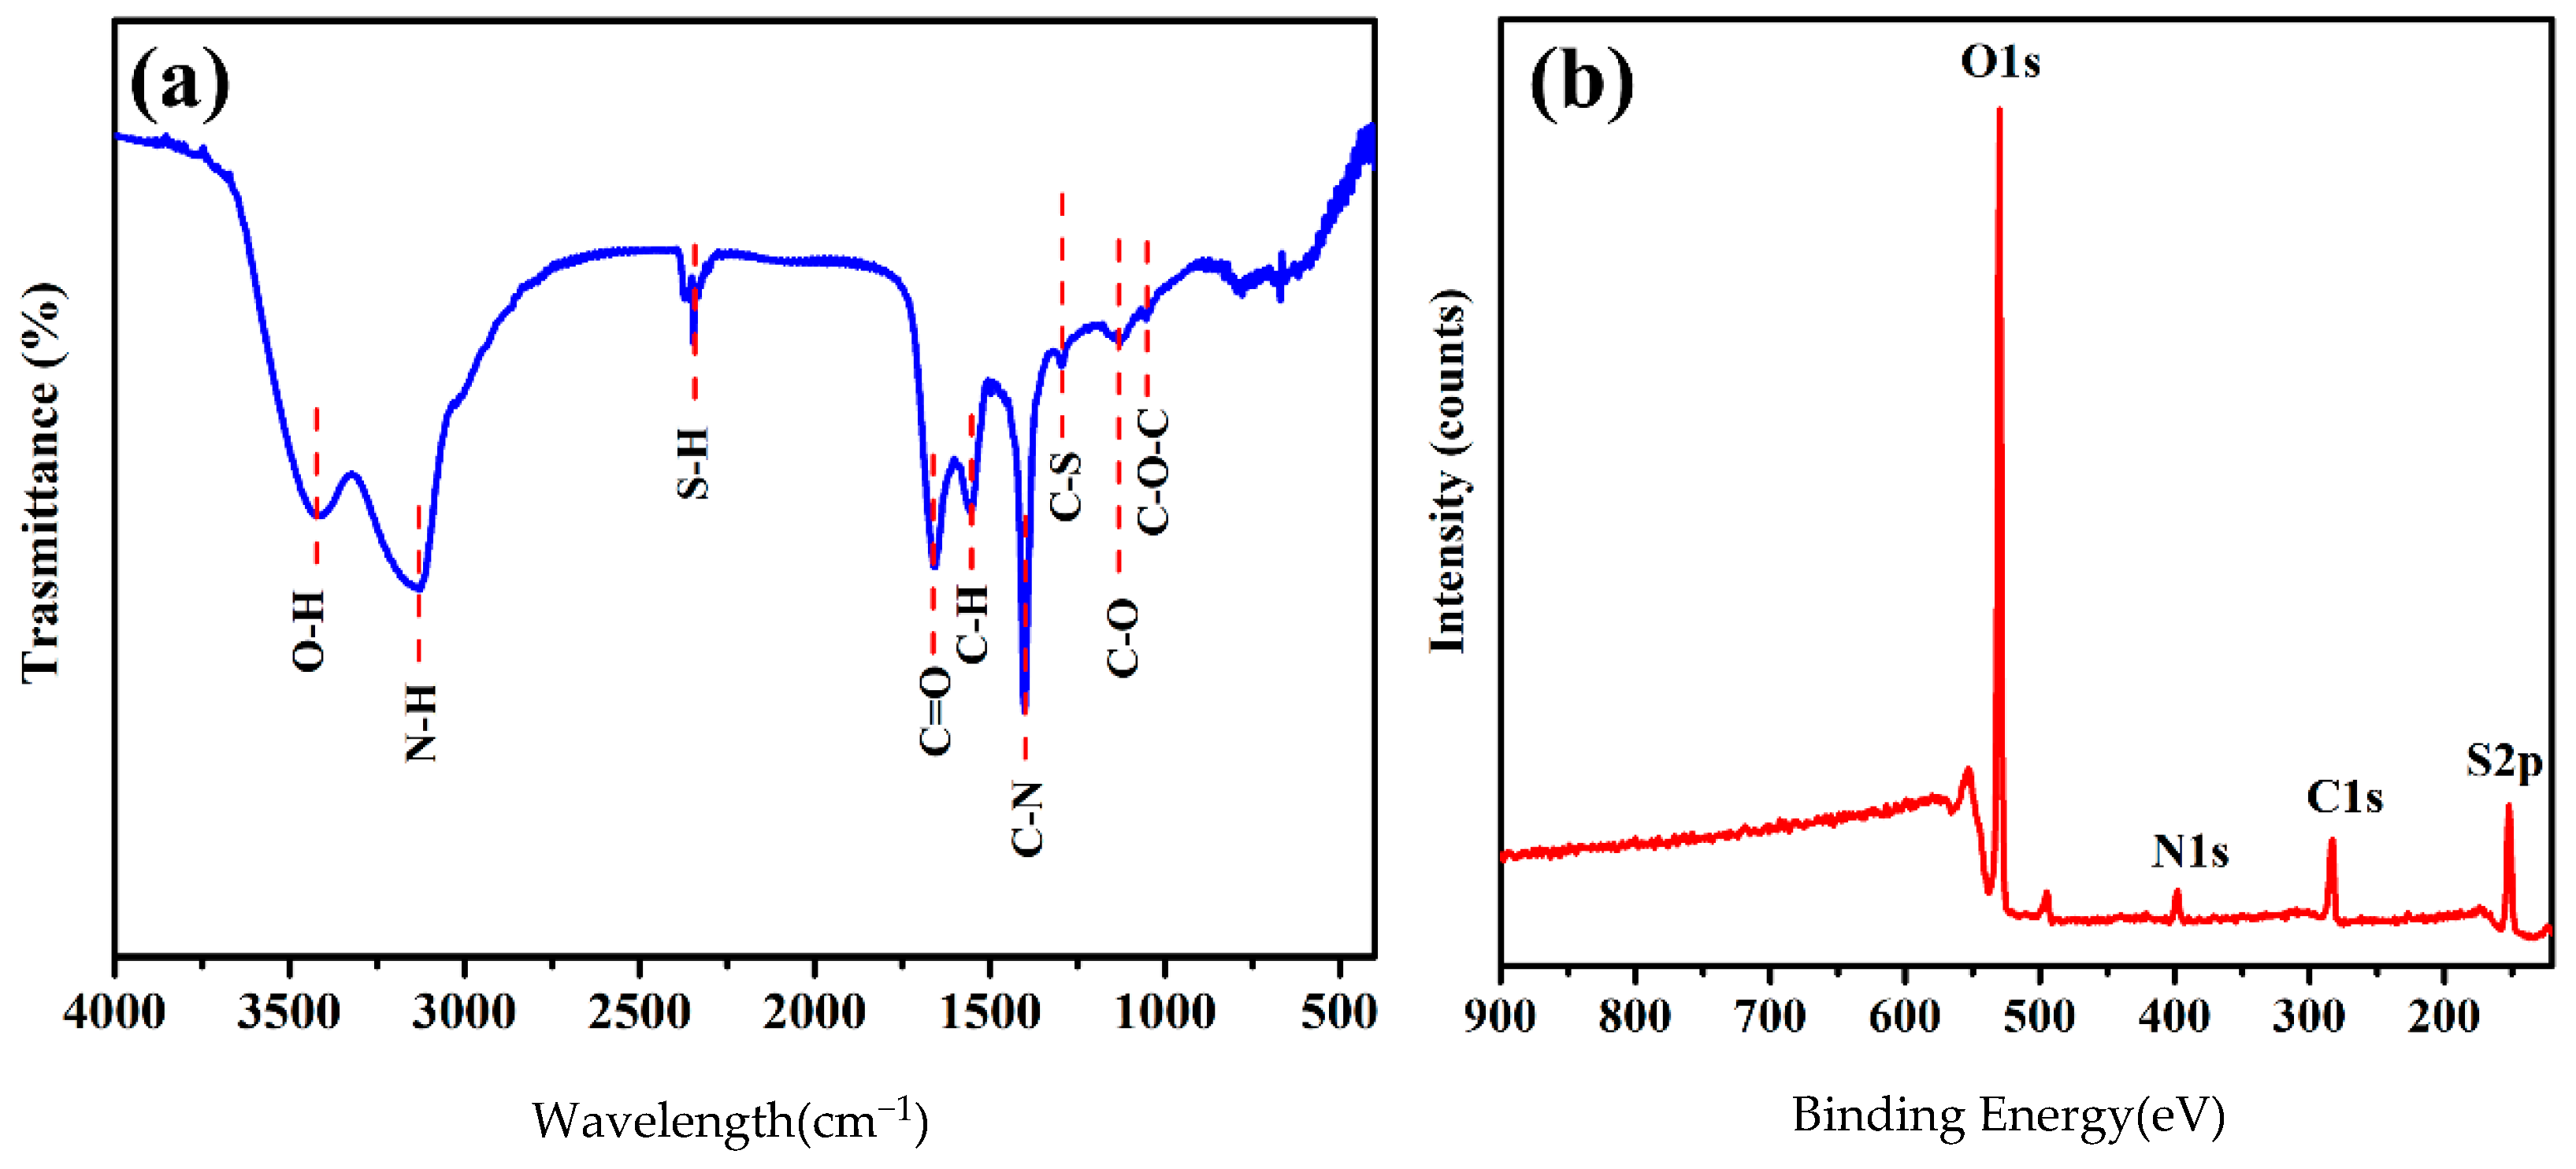
2.1. Morphology and Structure of cys-CD

We employed TEM to analyze the morphological features, particle size distribution, and polydispersity of cys-CD (Figure 3a,b). The cys-CD particles appeared quasi-spherical, with an average diameter of 3.82 nm, ranging from 2.7 to 4.9 nm. Notably, the particle size distribution exhibited uniformity (Figure 3b).
Fourier-transform infrared (FT-IR) spectroscopy and XPS were employed to analyze the surface groups and chemical composition of cys-CDs [16]. In the IR spectrum (Figure 4a), we observed broad peaks at 3420 cm−1 and 3125 cm−1, corresponding to O–H and N–H stretching vibration absorptions, respectively. Characteristic absorption peaks for C–N and –SH were detected around 2400 cm−1, while the C=O stretching vibration peak appeared at 1660 cm−1. The C–N stretching vibration absorption peak was observed at 1401 cm−1, along with the C–S characteristic absorption peak at 1293 cm−1. These observations indicate that the particle’s surface maintained certain characteristics of the source material, showcasing abundant functional groups like amidogen, hydroxyl, carbonyl, and carboxyl groups. Compared with citric acid-CDs [17,18], this offers opportunities for further customization and the adjustment of the surface properties to suit specific applications.
The result of the XPS analysis of cys-CD is presented in Figure 4b. The binding energies at 398, 283, and 152 eV corresponded to N1s, C1s, and S2p, respectively, indicating the presence of carbon (C), nitrogen (N), and sulfur (S) and confirming the synthesis of the S, N-co-doped CDs. According to the research on the deconvolutions of the XPS peaks, the major forms of nitrogen elements are pyridine and pyrrole. The major forms of organic sulfur are sulfoxide and thioether [19].

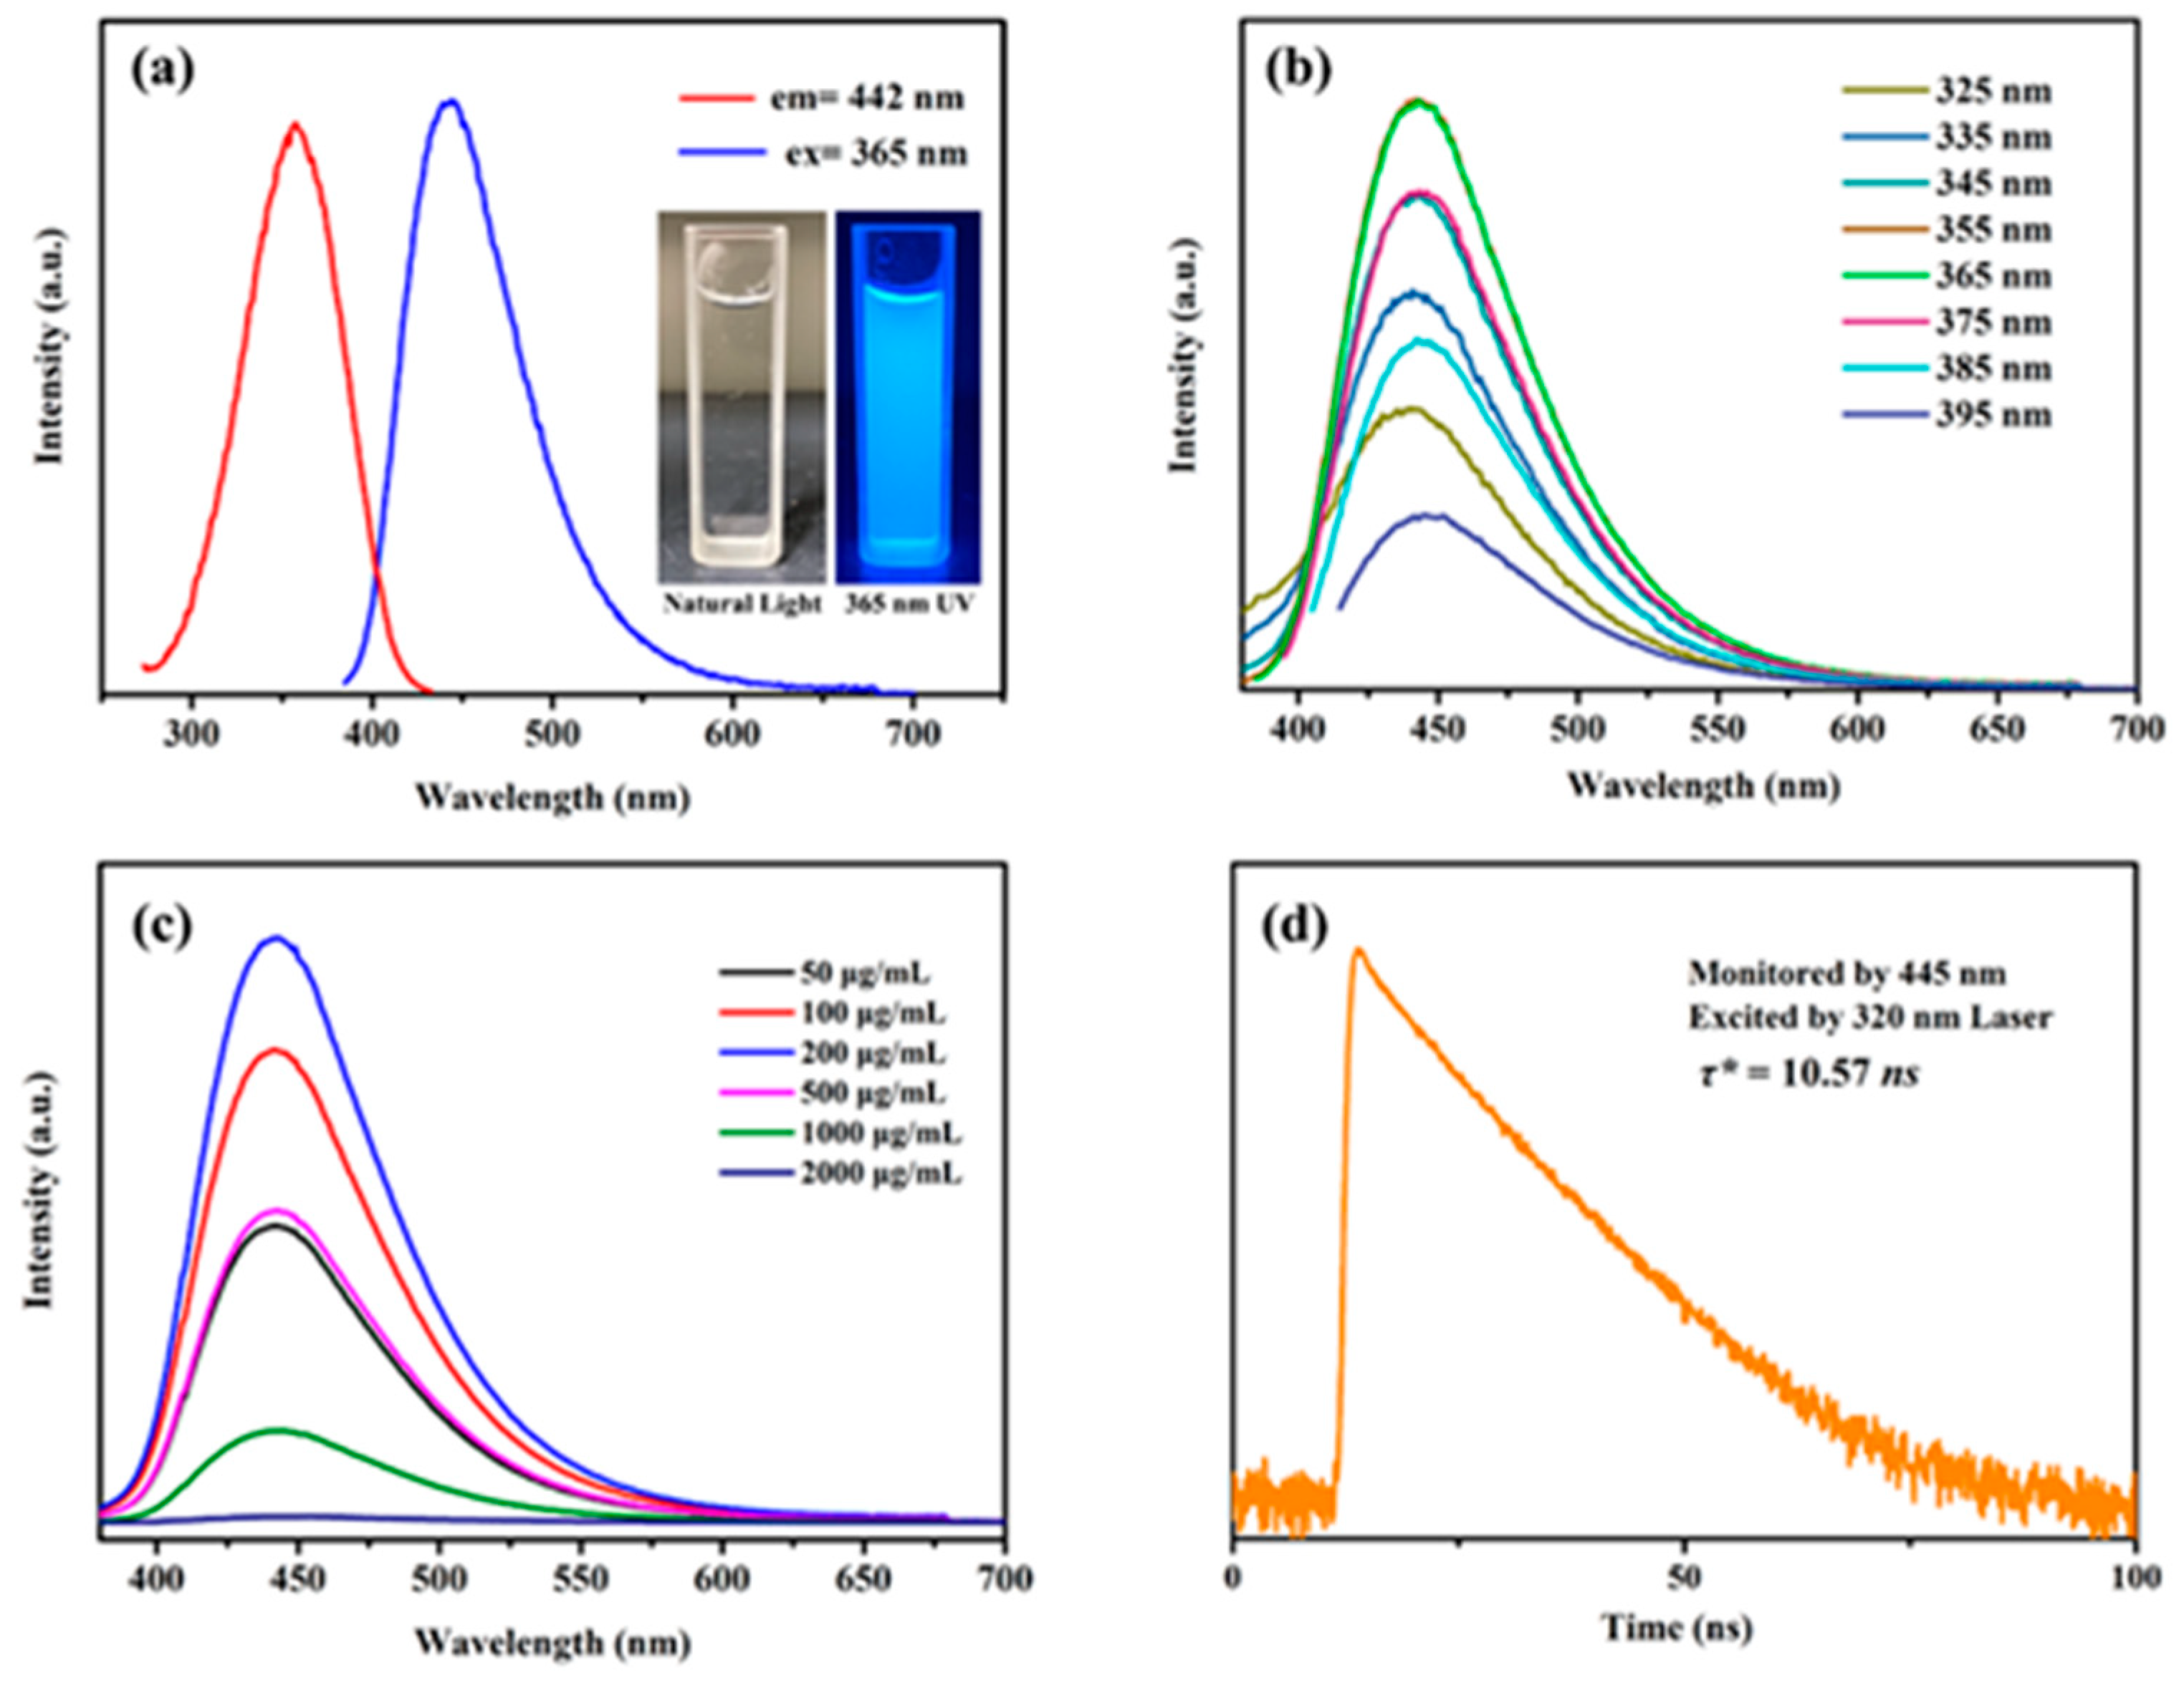
2.2. Optical Properties of cys-CD

In natural light, a 100 μg mL−1 aqueous solution of cys-CD appeared as a faint yellow, transparent color. However, when exposed to ultraviolet (UV) light at 365 nm, the aqueous cys-CD solution emitted a vibrant blue fluorescence (see inset Figure 5a). This fluorescence is attributed to a π–π* transition occurring within the carbon dots, specifically from the C=O to the C=N groups. The peak excitation and emission wavelengths were recorded as λex = 365 nm and λem = 442 nm, respectively (Figure 5a) [20]. Remarkably, we observed that the FQY of cys-CD reached up to 66%, surpassing the performance of the most blue-fluorescent CDs that have been reported previously.
The pH dependence in the UV-vis responses is the protonation/deprotonation of the N-centers present in the CD honeycomb matrix [21]. The cys-CD emission wavelength of 442 nm exhibited no dependence on excitation within the range of 325–375 nm (Figure 5b). This indicates uniformity in both the types and sizes of the functional groups attached to the cys-CD surface. Such uniformity in emission sites is advantageous for future applications involving CD fluorescence.
We measured the fluorescence of the cys-CD aqueous solutions at various concentrations under excitation at a wavelength of 365 nm (Figure 5c). The intensity of the cys-CD fluorescence was directly proportional to its concentration within the range of 50–200 μg mL−1. However, as the concentration increased beyond 200 μg mL−1 up to 2000 μg mL−1, the fluorescence intensity decreased gradually. This phenomenon can be attributed to self-quenching, where at higher concentrations, molecules tend to accumulate, leading to a reduction in fluorescence intensity.
Thus, we determined that the optimal blue-fluorescence intensity in aqueous solution under neutral conditions was achieved with excitation wavelengths ranging from 355 nm to 365 nm, at a cys-CD concentration of 100–200 μg mL−1 (Figure 5c). Additionally, the fluorescence lifetime of cys-CD was measured to be 10.57 ns under laser excitation at a wavelength of 320 nm, with monitoring at an emission wavelength of 445 nm. From the attenuation curve of the fluorescence intensity in Figure 5d, when the fluorescent substance is excited, most of the excited state molecules return to the ground state rapidly. But, some molecules return to the ground state in several times the fluorescence lifetime delay [22]. Besides, because of the intermolecular interaction or other situations, the excited stated energy is consumed, which causes the fluorescence quenching. It is also called aggregation-induced fluorescence quenching.

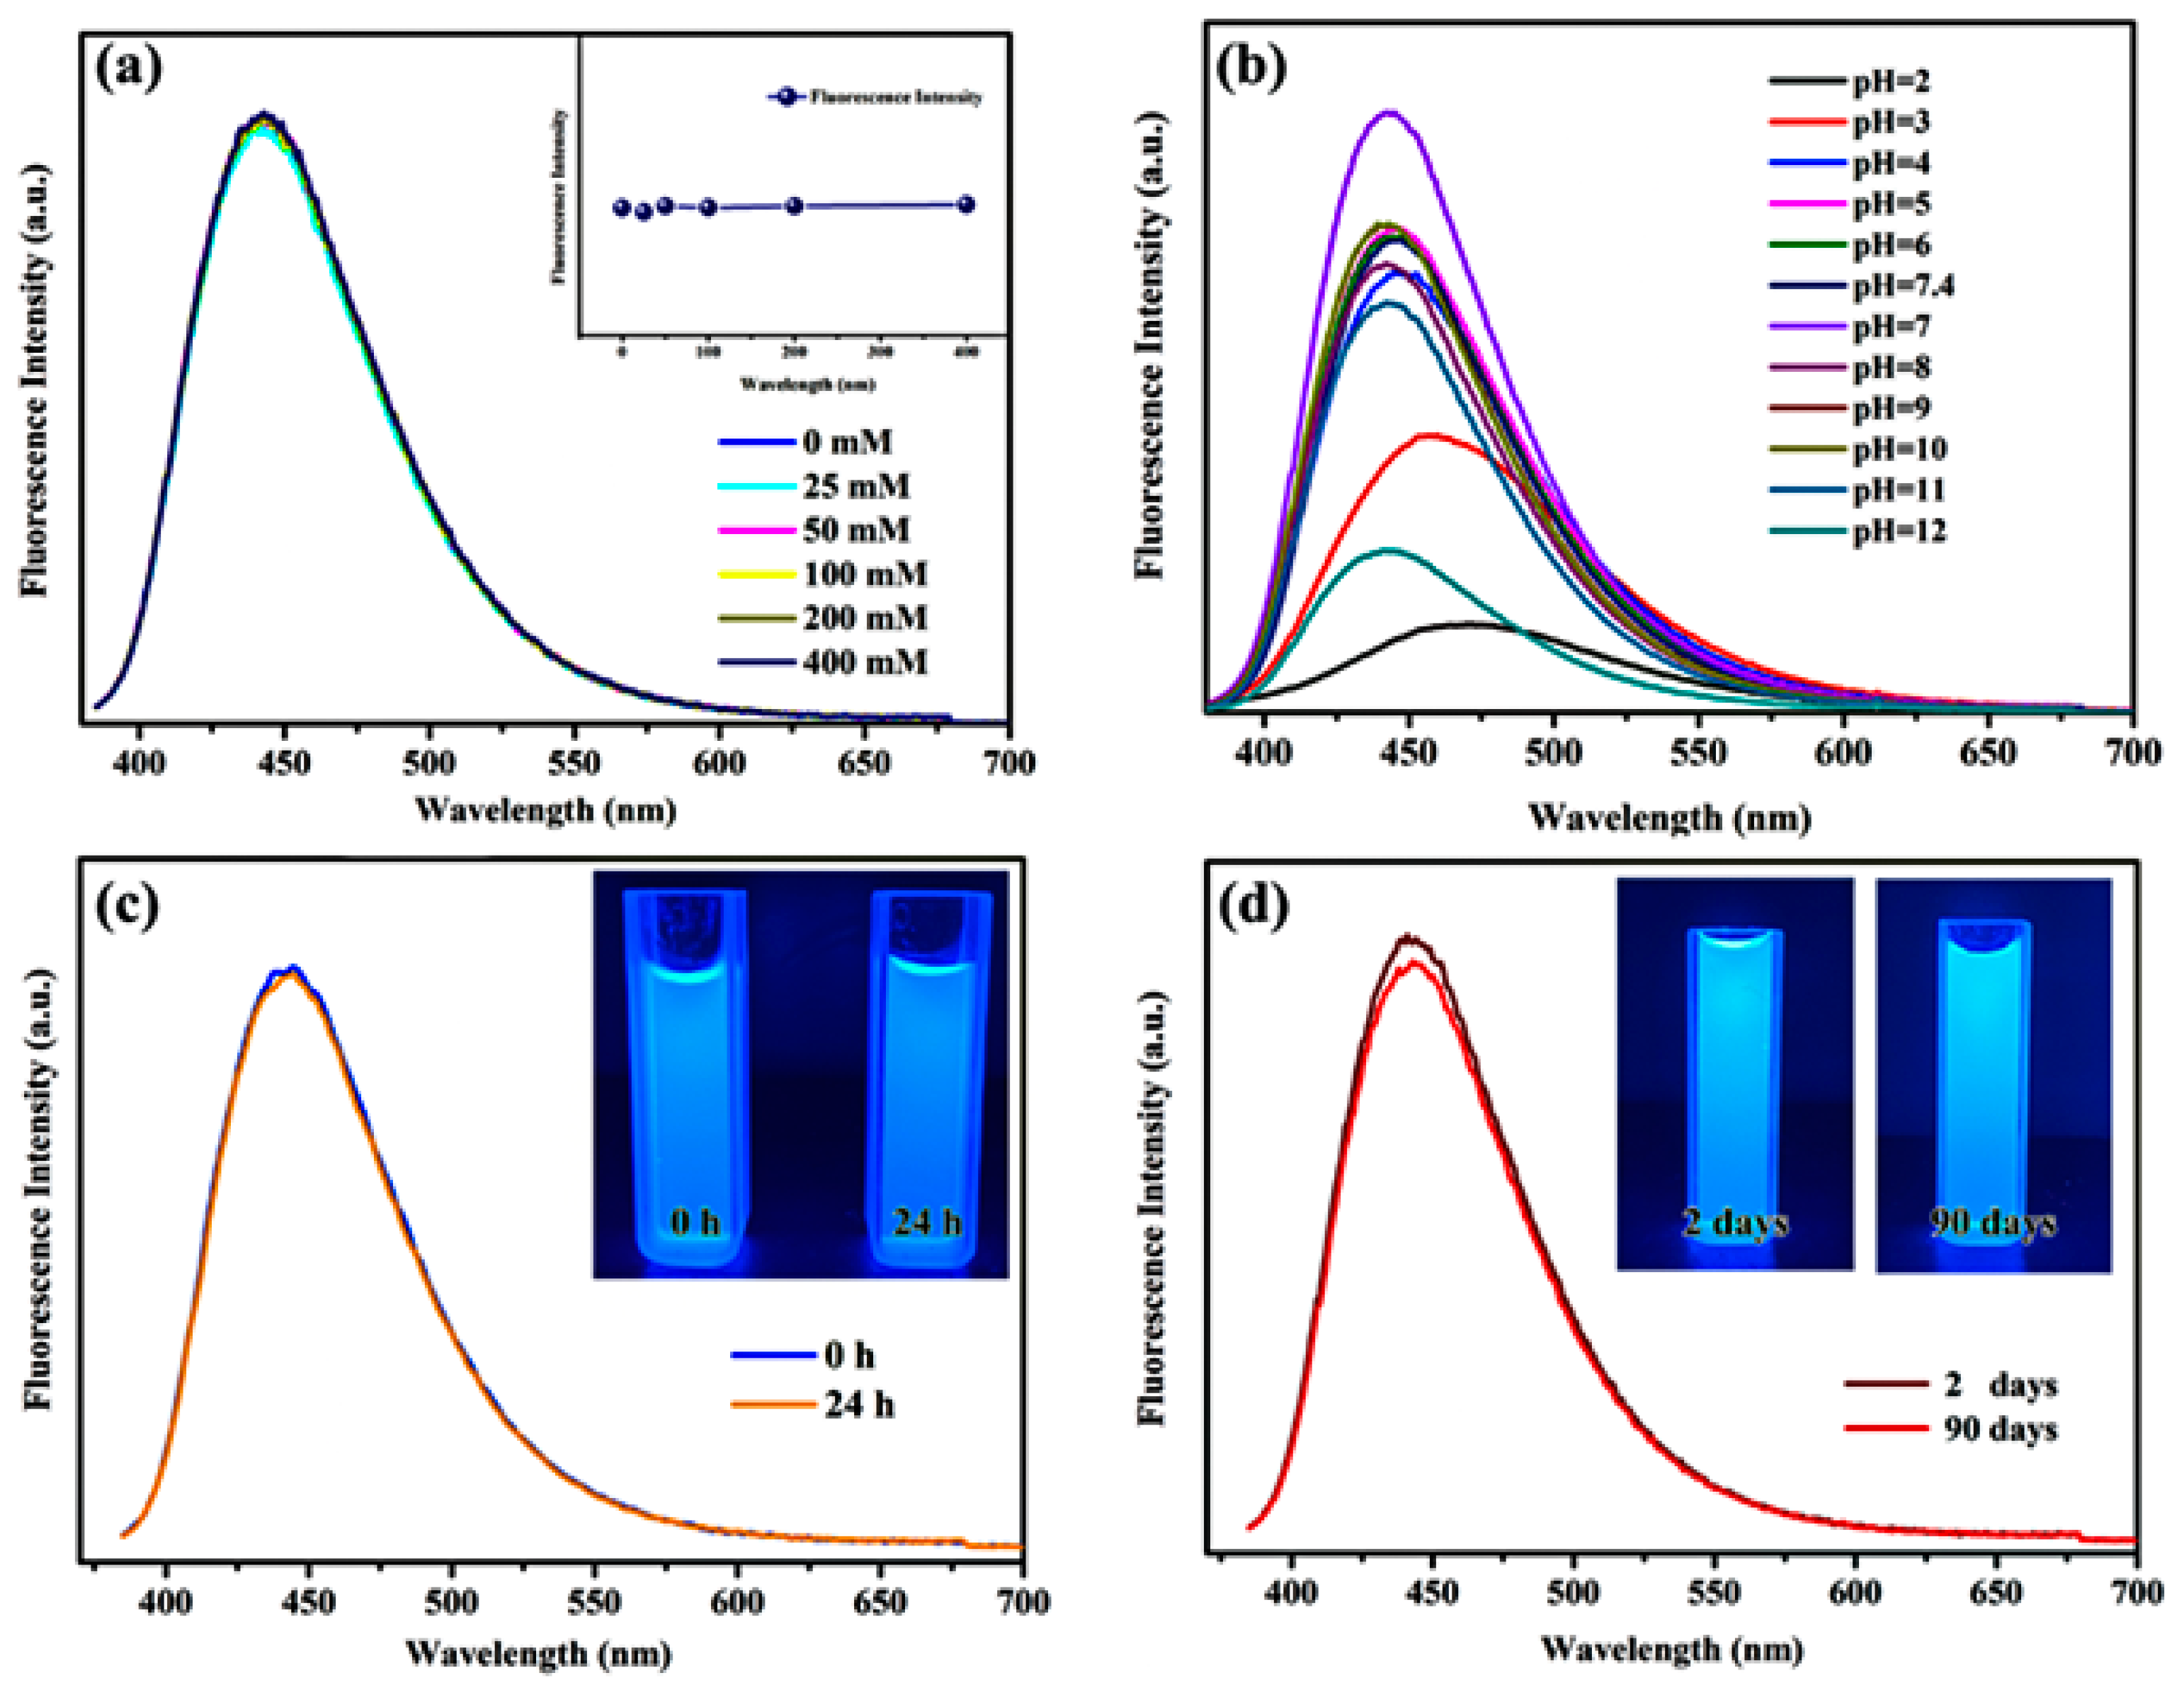
2.3. Stability of cys-CD Fluorescence

The fluorescence intensity of a 100 μg mL−1 solution of cys-CD in water remained relatively stable across a range of Na+ and Cl concentrations from 0 to 400 mM (Figure 6a). This indicates that the fluorescence of cys-CD is highly resistant to salt interference. We then investigated the pH stability of the fluorescence in a standard solution of 100 μg mL−1 cys-CD over the pH range of 2–12 (Figure 6b). The highest blue-fluorescence intensity of cys-CD was observed at pH 7. Even under slightly acidic or basic conditions, cys-CD maintained its blue-fluorescence properties well. However, at pH < 3 (strongly acidic conditions), the fluorescence intensity of cys-CD decreased significantly, accompanied by a red shift in the emission wavelength. Similarly, at pH > 11 (strongly basic conditions), the fluorescence intensity decreased significantly, although there was no red shift in the emission wavelength.
One possible explanation is that the functional groups on the surface of cys-CDs are easily hydrolyzed in strong acidic or basic environments, leading to a decrease in overall fluorescence. Additionally, at low pH levels, the protonation of certain groups may modulate the absorption maximum.
Following 24 h of UV irradiation at 365 nm with a power of 12 W, the fluorescence intensity of a 100 μg mL−1 cys-CD aqueous solution showed no significant reduction (refer to Figure 6c and the inset). This suggests that cys-CDs demonstrate robust stability and resistance to photobleaching. To further assess stability, the fluorescence of a 100 μg mL−1 cys-CD aqueous solution was examined after 90 days of storage at 4 °C. The comparison of the fluorescence spectra between fresh and stored solutions, measured under identical conditions (following treatment in a water bath at 25 °C for 15 min), revealed no significant changes (Figure 6d). This demonstrates that cys-CDs maintain stable fluorescence over extended periods, indicating their long-term stability.

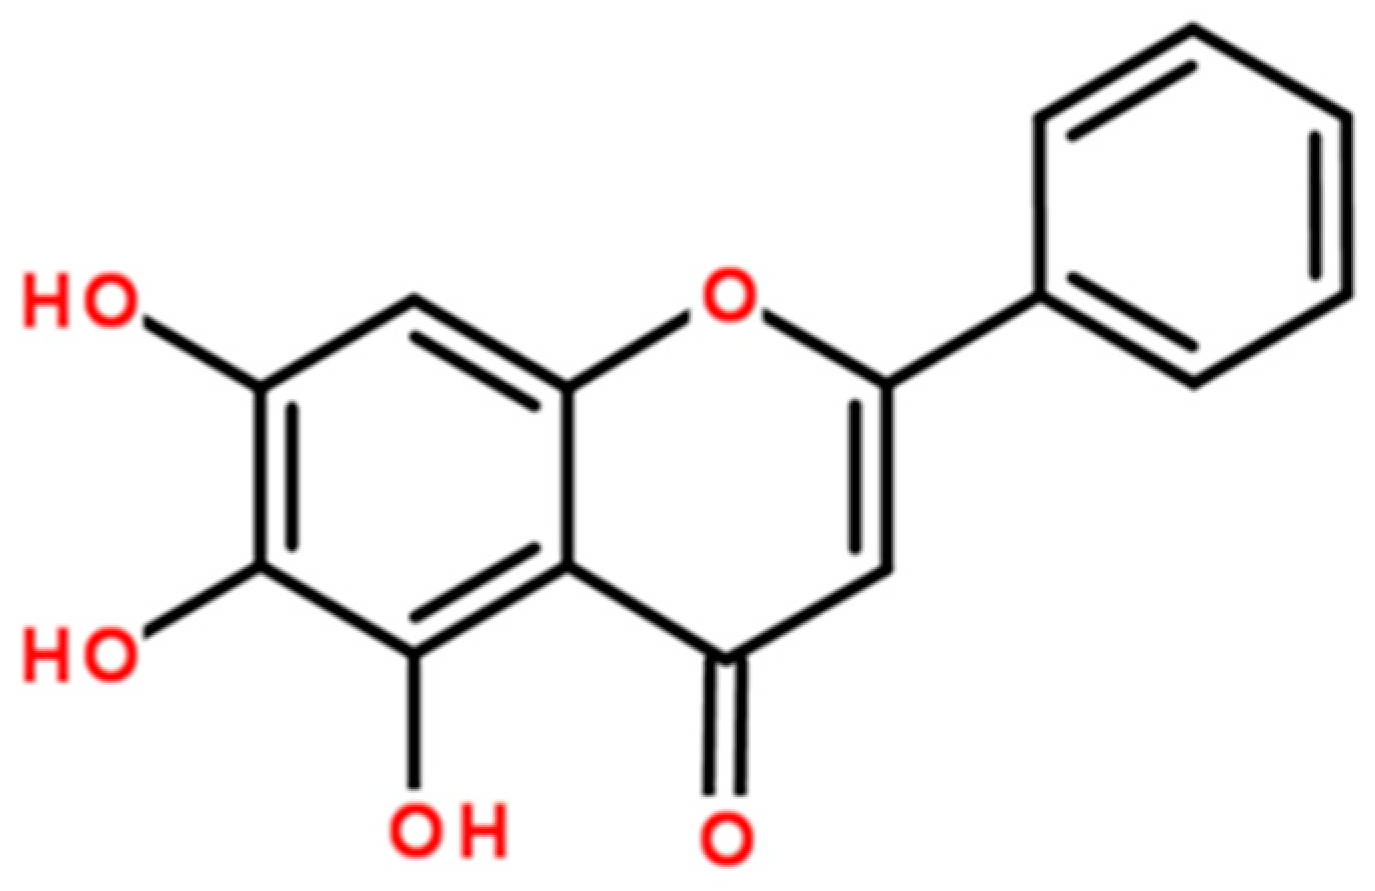
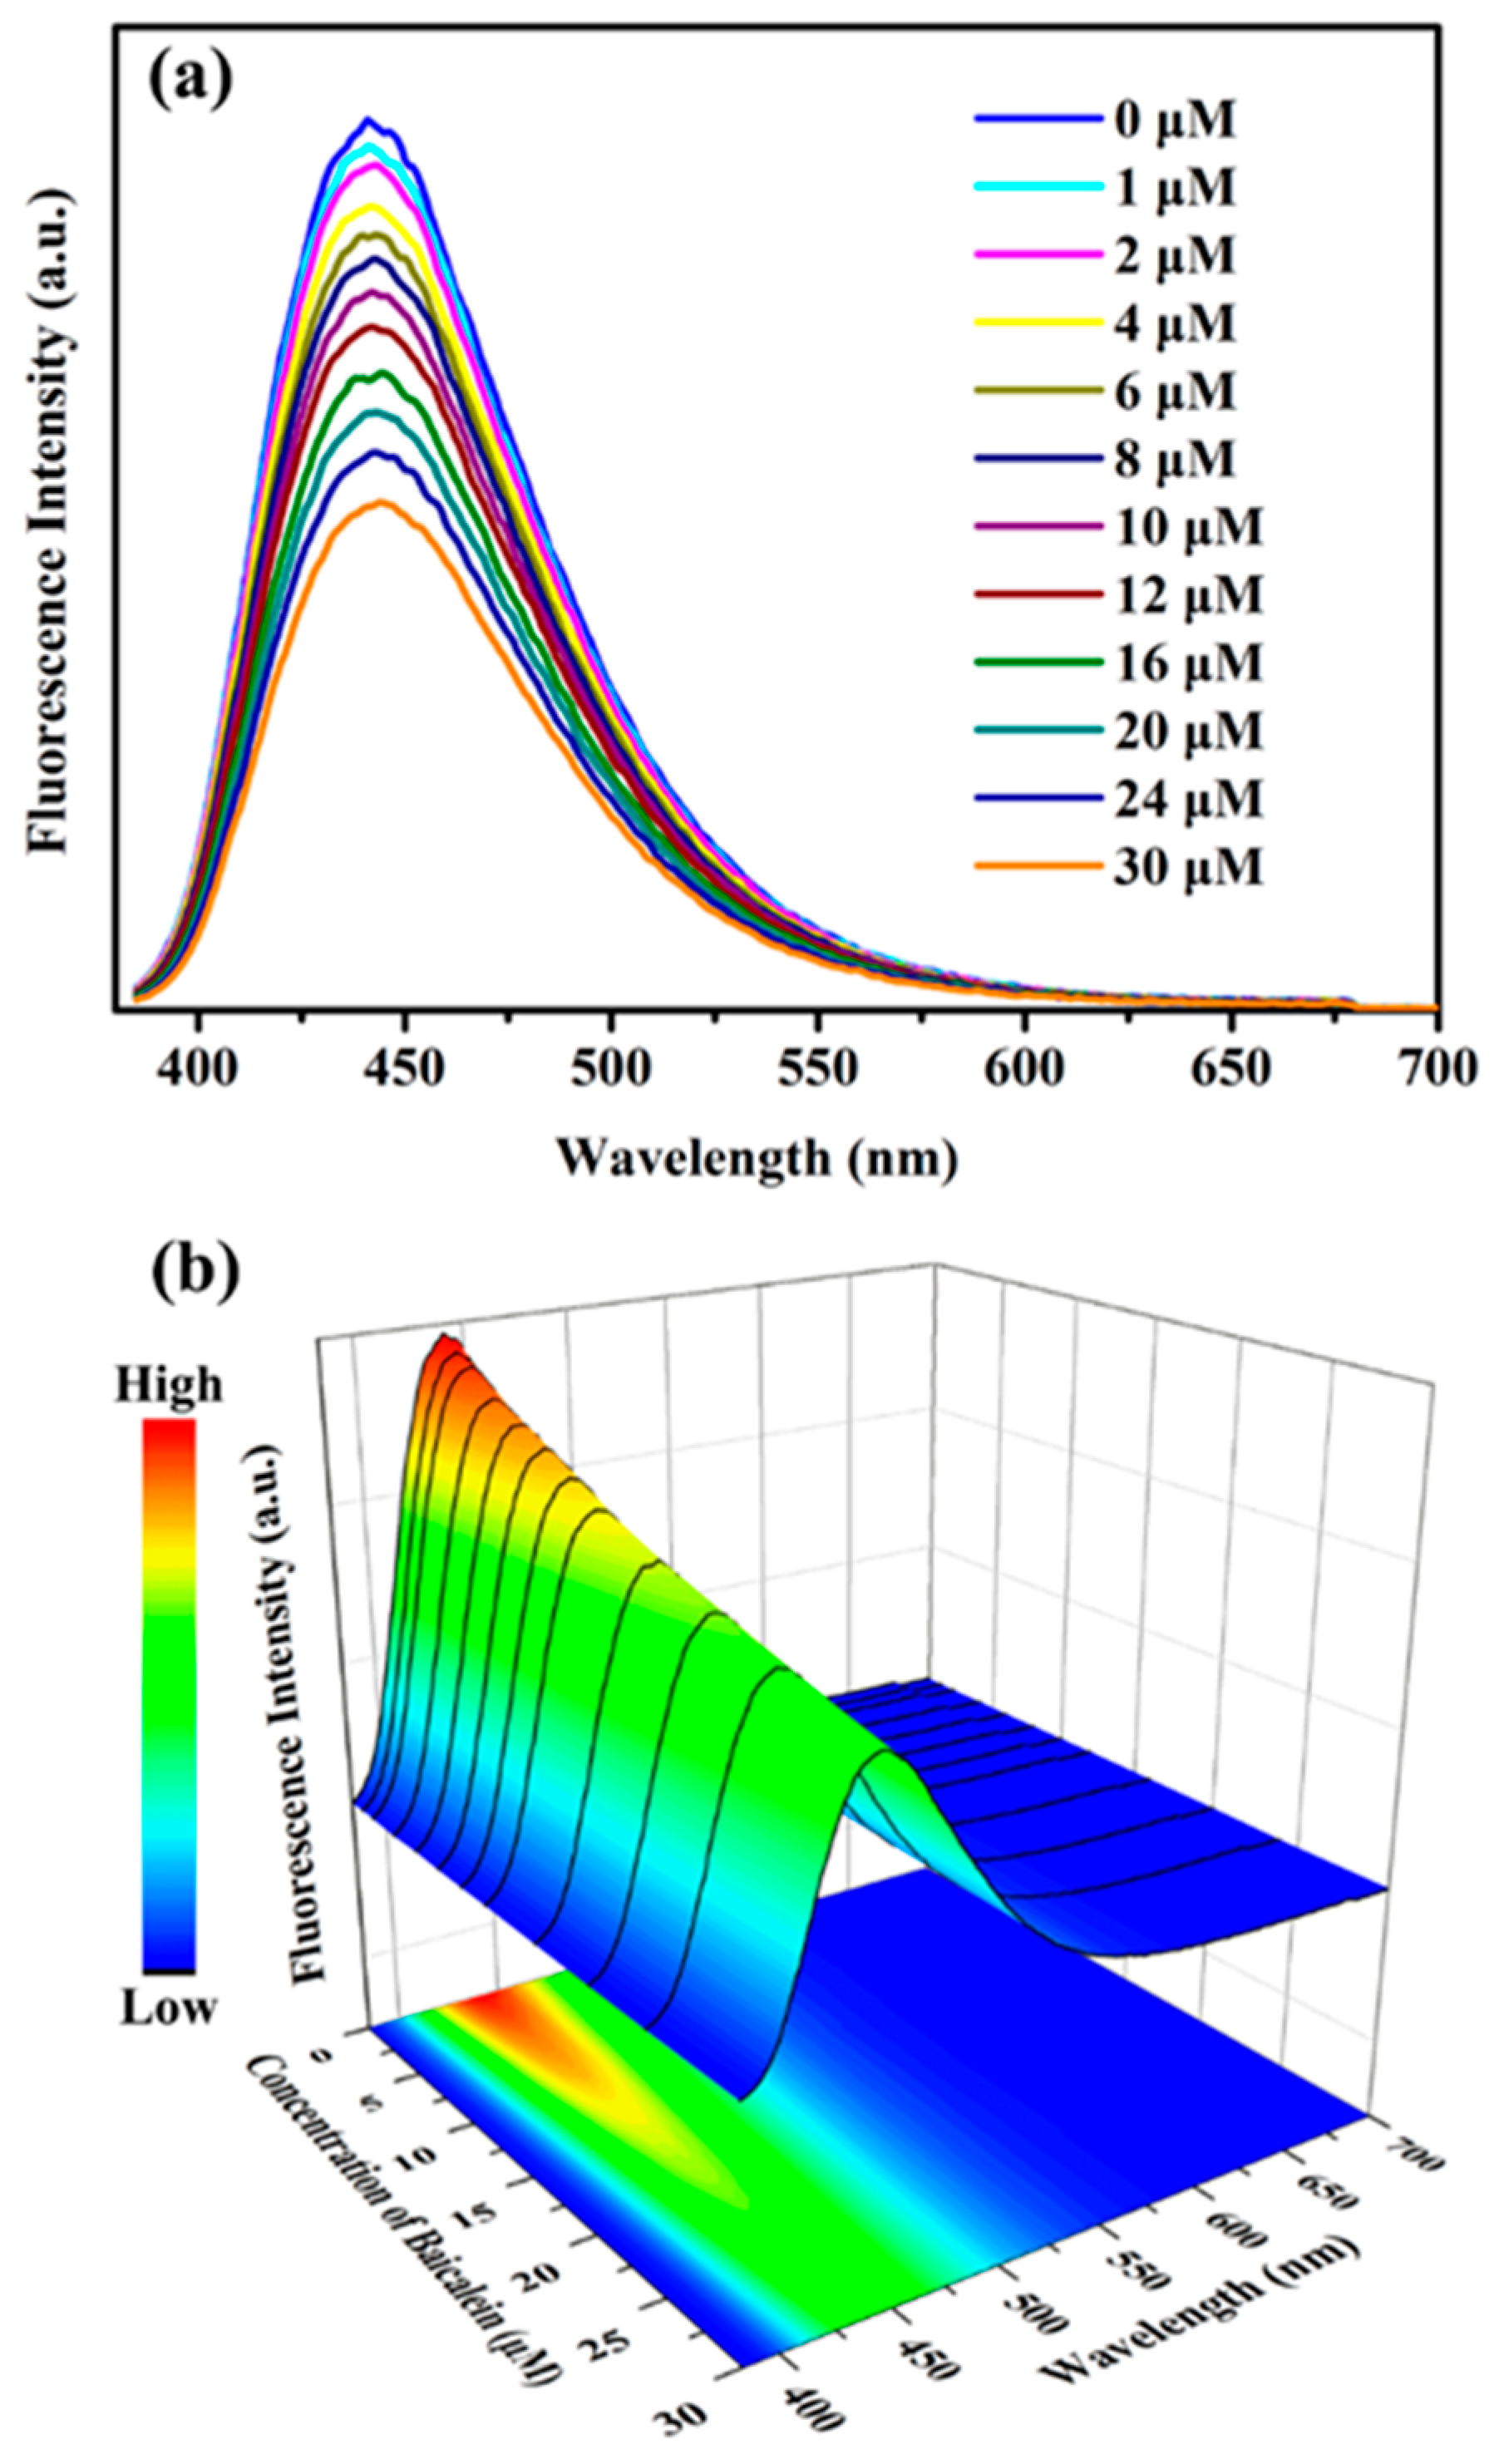
2.4. Baicalein Detection

Following the optimization of detection conditions using cys-CD fluorescence on baicalein, concentrations ranging from 0 μM to 30 μM were measured under optimal conditions (cys-CD concentration: 5 μg mL−1; PBS buffer pH 7.4; reaction time: 10 min). The test results, depicted in Figure 7, illustrated a decrease in the cys-CD fluorescence intensity with an increasing baicalein concentration. The fluorescence intensity corresponding to each baicalin concentration served as the focus of the research.
In Figure 8, the Lineweaver–Burk curve is presented, wherein the integral area of the spectral curve was calculated. The fluorescence intensity differences between the blank and dosing groups, represented as (F0F), were obtained. Their reciprocal (1/(F0F)) demonstrated a strong linear relationship with the reciprocal (1/Cq) of the baicalin concentration, aligning with the Lineweaver–Burk equation: 1 F 0 F = 1 F 0 + K l b F 0 C q , with a linear correlation coefficient (R2) of 0.998.
The detection limit (LOD) for baicalein was calculated to be 33 nM using Equation (1), where N, Q, and I represent the noise level, the injection volume, and the signal value, respectively. Baicalein at a concentration of 10 μM was measured 15 times, resulting in a relative standard deviation (RSD) of 6.82% for this detection method.
L O D = 3 N   ×   Q I

2.5. Mechanism Verification of Baicalein Detection Using cys-CDs

Fluorescence quenching encompasses dynamic and static quenching processes, each with distinct mechanisms [23,24]. Static quenching occurs when a quenching moiety forms a complex with a fluorescent molecule in its ground state, preventing it from transitioning to the excited (fluorescent) state [25,26]. In static quenching, the rate of the decay of the excited state due to fluorescence remains unchanged, meaning that the fluorescence lifetime remains constant [27]. The Lineweaver–Burk equation (Equation (2)) describes static quenching.
F 0 F = 1 + C K SV
Dynamic quenching happens when fluorescent moieties in an excited state collide with other molecules that can interfere with fluorescence, either by facilitating alternative relaxation pathways like energy or charge transfer transitions, causing the excited state to return to its ground state [28,29,30]. Consequently, this alters the duration of the excited state. The Sterm–Volmer equation (Equation (3)) describes dynamic quenching.
1 F 0 F = 1 F 0 + K lb F 0 C q

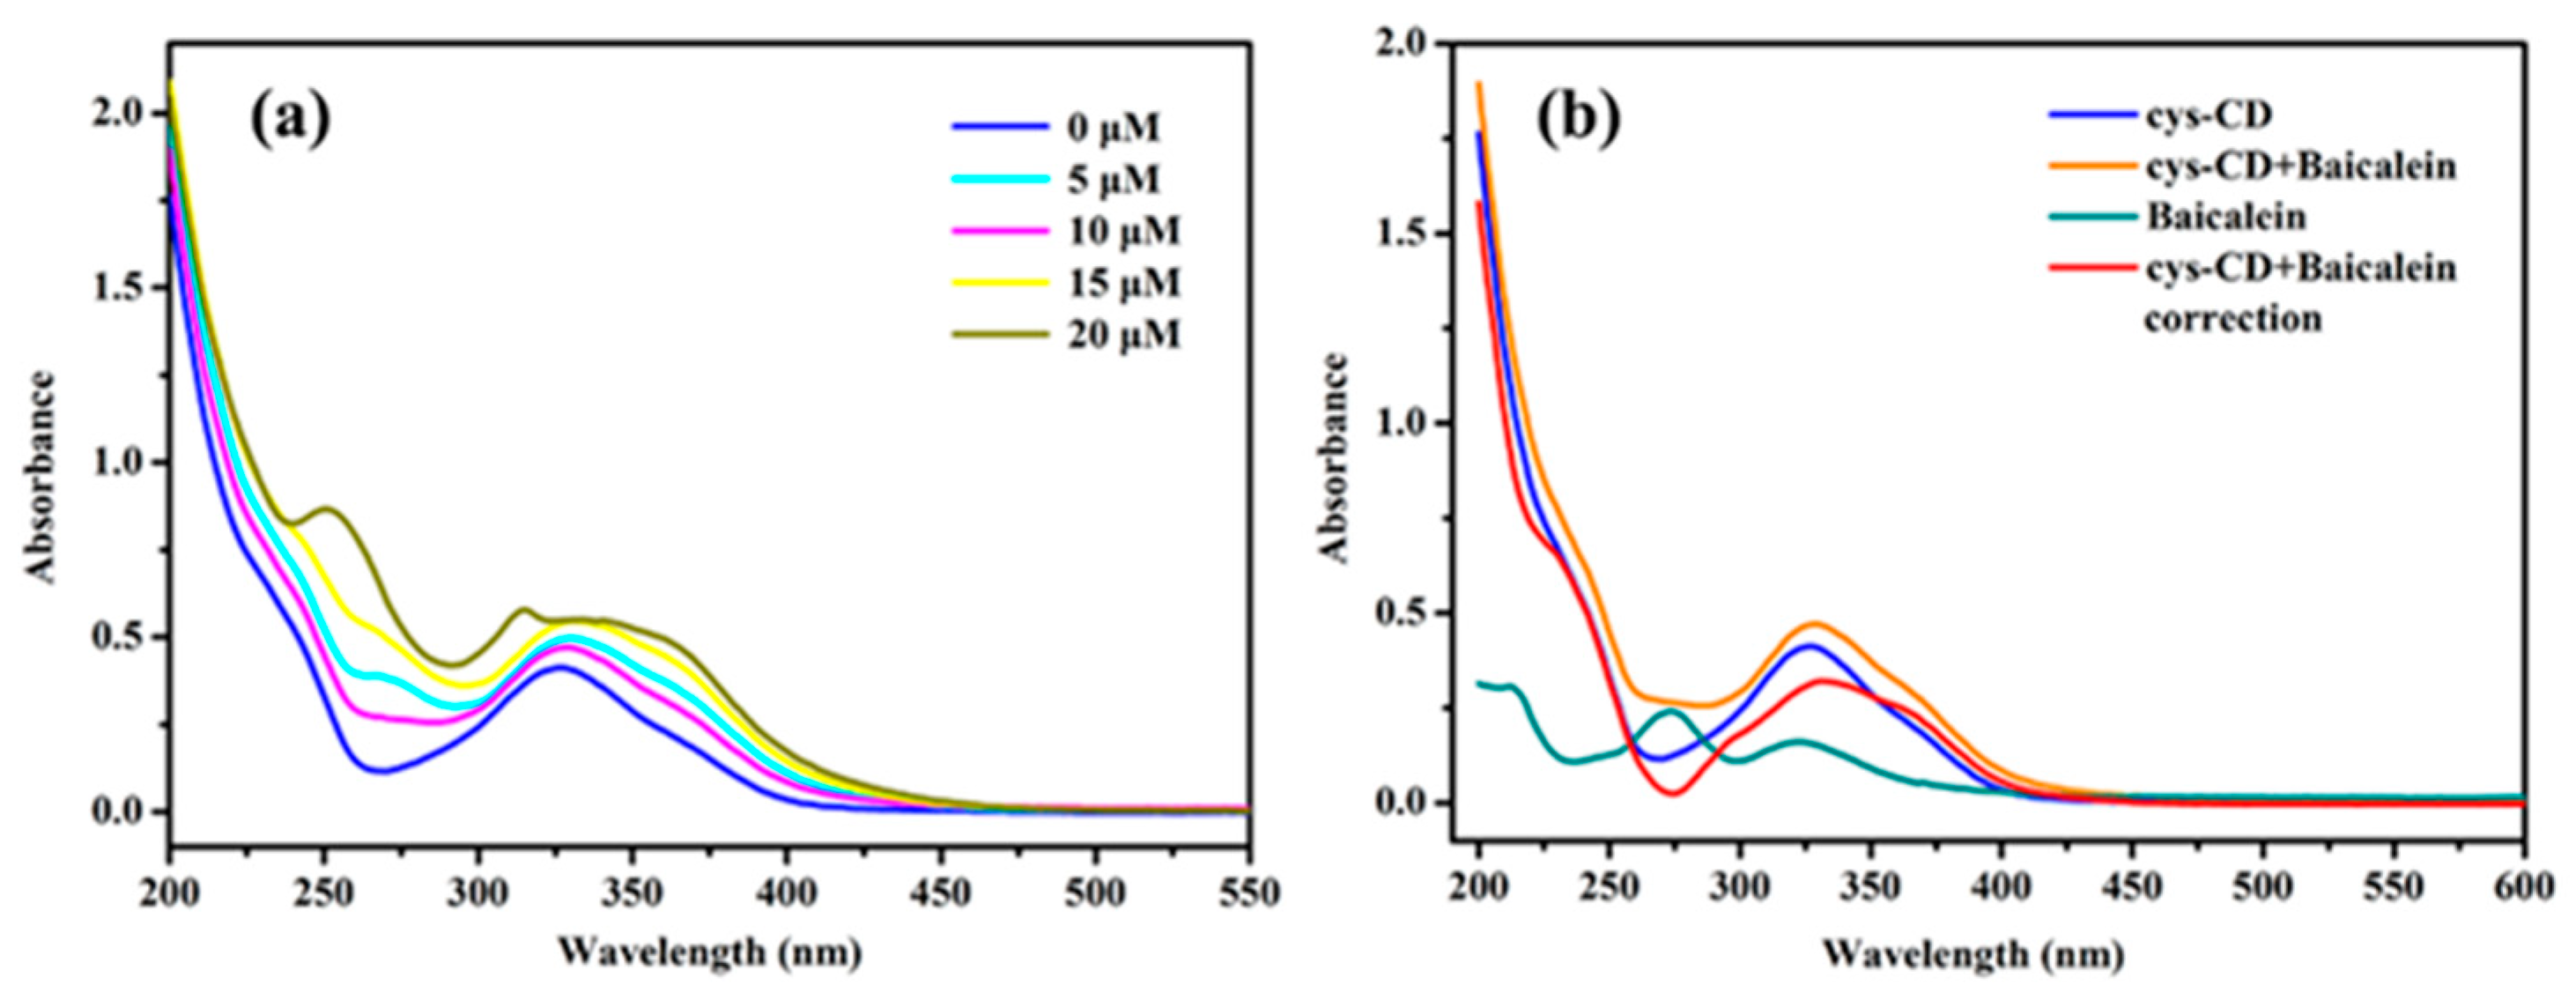
2.6. Fluorescence Inner-Filter Effect

When a system contains both a fluorophore and a non-fluorescent absorber, the absorption spectrum of the absorbing material may coincide with the excitation and emission spectra of the fluorophore [31,32]. This overlap reduces the number of excitation photons reaching the detection volume of the apparatus, leading to a reduced fluorescence intensity. This phenomenon is known as the fluorescence inner-filter effect. For baicalein and cys-CD, the UV-Vis absorption spectrum of baicalein overlaps with the excitation and emission spectra of cys-CD (Figure 9), potentially causing the fluorescence quenching of cys-CD by baicalein.

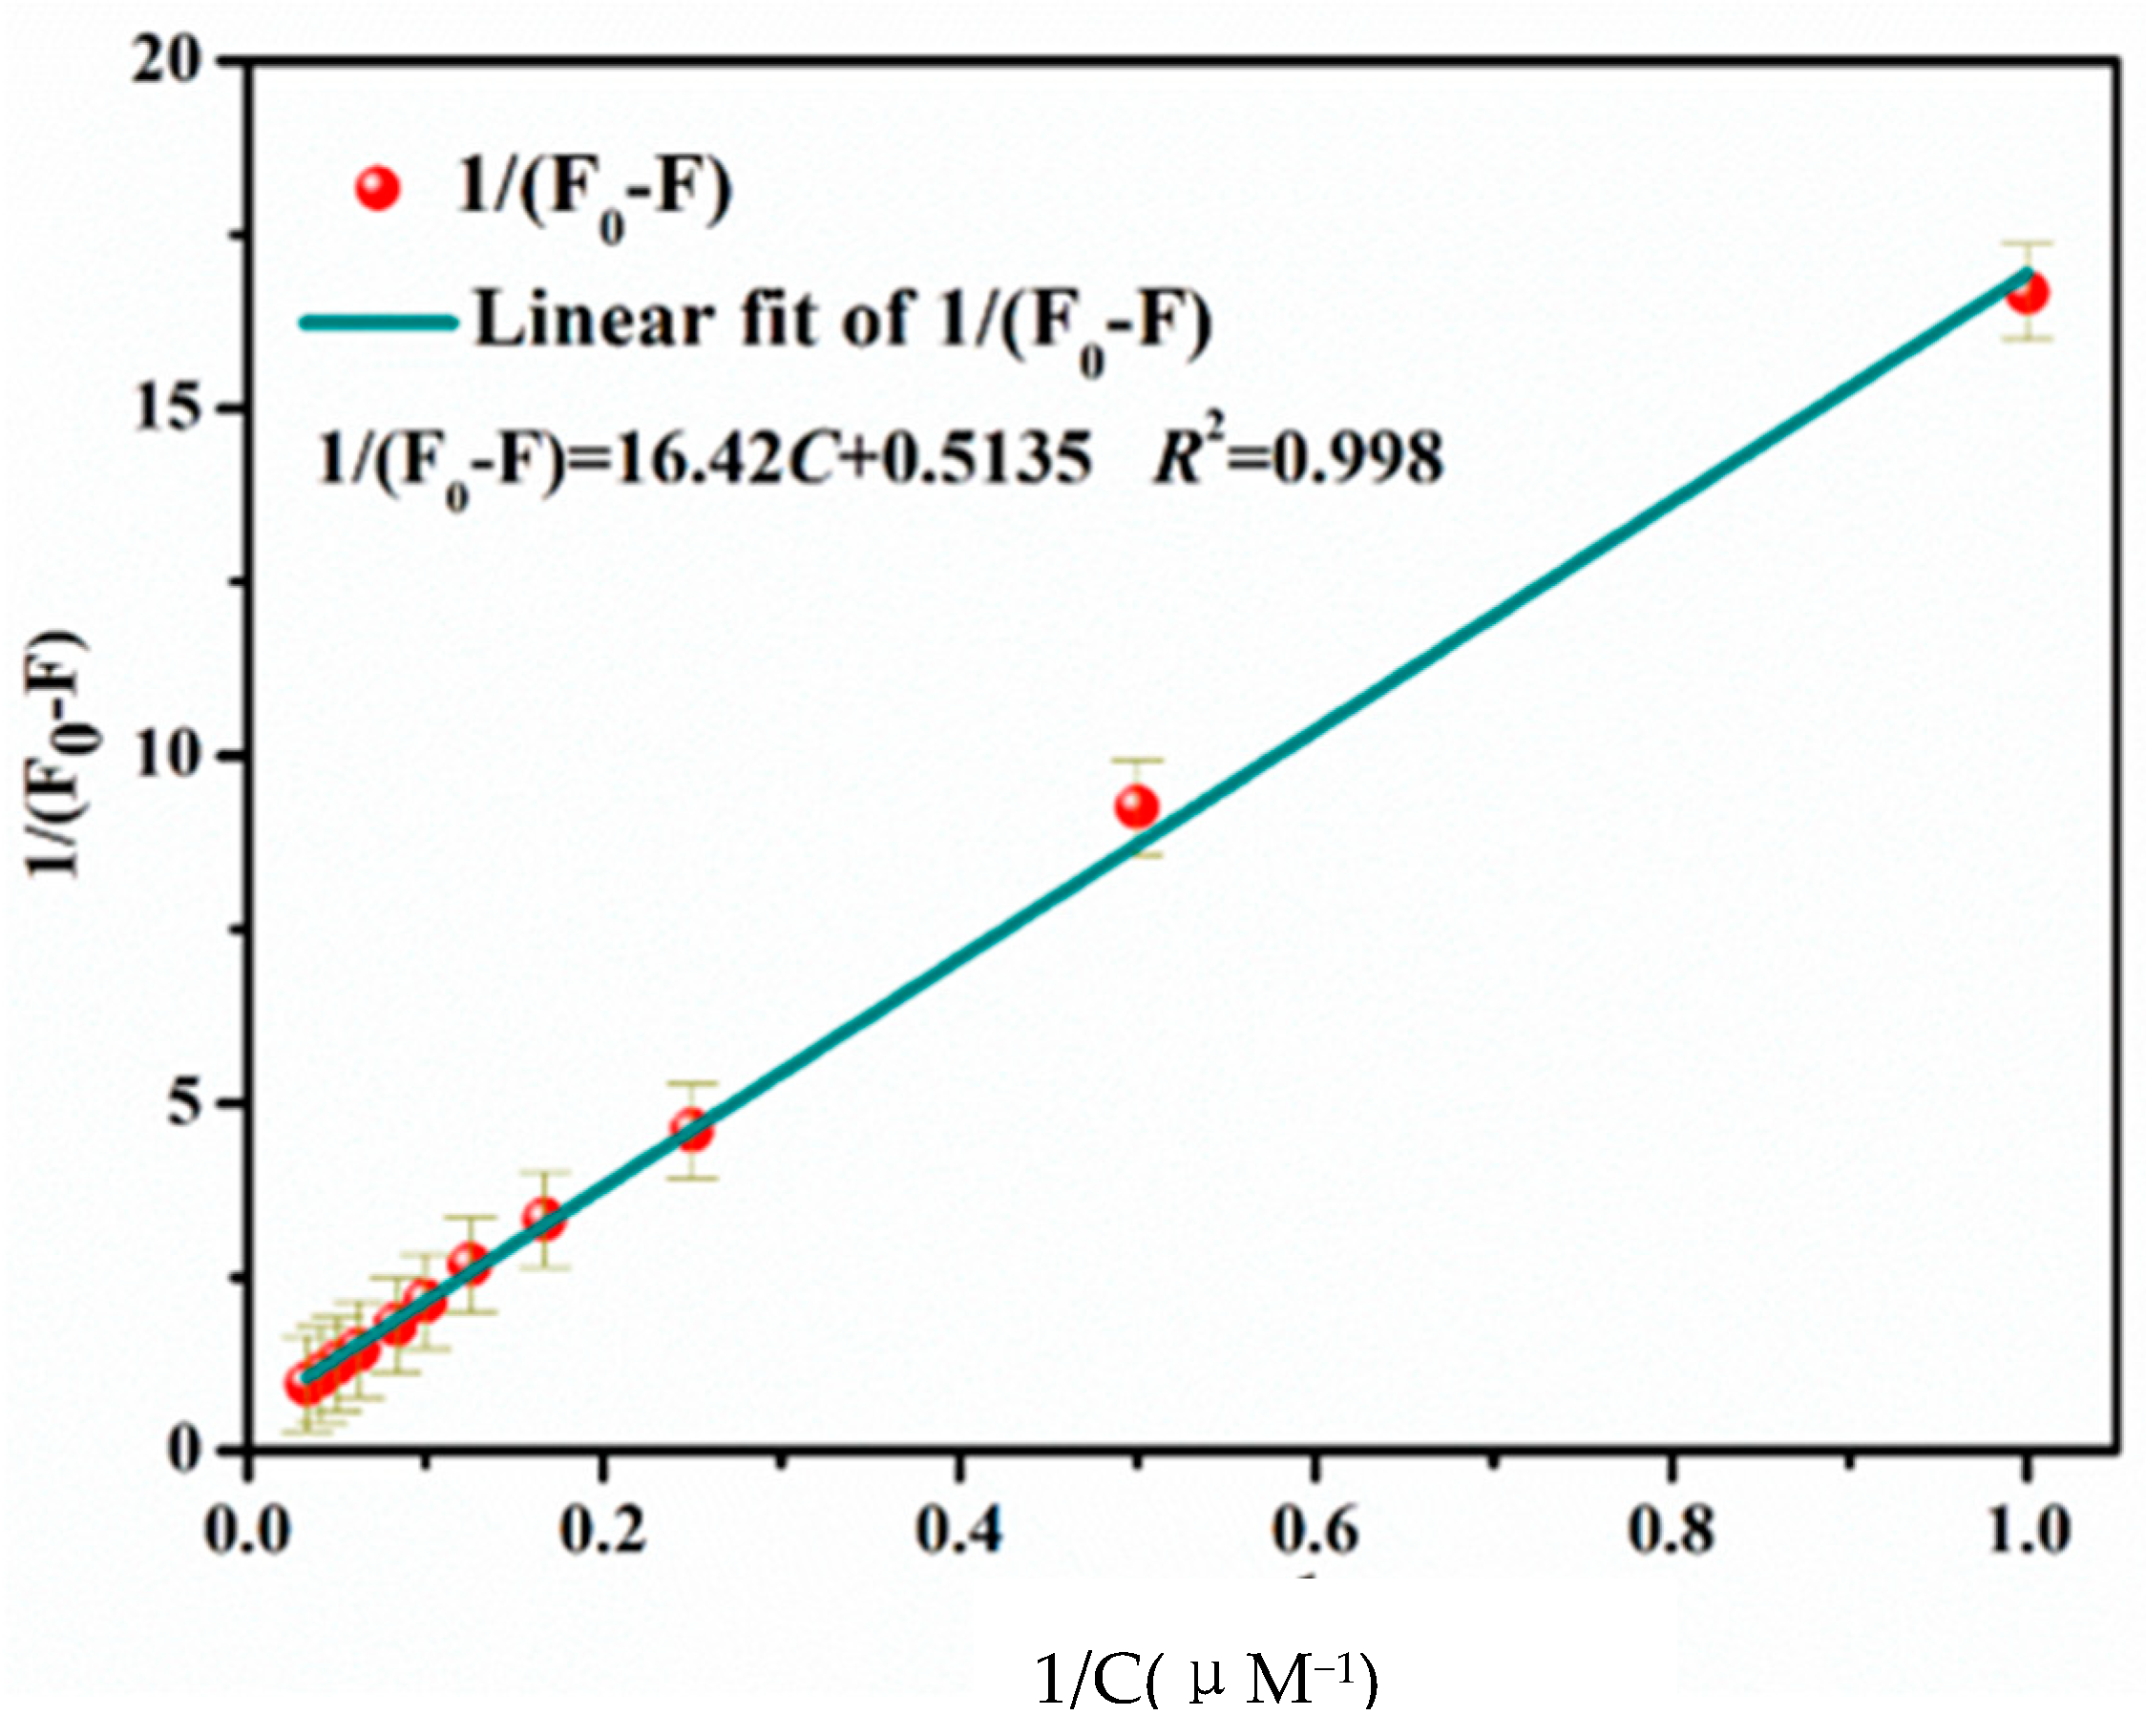
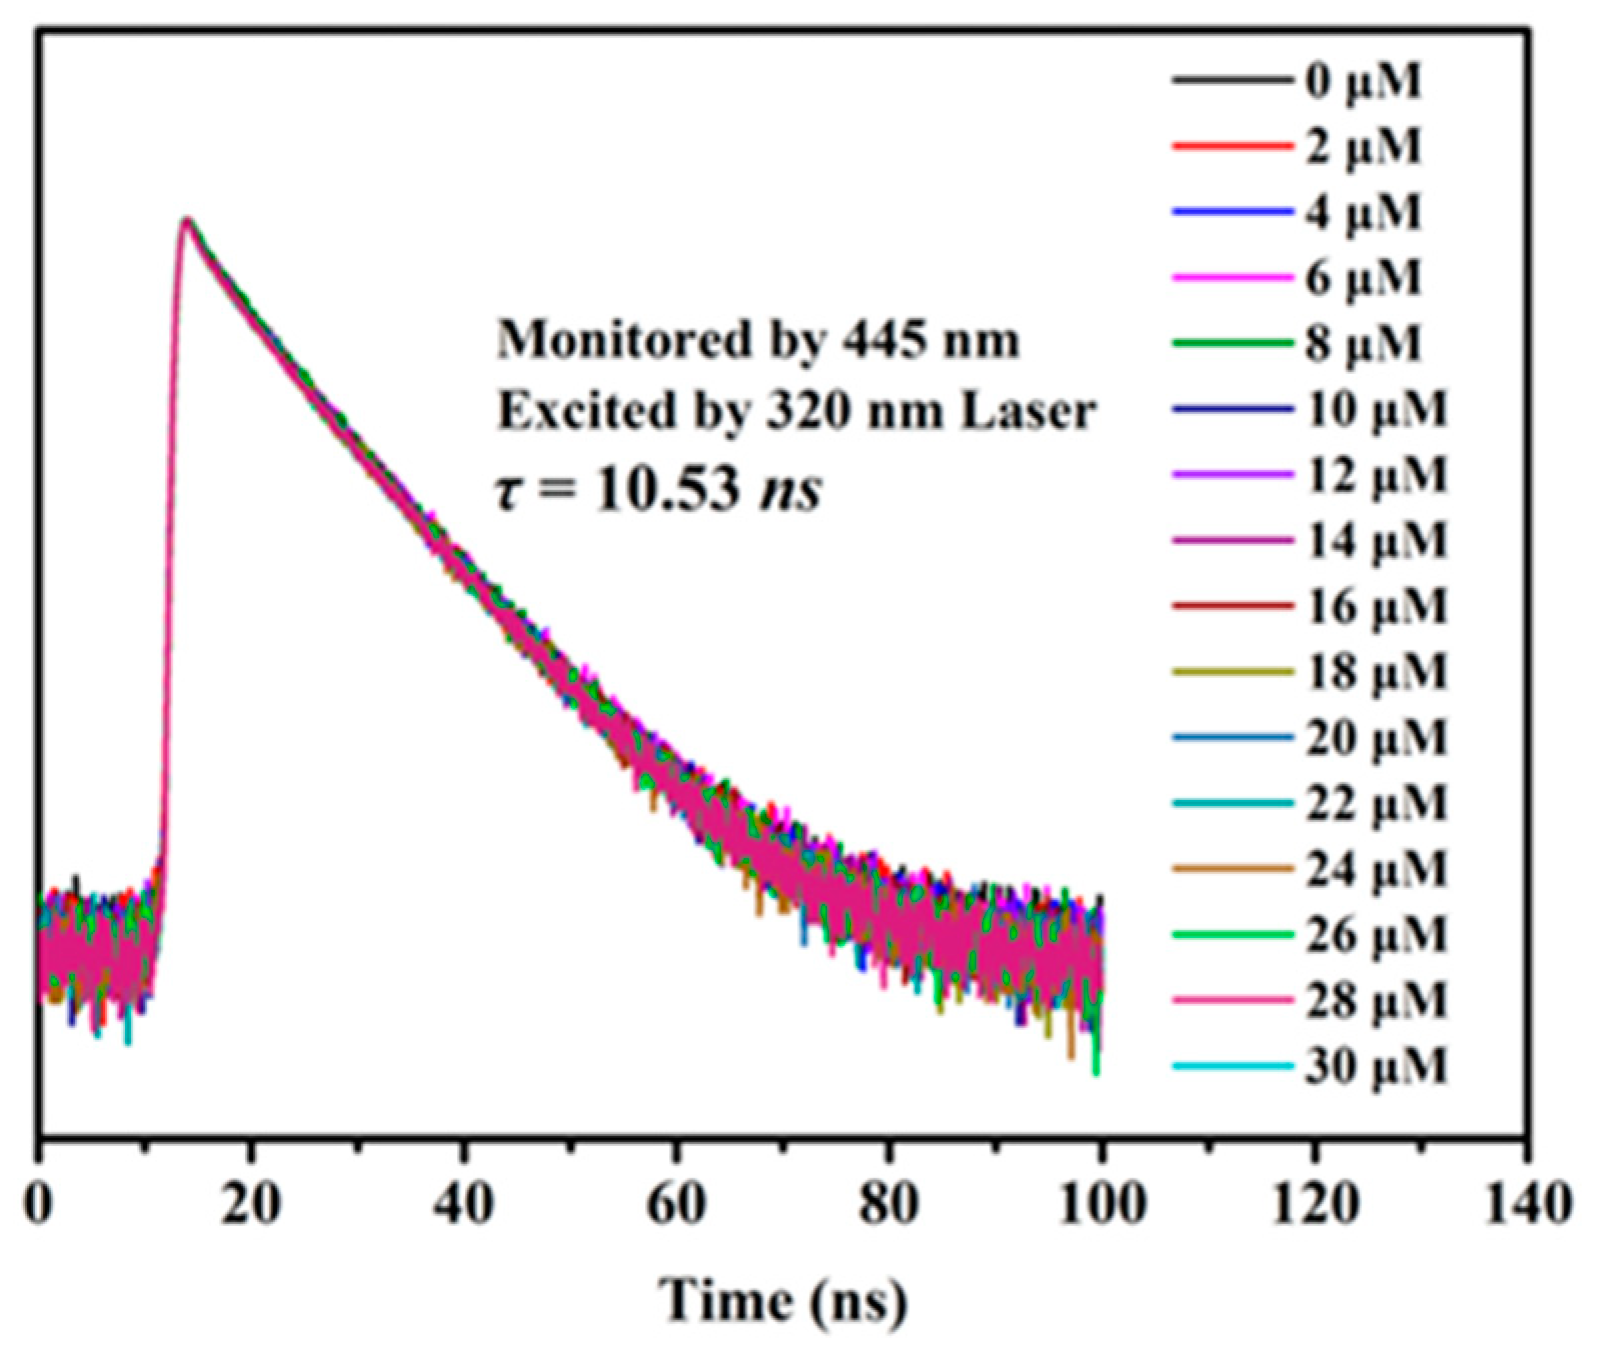
2.7. Static Quenching Effect

From Figure 10, there are three peaks (ca 250 nm p-p* transitions, ca 320 nm, and ca 370 nm n-p* transitions) in the UV-vis spectrum of CDs. The transition of the C=O and C=N groups are both n-p* transitions [33]. Changes in the UV-Vis absorption spectrum of cys-CD were observed before and after the addition of baicalein, as depicted in Figure 10a. Following the addition of baicalein, it was evident that the UV absorption spectrum diverged notably from that of the neat cys-CD solution. Furthermore, the absorption peak broadened, indicating the emergence of new complexes within the system, as illustrated in Figure 10b.
Subsequently, we investigated the impact of the various concentrations of baicalein on the fluorescence lifetime of cys-CD, as shown in Figure 11. In the presence of baicalein within the concentration range of 0–30 μM, the fluorescence lifetime of cys-CD remained virtually constant at 10.53 ± 0.32 ns. This suggests that there was minimal dynamic quenching occurring.
In summary, the experimental findings suggest that the fluorescence quenching of cys-CD by baicalein is attributable to both static quenching and an inner-filter effect.

2.8. Baicalein Detection in Biological Samples

In this experiment, we employed the standard sampling method. We spiked human urine and blood samples with baicalein at known concentrations and compared them to the measured concentrations. This process verified the feasibility of detecting baicalein using cys-CD in real-world samples [34]. The recovery values of this detection method in human urine and blood samples ranged from 97.10% to 98.19% and from 101.93% to 103.49%, respectively (Table 1). These results demonstrate the reliability of our baicalein detection method.

3. Materials and Methods

3.1. Baicalein Detection Methods

Baicalein, the primary active ingredient found in Scutellaria baicalensis, serves as a crucial indicator for evaluating the quality of this herb. Currently available methods for measuring baicalein content primarily include spectrometry, chromatography, and biological methods. Below, we outline the advantages and disadvantages of each approach:

3.1.1. UV-Vis Spectrophotometry

UV-Vis spectrophotometry is a commonly employed technique for quantifying baicalein content. It relies on the absorption characteristics of baicalein at specific wavelengths, typically set at 260 nm. This method is straightforward and requires minimal sample pre-treatment. However, in real-world applications, accuracy can be compromised by interference from the sample matrix. Consequently, prior to measurement, samples must undergo pre-treatment to mitigate this interference.

3.1.2. Mass Spectrometry

Mass spectrometry (MS) is a method used to determine the structure and mass–charge ratio of molecular fragments. It finds extensive application in detecting the content of baicalein. Liquid chromatography–mass spectrometry, including LC-MS/MS, and gas chromatography–mass spectrometry (GC-MS) are commonly employed for this purpose. Mass spectrometry allows for the direct detection of molecular information pertaining to baicalein, even in complex samples, without being affected by interference from other substances. Consequently, the measurement results are highly accurate and reliable. However, this method requires sophisticated facilities and precise operational procedures. Additionally, it is relatively costly, making it less commonly used in general experiments.

3.1.3. High-Performance Liquid Chromatography

High-performance liquid chromatography (HPLC) stands out as one kind of the most commonly used and highly accurate methods for detecting baicalein content. This method primarily relies on a reverse-chromatographic column for separation, utilizing an ethanol-water mixture as the mobile phase. The determination process involves both gradient elution and isothermal elution. Typically, a UV detector set at 254 nm is employed for testing, ensuring accurate and reliable results across a broad range of applications.
However, this method notably demands sophisticated facilities and precise operational procedures. Throughout the detection process, strict control over various factors is essential to maintain the accuracy and reliability of the test results. The baicalein content detection method described in this manuscript utilizes HPLC.

3.2. Reagents and Equipment

The reagents used in these experiments are listed in Table 2.
The used instruments are outlined in Table 3.

3.3. Synthesis and Purification of Blue-Fluorescent S, N-co-Doped CDs (cys-CD)

L-cysteine served as a source of carbon, nitrogen, and sulfur, while sodium citrate acted as a secondary carbon source. Ethylenediamine (EDA) was utilized to control the shape [35]. The specific synthesis steps for cys-CD are outlined below: Initially, 0.2 g of L-cysteine and 0.2 g of sodium citrate were weighed and dissolved in 10 mL of ultrapure water. Subsequently, 500 μL of anhydrous EDA was added to the mixture, which was then sonicated for 5 min. The resulting colorless and transparent mixture was transferred to a 40 mL polytetrafluoroethylene (PTFE) reactor lining within a stainless steel hydrothermal reactor. This assembly was heated in an electric blast drying oven at 200 °C for 4 h. Once the reaction was complete, the mixture was allowed to cool and then filtered using a 0.22 μm Millipore filter. The filtrate was then poured into a dialysis bag with a 1000 Da molecular weight cut-off (MWCO) and dialyzed at 4 °C for 48 h to obtain purified cys-CD. To further investigate the relationship between CD concentration and fluorescence properties, the purified cys-CD underwent freeze-drying for 24 h. Finally, the resulting freeze-dried cys-CD powder was dissolved in ultrapure water, adjusted to a concentration of 20 mg mL–1, and stored at 4 °C for subsequent use.

3.4. Fluorescence Properties of cys-CD

To ensure a consistent comparison of the experimental results, the fluorescence properties of cys-CD solutions were examined using an FLS980 fluorometer under standardized conditions. A solution of cys-CD (3 mL) was added to a cuvette. The excitation wavelength was 365 nm. The slit width was 1.2 nm. The residence time was set at 0.1 s to record the emission spectrum over the wavelength range of 380–700 nm.
Aqueous solutions of cys-CDs were prepared at 100 and 2000 μg mL−1. For spectral testing, 3 mL of the 100 μg mL−1 concentration was used. The excitation wavelength range tested spanned from 325 to 395 nm.
NaCl solution (0–400 mM) was used to prepare the cys-CD solution (100 μg mL−1) used for the fluorescence spectra scanning. NaOH (2 M) and HCl (1 M) solutions were used to adjust the pH of the PBS buffer between 2 and 12. PBS solutions at different pH levels were used to prepare the cys-CD solution (100 μg mL−1); 3 mL of this solution was then used for fluorescence spectra scanning.
The same solution sample was irradiated by exposure to a UV lamp (365 nm, 12 W) for 24 h before being used for the fluorescence spectral testing. Simultaneously, a cys-CD solution (2000 μg mL−1) was stored at 4 °C for 90 days and subsequently used for the fluorescence spectral testing.

3.5. cys-CD Fluorescence Quantum Yield

The fluorescence quantum yield (FQY) of a material refers to the ratio of the absorbed photons to the emitted photons via fluorescence, typically measured at a specific excitation wavelength. This parameter is crucial for evaluating the photoelectric conversion capability of fluorescent materials, with higher values indicating superior optical properties. In this test, a comparative measurement method was employed using quinine sulfate (FQY = 0.56) as the standard reference. The emission and UV-Vis spectra of both quinine sulfate and cys-CD were recorded, followed by the calculation of the quantum yield of cys-CD using Equation (4),
F Q Y x = F Q Y s t × I x I s t × η x 2 η x t 2 × A s t A x
where x represents the sample, st is the standard (e.g., quinine sulfate), I is the integral of the fluorescence emission spectrum, η is the solvent refractive index, and A is absorbance.

3.6. Fluorescence Lifetime

We utilized an FLS980 transient steady-state fluorometer for our experiment, employing a 320 nm laser for excitation. The monitoring wavelength was set at 442 nm to measure the fluorescence lifetime of cys-CD. Equation (5) was used to calculate the fluorescence lifetime.
I t = I 0 +   A 1 exp t τ 1 +   A 2 exp t τ 2
In Equation (5), I(t) is the fluorescence intensity of the sample at 442 nm. I0 is the initial fluorescence intensity at t = 0. A is the fluorescence lifetime constant. τ is the fluorescence lifetime decaying exponential. The average fluorescence lifetime (τ*) was then calculated using Equation (6).
τ = 0 tI t dt 0 I t dt

3.7. Optimization of Baicalein Measurement Conditions

3.7.1. Effect of cys-CD Concentration

To examine how the concentration of cys-CD affects the sensitivity of the baicalein response, we prepared aqueous solutions of cys-CD at the concentrations of 30, 40, 50, 60, and 70 μg mL−1, each totaling 500 μL. To these solutions, 2 mL of absolute ethanol was added. Subsequently, 2 mL of PBS buffer at pH 7.4 was thoroughly mixed. This resulting buffer was then combined with a baicalein ethanol solution (1 mM) in various volumes, with the total volume kept constant at 5 mL by adding absolute ethanol as necessary. The concentration of the baicalein in the test samples ranged from 0 to 20 μM. After thorough mixing, the solution was allowed to equilibrate for 10 min, following which its fluorescence spectrum was measured.

3.7.2. In Vitro pH Effects

To investigate how pH affects the fluorescence of cys-CD in detecting baicalein, we prepared multiple 4 mL solutions by combining 2 mL of absolute ethanol with 2 mL of PBS buffer at pH 7.4. We adjusted the pH of each solution to 4, 5, 6, 7, 8, 9, 10, and 11 by adding small amounts of 2 M NaOH and 1 M HCl solutions. Then, 4 mL of each solution was mixed with 500 μL of cys-CD solution (50 μg mL−1) and varying volumes of baicalein ethanol solution (1 mM). To maintain a constant volume of 5 mL, absolute ethanol was added accordingly. After thorough mixing, the samples were allowed to equilibrate for 10 min before measuring the fluorescence spectrum.

3.7.3. Effect of Reaction Time

To investigate how reaction time influences baicalein detection, we set the cys-CD concentration to 5 μg mL−1 and the baicalein concentration to 10 μM. The experiment was conducted at pH 7.4. Following the addition of the baicalein, we measured the fluorescence spectrum at various time intervals ranging from 0 to 60 min.

3.7.4. Effect of Ionic Strength

To investigate how ionic strength influences the detection of baicalein, we prepared solutions containing 5 μg mL−1 cys-CD and 10 μM baicalein at pH 7.4. We then added NaCl to achieve the concentrations of 0, 25, 50, 100, 200, and 400 mM, respectively. After shaking and allowing the solutions to equilibrate for 10 min, we measured the fluorescence spectrum.

3.7.5. Baicalein Detection

First, a 500 μL aliquot of a cys-CD aqueous solution at 50 μg mL−1 concentration was combined with 2 mL of absolute ethanol. Subsequently, 2 mL of PBS buffer (pH 7.4) was thoroughly mixed and added to varying volumes of a baicalein (1 mg mL−1) ethanol solution at 1 mg mL–1 concentration. Absolute ethanol was added to maintain a constant total volume of 5 mL. The resulting baicalein test solutions were prepared across concentrations ranging from 0 to 30 μM. After shaking and allowing for a 10 min equilibration period, the fluorescence spectra of each solution were recorded.

3.8. Mechanism of Baicalein Detection

3.8.1. Effect of Baicalein on cys-CD UV-Vis Absorbance Spectrum

A solution containing cys-CD (50 μg mL−1) was mixed with the baicalein solutions of different concentrations (0, 5, 10, 15, and 20 μM) for 10 min. Subsequently, the UV-Vis absorption spectrum was recorded over the wavelength range of 200–700 nm.

3.8.2. Effect of Baicalein on cys-CD Fluorescence Lifetime

Aqueous solutions containing cys-CD at a concentration of 50 μg mL−1 were exposed to the baicalein solutions of concentrations ranging from 0 to 30 μM for 10 min. Subsequently, the fluorescence lifetime was determined under identical conditions outlined in Section 3.8.1.

3.8.3. Detection of Baicalein in Urine and Blood Using cys-CD

In this experiment, we used urine and blood samples from healthy volunteers to investigate the relationship between the concentration of the added baicalein and the resulting concentration detected.
For urine samples, we began by centrifuging them for 15 min at 8000 rpm, then preserving the supernatant. This supernatant was then diluted 500 times with ultrapure water and stored in the refrigerator until needed.
Blood plasma samples were mixed with acetonitrile in a 1:1 ratio, followed by a 5 min equilibration period to remove proteins. After centrifugation for 10 min at 10,000 rpm, the supernatant was extracted and filtered using a polyethersulfone (PES) ultrafiltration membrane with a pore diameter of 0.45 μm. The resulting filtrate was diluted 100 times in PBS buffer (pH 7.4) and was refrigerated until use.
Using the standard addition method, we added baicalein standard solutions to both urine and blood samples. Finally, we measured the concentration of each mixture.

4. Conclusions

L-cysteine and sodium citrate were utilized as raw materials in the hydrothermal synthesis process to produce blue-fluorescent S, N-co-doped carbon dots (cys-CDs). These cys-CDs exhibited a remarkably high fluorescence quantum yield of 0.66. The characterization of the material was performed using various techniques including TEM, FTIR, XPS, UV-Vis, and PL/PLE, to analyze particle size distribution, structural composition, and fluorescence properties.
A rapid, simple, and sensitive method for detecting baicalein was developed based on the static-quenching effect of baicalein on cys-CD fluorescence. Baicalein concentrations within the concentration range of 0–30 μM exhibited a linear relationship with the extent of cys-CD fluorescence quenching, with a detection limit of 33 nM. This approach was successfully applied to detect baicalein in human urine and blood samples, yielding satisfactory recovery concentrations.
In summary, we introduced an environmentally sustainable and efficient method for synthesizing and purifying cys-CDs. Additionally, we conducted a preliminary investigation into the potential application of cys-CDs for drug testing. These findings suggest promising applications of cys-CDs in pharmaceutical, biosecurity, and medical imaging contexts.

Author Contributions

Conceptualization, Y.C. and G.Y.; methodology, G.Y.; software, Y.H.; validation, G.Y.; formal analysis, G.Y.; investigation, Y.C.; resources, Y.H.; data curation, G.Y.; writing—original draft preparation, G.Y.; writing—review and editing, G.Y.; visualization, Y.C.; supervision, Y.H.; project administration, Y.C.; funding acquisition, Y.H. All authors have read and agreed to the published version of the manuscript.

Funding

This research was aided by the key area campaign of regular universities, No. 2021ZDZX1058. Guangdong Basic and Applied Basic Research Foundation, No. 2023A1515240063. Guangdong universities featured innovation project, No. 2022KTSCX194.

Data Availability Statement

Data are contained within the article.

Conflicts of Interest

The authors declare no conflicts of interest.

References

  1. Zhang, Y.; Yao, H.; Xu, Y.; Xia, Z. Synergistic Weak/Strong Coupling Luminescence in Eu-Metal-Organic Framework/Zn2GeO4:Mn2+ Nanocomposites for Ratiometric Luminescence Thermometer. Dyes Pigments 2018, 157, 321–327. [Google Scholar] [CrossRef]
  2. Zhou, Y.; Zhang, D.; Zeng, J.; Gan, N.; Cuan, J. A Luminescent Lanthanide-Free MOF Nanohybrid for Highly Sensitive Ratiometric Temperature Sensing in Physiological Range. Talanta 2018, 181, 410–415. [Google Scholar] [CrossRef] [PubMed]
  3. Gharari, Z.; Bagheri, K.; Danafar, H.; Sharafi, A. Simultaneous Determination of Baicalein, Chrysin and Wogonin in Four Iranian Scutellaria species by High Performance Liquid Chromatography. J. Appl. Res. Med. Aromat. Plants 2020, 16, 100232. [Google Scholar] [CrossRef]
  4. Zhang, X.; Zhu, Z.; Guo, Z.; Sun, Z.; Chen, Y. A Ratiometric Optical Thermometer with High Sensitivity and Superior Signal Discriminability Based on Na3Sc2P3O12: Eu2+, Mn2+ Thermochromic Phosphor. Chem. Eng. J. 2019, 356, 413–422. [Google Scholar] [CrossRef]
  5. Zhang, X.; Zhu, Z.; Guo, Z.; Sun, Z.; Yang, Z.; Zhang, T.; Zhang, J.; Wu, Z.C.; Wang, Z. Dopant Preferential Site Occupation and High Efficiency White Emission in K2BaCa(PO4)2:Eu2+,Mn2+ Phosphors for High Quality White LED Applications. Inorg. Chem. Front. 2019, 6, 1289–1298. [Google Scholar] [CrossRef]
  6. Bai, Y.M.; Mao, J.; Li, D.X.; Luo, X.J.; Chen, J.; Tay, F.R.; Niu, L.N. Bimodal Antibacterial System Based on Quaternary Ammonium Silane-Coupled Core-Shell Hollow Mesoporous Silica. Acta Biomater. 2019, 85, 229–240. [Google Scholar] [CrossRef] [PubMed]
  7. An, G.S.; Shin, J.R.; Hur, J.U.; Oh, A.H.; Kim, B.; Jung, Y.; Choi, S. Fabrication of Core-Shell Structured Fe3O4@Au Nanoparticle via Self-Assembly Method Based on Positively Charged Surface Silylation/Polymerization. J. Alloys Compd. 2019, 798, 360–366. [Google Scholar] [CrossRef]
  8. Bardi, B.; Tosi, I.; Faroldi, F.; Baldini, L.; Sansone, F.; Sissa, C.; Terenziani, F. A Calixarene-Based Fluorescent Ratiometric Temperature Probe. Chem. Commun. 2019, 55, 8098–8101. [Google Scholar] [CrossRef] [PubMed]
  9. Wu, Z.; Tan, B.; Velasco, E.; Wang, H.; Shen, N.N.; Guo, Y.J.; Zhang, X.; Zhu, K.; Zhang, G.Y.; Liu, Y.Y.; et al. Fluorescent in Based MOFs Showing “Turn On” Luminescence towards Thiols and Acting as a Ratiometric Fluorescence Thermometer. J. Mater. Chem. C 2019, 7, 3049–3055. [Google Scholar] [CrossRef]
  10. Macairan, J.R.; Jaunky, D.B.; Piekny, A.; Naccache, R. Intracellular Ratiometric Temperature Sensing Using Fluorescent Carbon Dots. Nanoscale Adv. 2019, 1, 105–113. [Google Scholar] [CrossRef]
  11. Liu, X.; Liu, J.; Zhou, H.; Yan, M.; Liu, C.; Guo, X.; Xie, J.; Li, S.; Yang, G. Ratiometric Dual Fluorescence Tridurylboron Thermometers with Tunable Measurement Ranges and Colors. Talanta 2020, 210, 120630. [Google Scholar] [CrossRef]
  12. Yin, P.; Niu, Q.; Yang, Q.; Lan, L.; Li, T. A New “Naked-Eye” Colorimetric and Ratiometric Fluorescent Sensor for Imaging Hg2+ in Living Cells. Tetrahedron 2019, 75, 130687. [Google Scholar] [CrossRef]
  13. Wu, X.Y.; Zhao, Q.; Zhang, D.X.; Liang, Y.C.; Zhang, K.K.; Liu, Q.; Dong, L.; Shan, C.X. A Self-Calibrated Luminescent Thermometer Based on Nanodiamond-Eu/Tb Hybrid Materials. Dalton Trans. 2019, 48, 7910–7917. [Google Scholar] [CrossRef] [PubMed]
  14. Gao, H.; Kam, C.; Chou, T.Y.; Wu, M.Y.; Zhao, X.; Chen, S. A Simple yet Effective AIE-Based Fluorescent Nano-thermometer for Temperature Mapping in Living Cells Using Fluorescence Lifetime Imaging Microscopy. Nanoscale Horiz. 2020, 5, 488–494. [Google Scholar] [CrossRef]
  15. He, S.; Qi, S.; Sun, Z.; Zhu, G.; Zhang, K.; Chen, W. Si, N-codoped Carbon Dots: Preparation and Application in Iron Overload Diagnosis. J. Mater. Sci. 2019, 54, 4297–4305. [Google Scholar] [CrossRef]
  16. Xia, W.; Zhang, W. Characterization of surface properties of Inner Mongolia coal using FTIR and XPS. Energy sources part a-recovery utilization and environmental effects. Energy Sources Part A Recover. Util. Environ. Eff. 2017, 39, 1190–1194. [Google Scholar]
  17. Zhu, S.J.; Meng, Q.N.; Wang, L.; Zhang, J.; Song, Y.; Jin, H.; Zhang, K.; Sun, H.; Wang, H.; Yang, B. Highly photoluminescent carbon dots for multicolor pattrening, sensors, and bioimaging. Angew. Commun. 2013, 52, 3953–3957. [Google Scholar] [CrossRef] [PubMed]
  18. Ye, Y.; Yang, D.; Chen, H.; Guo, S.; Yang, Q.; Chen, L.; Zhao, H.; Wang, L. A high-efficiency corrosion inhibitor of N-doped citric acid-based carbon dots for mild steel in hydrochloric acid environment. J. Hazard. Mater. 2019, 2020, 121019. [Google Scholar] [CrossRef]
  19. Wang, C.; Wang, Y.; Shi, H.; Yan, Y.; Liu, E.; Hu, X.; Fan, J. A strong blue fluorescent nanoprobe for highly sensitive and selective detection of mercury(II) based on sulfur doped carbon quantum dots. Mater. Chem. Phys. 2019, 232, 145–151. [Google Scholar] [CrossRef]
  20. Guo, D.; Dong, Z.; Luo, C.; Zan, W.; Yan, S.; Yao, X. A rhodamine B-based “turn-on” fluorescent sensor for detecting Cu2+ and sulfur anions in aqueous media. RSC Adv. 2014, 4, 5718–5725. [Google Scholar] [CrossRef]
  21. Vercelli, B.; Donnini, R.; Ghezzi, F.; Sansonetti, A.; Giovanella, U.; La Ferla, B. Nitrogn-doped carbon quantum dots obtained hydrothermally from citric acid and urea: The role of the specific nitrogen centers in their electrochemical and optical responses. Electrochim. Acta 2021, 387, 138557. [Google Scholar] [CrossRef]
  22. Inada, N.; Fukuda, N.; Hayashi, T.; Uchiyama, S. Temperature Imaging Using a Cationic Linear Fluorescent Polymeric Thermometer and Fluorescence Lifetime Imaging Microscopy. Nat. Protoc. 2019, 14, 1293–1321. [Google Scholar] [CrossRef]
  23. Nguyen, V.; Si, J.H.; Yan, L.H.; Hou, X. Electron-hole recombination dynamics in carbon nanodots. Carbon 2015, 95, 659–663. [Google Scholar] [CrossRef]
  24. Wang, W.; Peng, J.; Li, F.; Su, B.; Chen, X.; Chen, X. Phosphorus and Chlorine Co-Doped Carbon Dots with Strong Photoluminescence as a Fluorescent Probe for Ferric Ions. Mikrochim. Acta 2018, 186, 32. [Google Scholar] [CrossRef] [PubMed]
  25. Wang, S.; Cao, J.; Lu, C. A Naphthalimide-Based Thermometer: Heat-Induced Fluorescence “Turn-On” Sensing in a Wide Temperature Range in Ambient Atmosphere. New J. Chem. 2020, 44, 4547–4553. [Google Scholar] [CrossRef]
  26. Yang, F.; He, X.; Wang, C.; Cao, Y.; Li, Y.; Yan, L.; Liu, M.; Lv, M.; Yang, Y.; Zhao, X.; et al. Controllable and Eco-Friendly Synthesis of P-Riched Carbon Quantum Dots and Its Application for Copper (II) Ion Sensing. Appl. Surf. Sci. 2018, 448, 589–598. [Google Scholar] [CrossRef]
  27. Yang, W.; Zhang, H.; Lai, J.; Peng, X.; Hu, Y.; Gu, W.; Ye, L. Carbon Dots with Red-shifted Photoluminescence by Fluorine Doping for Optical Bio-Imaging. Carbon 2018, 128, 78–85. [Google Scholar] [CrossRef]
  28. He, X.; Luo, Q.; Zhang, J.; Chen, P.; Wang, H.J.; Luo, K.; Yu, X.Q. Gadolinium-Doped Carbon Dots as Nano-Theranostic Agents for MR/FL Diagnosis and Gene Delivery. Nanoscale 2019, 11, 12973–12982. [Google Scholar] [CrossRef] [PubMed]
  29. Das, P.; Maity, P.P.; Ganguly, S.; Ghosh, S.; Baral, J.; Bose, M.; Choudhary, S.; Gangopadhyay, S.; Dhara, S.; Das, A.K.; et al. Biocompatible Carbon Dots Derived from Kappa-Carrageenan and Phenyl Boronic Acid for Dual Modality Sensing Platform of Sugar and Its Anti-diabetic Drug Release Behavior. Int. J. Biol. Macromol. 2019, 132, 316–329. [Google Scholar] [CrossRef]
  30. Zhao, J.; Zheng, Y.; Pang, Y.; Chen, J.; Zhang, Z.; Xi, F.; Chen, P. Graphene Quantum Dots as Full-Color and Stimulus Responsive Fluorescence Ink for Information Encryption. J. Colloid Interface Sci. 2020, 579, 307–314. [Google Scholar] [CrossRef]
  31. Wang, H.; Wei, J.; Zhang, C.; Zhang, Y.; Zhang, Y.; Li, L.; Yu, C.; Zhang, P.; Chen, J. Red Carbon Dots as Label-Free Two-Photon Fluorescent Nanoprobes for Imaging of Formaldehyde in Living Cells and Zebrafishes. Chin. Chem. Lett. 2020, 31, 759–763. [Google Scholar] [CrossRef]
  32. Yan, F.; Bai, Z.; Zu, F.; Zhang, Y.; Sun, X.; Ma, T.; Chen, L. Yellow-Emissive Carbon Dots with a Large Stokes Shift Are Viable Fluorescent Probes for Detection and Cellular Imaging of Silver Ions and Glutathione. Mikrochim. Acta 2019, 186, 113. [Google Scholar] [CrossRef] [PubMed]
  33. Meng, Y.; Yang, M.; Liu, X.; Yu, W.; Yang, B. Zn2+-Doped Carbon Dots, a Good Biocompatibility Nanomaterial Applied for Bio-imaging and Inducing Osteoblastic Differentiation In Vitro. ACS Nano 2019, 14, 1950029. [Google Scholar] [CrossRef]
  34. Alimunnisa, J.; Ravichandran, K.; Meena, K. Synthesis and characterization of Ag@SiO2 core-shell nanoparticles for antibacterial and environmental applications. J. Mol. Liquids 2017, 231, 281–287. [Google Scholar] [CrossRef]
  35. Wei, S.Q.; Yin, X.H.; Li, H.Y.; Du, X.Y.; Zhang, L.M. Multi-Color Fluorescent Carbon Dots: Graphitized Sp2 Conjugated Domains and Surface State Energy Level Co-Modulate Band Gap Rather Than Size Effects. Chem. Eur. J. 2020, 26, 8129–8136. [Google Scholar] [CrossRef]
Figure 1. Chemical structure of baicalein.
Inorganics 12 00154 g001
Figure 2. Hydrothermal synthesis of blue-fluorescent cys-CDs for baicalein detection and cell imaging.
Inorganics 12 00154 g002
Figure 3. (a) Transmission electron microscopic image of cys-CD. (b) Particle size distribution of cys-CD.
Inorganics 12 00154 g003
Figure 4. (a) FT-IR spectrum of cys-CD, (b) X-ray photoelectron spectrum of cys-CD.
Inorganics 12 00154 g004
Figure 5. (a) Excitation and emission spectra of 100 μg mL−1 cys-CD aqueous solution. (b) Emission spectra of 100 μg mL−1 cys-CD aqueous solution at different excitation wavelengths. (c) cys-CD fluorescence spectra of aqueous solutions with different concentrations of cys-CD. (d) Fluorescence lifetime decay of cys-CD.
Inorganics 12 00154 g005
Figure 6. (a) Fluorescence spectra of cys-CD in 0–400 mM NaCl solutions. (b) The fluorescence spectra of cys-CD in the pH range of 2–12. (c) The cys-CD fluorescence spectra before and after exposure to a 365 nm UV lamp for 24 h. (d) The cys-CD fluorescence spectra before and after 90 days of storage.
Inorganics 12 00154 g006
Figure 7. Variation in the fluorescence of cys-CD (5 μg mL−1) with different concentrations of baicalein in the system. (a) The 2D spectra. (b) The 3D spectra.
Inorganics 12 00154 g007
Figure 8. Lineweaver–Burk curve of baicalein detection by cys-CD.
Inorganics 12 00154 g008
Figure 9. UV-Vis absorption of baicalein and excitation–emission spectra of cys-CD.
Inorganics 12 00154 g009
Figure 10. (a) Effect of different concentrations of baicalein on cys-CD’s UV absorption. (b) Effect of 10 μM baicalein on cys-CD’s UV absorption.
Inorganics 12 00154 g010
Figure 11. Fluorescence-decay of cys-CD with different concentrations of baicalein.
Inorganics 12 00154 g011
Table 1. Recovery of baicalein by cys-CD in human urine and human serum samples.
SampleGroupConcentration of Baicalein (mM)RecoveryRSD (%)
SpikedFound(%)n = 5
Serum187.8598.193.81
2109.7197.104.09
31211.7497.872.44
Urine188.28103.493.52
21010.25102.51.91
31212.23101.932.77
Table 2. Reagents used in this study.
ReagentsPurityManufacturer
L-cysteineAnalytical pureAladdin Reagent Co., Ltd. (Shanghai, China)
Sodium citrate dihydrateAnalytical pureGHTECH Technology Co., Ltd. (Guangzhou, China)
Baicalein standard99.8%Aladdin Reagent Co., Ltd. (Shanghai, China)
Sodium chlorideAnalytical pureDamao Chemical Reagent Factory (Tianjin, China)
AcetoneAnalytical pureDamao Chemical Reagent Factory (Tianjin, China)
EDTAAnalytical pureDamao Chemical Reagent Factory (Tianjin, China)
Absolute alcoholAnalytical pureGHTECH Technology Co., Ltd. (Guangzhou, China)
CTABAnalytical pureAladdin Reagent Co., Ltd. (Shanghai, China)
Phosphate buffer (pH 7.4)Analytical pureYuanye Bio-Technology Co., Ltd. (Shanghai, China)
DEME culture mediumAnalytical pureTianjun Bio-Technology Co., Ltd. (Guangzhou, China)
4% PFA stationary liquidAnalytical pureBairui Bio-Technology Co., Ltd. (Shanghai, China)
Anti-fluorescence quenching mounting mediumAnalytical pureCida Bio-Technology Co., Ltd. (Guangzhou, China)
Table 3. Instruments used in this study.
InstrumentsModelManufacturer
Steady/Transient spectrometerFLS980Edinburgh Instrument Company (Edinburgh, Britain)
FTIR6700 FT-IRThermo Fisher Scientific Technology Company (Waltham, MA, USA)
UV-Visible-near infrared light spectrophotometerUV-3600Shimadzu Corporation (Kyoto, Japan)
TEMFEI TECNAI G2 F20FEI Company (Waltham, MA, USA)
Multifunctional XPSAXIS ULTRA DLDShimadzu Corporation (Kyoto, Japan)
Liquid nitrogen cryostatOptistatDN-V2Oxford Instruments Technology Co., Ltd. (Shanghai, China)
Thermostatic magnetic stirrer85-2Aohua Instruments Co., Ltd. (Changzhou, China)
High-speed centrifugeTG16-WSXiangyi Laboratory Instrument Development Co., Ltd. (Changsha, China)
Thermal-Storage heating magnetic stirrerDF-101SYuhua Instruments Co., Ltd. (Gongyi, China)
Analytical balanceAX124 ZH/EOhaus Corporation (Newark, NJ, USA)
UV analyzerZF-20DYuhua Instruments Co., Ltd. (Gongyi, China)
Electric blast drying ovenDHG-9145AAohua Instruments Co., Ltd. (Changzhou, China)
Laser confocal microscopeLSM 880 with AiryscanXiangyi Laboratory Instrument Development Co., Ltd. (Changsha, China)
Freeze dryerFreezone6LShimadzu Corporation (Kyoto, Japan)
Disclaimer/Publisher’s Note: The statements, opinions and data contained in all publications are solely those of the individual author(s) and contributor(s) and not of MDPI and/or the editor(s). MDPI and/or the editor(s) disclaim responsibility for any injury to people or property resulting from any ideas, methods, instructions or products referred to in the content.

