Article

Effect of Impregnation of PEDOT:PSS in Etched Aluminium Electrodes on the Performance of Solid State Electrolytic Capacitors

Research Group Electrochemical and Surface Engineering (SURF), Department of Materials and Chemistry, Vrije Universiteit Brussel, Pleinlaan 2, 1050 Brussels, Belgium
*
Author to whom correspondence should be addressed.
Inorganics 2024, 12(7), 185; https://doi.org/10.3390/inorganics12070185
Submission received: 29 May 2024 / Revised: 21 June 2024 / Accepted: 27 June 2024 / Published: 2 July 2024
(This article belongs to the Special Issue Recent Advances in Energy Storage and Conversion)

Abstract

:
Electrolytic capacitors store larger amounts of energy thanks to their thin dielectric layers and enlarged surface area. However, the benefits of using a liquid electrolyte are at the expense of the possibility of leakage, evaporation, or rupture of the device over time. As a solution, solid electrolytes, such as conductive polymers, substitute the liquid ones decreasing the internal resistance and enlarging the lifetime of these devices. PEDOT:PSS is a widely used conductive polymer in the formation of solid electrolytic capacitors. However, using the enlarged surface of the porous electrodes efficiently requires industrial processes, the efficacy of which has not been explored. In this work, porous aluminium electrodes with dielectric layers of different thicknesses were coated with PEDOT:PSS at different levels of doping in order to study the efficiency of the production of solid electrolytic capacitors in industry. The combination of odd random phase electrochemical impedance spectroscopy (ORP-EIS) with surface characterization techniques (SEM-EDX, GDOES) formed a methodology that allowed the study of both the electrical properties and the level of impregnation for these model systems. All samples consisting of a porous aluminium electrode with an amount of PEDOT:PSS deposited on top resulted in an inefficient degree of penetration between the two electrodes. However, the electrochemical analysis proved that the use of dopants produces systems with the highest capacitive properties. Consequently, the evolution towards better solid electrolytic capacitors does not rely solely on the proper coverage of the porous electrodes, but on the proper electrical properties of the PEDOT:PSS within the pores.

1. Introduction

The invention of electrolytic capacitors allowed the performance of capacitors to skyrocket compared to their classical counterpart, the ceramic capacitors [1,2]. The capacitance of a system can be fine-tuned by either decreasing the size of the dielectric layer between the electrodes or increasing the area of contact between them [3]. Controlling the thickness of a dielectric is easily attained for materials such as aluminium, tantalum and niobium. These metals are characteristic because they grow an oxide layer upon the application of a potential when submerged a suitable electrolyte [4,5]. On the other hand, increasing the area of the electrodes can be conducted via processes such as chemical or electrochemical etching [6]. Both anodisation and electrochemical etching are combined to obtain fine-tuned electrodes for a capacitor with the optimal properties, resulting in a competitive solution individually or combined with other energy storage devices [7,8,9].
In electrolytic capacitors, the element that closes the circuit between the electrodes is typically a liquid electrolyte. The electrolyte adapts its shape to the electrodes and accesses every pore of the electrodes translating efficiently the increase in area into capacitance. However, the use of liquid electrolytes implies some disadvantages, like the restriction to use this type of capacitors within the temperature range at which these stay in liquid form or the possibility of either leakage or rupture of the capacitor upon build-up pressure originating from undesired reactions [10,11]. Hence, as an alternative, a solid electrolyte can be used. Materials such as metal oxides (i.e., RuO 2 or MnO 2 ) [12,13] or conductive polymers (CP, i.e., polypyrrole, polythiophene) [14,15,16] avoid any leakage of electrolyte, reduce the equivalent series resistance (ESR) and broaden the temperature use range for electrolytic capacitors.
One of the most relevant conducting polymers because of its conductivity values, flexibility, its versatility accepting modifiers and processability is poly(3,4-ethylenedioxythiophene) or PEDOT. Patented in 1988 [17], PEDOT has been widely used as cathode in aluminium or tantalum capacitors [18,19,20]. Even though it ends up in a solid state, PEDOT is deposited in liquid state in the form of a slurry. Typically, PEDOT electrodes are formed by inducing its polymerization within an etched electrode. In this way, the polymer is brought into the porous structure ensuring good contact between the electrodes [21]. However, this process can damage the dielectric layer and the oxidants of the polymerization need to be removed to avoid further reactions [22,23]. Alternatively, PEDOT electrodes can be obtained depositing already prepolymerized PEDOT dispersion onto etched electrodes. The most popular prepolymerized dispersion is PEDOT:PSS, where along with PEDOT is polystyrene sulfonate, a polyanion that balances the positive charge of PEDOT and stabilizes PEDOT in an aqueous solution by forming colloids [24]. Bringing the dispersion and a porous electrode together is not a trivial process [23,25]. As a result of the properties of the PEDOT:PSS dispersion and the compatibility between the size of the PEDOT:PSS colloids and the pores, the production of this type of capacitors requires the use of a modified atmosphere that removes the air trapped within the etched structure [21]. Even though it is a widely used process in industry [26,27], forming a fully coated porous electrode with PEDOT:PSS dispersion is still a process far from optimal and often requires several impregnation steps [28]. Still, there are not studies in the state of the art that explore the connection between the electrical behaviour and the impregnation level in solid PEDOT:PSS aluminium capacitors.
In a previous work [29], PEDOT:PSS/aluminium model systems were produced by using a flat metallic electrode with the focus on the study of the interaction between the two phases. Thanks to this approach, it was found that the combination of a conventional PEDOT:PSS dispersion and aluminium resulted in an attack on the aluminium surface that enhanced area between the two electrodes and led to a higher capacitance. Even though such a model was useful to better comprehend phenomena taking place at the interface, it does not represent the real systems appropriately. Incrementing the level of complexity of these model systems means to add an etched layer. Due to the etched layer, the electrical response does not only depend on the individual layers, but also on the interaction of the polymer to be found in the pores of the etched layer. And this interaction includes how well PEDOT:PSS coats the porous aluminium electrode and how effectively the current reaches those regions. In this work, etched aluminium/PEDOT:PSS systems are produced to, further on, evaluate their performance based on their electrical response and the degree of infiltration of PEDOT:PSS within the aluminium electrode. First, a PEDOT:PSS dispersion with no additives deposited onto etched aluminium electrodes with oxide layers of different thicknesses were formed to study differences based on the characteristics of the dielectric. The analysis of these samples helped validating the analysis methodology of etched electrodes. Next, a number of additives were added to the PEDOT:PSS dispersion that are known to improve the electrical properties and stability of PEDOT:PSS prior to the deposition onto an etched aluminium electrode. Later on, these systems were analyzed analogously and had their results compared to the samples formed with pristine PEDOT:PSS dispersion.

2. Results and Discussions

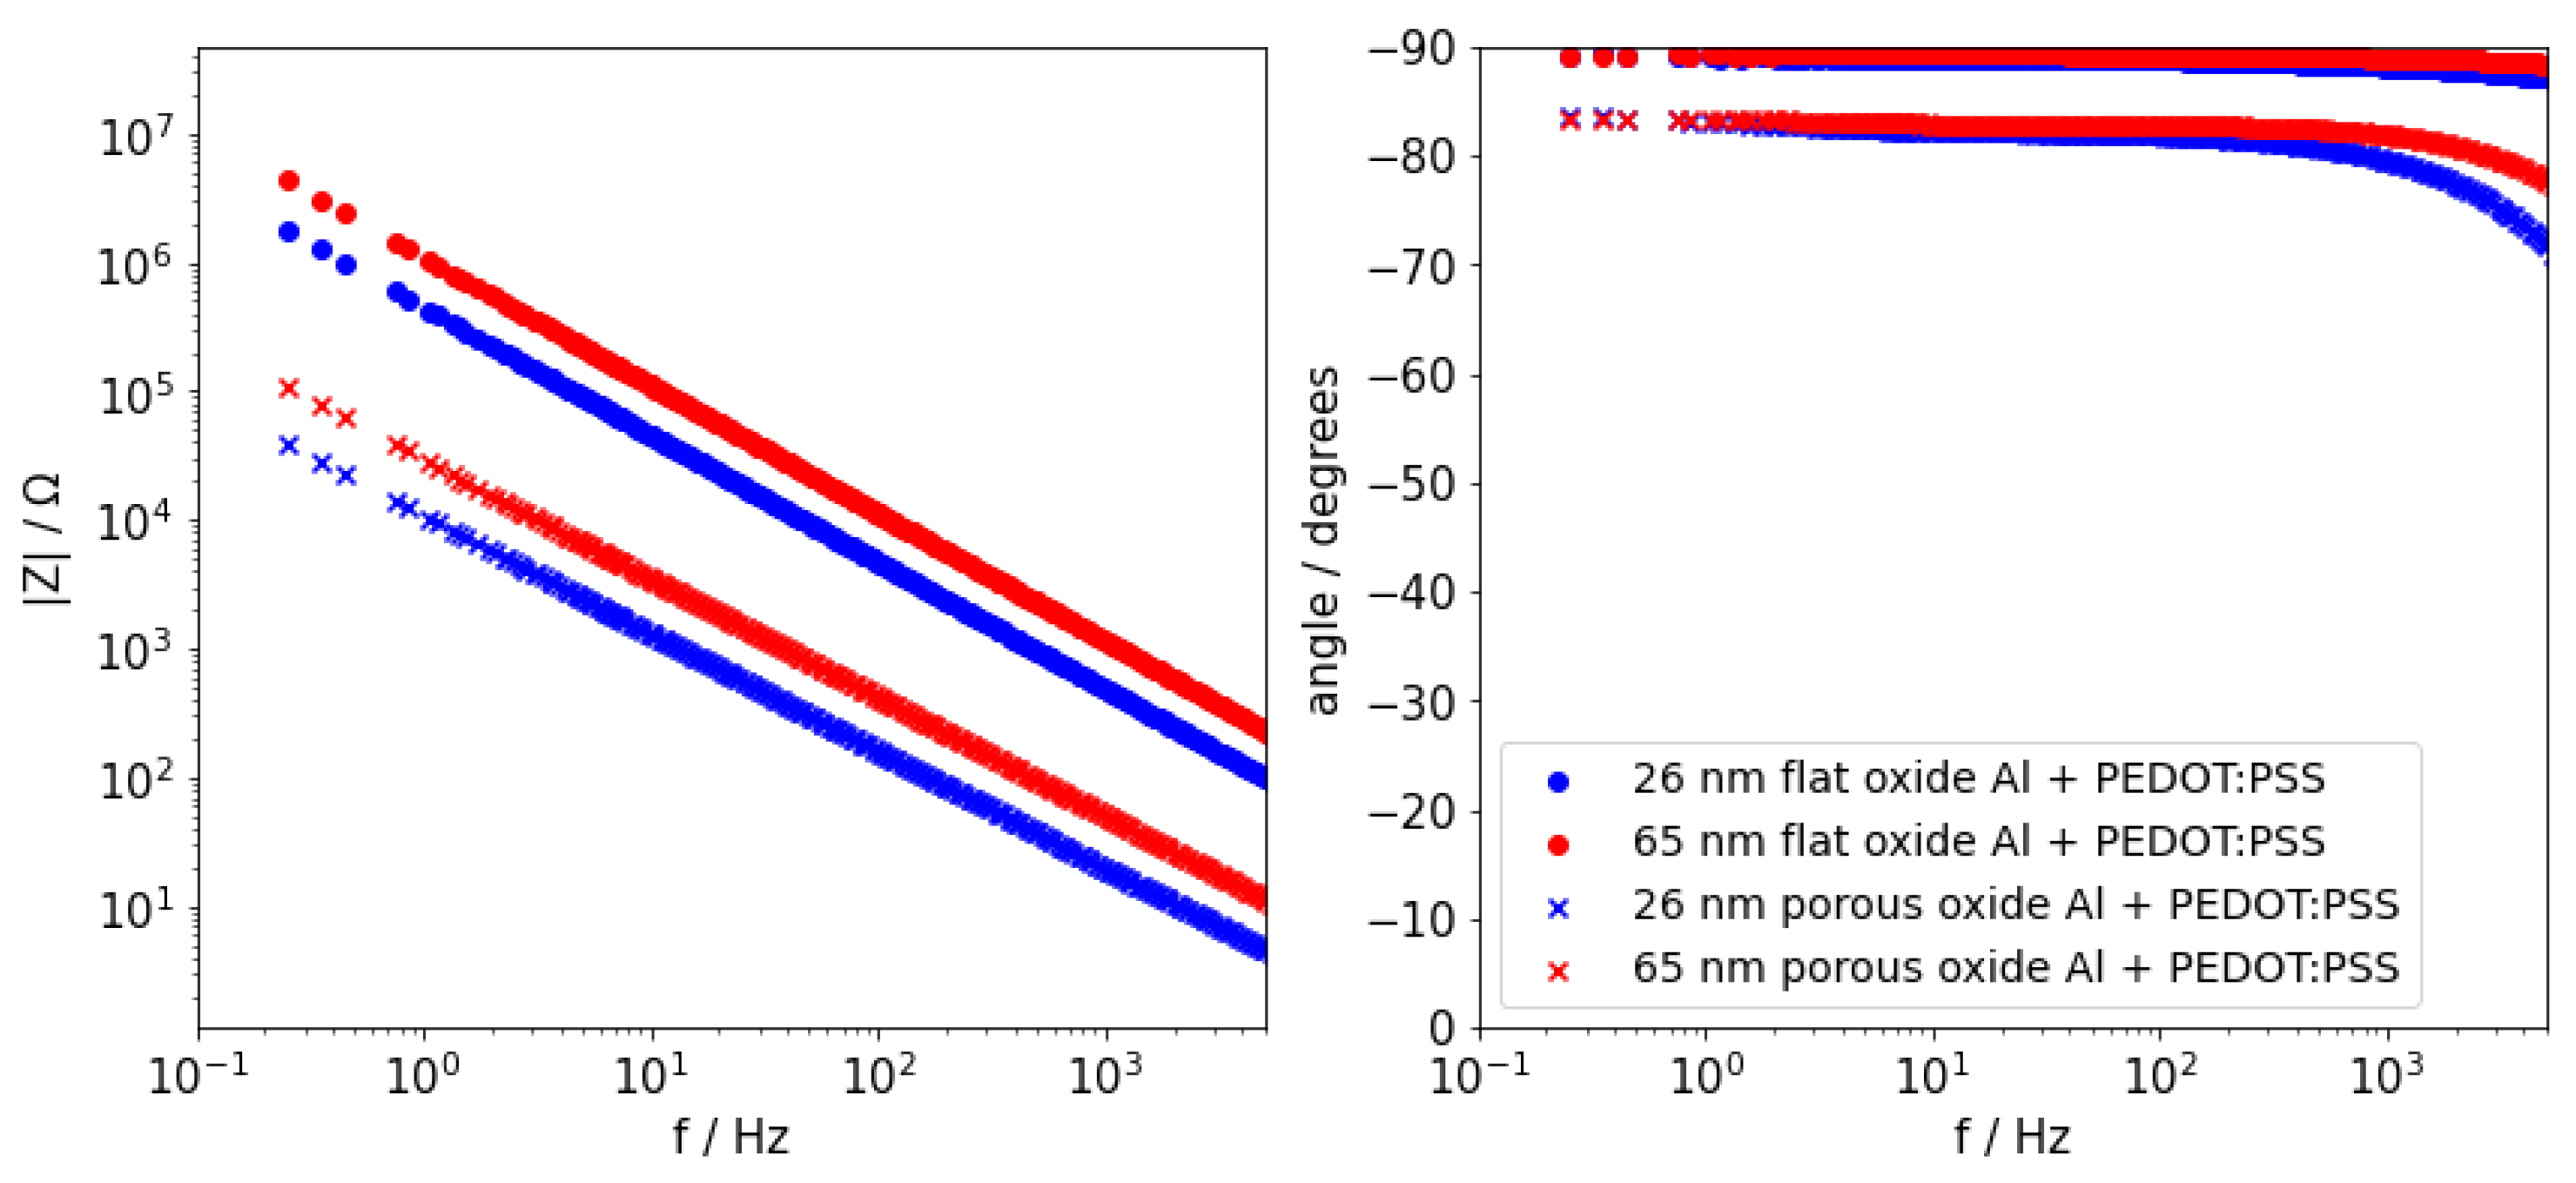
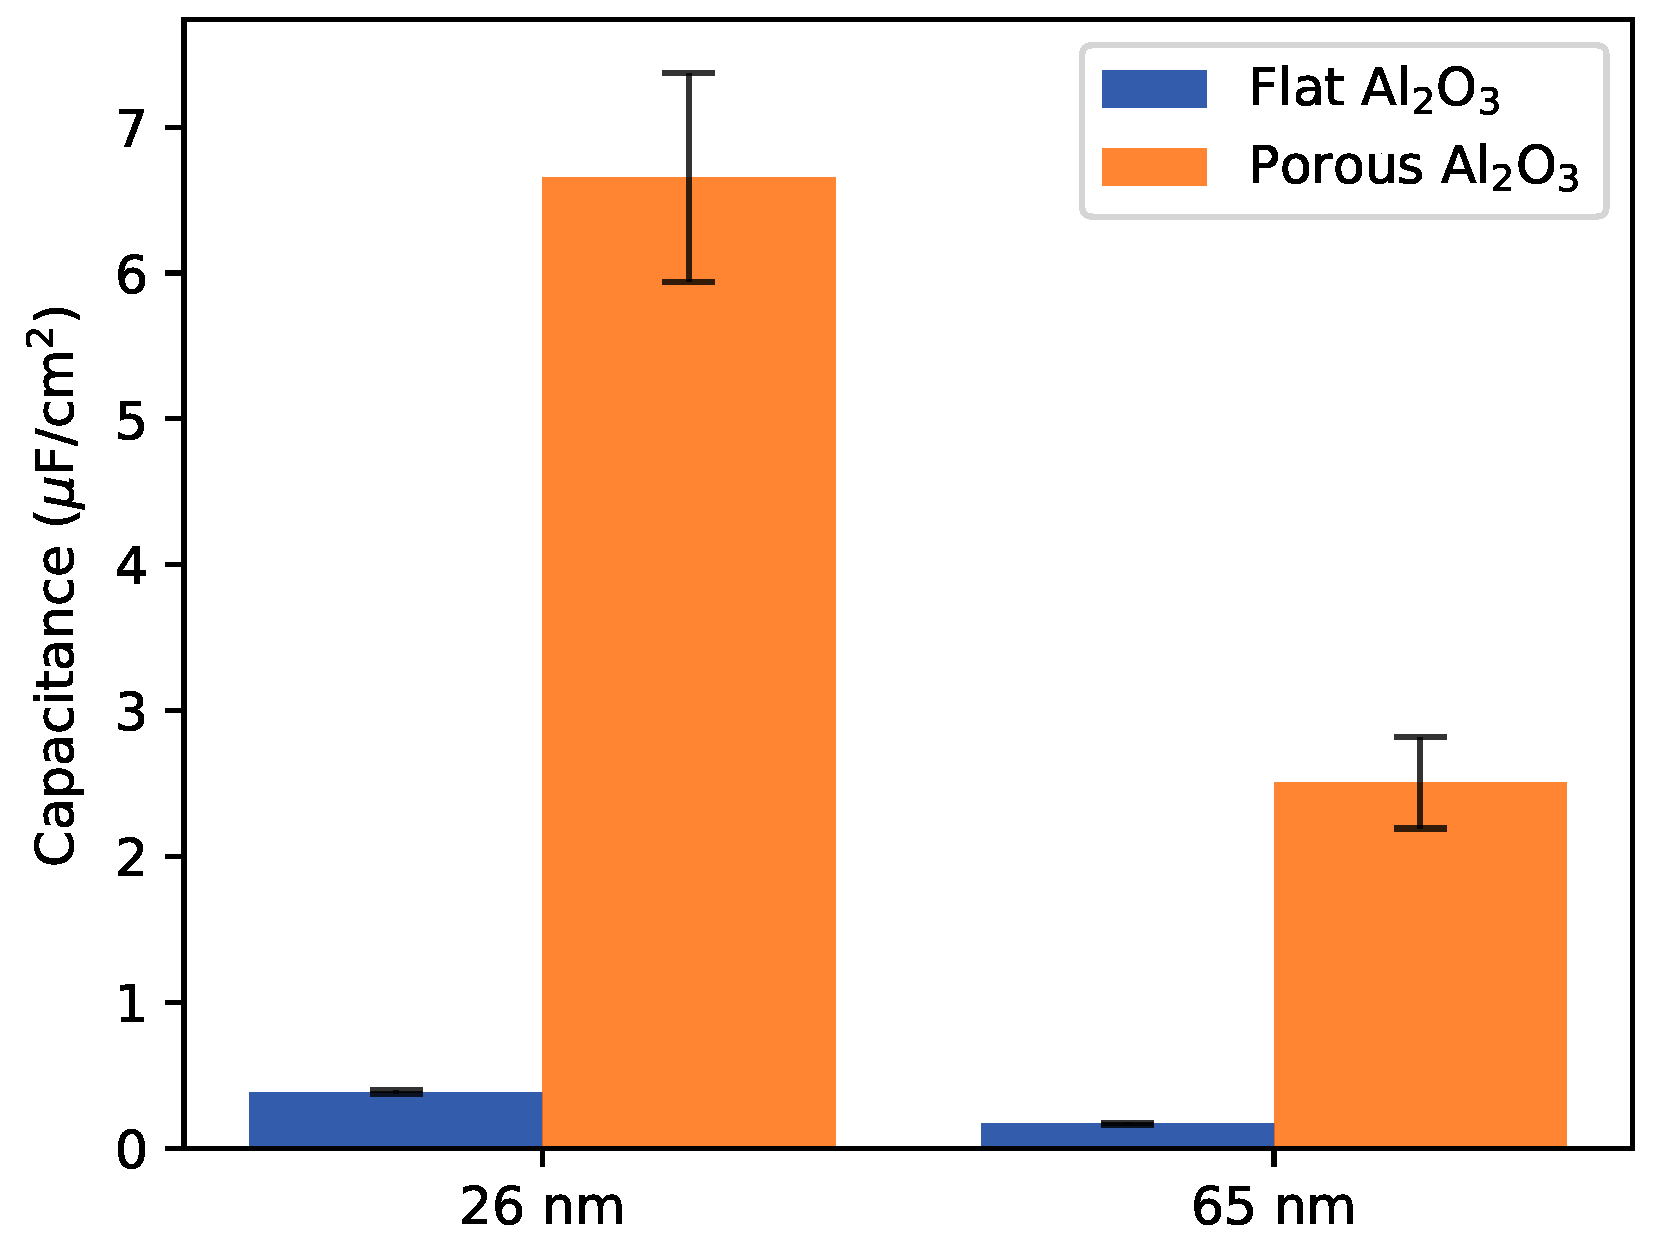
2.1. Undoped PEDOT:PSS on Flat and Etched Aluminium Electrodes

The first batch of samples to be analysed was composed by pristine, or undoped, PEDOT:PSS dispersions deposited on etched aluminium electrodes, the aluminium oxide layer of which were formed at two different voltages, 20 V and 50 V, leading to oxide layers of 26 and 65 nm thick, respectively. Once the samples had added a layer of silver paste on top, the electrochemical analysis was carried out (Figure 1). The electrical response of the etched samples was depicted along with PEDOT:PSS/aluminium samples with a flat surface to compare the influence of the etching.
All samples depicted a similar behaviour showing differences in the impedance module values and the phase angles. The evolution of the impedance module in a logarithmic scale was linear and inversely proportional to the frequency. The system that showed the highest impedance values was the sample formed by a flat aluminium electrode with a 65 nm thick oxide layer. This was followed by the flat sample with a 26 nm oxide. Next, at impedance values of about 2 orders of magnitude lower, the impedance signal of the porous systems appeared. Following the same trend, the sample with the thicker oxide appeared and lastly, showing the lowest impedance values, the porous sample with the 26 nm oxide. Regarding the phase angles, these remained at a constant value, −89° for the flat samples and −83° for the porous samples, from low frequencies until 1 kHz where they showed a decay indicating a transition towards a resistive regime. This decay being more prominent for the samples using a porous electrode than for those using a flat one. For the sake of clarity in this plot, the noise signals were not shown, but they will be commented in the section discussing the validity of the fitting results. Nevertheless, it is worth mentioning that the signal to noise (SNR) ratio was high overall for all samples. For these samples, the phase angle dropped abruptly below 0.5 Hz because the SNR ratio became lower. This was the result of the impedance values reaching the higher limit of impedance for the potentiostat and, therefore, leading to higher noise levels. Consequently, this part of the spectra was not used for the upcoming analysis.
The impedance response depicted by all these systems described the behaviour of a capacitive system. This type of systems in EIS is represented as one that depicts a phase angle close to −90° and an overall linear evolution of the impedance modulus presented in a logarithmic scale. As commented above, there were differences between these samples originating from the nature of the electrode use, flat or porous, and the thicknesses of their dielectric layers, 26 nm or 65 nm. These differences can be explained by means of the impedance response of a capacitor (Equation (1)).
Z = 1 j ω C
The impedance is represented by Z, the capacitance by C and ω represents the angular frequency. The capacitance of a system can be roughly estimated by means of the formula of the capacitance for a parallel plate capacitor (Equation (2)).
C = ϵ 0 ϵ r A δ
In the formula, C represents the capacitance value, ϵ 0 and ϵ r the electric permittivity in vacuum and the relative permittivity of the dielectric material, respectively, A represents the area between the electrodes and δ the thickness of the dielectric. According to this, both an increase of the area or a thinning of the dielectric layer between the electrodes result in an increase of the capacitance, which also has an impact on the capacitor impedance. The difference between samples formed with a flat electrode and those formed with a porous one is the surface area. And so it is observed in Figure 1. The porous samples, presenting a larger active surface area, resulted in a larger capacitance and, consequently, in lower impedance values. Additionally, within the sets, there were differences based on the thickness of the dielectric layers. The samples with the thinner oxide layer, 26 nm, depicted lower impedance values compared to their counterparts. It was already observed in a previous work [29] that this difference between oxide thicknesses on a flat oxide can be retrieved even after buried under a number of dry PEDOT:PSS layers, similarly to the response of the samples formed with a flat electrode in Figure 1. Upon the application of PEDOT:PSS onto an etched aluminium substrate, the differences based on the difference in thickness of their dielectric layers could be as well retrieved, despite the increased complexity of the etched surfaces, and had an impact on the impedance of the systems.
The impedance spectra alone gave an idea about the behaviour of the systems, but they did not provide any thorough evaluation of the systems. An appropriate parameter to evaluate the performance of these capacitor-like systems is their capacitance values, defined by the amount of charge that the system holds per applied volt. In order to extract the information, the data from the impedance spectra needed to be fitted to an equivalent circuit. This circuit then served as a model taking into account each one of the electrical processes that occurred during the measurement. A proper circuit model produces the same electrical response as the system under investigation. This is considered valid when the values of every component in the model output physically meaningful values, along with low uncertainty on the approximations, and the residuals between the sample signal and the model signal are significantly low compared to the signals themselves. In this case, thanks to the power of ORP-EIS and its complex multisine signal, a fitting was considered suitable when the residuals lied close to the different noise signals. In a former work [29], a satisfactory model was found for the fitting of the samples composed of a flat surface aluminium electrode. The model (Figure 2a) consists of a resistance that accounts for the equivalent series resistance of the sample, a constant phase element (CPE) representing the charge accumulation at the oxide layer, a resistance that takes into account the resistivity of the polymer layer and an additional constant phase element that represents the charge accumulation in the polymer layer itself. Therefore, as a starting point this same circuit model was applied for the samples.
The fitting results (Figure 3) were satisfactory for both systems formed with a flat electrode with grown oxides of different thicknesses (Table 1). However, proper fitting results could not be obtained using the same model for samples formed with a porous electrode. As a result of the decrease of the impedance values, the wires inductance was observed to have an influence on the measurement. Therefore, an inductor was added in series to the model (Figure 2b) accounting for this effect.
As observed in Figure 4, both samples presented a dip in the noise signals at around 1 kHz that was not observed for the flat samples (Figure 3). This was the result of the potentiostat reaching its limitation when measuring such low impedance values. Nevertheless, the SNR was still high enough not to affect the impedance response at that frequency. Regarding the fitting, the residuals of the fitting overlapped the noise signals for both samples while presenting small deviation on their fitting parameters (Table 2). This meant that the adapted model fitted properly the response of those systems with a porous aluminium substrate and that the fitting parameters could be used for further calculations.
Having obtained satisfactory fits for both flat and porous samples, the capacitance values were calculated from the CPE elements in the both models. As detailed in a previous work [29], considering the difference in the values of Q ox and Q pol , the capacitance of the flat systems could be approximated to the capacitance of CPE ox . The calculation of the capacitance values out of this CPE component was performed via a power-law model assuming a distribution of time constants normal to the surface [30]. Regarding the analysis of the samples formed onto a porous sample, it was appreciated that the values of Q for both CPE elements were closer in magnitude, and that the addition in series of these components could not be approximated to the smallest one. Therefore, the capacitance calculated for these systems were the combination in series of the two CPE components. Additionally, the calculation of the capacitance for these samples was conducted assuming the model proposed by Brug et al. [31].
C s u r f = Q 1 / α R E S R ( 1 α ) / α
This model (Equation (3)) assumes a surface distribution of time constants, namely that the global response of the electrode is the summation of contributions at each part of the electrode. Given the surface roughness of the studied electrode and based on previous reports of capacitance calculations of porous electrodes [32,33], the dispersion of time constants could be therefore linked to the difference in current distribution between a pore and the outer surface.
The calculations of the samples capacitance values (Figure 5) showed that the use of a porous aluminium electrode and a thin oxide layer resulted in a capacitance increase of 15 times the capacitance for the flat system for both aluminium thicknesses when using a solid state system.
According to the electrochemical analysis, the use of a porous aluminium electrode had an impact on the overall performance. As commented above, the larger the surface of contact between the electrodes, the higher the capacitance values. In order to understand the change that motivated the electrochemical response, a cross-section was performed on the porous samples to be later on studied via surface analysis techniques. In Figure 6 an overview of the stack (a,c) for both samples can be observed. The obtained cross-sections were quite clean and allowed to differentiate between the different layers. Both samples presented an accumulation of PEDOT:PSS outside the porous structure, a clear section of the etched area where the PEDOT:PSS was not filling the pores, and the underlying aluminium substrate. In Figure 6b,d, a close up of the interface between the PEDOT:PSS layer and the porous aluminium layer depicted the close interaction between the two phases. The PEDOT:PSS layer copied the morphology of the outer surface of the porous electrode, even though it did not seem to penetrate further than a few microns deep.
Since the study of the morphology of the cross-section did not allow to distinguish the polymer within the porous aluminium electrode, an analysis of the composition at the cross-section was conducted via EDX spectroscopy. PEDOT:PSS is mostly composed of, as many other polymers, carbon and oxygen, elements that also are present in the aluminium substrate. However, it contains also sulphur atoms in both PEDOT and PSS. This element allowed the detection of polymer within the porous structure.
As presented in the linescan (Figure 7), the analysis was carried out starting from the PEDOT:PSS layer into the etched area. The distance 0 μ m was set as the intersection between the S and Al signals and the counts of all samples were normalized to the average of the Al signal on the etched section. Both signals experienced a change upon the change of phase. The Al signal increased after passing the interface between the outer PEDOT:PSS layer and the etched surface. Thereon, it stabilized for the whole extension of the etched section until it increased again once it reached the aluminium substrate. Focusing on the sulphur signal (Figure 7b), the signal decayed quickly after entering the etched section and it dropped after 6 μ m. In the graph, the signals of both samples remained constant after 6 μ m in the porous section. After this drop, the sulphur signals reached a plateau. The sulphur signals for both samples remained constant throughout the etched aluminium section and the aluminium substrate, indicating that the amount of PEDOT:PSS could not be distinguished from the noise level within the porous area.
Complementary to SEM-EDX, depth profile analysis were performed on both samples via GDOES (Figure 8). The 3 different regions were identified. First, the area shaded in blue is where most of the carbon and sulphur were found, this area was determined as the outer PEDOT:PSS layer. The point at which the sulphur signal and the aluminium signal cross was defined as the interface. In yellow shading, from the interface until the increase in the aluminium signal, the porous aluminium area was defined. Lastly, the area in in green was defined as the aluminium substrate. The results followed the same trend as the EDX analysis. Focusing on the C and S signals (Figure 8b), it was observed that they suffered a decrease right after the interface between PEDOT:PSS and the aluminium porous section, to stabilize in a plateau that extended until the aluminium substrate. After the interface between the porous aluminium and the aluminium substrate, the decrease of both S and C signals was observed.
In view of the results out of the electrochemical analysis and the study of the cross-section, increasing the area between the two electrodes, PEDOT:PSS and aluminium, had a positive impact on the performance of the produced systems. As described in Equation (2), increasing the area leads to an increase in the capacitance, phenomenon that is also observed in Figure 1. The difference in impedance was also observed to be dependent on the thickness of the dielectric between the aluminium substrate and PEDOT:PSS and played an important role on the calculated capacitance. The increase in capacitance was achieved at the expense of the ideality of the system, as observed in the decrease of the phase angle going from −89° to −83°. The cause for such change in phase angle was the current distribution that occurred because of the heterogeneity of the surface [34]. This had been already observed as a measure of how in depth current travels into the pores when using a liquid electrolyte and diffusion playing a role [35]. Even though the porous samples perform better electronically, the impedance response alone did not provide any information about the degree of penetrability of the PEDOT:PSS into the porous aluminium electrode. SEM images only showed an accumulation of PEDOT:PSS out of the etched area, with no amount of polymer visible within the pores. An EDX linescan analysis was needed to show that most of the sulphur was present in the initial part of the porous area. For both samples, PEDOT:PSS could be found in the first 6 μ m. For the remaining part of the etched area, a trace amount of sulphur could be retrieved as observed in the EDX linescans and GDOES analysis. Thus, the degree of impregnation of PEDOT:PSS within the porous aluminium electrode was analogous regardless of the thickness of the oxide layer. The fitting process of both porous samples could be performed through a model that takes into account the response of the oxide layer, as CPE ox , and the PEDOT:PSS layer, as as R pol and as CPE pol . Therefore, no difference in electrochemical behaviour could be distinguished between the outer PEDOT:PSS layer and that inside the pores. Even though only the first 6 μ m of the porous section was covered in PEDOT:PSS, these samples experienced a decrease in their impedance responses that resulted in more capacitive systems. Consequently, and in spite of finding trace amount of PEDOT:PSS in the pores, its electrical properties were not sufficient for the current to reach the full extension of the etched area. Thus, the capacitance of these systems was found to be the result of the contribution of the outer PEDOT:PSS layer and the PEDOT:PSS in the first 6 μ m of the porous section.

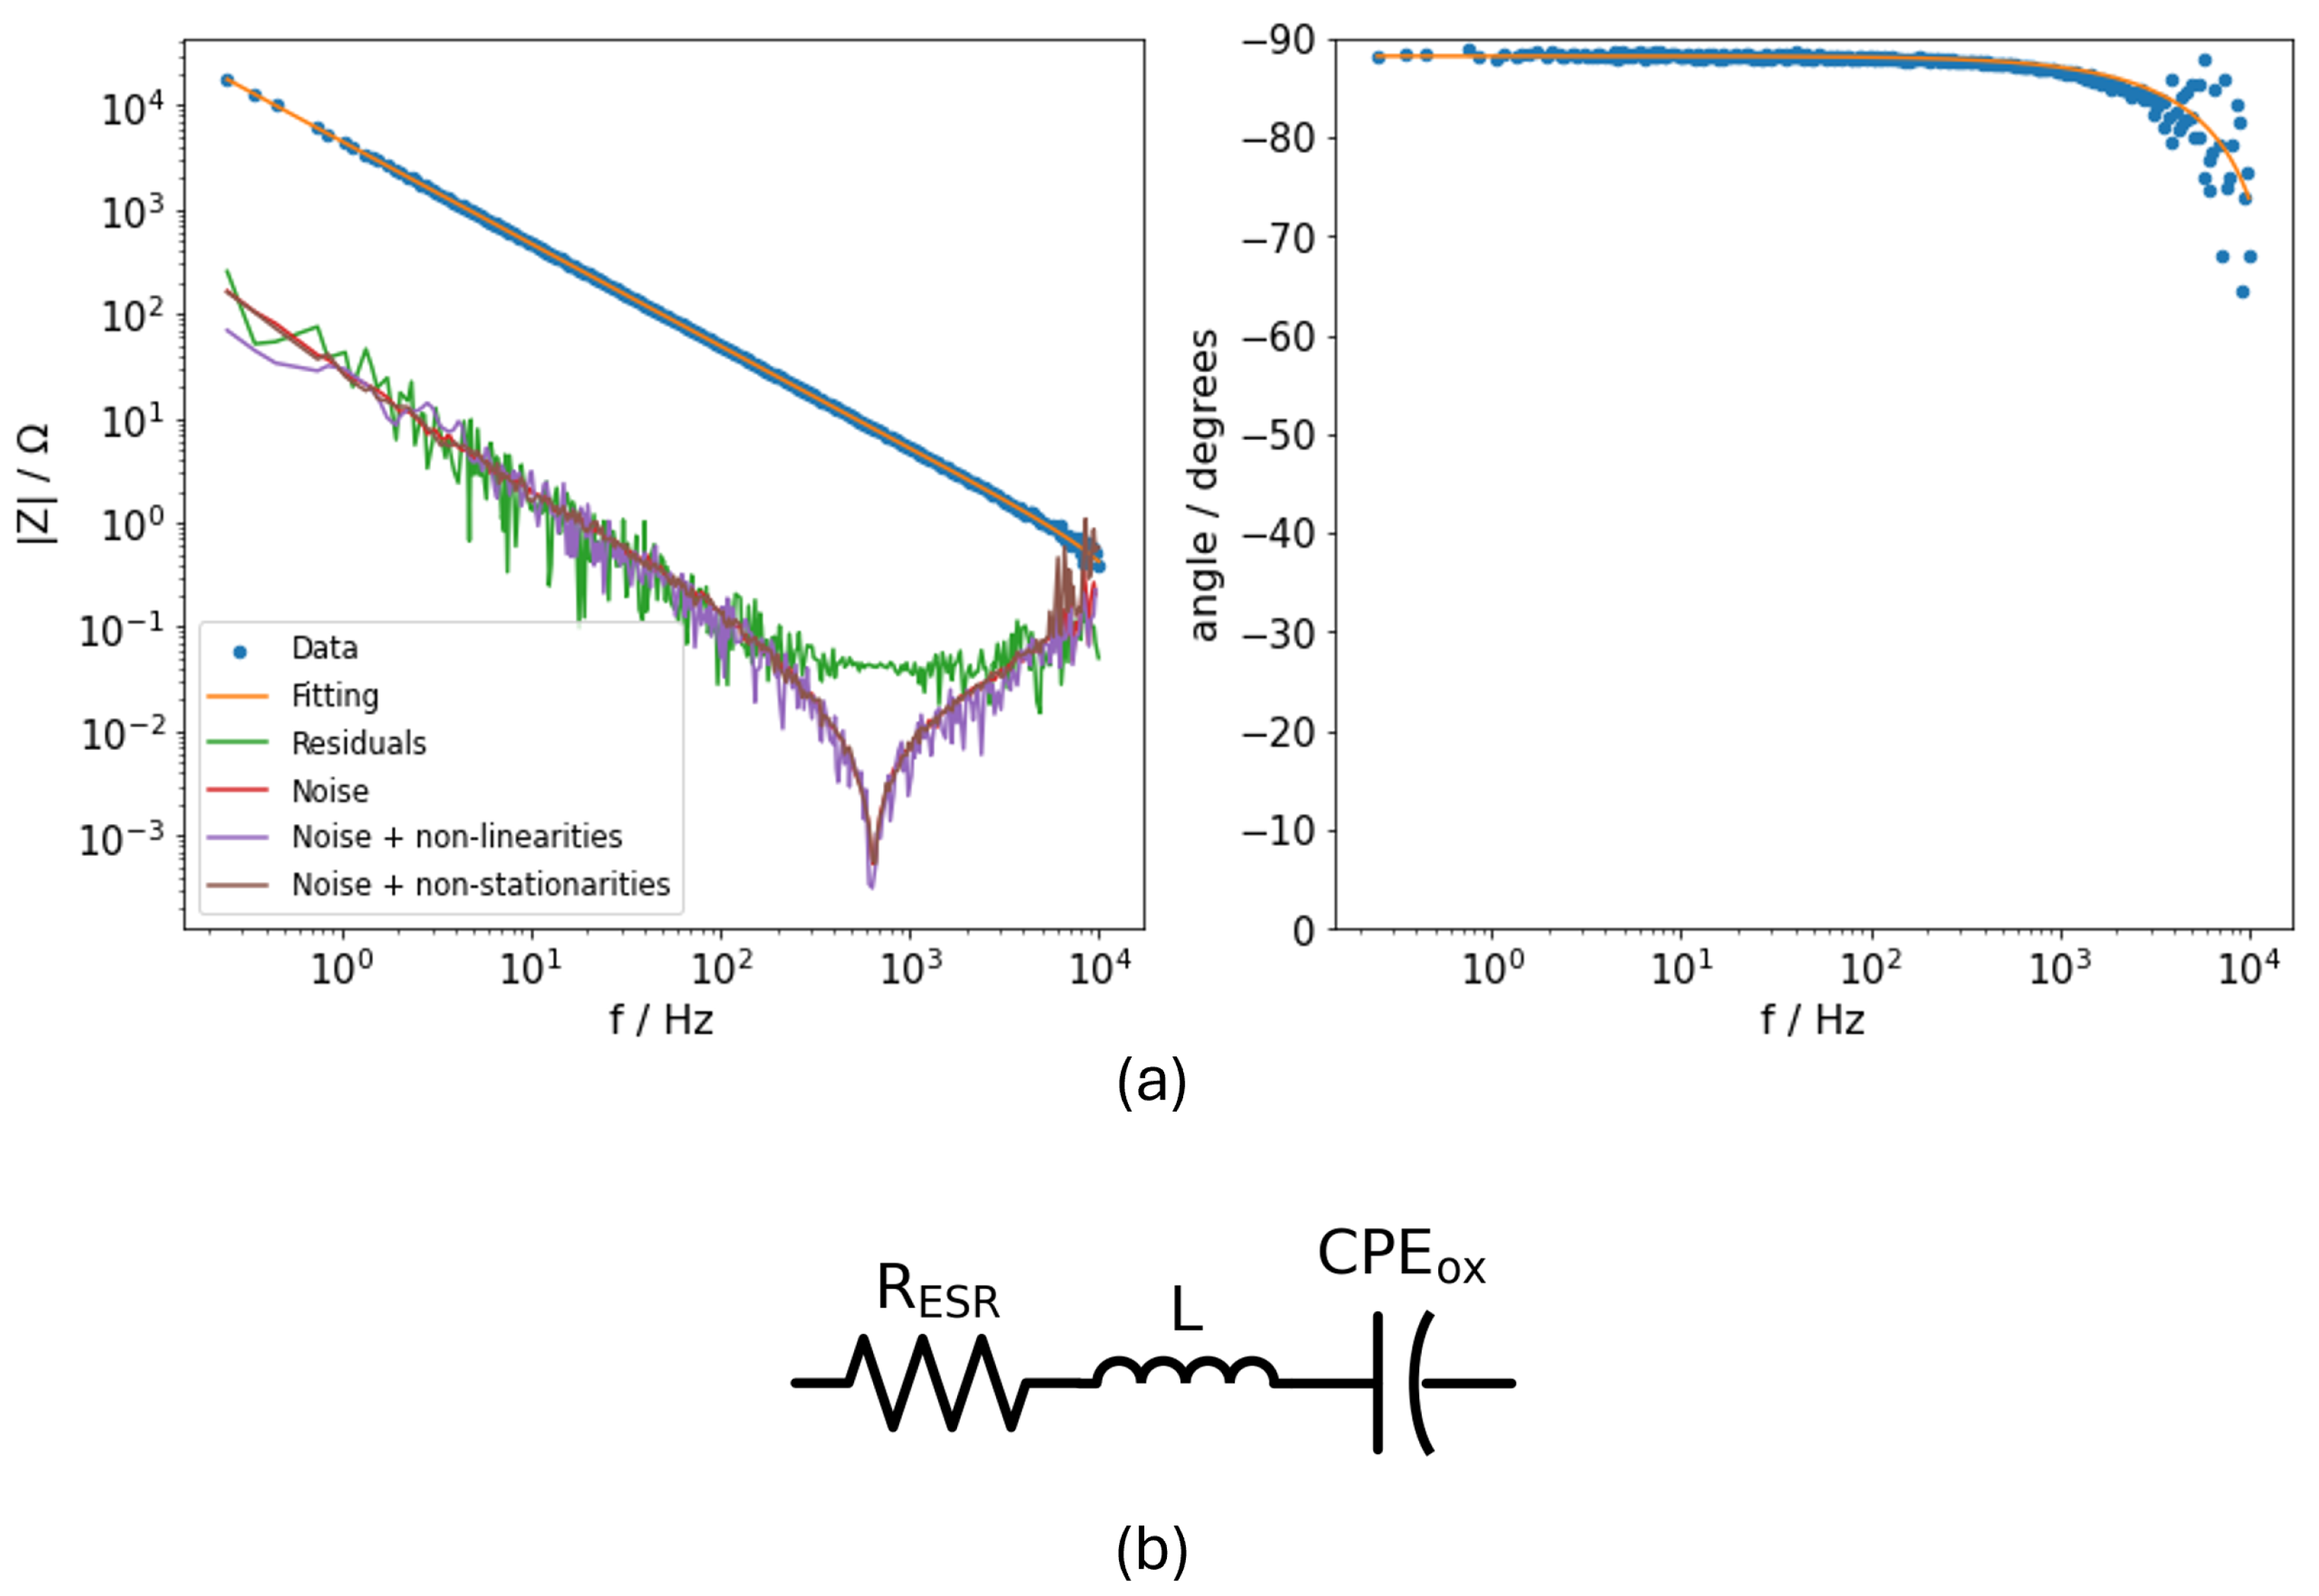
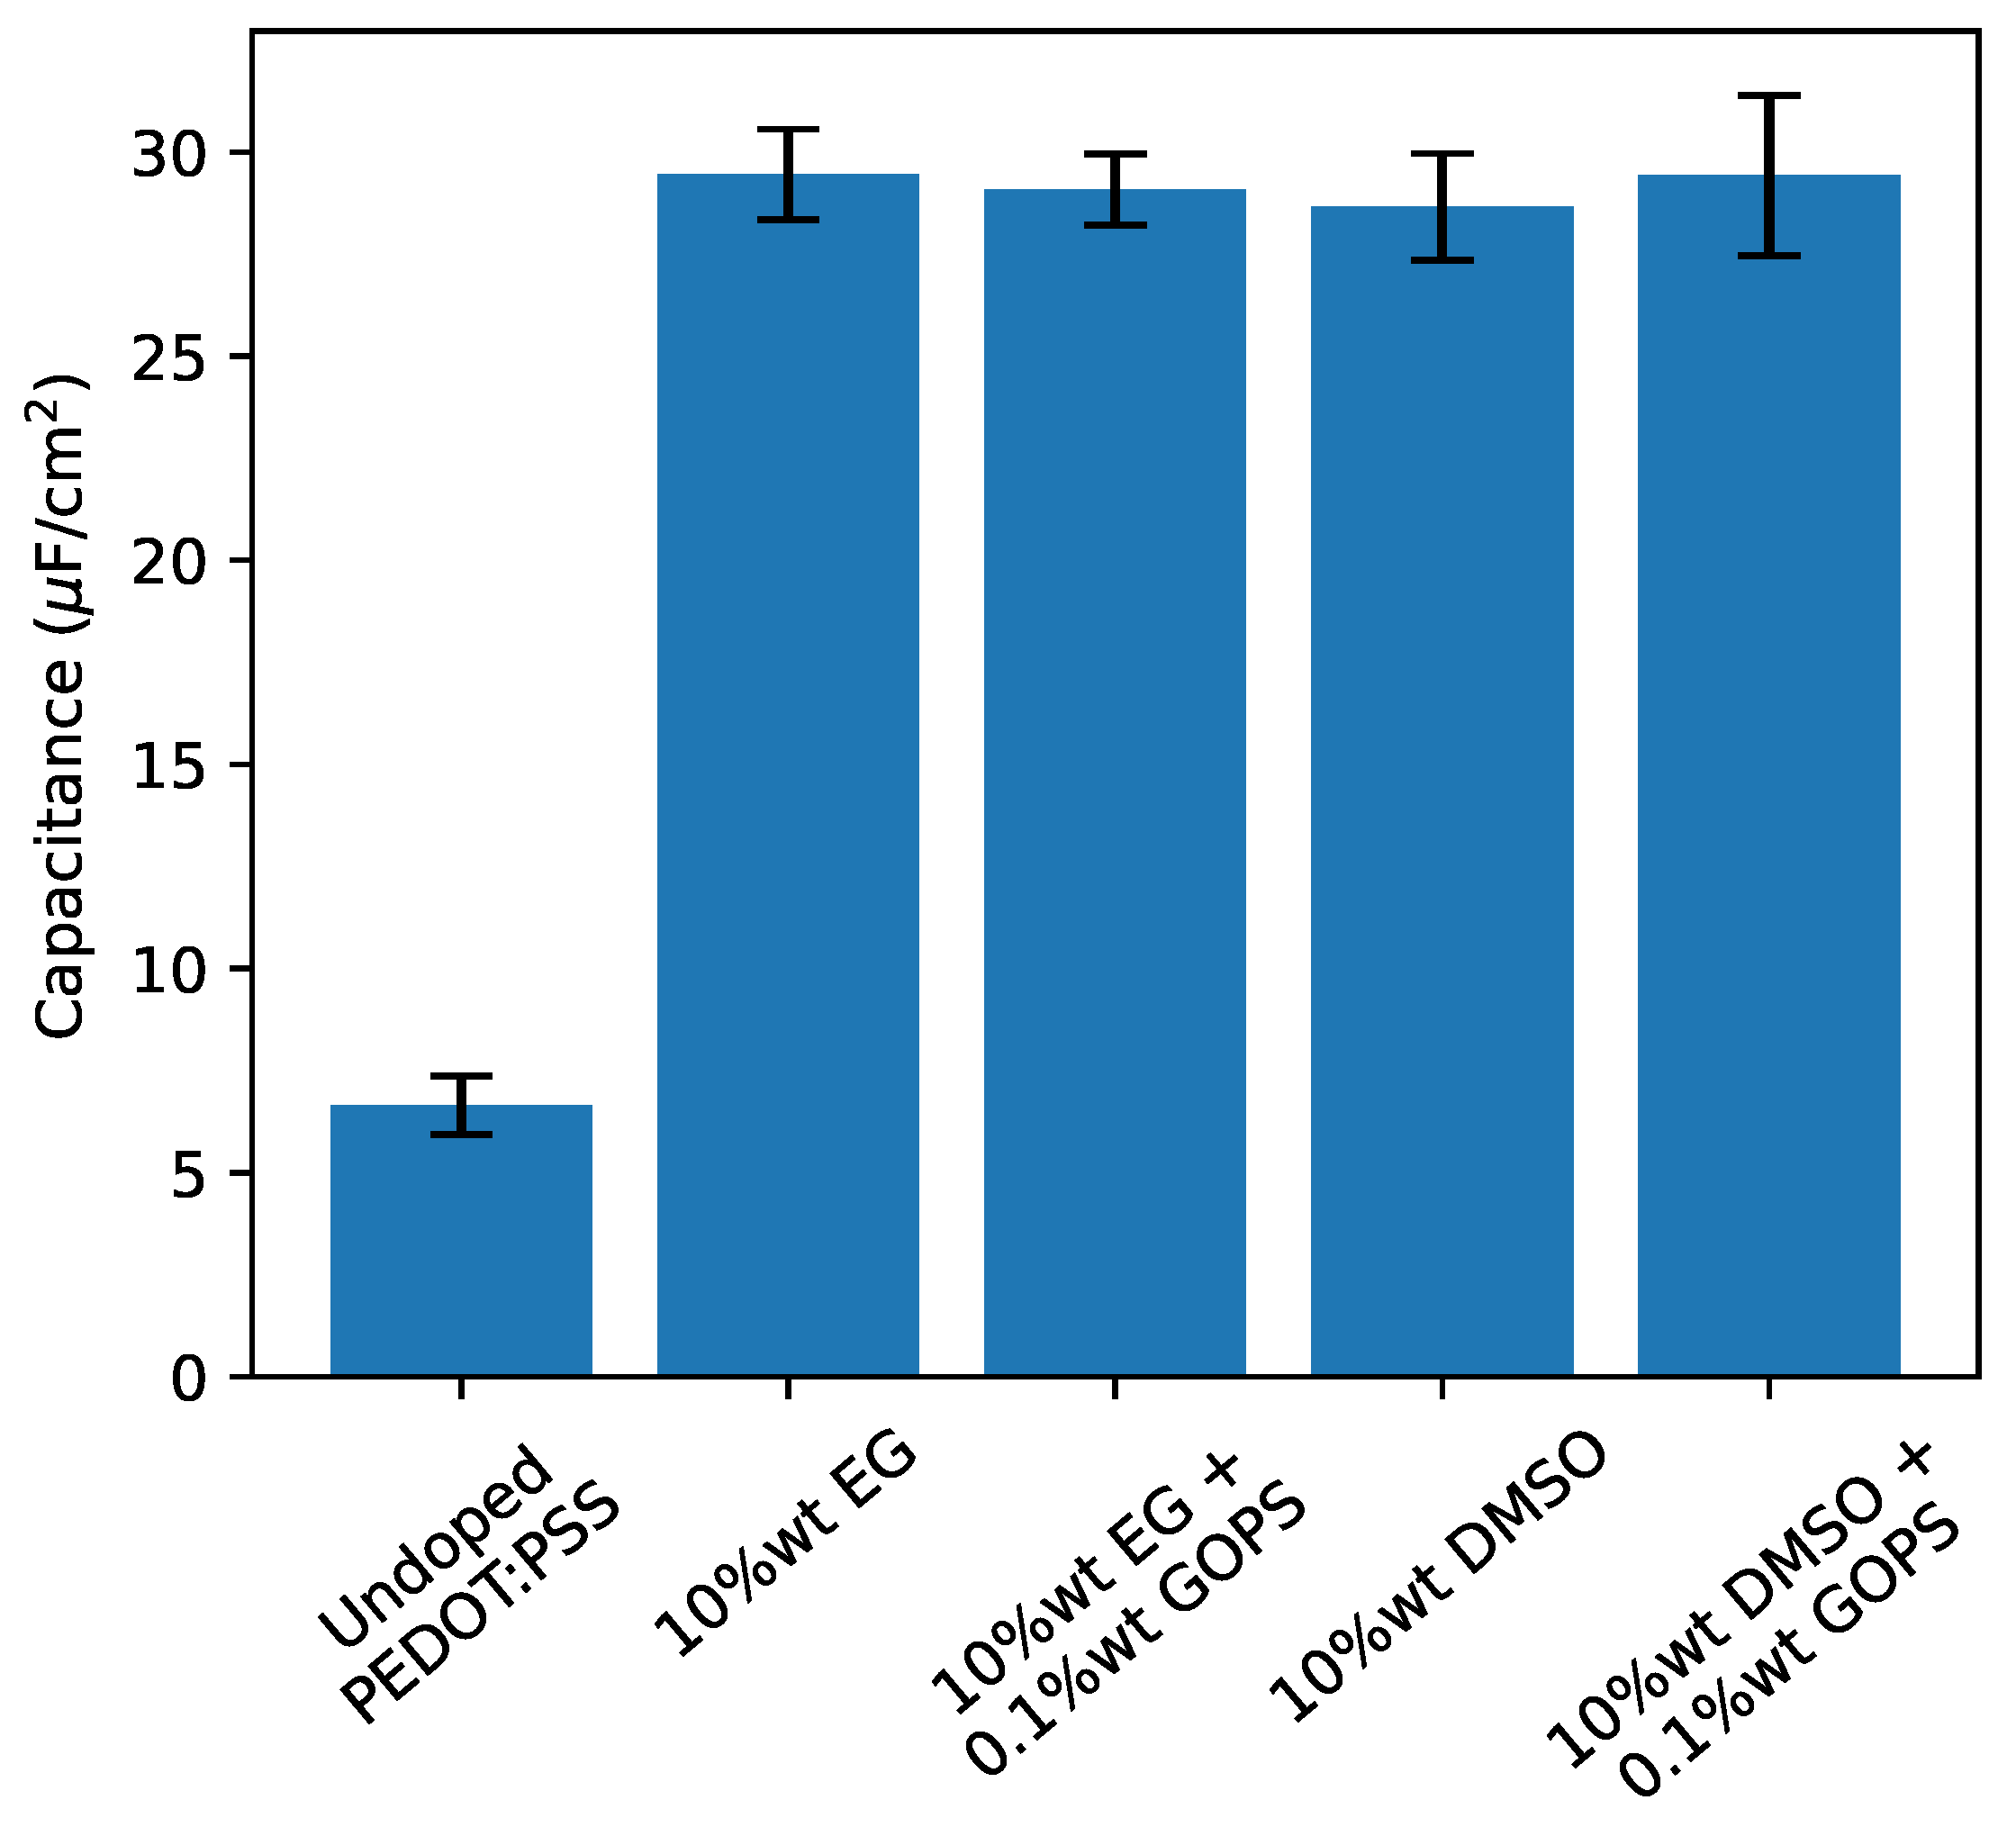
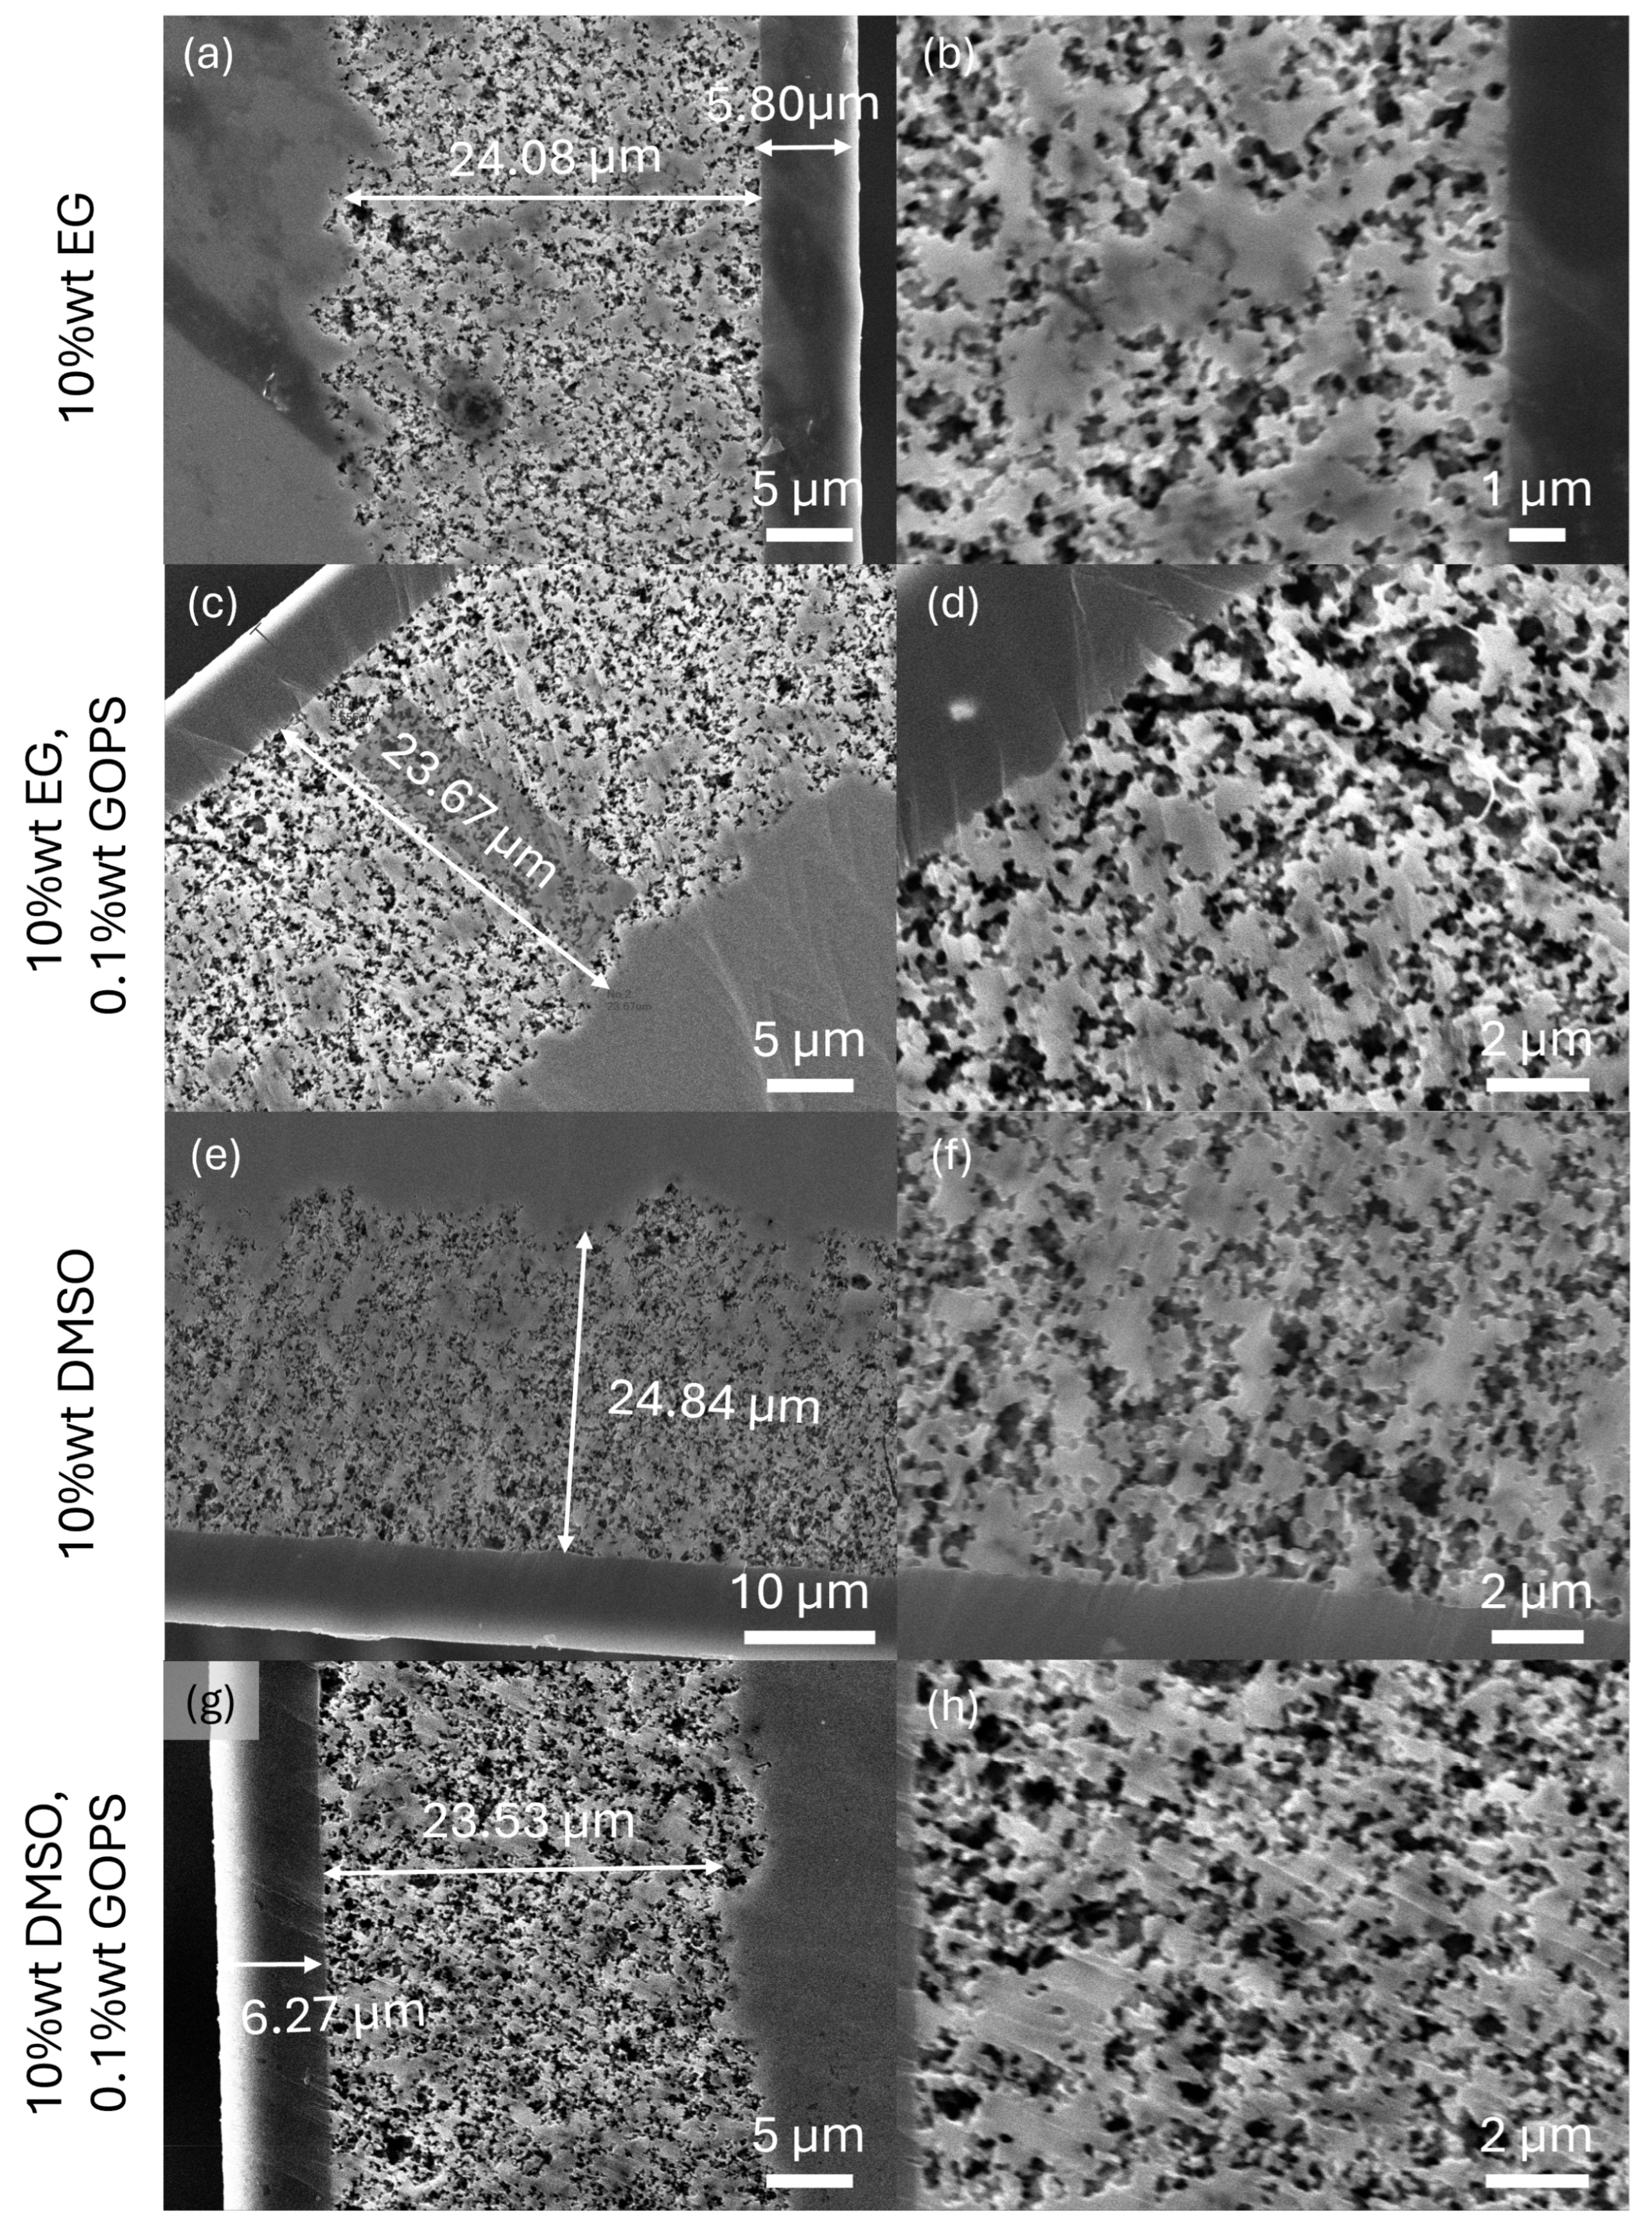
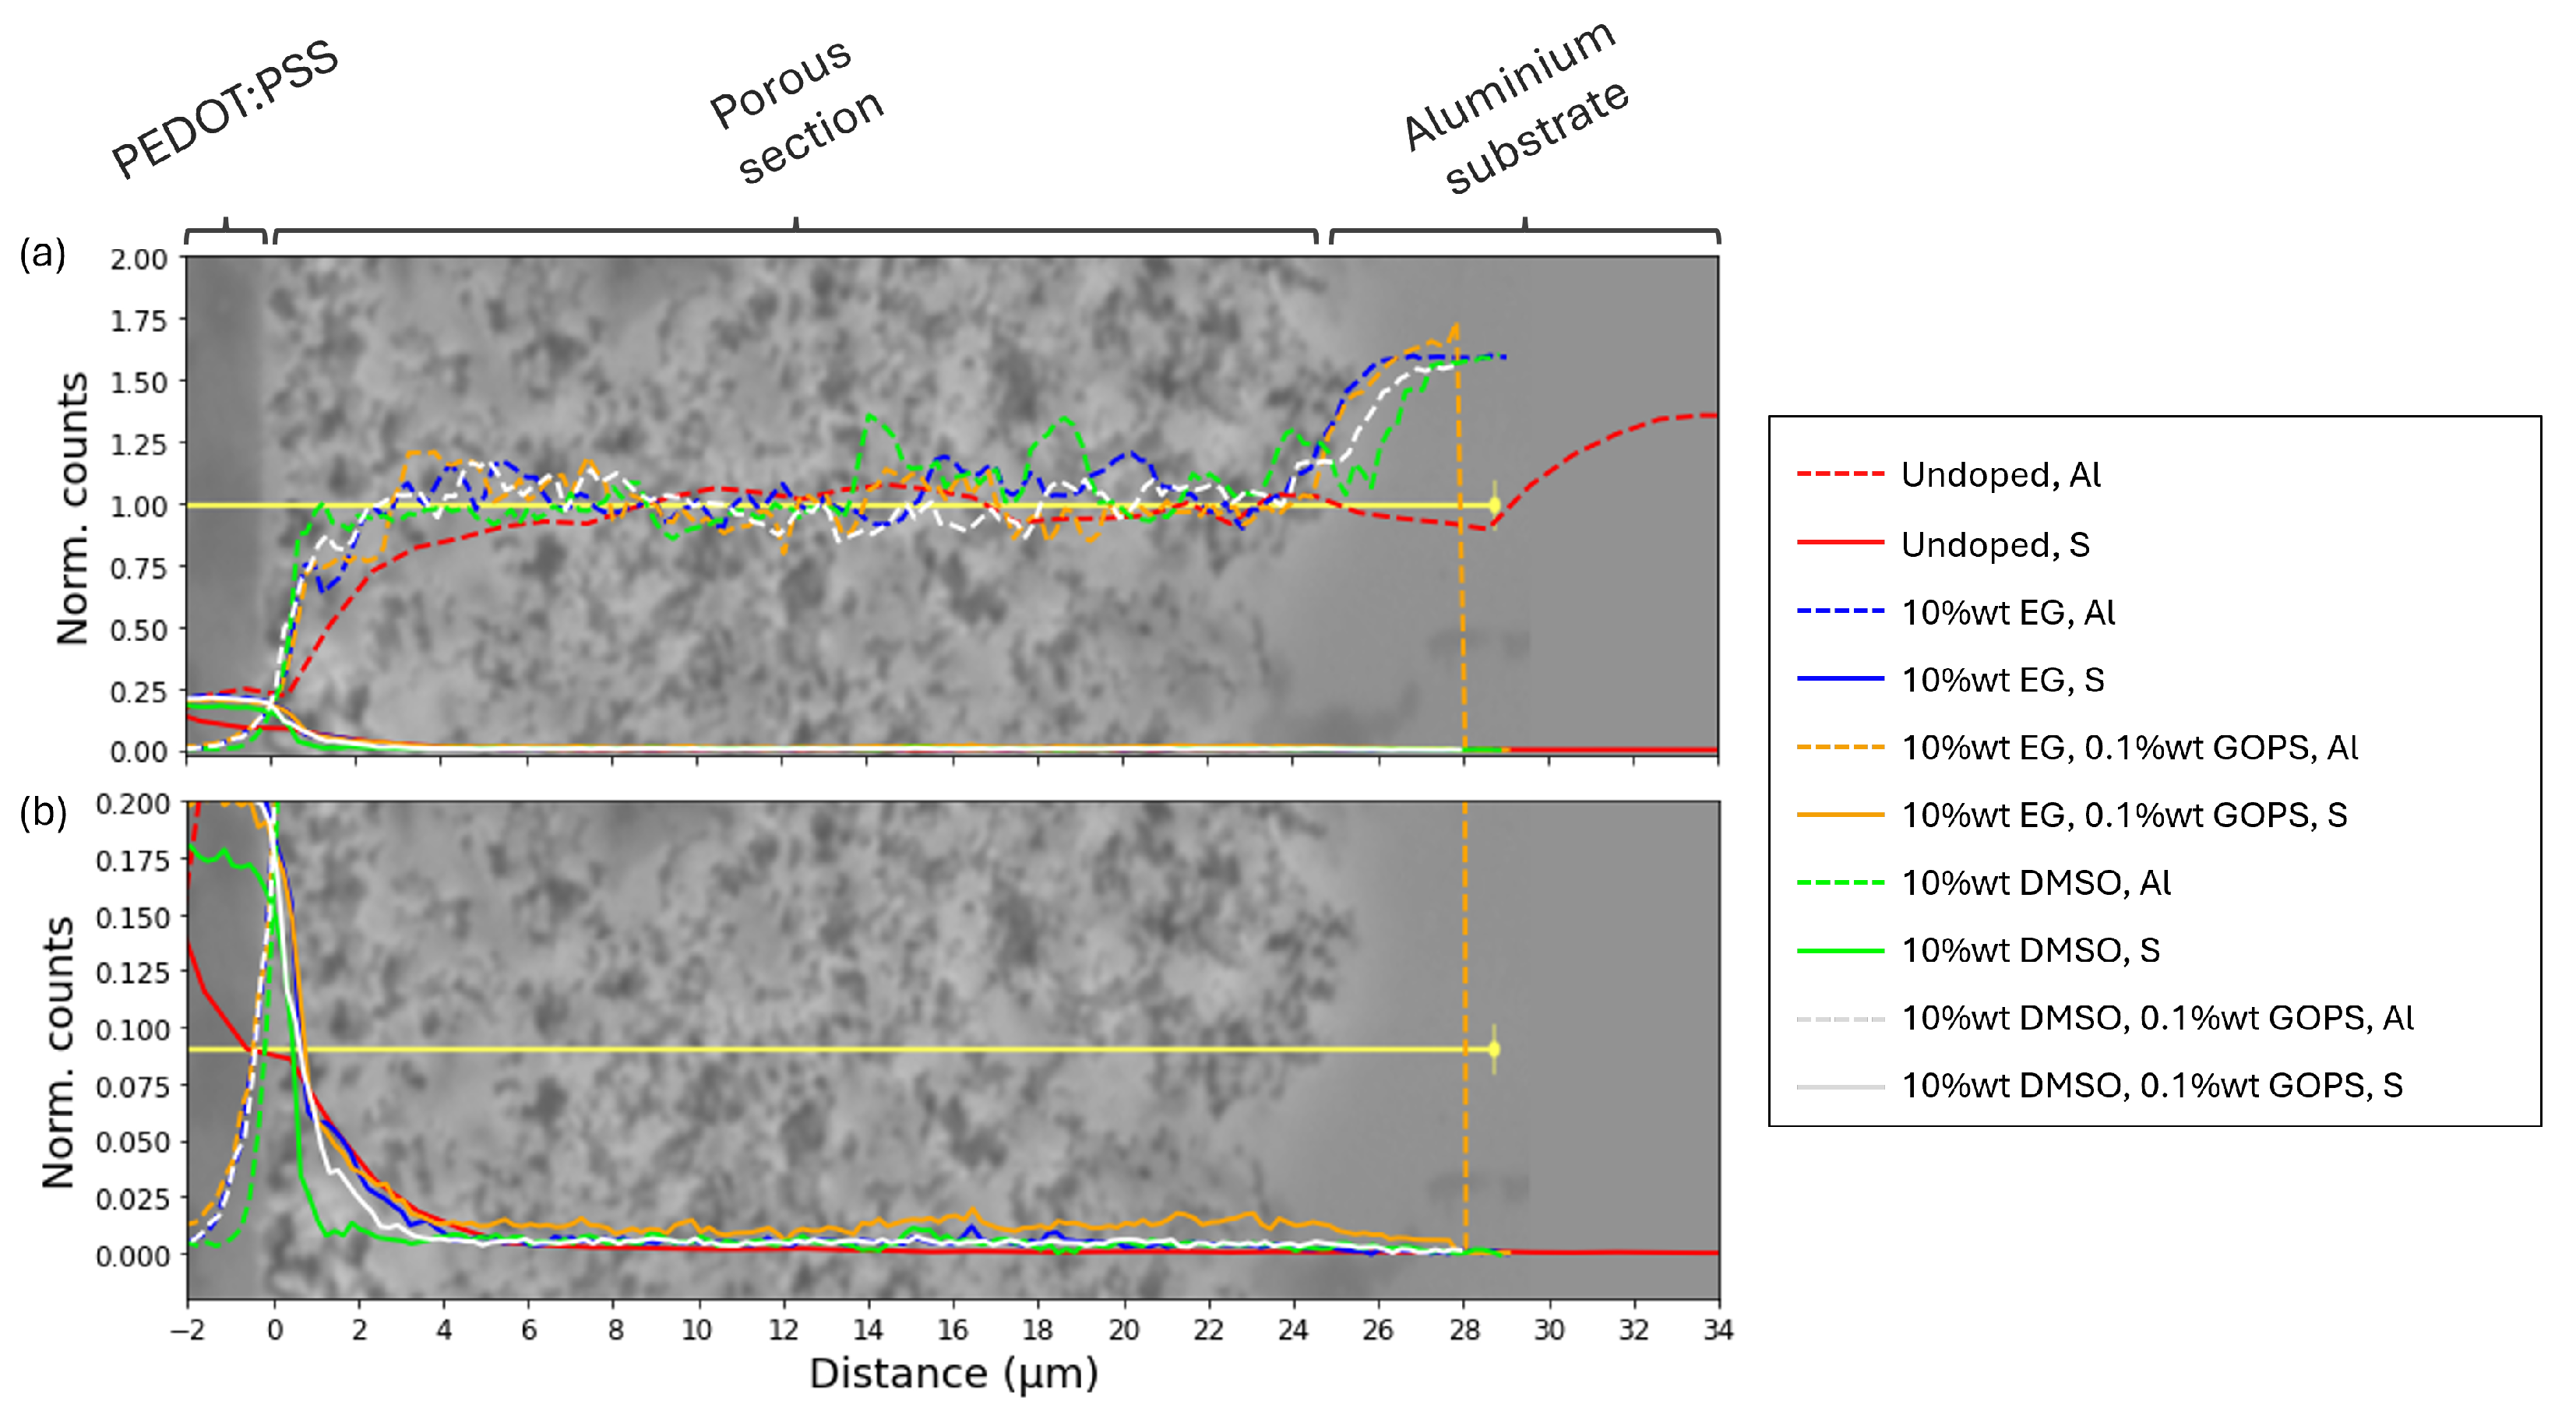
2.2. Influence of Additives on the Behaviour of Polymer Solid Electrolytic Capacitors

After studying the response of undoped PEDOT:PSS on etched aluminium electrodes, a series of compounds or dopants were added to the PEDOT:PSS dispersion to improve the electrical properties of the polymer. Given that the difference in oxide thickness did not show differences in the amount of PEDOT:PSS retrieved in the porous area, the aluminium electrode used for this set of experiments consisted of a porous aluminium substrate with a 26 nm thick oxide layer grown on top. As dopants, two types were used focusing on three properties of PEDOT:PSS layers: conductivity, stability and adhesion. Polar solvents with high boiling points are known to assist in the microstructural organization of PEDOT:PSS, resulting in an increase of the PEDOT:PSS layers conductivity [36,37,38,39]. Among those, ethyleneglycol (EG) and dimethyl sulfoxide (DMSO) are commonly used for that purpose. On the other hand, (3-glycidyloxypropyl)trimethoxysilane (GOPS) is used as an enhancer of the stability and the adhesion [40,41,42]. GOPS interacts with the sulfate groups present in PSS creating cross-links between them and compacting the material. The benefits of GOPS, nevertheless, come at the expense of reducing both the electronic and ionic conductivity [43,44]. Four different formulations, plus one extra representing the undoped PEDOT:PSS, were obtained by combining the dopants according to the composition in Table 3.
In Figure 9, the electrochemical analysis depicted the impedance response for the undoped PEDOT:PSS and the 4 differently doped dispersions deposited onto an etched aluminium electrode with a 26 nm thick aluminium oxide layer. All samples presented a linear evolution of the logarithm of the impedance inversely proportional to the frequency. Regarding the phase angle, all samples showed a pleateau from low frequency values until 1 kHz where they slightly decreased. The samples formed with undoped PEDOT:PSS showed a higher impedance value and phase angle values around −83°. Those samples formed with a doped PEDOT:PSS presented overlapping signals that were shifted towards lower impedance values and phase angles at −89°. Therefore, by visual inspection, all the samples depicted capacitive behaviour, with the exception of the transition towards a resistive behaviour at high frequencies, analogously to the previous analysis on the undoped PEDOT:PSS sample. There was the occurrence of noise at high frequencies for the doped PEDOT:PSS flat samples. The noise appearing at high frequency values originated because of the potentiostat reaching its detection limit for such low impedance values. Further, in the fitting section, it will be observed how the noise signals overlap with the impedance moduli. The overlapping in the doped PEDOT:PSS samples indicated a analogous electrochemical behaviour.
Just as for the analysis of the previous section, extracting the different parameters that define these samples required the fitting of the data which was performed following the same procedure as for the undoped PEDOT:PSS onto a porous electrode. Therefore, the same model used for the samples produced with an undoped PEDOT:PSS dispersion (Figure 2b) was applied. However, the fitting attempts resulted in the divergence to infinite of the components related to the polymer layer, R pol , and Q and α coming from CPE pol . The reason the model could not find appropriate parameters for the fitting of this components was linked to the little to no influence that these had on the fitting process. Namely, the cause of the divergence being the result of the overparametrization of the circuit model. At a sufficiently low value for R pol , the circuit could be simplified to the model in Figure 10b, where the CPE ox and CPE pol in series were added into one CPE component. Consequently, the impedance results were fitted again with this simplified the model.
Thanks to the simplification, the new model provided a satisfactory fit for all samples as exemplified in Figure 10a. Additionally, all the fitting parameters delivered low error values supporting the validity of the fitting process (Table 4). Next, analogously to the calculations performed in the previous section, the model assuming a distribution of time constants along the surface, Brug’s equation, was applied to extract the capacitance values out of the CPE components.
The impact of adding dopants to the PEDOT:PSS dispersion caused the capacitance of the systems to experience an increase of 5 times compared to the undoped sample (Figure 11). As expected from the overlapping impedance signals, the capacitance value obtained out of the CPE components could not be distinguished from one another.
After ascertaining that the addition of dopants had a positive impact on the capacitance of the samples, these were also cut to have access to their cross-section in order to analyse the degree of incorporation of PEDOT:PSS within the porous structure. Similarly to the analysis on the undoped samples (Figure 6a,b), the surface analysis on the cross-section for all doped samples (Figure 12a,c,e,g) depicted an amount of PEDOT:PSS outside the porous section of about 5–7 μ m and the porous section of the aluminium electrode with empty pores. At a higher magnification (Figure 12b,d,f,h) the tight interaction between PEDOT:PSS and the aluminium was observed, but no polymer flowing into the etched structure could be detected.
In order to confirm the presence of residual amounts of PEDOT:PSS covering the walls of the pores, a number EDX linescans were performed ranging from the accumulated PEDOT:PSS layer until the aluminium substrate (Figure 13). Examining the evolution of both aluminium and sulphur signals, the response of all the analysed samples showed a similar evolution. Regarding the evolution of the aluminium signal (Figure 13a, dashed lines), the signal increased from 0 up to a plateau at the transition between the PEDOT:PSS layer and the etched section. During the etched section these signals presented fluctuation as a consequence of the heterogeneity of the surface. Lastly, the signal increased in intensity once it reached the aluminium substrate.
Regarding the sulphur signal (Figure 13b), all the signals decreased at the interface between PEDOT:PSS and the porous aluminium section. The decrease reached a plateau where a little amount of S could be detected up to the aluminium substrate. However, analogously to the analysis performed on the samples formed with undoped PEDOT:PSS, after 6 μ m the sulphur signal decreased to a level where only a residual amount of sulphur could be found. Generally, all samples, with or without dopants of any kind, experienced the same evolution.
After the pertinent analysis of the samples, it was observed that adding high-boiling point polar solvents, such as EG and DMSO improved the electrical properties of porous PEDOT:PSS/aluminium samples. This change was partially motivated by the increase in conductivity of the PEDOT:PSS, partially observed as an effect on the values of R ESR and numerous times reported in literature [45,46]. When PEDOT:PSS has a polar solvent applied to its dispersion, the structure of the PEDOT regions within the polymer change from a coiled conformation into a linear structure which translates into higher carrier mobility and carrier density [47]. Not only the addition of these solvents improved the conductivity, but also enhanced the capacitance of these systems as observed in Figure 11. Analogously to the pristine sample, most of the PEDOT:PSS was found outside the porous structure, where only small amounts of PEDOT:PSS could be found within the first micrometers of the etched aluminium area. Therefore, the standard industrial procedure to bring in polymer in porous structure proved that PEDOT:PSS was not brought homogeneously into the whole extension of the etched section of the aluminium electrode. Regardless, the electrochemical performances obtained when using pristine PEDOT:PSS dispersions and doped ones showed differences on their electrical performances. Upon addition of dopants, the impedance response resembled better the behaviour of an ideal capacitor, observed as the shift in phase angle in the Bode plot (Figure 9). Hence, not only the contact between the polymer and aluminium phase is needed, but also the electrical properties of PEDOT:PSS must be good enough for the electrical current to effectively reach the whole porous area. As an example, despite a trace amount of pristine PEDOT:PSS could be found within the porous structure, the electrical properties of which were not good enough to produce an increase in the capacitance in line with the increase in the area between the two electrodes. On the other hand, the addition of EG and DMSO, that contributed to the increase in conductivity of PEDOT:PSS, allowed the effective use of a larger area, which is reflected in a decrease of the impedance when compared to the samples with undoped PEDOT:PSS. Such an effect is also noted during the fitting of the impedance response, where R pol was omitted (Figure 10b) due to its trivial influence on the impedance response and the two CPE elements were added in series. As a result, the impedance response of these doped samples experienced an increase in capacitance not only because of the PEDOT:PSS layer accumulated outside but also because of the contribution of the PEDOT:PSS within the pores. Regarding the use of GOPS, no observable differences in the electrochemical behaviour were detected when this additive was used.

3. Materials and Methods

3.1. Materials and Production of Samples

The aluminium anodes for this study were provided and produced by the Nippon Chemi-con corporation. The anodes consisted of a 100 μ m thin ultra pure (99.99%) aluminium foil, manufactured in accordance with industry standard procedures. These foils were first electrochemically etched to increase their specific area and secondly anodized in a next step to grow an aluminium oxide layer to a thickness of 26 nm or 65 nm via the application a potential of 20 V and 50 V, respectively. The surface consisted of a random distribution of pores ranging from 0.5 to 5 μ m diameter, presenting identical features to the aluminium electrodes used in the production of this type of capacitors. Next, on one of the faces of the aluminium electrodes, a circular area of 1 cm2 diameter was exposed while the rest of the surface was protected by a non-conductive coating.
The PEDOT:PSS formulations applied onto the aluminium anodes derived from a prepolymerized dispersion composed of PEDOT:PSS (Figure 14) in water in absence of additives (1.2%wt, ORGACON ICP1030) provided by Agfa-Gevaert N.V. The formulations were finished by the Nippon Chemi-con corporation via addition of different dopants. Four dispersions were produced upon addition of ethyleneglycol (EG), dimethyl sulfoxide (DMSO) or (3-glycidyloxypropyl) trimethoxysilane (GOPS) following the composition of Table 3.
Every sample was produced by the Nippon Chemi-con corporation by adding each of the formulations to an aluminium electrode according to industry standards for production of polymer electrolytic capacitors. In order to perform electrochemical tests, a layer of conductive silver paste was applied manually on top of the PEDOT:PSS layer. This layer served as protection for the PEDOT:PSS and as contact for the electrochemical setup (Figure 15).

3.2. Characterization Techniques

3.2.1. Electrochemical Characterization

The evaluation of the performance of these samples was assessed via Odd Random Phase Electrochemical Impedance Spectroscopy (ORP-EIS). This in-house developed technique derives from traditional EIS that applies a special multisine signal in which only odd harmonics are excited all at once and 1 in 3 of these odd harmonics are randomly omitted. The output signal of an ORP-EIS analysis provides the value of impedance thanks to the excited frequencies, while processing the unexcited frequencies, information about the degree of linearity and stationarity of the analysed system can be obtained. Additional information can be found in refs. [48,49]. The multisine applied for this study had an RMS amplitude of 1 mV on top of the open circuit voltage in a frequency range from 100 mHz to 10 kHz. The samples were analysed in absence of liquid electrolyte in a 2-electrode configuration where the silver paste acted as the working electrode and the bare aluminium represented the counter and reference electrode. The samples were connected to a computer with an NI PCI-4461 Data Acquisition card through an in-house developed analog Potentiostat. The ORP-EIS setup was controlled via custom software developed in Python 3.7. The fitting process was conducted using the Python module lmfit [50].

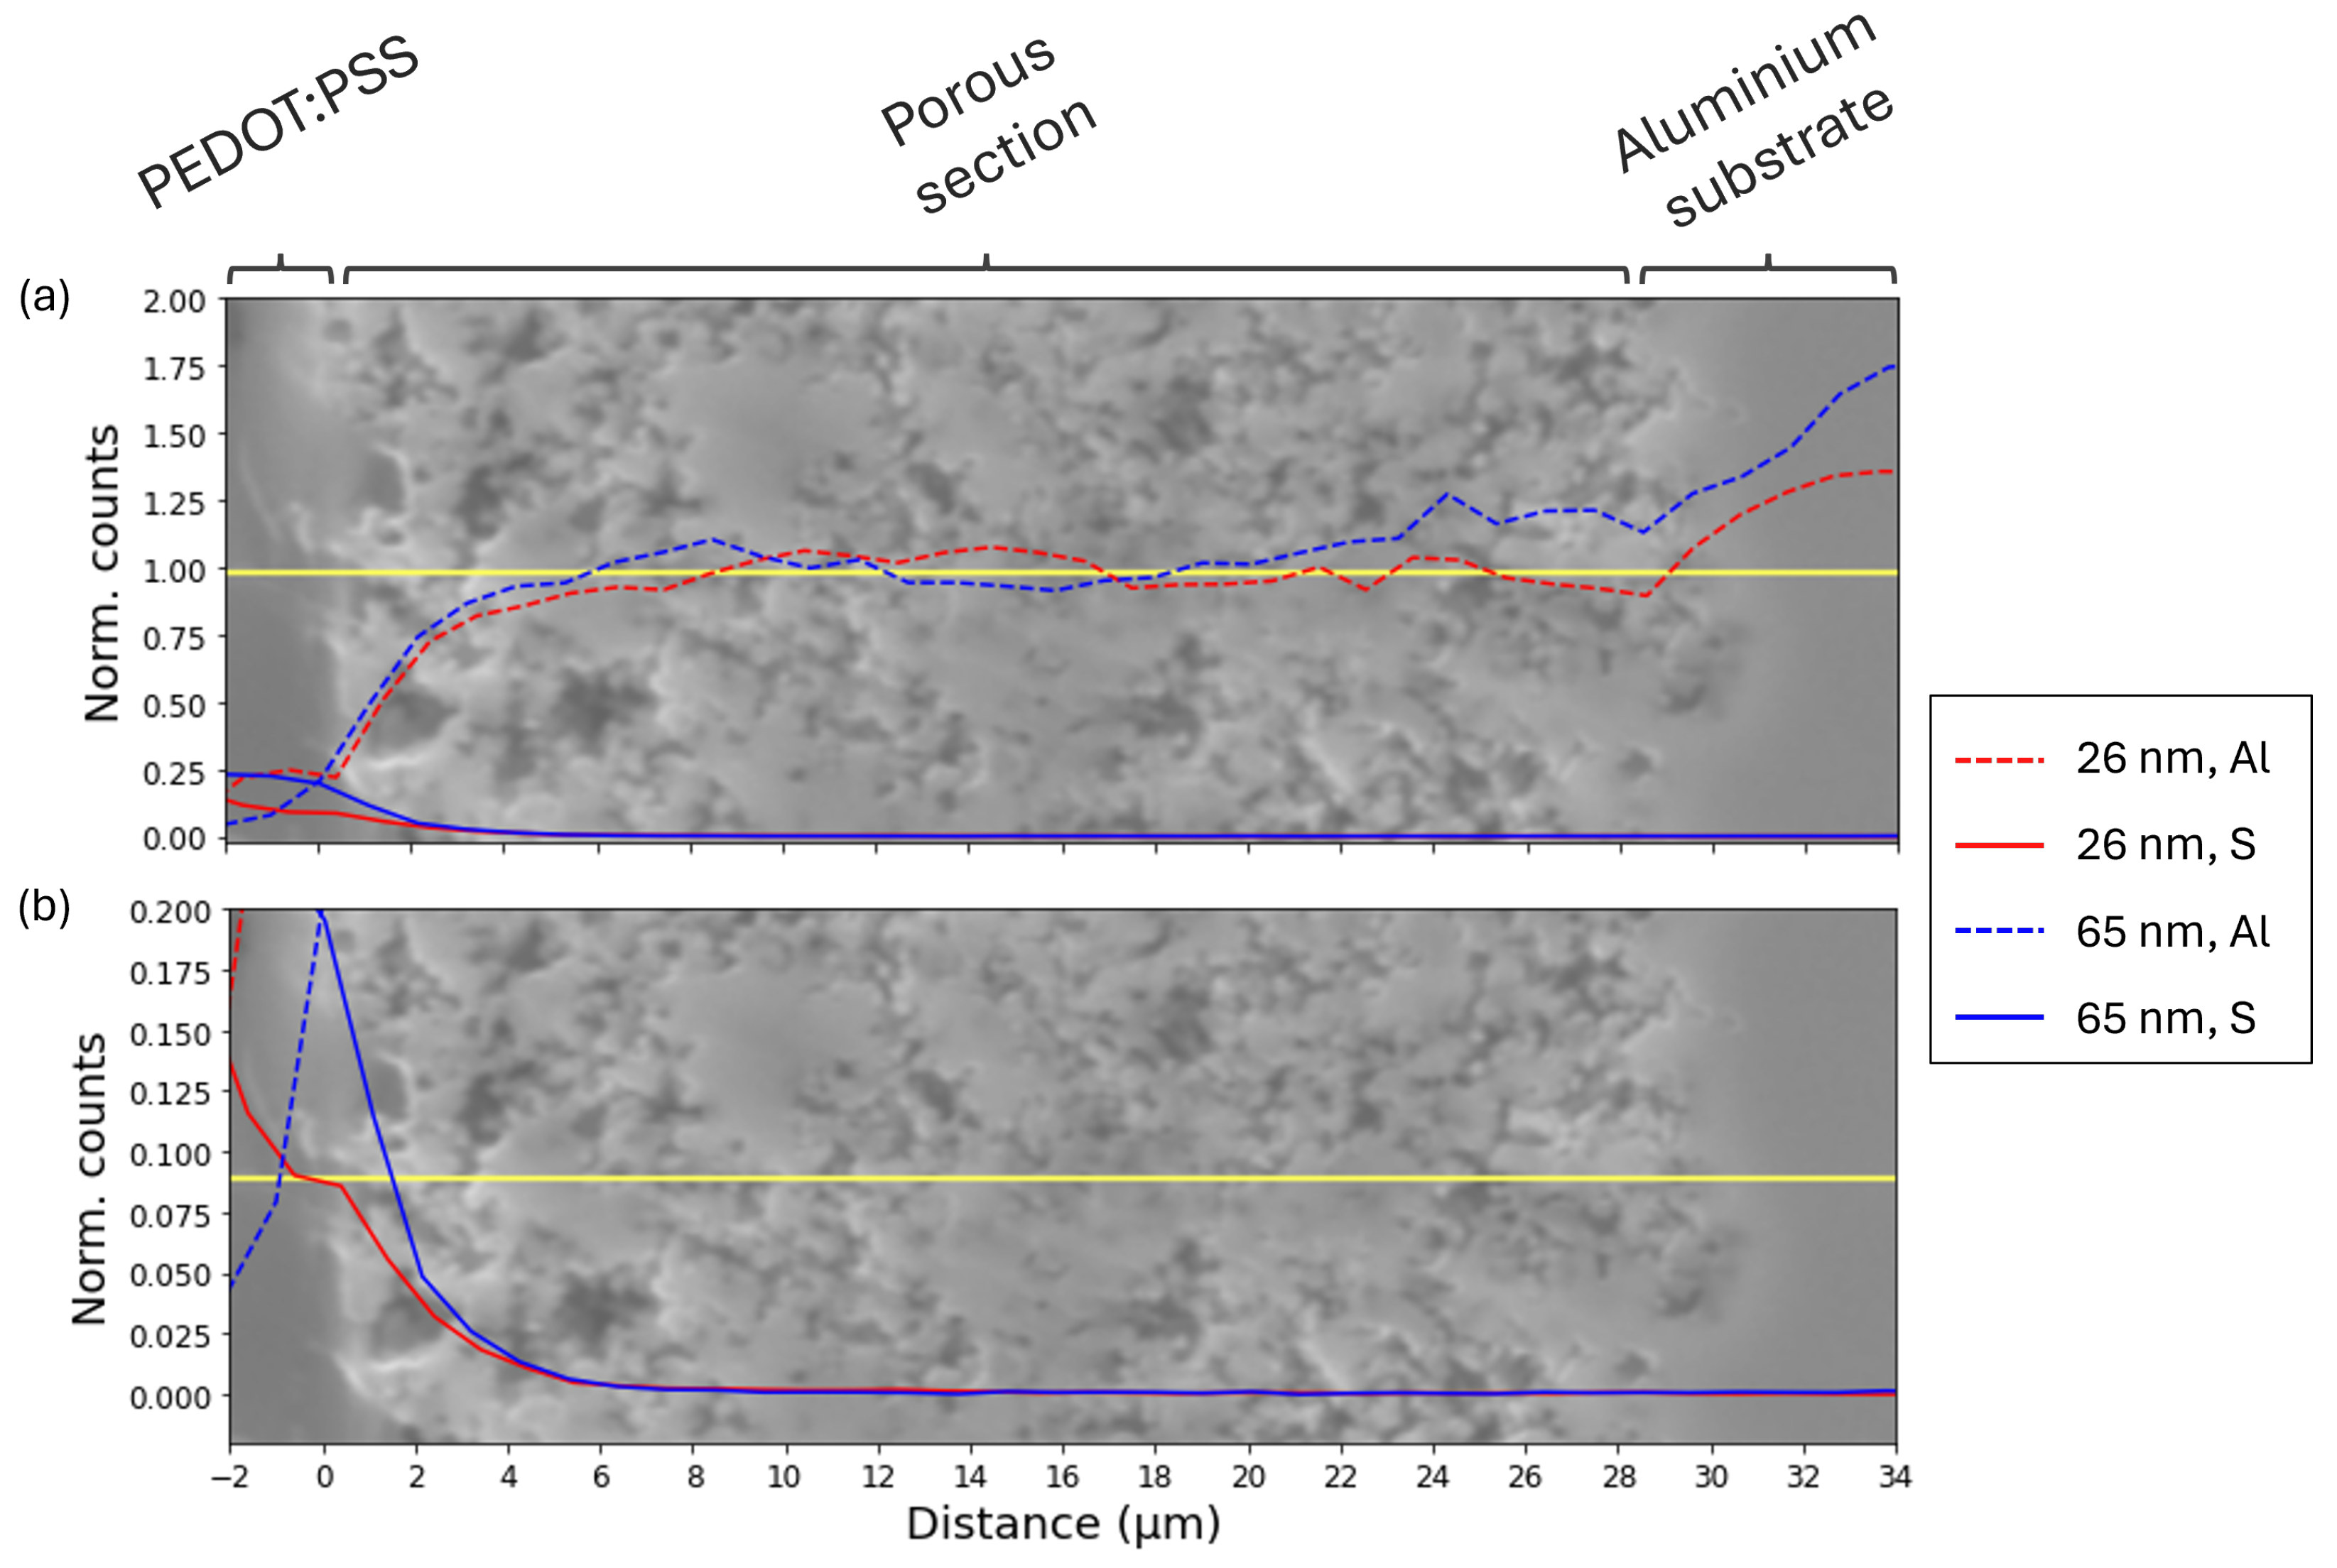
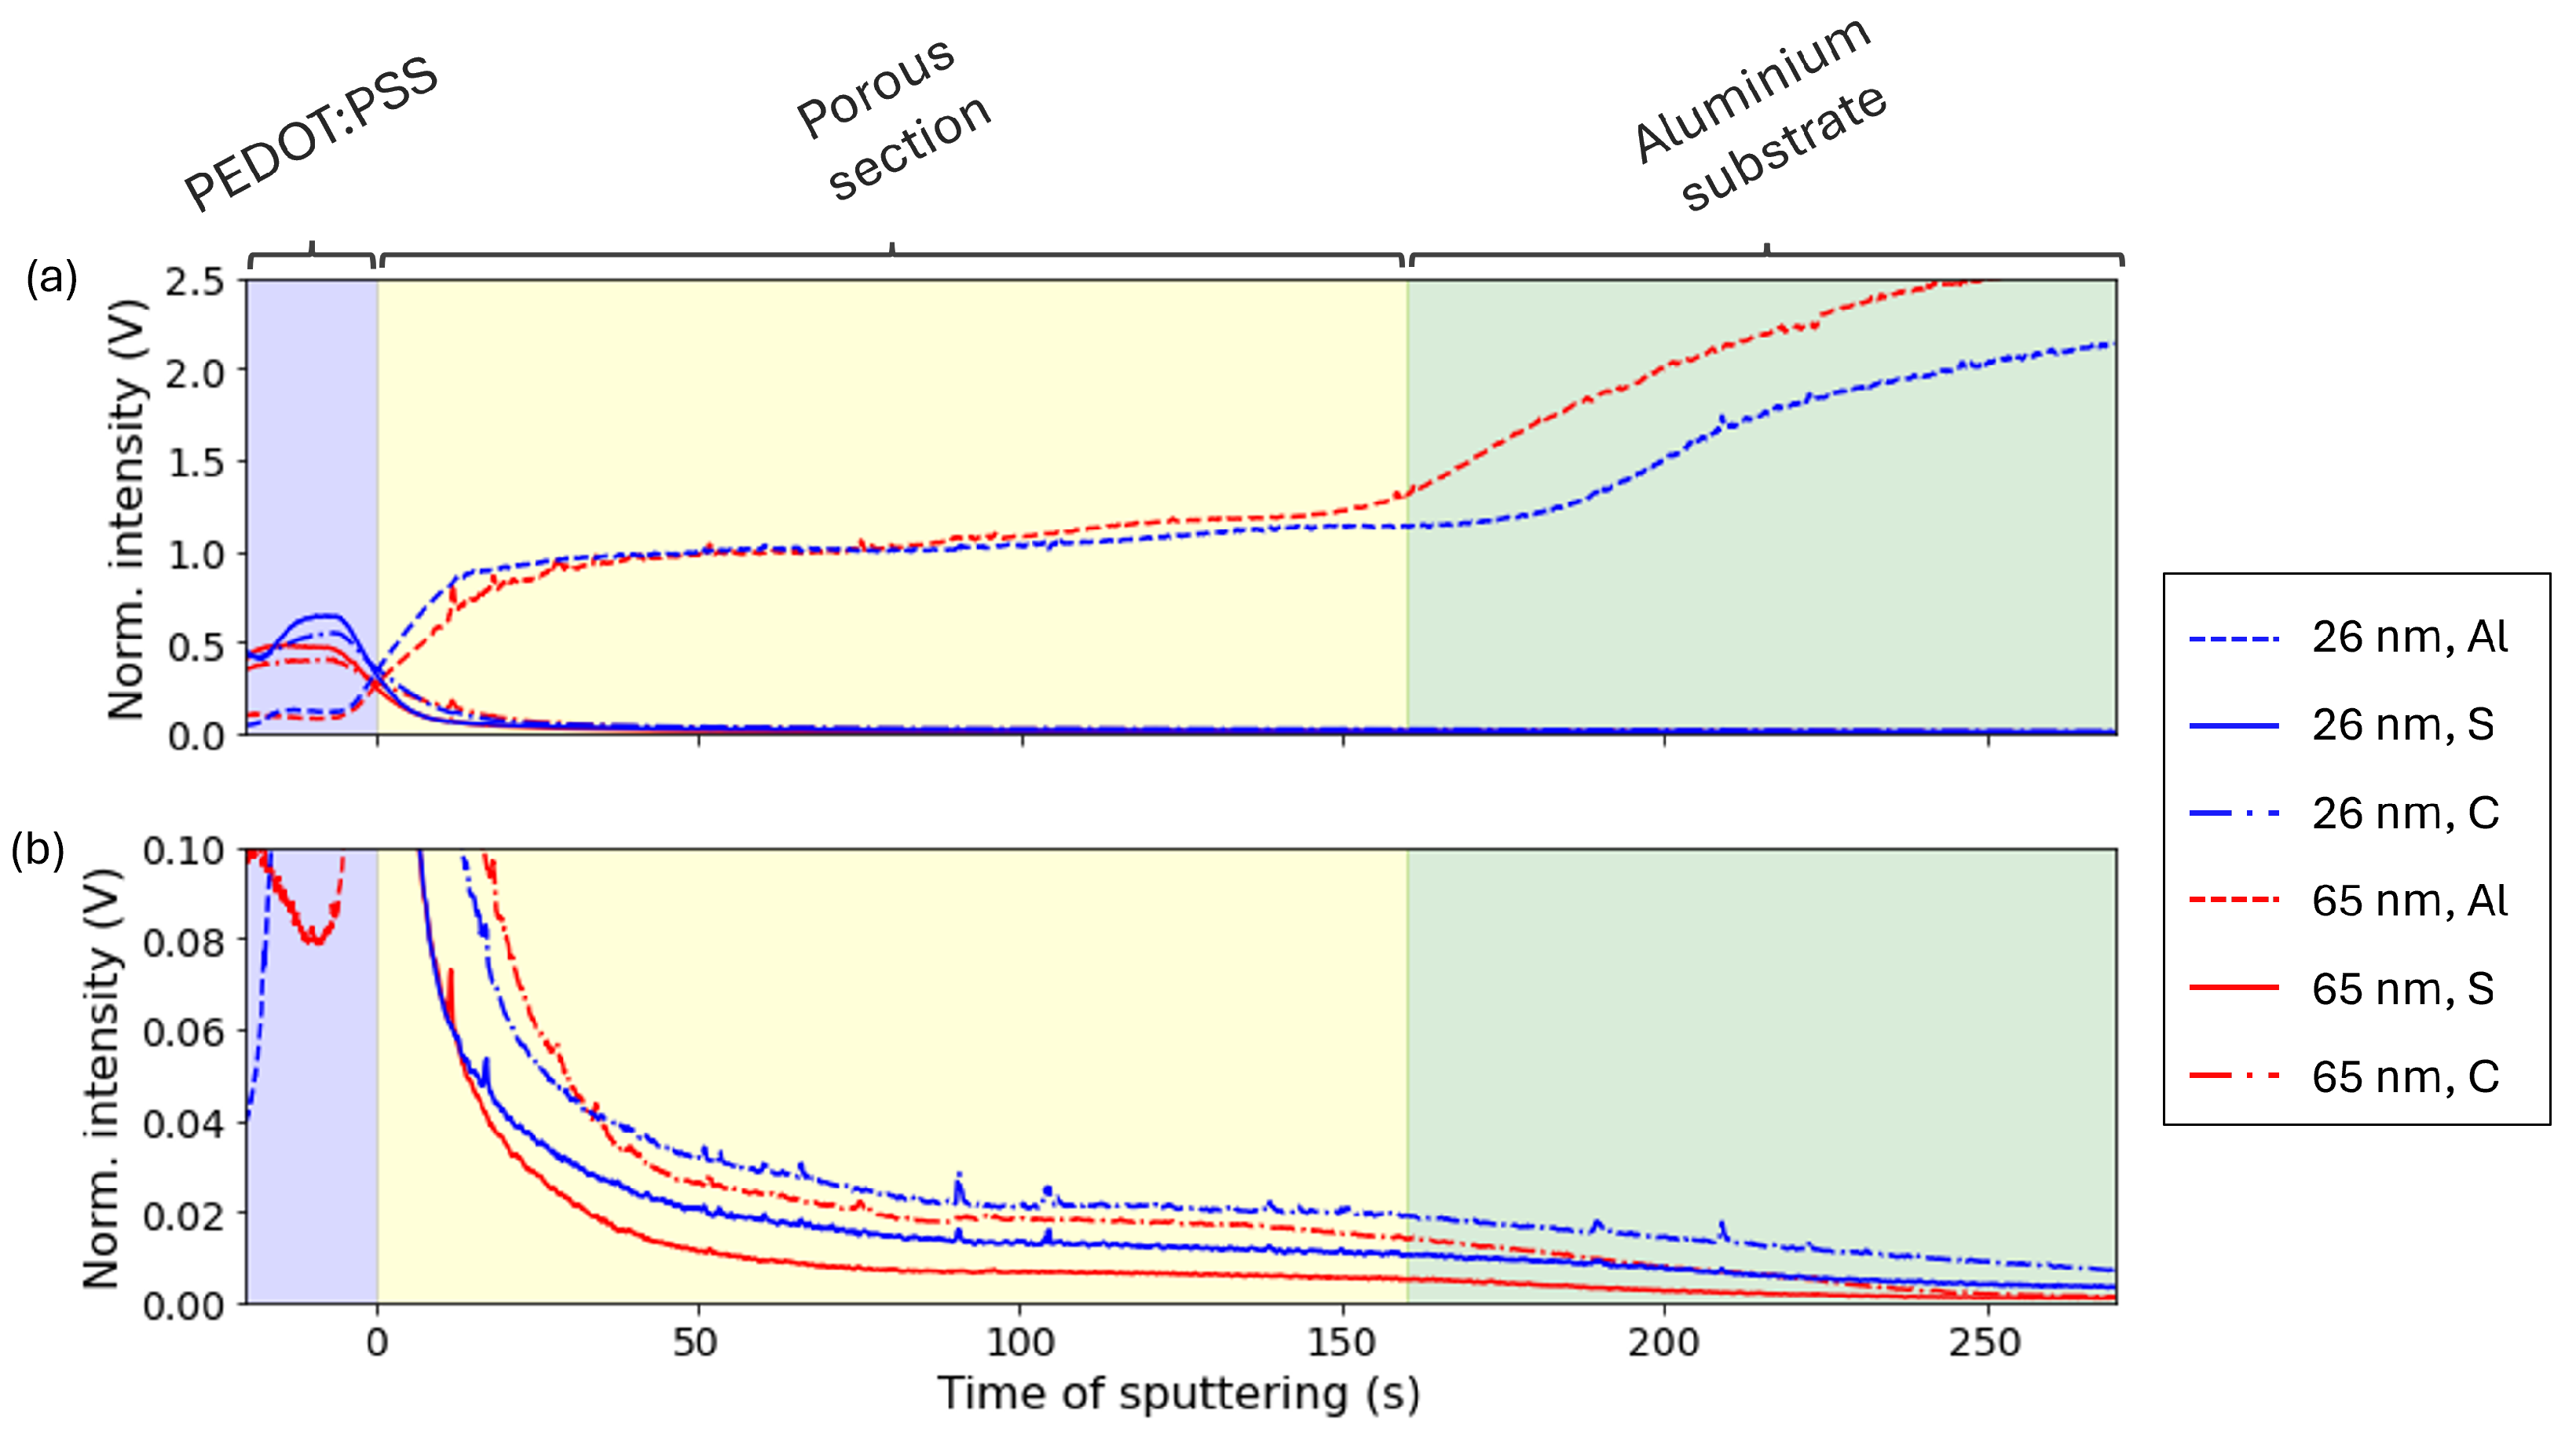
3.2.2. Analysis of the PEDOT:PSS Impregnation

Studying the amount of PEDOT:PSS that can be found into the etched aluminium structure was performed via surface analysis of the cross section of the samples. The samples underwent a pretreatment prior to their analysis. First, every sample was cut with a blade to have access to its cross-section. Later on, a 2 mm wide section of the cross-sections was polished a Ion Milling System ArBlade 5000 cross-section polisher (Hitachi, Tokyo, Japan) using argon gas at an accelerating voltage of 4.5 kV and a discharge voltage of 2 kV for 3 h. After obtaining a clean portion of the cross-section, the analysis of the sections were conducted by means of field-emission scanning electron microscopy (FE-SEM) combined with energy dispersive X-ray spectroscopy (EDX). A FE–SEM JEOL JSM–7100 microscope (JEOL, Tokyo, Japan) was used at an accelerating voltage of 15 kV, a working distance of 10 mm. The microscope was coupled with an Oxford Instruments SDD X-MaxN 80 mm2 Energy Dispersive X-ray spectroscope (Abingdon, UK) and the elemental analysis were performed at an accelerating voltage of 15 kV and a probe current of 1 nA. Compositional depth profiles were also conducted via glow discharge optical emission spectroscopy (GDOES) in a GD-profiler 2™ (Horiba, Kyoto, Japan) instrument. Argon gas was used at a pressure of 550 Pa and applied power of 20 W. The samples were analyzed from the PEDOT:PSS layer until reaching the aluminium substrate, and it took approximately 250 s to perform each profile.

4. Conclusions

The performance of systems formed by a porous aluminium substrate and PEDOT:PSS were evaluated as a model approach for solid state polymer electrolytic capacitors. First, porous aluminium electrodes with an aluminium oxide layer grown on top of two different thicknesses (26 nm and 65 nm) were coated with PEDOT:PSS dispersion with no additives. Examining the differences based on the thickness of the dielectric grown onto the aluminium substrate, both systems experienced the same shift on their impedance signal as that for non-porous aluminium substrates with PEDOT:PSS. The addition of the etched section caused the impedance to decrease, which was connected to the increase in area and that impacted the capacitance of the systems. Analysing the impregnation of PEDOT:PSS within the porous system, the study proved that the industrial standard process for impregnation of PEDOT:PSS on porous substrates produced samples with PEDOT:PSS mostly present in the first 6 μ m of the etched section and only a residual amount was obtained for the remaining 20 μ m of material. Upon addition of different additives, high-boiling point polar solvents were proven effective in improving the capacitive properties of the systems. Not only did they decrease the impedance response, but also they caused the systems to approach the behaviour of an ideal capacitor, shifting the phase angle from −83° to −89°. The additional use of GOPS along with the polar solvents depicted no differences in electrical performance. After the analysis of the cross-section, linescans depicted an analogous scenario to the analysis on the pristine PEDOT:PSS samples: an accumulation of PEDOT:PSS outside the aluminium electrode plus an amount of polymer within the first 6 μ m of the aluminium electrode. After that, only a residual amount of PEDOT:PSS could be traced up to the aluminium substrate that follows the porous section. Consequently, the differences in the electrical performance between the undoped samples and the doped ones were connected with the improve of the electrical properties of PEDOT:PSS within the pores, and not with the degree of impregnation. Hence, optimising the electrical properties of porous aluminium/PEDOT:PSS does not only require an appropriate degree of polymer/pore penetration. Good electrical properties of the PEDOT:PSS, by the use of dopants, are also needed to efficiently use the area of contact between the polymer and the porous aluminium electrode. The presented work deals with the properties and interaction between PEDOT:PSS and porous aluminium electrodes. Nevertheless, the results in this work proved that these model systems can be applied for the study of porous aluminium combined with PEDOT:PSS in a solid state allowing to progress further in their study. Applying the same production of samples, a wider understanding of the properties of these systems can be achieved concerning their temperature stability or their long life characteristics, concerning their cyclability or self-discharge properties, ultimately extending the knowledge on solid state PEDOT:PSS/aluminium capacitors. Additionally, this methodology is not limited to these PEDOT:PSS formulations, but can be applied to the study of other formulations or even other conductive polymers for the study of the link between the impregnation degree and the electrical properties of solid polymer electrolytic capacitors.

Author Contributions

Conceptualization, N.C.G., H.T. and A.H.; Formal analysis, N.C.G. and B.W.; Funding acquisition, H.T. and A.H.; Investigation, N.C.G.; Methodology, N.C.G.; Project administration, H.T. and A.H.; Resources, H.T. and A.H.; Software, B.W.; Supervision, H.T. and A.H.; Validation, N.C.G. and B.W.; Visualization, N.C.G.; Writing—original draft, N.C.G.; Writing—review and editing, B.W., H.T. and A.H. All authors have read and agreed to the published version of the manuscript.

Funding

This research was funded by Agentschap Innoveren & Ondernemen (VLAIO) grant number HBC.2019.2716.

Data Availability Statement

Data are contained within the article.

Acknowledgments

The authors gratefully acknowledge Agfa Gevaert N.V. for providing the polymer dispersions, Nippon Chemi-con for conducting both the production of the doped PEDOT:PSS formulations as well as the production of samples. Also, the authors would like to thank Barbara Van Langenhove and Myriam Madani from OCAS N.V. for performing GDOES measurements.

Conflicts of Interest

The authors declare no conflicts of interest.

References

  1. Kaiser, C.J. The Capacitor Handbook; Springer: Dordrecht, The Netherlands, 1993; p. 129. [Google Scholar] [CrossRef]
  2. Sharma, P.; Bhatti, T.S. A review on electrochemical double-layer capacitors. Energy Convers. Manag. 2010, 51, 2901–2912. [Google Scholar] [CrossRef]
  3. Torki, J.; Joubert, C.; Sari, A. Electrolytic capacitor: Properties and operation. J. Energy Storage 2023, 58, 106330. [Google Scholar] [CrossRef]
  4. Ono, S. Passive Films for Electrolytic Capacitors; Elsevier: Amsterdam, The Netherlands, 2018; pp. 376–395. [Google Scholar] [CrossRef]
  5. Evangelisti, F.; Stiefel, M.; Guseva, O.; Partovi Nia, R.; Hauert, R.; Hack, E.; Jeurgens, L.P.; Ambrosio, F.; Pasquarello, A.; Schmutz, P.; et al. Electronic and structural characterization of barrier-type amorphous aluminium oxide. Electrochim. Acta 2017, 224, 503–516. [Google Scholar] [CrossRef]
  6. Alwitt, R.S.; Uchi, H.; Beck, T.; Alkire, R. Electrochemical Tunnel Etching of Aluminum. J. Electrochem. Soc. 1984, 131, 13. [Google Scholar] [CrossRef]
  7. Abruña, H.D.; Kiya, Y.; Henderson, J.C. Batteries and electrochemical capacitors. Phys. Today 2008, 61, 43–47. [Google Scholar] [CrossRef]
  8. Bauman, J.; Kazerani, M. A comparative study of fuel-cell-battery, fuel-cell-ultracapacitor, and fuel-cell-battery-ultracapacitor vehicles. IEEE Trans. Veh. Technol. 2008, 57, 760–769. [Google Scholar] [CrossRef]
  9. Winter, M.; Brodd, R.J. What Are Batteries, Fuel Cells, and Supercapacitors? Chem. Rev. 2004, 104, 4245–4270. [Google Scholar] [CrossRef]
  10. Yu, A.; Chabot, V.; Zhang, J. Electrochemical Supercapacitors for Energy Storage and Delivery; CRC Press: Boca Raton, FL, USA, 2017; pp. 1–355. [Google Scholar] [CrossRef]
  11. Kötz, R.; Carlen, M. Principles and applications of electrochemical capacitors. Electrochim. Acta 2000, 45, 2483–2498. [Google Scholar] [CrossRef]
  12. Akin, M.; Zhou, X. Recent advances in solid-state supercapacitors: From emerging materials to advanced applications. Int. J. Energy Res. 2022, 46, 10389–10452. [Google Scholar] [CrossRef]
  13. Wang, G.; Zhang, L.; Zhang, J. A review of electrode materials for electrochemical supercapacitors. Chem. Soc. Rev. 2012, 41, 797–828. [Google Scholar] [CrossRef]
  14. Yoo, J.; Kim, J.; Kim, Y.S. Liquid electrolyte-free cylindrical Al polymer capacitor review: Materials and characteristics. J. Power Sources 2015, 284, 466–480. [Google Scholar] [CrossRef]
  15. Holze, R. Metal Oxide/Conducting Polymer Hybrids for Application in Supercapacitors. In Metal Oxides in Supercapacitors; Elsevier Inc.: Amsterdam, The Netherlands, 2017; Chapter 9; pp. 219–245. [Google Scholar] [CrossRef]
  16. Bryan, A.M.; Santino, L.M.; Lu, Y.; Acharya, S.; D’Arcy, J.M. Conducting Polymers for Pseudocapacitive Energy Storage. Chem. Mater. 2016, 28, 5989–5998. [Google Scholar] [CrossRef]
  17. Jonas, F.; Heywang, G.; Schmidtberg, W. Feststoff-Elektrolyte und Diese Enthaltende Elektrolyt-Kondensatoren. European Patent DE3814730A1, 9 November 1989. [Google Scholar]
  18. Carlberg, J.C. Poly(3,4-ethylenedioxythiophene) as Electrode Material in Electrochemical Capacitors. J. Electrochem. Soc. 1997, 144, L61. [Google Scholar] [CrossRef]
  19. Chen, H.W.; Li, C. PEDOT: Fundamentals and Its Nanocomposites for Energy Storage. Chin. J. Polym. Sci. 2020, 38, 435–448. [Google Scholar] [CrossRef]
  20. Pan, Q.; Liu, Q.; Yang, Y.; Tian, D. Abnormal Capacitance Increasing at Elevated Temperature in Tantalum Capacitors with PEDOT:PSS Electrodes. Act. Passiv. Electron. Compon. 2018, 2018, 9864387. [Google Scholar] [CrossRef]
  21. Zhao, Z.; Richardson, G.F.; Meng, Q.; Zhu, S.; Kuan, H.C.; Ma, J. PEDOT-based composites as electrode materials for supercapacitors. Nanotechnology 2016, 27, 042001. [Google Scholar] [CrossRef] [PubMed]
  22. Freeman, Y.; Harrell, W.R.; Luzinov, I.; Holman, B.; Lessner, P. Electrical characterization of tantalum capacitors with poly(3,4-ethylenedioxythiophene) counter electrodes. J. Electrochem. Soc. 2009, 156, 4–10. [Google Scholar] [CrossRef]
  23. Shrivastava, A.; Azarian, M.H.; Pecht, M. Failure of Polymer Aluminum Electrolytic Capacitors Under Elevated Temperature Humidity Environments. IEEE Trans. Compon. Packag. Manuf. Technol. 2017, 7, 745–750. [Google Scholar] [CrossRef]
  24. Calabia Gascón, N.; Terryn, H.; Hubin, A. The role of PEDOT:PSS in (super)capacitors: A review. Next Nanotechnol. 2023, 2, 100015. [Google Scholar] [CrossRef]
  25. Freeman, Y.; Luzinov, I.; Burtovyy, R.; Lessner, P.; Harrell, W.R.; Chinnam, S.; Qazia, J. Capacitance stability in polymer tantalum capacitors with PEDOT counter electrodes. ECS J. Solid State Sci. Technol. 2017, 6, N104–N110. [Google Scholar] [CrossRef]
  26. Koseki, K.; Sakakura, M. Electrolytic Capacitor Having a Solid Electrolyte Layer and Manufacturing Method Thereof. U.S. Patent US10115529B2, 30 October 2018. [Google Scholar]
  27. Sato, K.; Sakakura, M.; Koseki, K. Solid Electrolytic Capacitor and Method for Manufacturing Solid Electrolytic Capacitor. European Patent PCT/JP2016/073037, 8 December 2015. [Google Scholar]
  28. Wakabayashi, T.; Katsunuma, M.; Kudo, K.; Okuzaki, H. PH-Tunable High-Performance PEDOT:PSS Aluminum Solid Electrolytic Capacitors. ACS Appl. Energy Mater. 2018, 1, 2157–2163. [Google Scholar] [CrossRef]
  29. Calabia Gascón, N.; Revilla, R.I.; Wouters, B.; Terryn, H.; Hubin, A. On the Interaction between PEDOT:PSS Dispersions and Aluminium Electrodes for Solid State Electrolytic Capacitors. Inorganics 2024, 12, 104. [Google Scholar] [CrossRef]
  30. Orazem, M.E.; Frateur, I.; Tribollet, B.; Vivier, V.; Marcelin, S.; Pébère, N.; Bunge, A.L.; White, E.A.; Riemer, D.P.; Musiani, M. Dielectric Properties of Materials Showing Constant-Phase-Element (CPE) Impedance Response. J. Electrochem. Soc. 2013, 160, C215–C225. [Google Scholar] [CrossRef]
  31. Brug, G.J.; van den Eeden, A.L.; Sluyters-Rehbach, M.; Sluyters, J.H. The analysis of electrode impedances complicated by the presence of a constant phase element. J. Electroanal. Chem. 1984, 176, 275–295. [Google Scholar] [CrossRef]
  32. Scisco, G.P.; Orazem, M.E.; Ziegler, K.J.; Jones, K.S. On the rate capability of supercapacitors characterized by a constant-phase element. J. Power Sources 2021, 516, 230700. [Google Scholar] [CrossRef]
  33. Scisco, G.P.; Orazem, M.E.; Ziegler, K.J.; Jones, K.S. Resistivity of mesopore-confined ionic liquid determined by electrochemical impedance spectroscopy. Electrochim. Acta 2021, 378, 138112. [Google Scholar] [CrossRef]
  34. Alexander, C.L.; Tribollet, B.; Orazem, M.E. Contribution of Surface Distributions to Constant-Phase-Element (CPE) Behavior: 1. Influence of Roughness. Electrochim. Acta 2015, 173, 416–424. [Google Scholar] [CrossRef]
  35. Song, H.K.; Hwang, H.Y.; Lee, K.H.; Dao, L.H. Effect of pore size distribution on the frequency dispersion of porous electrodes. Electrochim. Acta 2000, 45, 2241–2257. [Google Scholar] [CrossRef]
  36. Lee, S.H.; Sohn, J.S.; Kulkarni, S.B.; Patil, U.M.; Jun, S.C.; Kim, J.H. Modified physico-chemical properties and supercapacitive performance via DMSO inducement to PEDOT:PSS active layer. Org. Electron. 2014, 15, 3423–3430. [Google Scholar] [CrossRef]
  37. Wang, G.F.; Tao, X.M.; Xin, J.H.; Fei, B. Modification of conductive polymer for polymeric anodes of flexible organic light-emitting diodes. Nanoscale Res. Lett. 2009, 4, 613–617. [Google Scholar] [CrossRef]
  38. Shahrim, N.A.; Ahmad, Z.; Wong Azman, A.; Fachmi Buys, Y.; Sarifuddin, N. Mechanisms for doped PEDOT:PSS electrical conductivity improvement. Mater. Adv. 2021, 2, 7118–7138. [Google Scholar] [CrossRef]
  39. Lövenich, W. PEDOT-properties and applications. Polym. Sci. Ser. C 2014, 56, 135–143. [Google Scholar] [CrossRef]
  40. D’Angelo, P.; Tarabella, G.; Romeo, A.; Marasso, S.L.; Verna, A.; Cocuzza, M.; Peruzzi, C.; Vurro, D.; Iannotta, S. PEDOT:PSS Morphostructure and ion-to-electron transduction and amplification mechanisms in organic electrochemical transistors. Materials 2018, 12, 9. [Google Scholar] [CrossRef] [PubMed]
  41. Proctor, C.M.; Rivnay, J.; Malliaras, G.G. Understanding volumetric capacitance in conducting polymers. J. Polym. Sci. Part B Polym. Phys. 2016, 54, 1433–1436. [Google Scholar] [CrossRef]
  42. Savva, A.; Wustoni, S.; Inal, S. Ionic-to-electronic coupling efficiency in PEDOT:PSS films operated in aqueous electrolytes. J. Mater. Chem. C 2018, 6, 12023–12030. [Google Scholar] [CrossRef]
  43. Stavrinidou, E.; Leleux, P.; Rajaona, H.; Khodagholy, D.; Rivnay, J.; Lindau, M.; Sanaur, S.; Malliaras, G.G. Direct measurement of ion mobility in a conducting polymer. Adv. Mater. 2013, 25, 4488–4493. [Google Scholar] [CrossRef]
  44. Håkansson, A.; Han, S.; Wang, S.; Lu, J.; Braun, S.; Fahlman, M.; Berggren, M.; Crispin, X.; Fabiano, S. Effect of (3-glycidyloxypropyl)trimethoxysilane (GOPS) on the electrical properties of PEDOT:PSS films. J. Polym. Sci. Part B Polym. Phys. 2017, 55, 814–820. [Google Scholar] [CrossRef]
  45. Shi, H.; Liu, C.; Jiang, Q.; Xu, J. Effective Approaches to Improve the Electrical Conductivity of PEDOT:PSS: A Review. Adv. Electron. Mater. 2015, 1, 1500017. [Google Scholar] [CrossRef]
  46. Ouyang, J.; Xu, Q.; Chu, C.W.; Yang, Y.; Li, G.; Shinar, J. On the mechanism of conductivity enhancement in poly(3,4- ethylenedioxythiophene):poly(styrene sulfonate) film through solvent treatment. Polymer 2004, 45, 8443–8450. [Google Scholar] [CrossRef]
  47. Wei, Q.; Mukaida, M.; Naitoh, Y.; Ishida, T. Morphological change and mobility enhancement in PEDOT:PSS by adding co-solvents. Adv. Mater. 2013, 25, 2831–2836. [Google Scholar] [CrossRef]
  48. Van Ingelgem, Y.; Tourwé, E.; Blajiev, O.; Pintelon, R.; Hubin, A. Advantages of odd random phase multisine electrochemical impedance measurements. Electroanalysis 2009, 21, 730–739. [Google Scholar] [CrossRef]
  49. Van Gheem, E.; Pintelon, R.; Vereecken, J.; Schoukens, J.; Hubin, A.; Verboven, P.; Blajiev, O. Electrochemical impedance spectroscopy in the presence of non-linear distortions and non-stationary behaviour Part I: Theory and validation. Electrochim. Acta 2004, 49, 4753–4762. [Google Scholar] [CrossRef]
  50. Newville, M.; Stensitzki, T.; Allen, D.B.; Ingargiola, A. LMFIT: Non-Linear Least-Square Minimization and Curve-Fitting for Python, version 0.8.0; Zenodo: Geneva, Switzerland, 2014. [CrossRef]
Figure 1. Bode plot of the impedance response of 4 undoped PEDOT:PSS/aluminium systems. The solid lines correspond to systems composed of a flat aluminium substrate whereas the dashed lines correspond to a system with an etched aluminium. Additionally, each type of system had an aluminium oxide formed of either 26 nm (blue) or 65 nm (red).
Inorganics 12 00185 g001
Figure 2. Model circuit that describe the behaviour of system formed by undoped PEDOT:PSS, an aluminium oxide layer grown onto (a) a flat aluminium substrate or (b) a porous aluminium substrate. The electrolyte resistance is represented by R ESR , the inductance of the wiring by L, the non-ideal capacitance of the oxide by CPE ox and an extra nested system takes into account the PEDOT:PSS layer, R pol - CPE pol .
Inorganics 12 00185 g002
Figure 3. Fitting results after applying the circuit in Figure 2a for both flat aluminium/PEDOT:PSS samples with an oxide layer thickness of (a) 26 nm and (b) 65 nm.
Inorganics 12 00185 g003
Figure 4. Fitting results after applying the circuit presented in Figure 2b to porous aluminium/PEDOT:PSS samples with an oxide layer of (a) 26 nm and (b) 65 nm.
Inorganics 12 00185 g004
Figure 5. Capacitance values extracted using a surface distribution model from the CPE ox for samples using flat and porous electrodes of two different thickness (26 nm and 65 nm). The values are obtained averaging over 4 samples.
Inorganics 12 00185 g005
Figure 6. SEM images of the combination PEDOT:PSS/etched area/aluminium substrate with an aluminium oxide layer of (a,b) 26 nm or (c,d) 65 nm.
Inorganics 12 00185 g006
Figure 7. (a) Linescan EDX analysis for PEDOT:PSS/porous aluminium systems with 26 nm (red) and 65 nm (blue) anodized alumina layer. Both (dashed) aluminium and (solid) sulphur signals were first normalized prior to their analysis. (b) Close up of the sulphur signal.
Inorganics 12 00185 g007
Figure 8. (a) GDOES analysis for PEDOT:PSS/porous aluminium systems with 26 nm (blue) and 65 nm (red) anodized alumina layer. All (dashed) aluminium, (solid) sulphur, and (solid dot) carbon signals were first normalized prior to their analysis. (b) Close up of the carbon and sulphur signal. The different coloured sections depict the areas of the cross-section: (blue) PEDOT:PSS layer, (yellow) porous section and (green) aluminium substrate.
Inorganics 12 00185 g008
Figure 9. Bode plot of the impedance response of PEDOT:PSS/porous aluminium systems at different levels of doping.
Inorganics 12 00185 g009
Figure 10. (a) Fitting results of doped PEDOT:PSS/etched aluminium substrate with a 26 nm anodised oxide layer after deposition of PEDOT:PSS doped with 10%wt EG upon application of (b) the model circuit. The use of this circuit model delivered similar fitting results for all the doped samples.
Inorganics 12 00185 g010
Figure 11. Capacitance values extracted using a surface distribution model from the CPE ox for samples a porous aluminium electrode with an anodised oxide layer of 26 nm and PEDOT:PSS both undoped and doped according to the formulations presented in Table 3. The values are obtained averaging over 4 samples.
Inorganics 12 00185 g011
Figure 12. SEM images of the combination PEDOT:PSS/etched area/aluminium substrate with a 26 nm thick aluminium oxide layer and different degrees of PEDOT:PSS doping: PEDOT:PSS doped with (a,b) 10%wt EG, (c,d) 10%wt EG and 10%wt GOPS, (e,f) 10%wt DMSO, and (g,h) 10%wt DMSO and 10%wt GOPS.
Inorganics 12 00185 g012
Figure 13. (a) Linescan EDX analysis for PEDOT:PSS/porous aluminium systems with a 26 nm anodized alumina layer for differently doped PEDOT:PSS dispersions (following composition of Table 3). Both (dashed) aluminium and (solid) sulphur signals were first normalized prior to their analysis. (b) Close up of the sulphur signal.
Inorganics 12 00185 g013
Figure 14. Simplified chemical structure of PEDOT (left) and PSS (right).
Inorganics 12 00185 g014
Figure 15. Schematic of the PEDOT:PSS cathode–aluminium etched anode ready for electrochemical analysis.
Inorganics 12 00185 g015
Table 1. Fitting results parameters and fitting errors after applying the circuit model in Figure 2a to two flat systems: one with an aluminium oxide of 26 nm, and another one with an aluminium oxide of 65 nm.
PEDOT:PSS/Al2O3/Flat AlPEDOT:PSS/Al2O3/Flat Al
δ Al 2 O 3 = 26 nm δ Al 2 O 3 = 65 nm
R ESR ( Ω ) 1.53 ± 0.02 2.45 ± 0.03
Q ox ( n F / s ( 1 α ) c m 2 ) 364.63 ± 0.03 148.11 ± 0.01
α o x 0.989 ± 2 × 10 5 0.993 ± 2 × 10 5
R pol ( Ω ) 22.89 ± 0.58 39.5 ± 2.3
Q pol ( n F / s ( 1 α ) c m 2 ) ( 260.7 ± 8.7 )   ×   10 3 ( 160.1 ± 8.2 )   ×   10 3
α p o l 0.679 ± 0.003 0.733 ± 0.005
Table 2. Fitting results alongside fitting errors after applying the circuit model in Figure 2b to two both porous systems with an aluminium oxide of either 26 nm or 65 nm, respectively.
PEDOT:PSS/ Al2O3/Porous AlPEDOT:PSS/ Al2O3/Porous Al
δ Al 2 O 3 = 26 nm δ Al 2 O 3 = 65 nm
R ESR ( Ω ) 0.759 ± 0.001 1.068 ± 0.001
L ( μ H) 2.96 ± 0.02 2.96 ± 0.02
Q ox ( μ F / s ( 1 α ) c m 2 ) 16.72 ± 0.07 6.208 ± 0.001
α o x 0.929 ± 2 × 10 4 0.926 ± 6 × 10 5
R pol ( Ω ) 117.7 ± 3.9 30.3 ± 0.8
Q pol ( μ F / s ( 1 α ) c m 2 ) 739.6 ± 16.7 443.7 ± 4.3
α p o l 0.739 ± 0.001 0.852 ± 0.001
Table 3. Scheme depicting the combination of dopants added to the pristine PEDOT:PSS dispersion. The dopants are ethyleneglycol (EG), dimethyl sulfoxide (DMSO) and (3-glycidylpropyl) trimethoxysilane (GOPS).
EGDMSOGOPS
PEDOT:PSS 1---
PEDOT:PSS 210%wt--
PEDOT:PSS 310%wt-0.1%wt
PEDOT:PSS 4-10%wt-
PEDOT:PSS 5-10%wt0.1%wt
Table 4. Fitting results and fitting errors after applying the circuit model in Figure 10b to porous systems with an aluminium oxide of 26 nm with deposited PEDOT:PSS at different levels of doping.
R ESR L Q ox α o x
( Ω ) ( μ H) ( μ F / s ( 1 α ) cm2) -
10%wt EG 0.102 ± 0.004 2.2 ± 0.1 36.3 ± 0.2 0.979 ± 0.001
10%wt EG, 0.1%wt GOPS 0.134 ± 0.004 2.5 ± 0.1 35.5 ± 0.2 0.980 ± 0.001
10%wt DMSO 0.123 ± 0.003 2.3 ± 0.1 35.3 ± 0.2 0.981 ± 0.001
10%wt DMSO, 0.1%wt GOPS 0.101 ± 0.004 2.8 ± 0.1 36.5 ± 0.2 0.981 ± 0.001
Disclaimer/Publisher’s Note: The statements, opinions and data contained in all publications are solely those of the individual author(s) and contributor(s) and not of MDPI and/or the editor(s). MDPI and/or the editor(s) disclaim responsibility for any injury to people or property resulting from any ideas, methods, instructions or products referred to in the content.

