Article

Infrared Light Annealing Effect on Pressure Sensor Fabrication Using Graphene/Polyvinylidene Fluoride Nanocomposite

by
Victor K. Samoei
1,
Katsuhiko Takeda
2,
Keiichiro Sano
2,
Angshuman Bharadwaz
3,
Ambalangodage C. Jayasuriya
3,4 and
Ahalapitiya H. Jayatissa
1,*
1
Nanotechnology and MEMS Laboratory, Department of Mechanical, Industrial, and Manufacturing Engineering (MIME), The University of Toledo, Toledo, OH 43606, USA
2
Kanto Gakuin University, 1-50-1, Mutsuura-Higashi, Kanazawa, Yokohama 236-8503, Japan
3
Biomedical Engineering Program, Department of Bioengineering, College of Engineering, The University of Toledo, Toledo, OH 43606, USA
4
Department of Orthopaedic Surgery, College of Medicine and Life Sciences, The University of Toledo, Toledo, OH 43614, USA
*
Author to whom correspondence should be addressed.
Inorganics 2024, 12(8), 228; https://doi.org/10.3390/inorganics12080228
Submission received: 10 July 2024 / Revised: 18 August 2024 / Accepted: 19 August 2024 / Published: 21 August 2024
(This article belongs to the Special Issue Carbon Nanomaterials for Advanced Technology)

Abstract

:
This paper reports the designing and testing, as well as the processing and testing, of a flexible piezoresistive sensor for pressure-sensing applications, utilizing a composite film of graphene/polyvinylidene fluoride (Gr/PVDF). Graphene serves as the conductive matrix, while PVDF acts as both the binder and a flexible polymer matrix. The composite film was fabricated using the solution casting technique on a flexible polyethylene substrate. We investigated the impact of post-infrared annealing on the pressure response of the Gr/PVDF films. The experimental results indicated that the films IR-annealed for 2 min exhibited improved pressure sensitivity compared with the as-deposited films. The stability and durability of the sensors were assessed through the application of pressure over more than 1000 cycles. The mechanical properties of the films were examined using a universal tensile testing machine (UTM) for scenarios both with and without infrared light annealing. Raman spectroscopy was employed to analyze the quality and characteristics of the prepared nanocomposites. This study enhances our understanding of the interplay between the Gr/PVDF composite, the IR annealing effect, and the hysteresis effect in the pressure-sensing mechanism, thereby improving the piezoresistance of the Gr/PVDF nanocomposite through the infrared annealing process.

1. Introduction

Pressure sensors that are highly sensitive and flexible have attracted tremendous research interest in recent years due to their numerous applications in health care, wearable electronics, the automotive industry, consumer electronics, and smart monitoring systems [1,2,3]. Flexible pressure sensors can be categorized according to their working principle and sensing performance, i.e., as piezoresistive, piezoelectric, capacitive, piezomagnetic, and optical sensors [4,5,6]. There are many fabrication methods for flexible sensors; these methods include screen printing, electrospinning, photolithography, spin coating, and inkjet printing. In the past decade, nanocomposite materials with nanoscale fillers have been widely explored for the fabrication of flexible sensors because of the increased specific interfacial area and higher achievable loads [7,8].
Graphene (Gr) polymer nanocomposite is one example that has gained a lot of attention for the fabrication of flexible sensors. Its good mechanical, thermal, and electrical properties are suitable for use as a nanofiller in polymer matrixes. Furthermore, its good physical properties and ability to disperse in various polymers have led to the development of graphene-based high-performing nanocomposites [9,10,11]. The π-π interaction in graphene and polymer forms a stronger interface. Polyvinylidene fluoride (PVDF) has fluorine atoms that possess a high affinity with carbon atoms. The binding capability between PVDF and graphene is due to the presence of electron-rich benzene rings in graphene and electron-poor fluorine atoms. This polar ionic bond between carbon–fluorine atoms (C+–F) is an attractive interaction that holds the nanocomposite together. Thus, PVDF acts as a good binder in the formation of a conductive Gr/PVDF nanocomposite [12].
Many processes have been explored to fabricate Gr/PVDF films for different applications. The melt extrusion and injection processes have been used to fabricate Gr/PVDF composites [13]. The experimental results from this fabrication method have shown an improvement in the crystallinity, thermal stability, and mechanical properties of the composite. The Raman spectra used to analyze the interaction between graphene particles and PVDF indicated a decrease in the D and G band (ID/IG) intensity ratio. This decrease indicates that the defects were healed of GP, possibly caused by the interactions between the polar groups of PVDF and the GP layers [10]. Shuai, C. et al. reported a selective laser sintering (SLS) fabrication process for graphene oxide (GO)/PVDF scaffolds; here, irradiation of a laser beam was used to adhere the melted powders [13]. This fabrication process resulted in good interaction between the fluorine group of PVDF and the carbonyl group of GO nanosheets, which led to an α to β phase transformation of PVDF. The enhanced β phase exhibits good piezoelectric and mechanical properties in the composite [13]. The phase-separation-based fabricated PVDF/GO nanocomposite was coated on a flexible fabric for application in wearable piezoelectric sensors. Also, the thermal properties of graphene/polymer composites have been reported by many researchers [14]. Zheng, X. et al. prepared a series of functionalized graphene and introduced it into the PVDF matrix to prepare Gr/PVDF nanosheet composites [15]. The dielectric effects were investigated for these composites, and it was clear that the reduced graphene samples had better dielectric properties [15]. Table 1 gives a summary of other fabrication methods for Gr/PVDF nanocomposites and their applications.
In this study, the Gr/PVDF nanocomposite was prepared via a solution phase technique and coated on the flexible polyethylene (PE) substrate to fabricate a thin film for pressure sensor analysis. Five nanocomposite films were prepared for this analysis. For clear comparisons, the films were annealed using infrared light at a different time step. Raman spectroscopy was used for the characterization of these films. The piezoresistive effect of the prepared materials was utilized to record the signal in terms of resistance to change and the externally applied pressure. It was found that the film annealed for 2 min showed a high performance in terms of sensitivity, repeatability, and accuracy. The novelty of this research lies in the use of infrared (IR) annealing to enhance the sensing characteristics of graphene/polyvinylidene fluoride (Gr/PVDF) films, with the added advantage of the rapid annealing capability offered by IR light.

2. Experimental Procedure

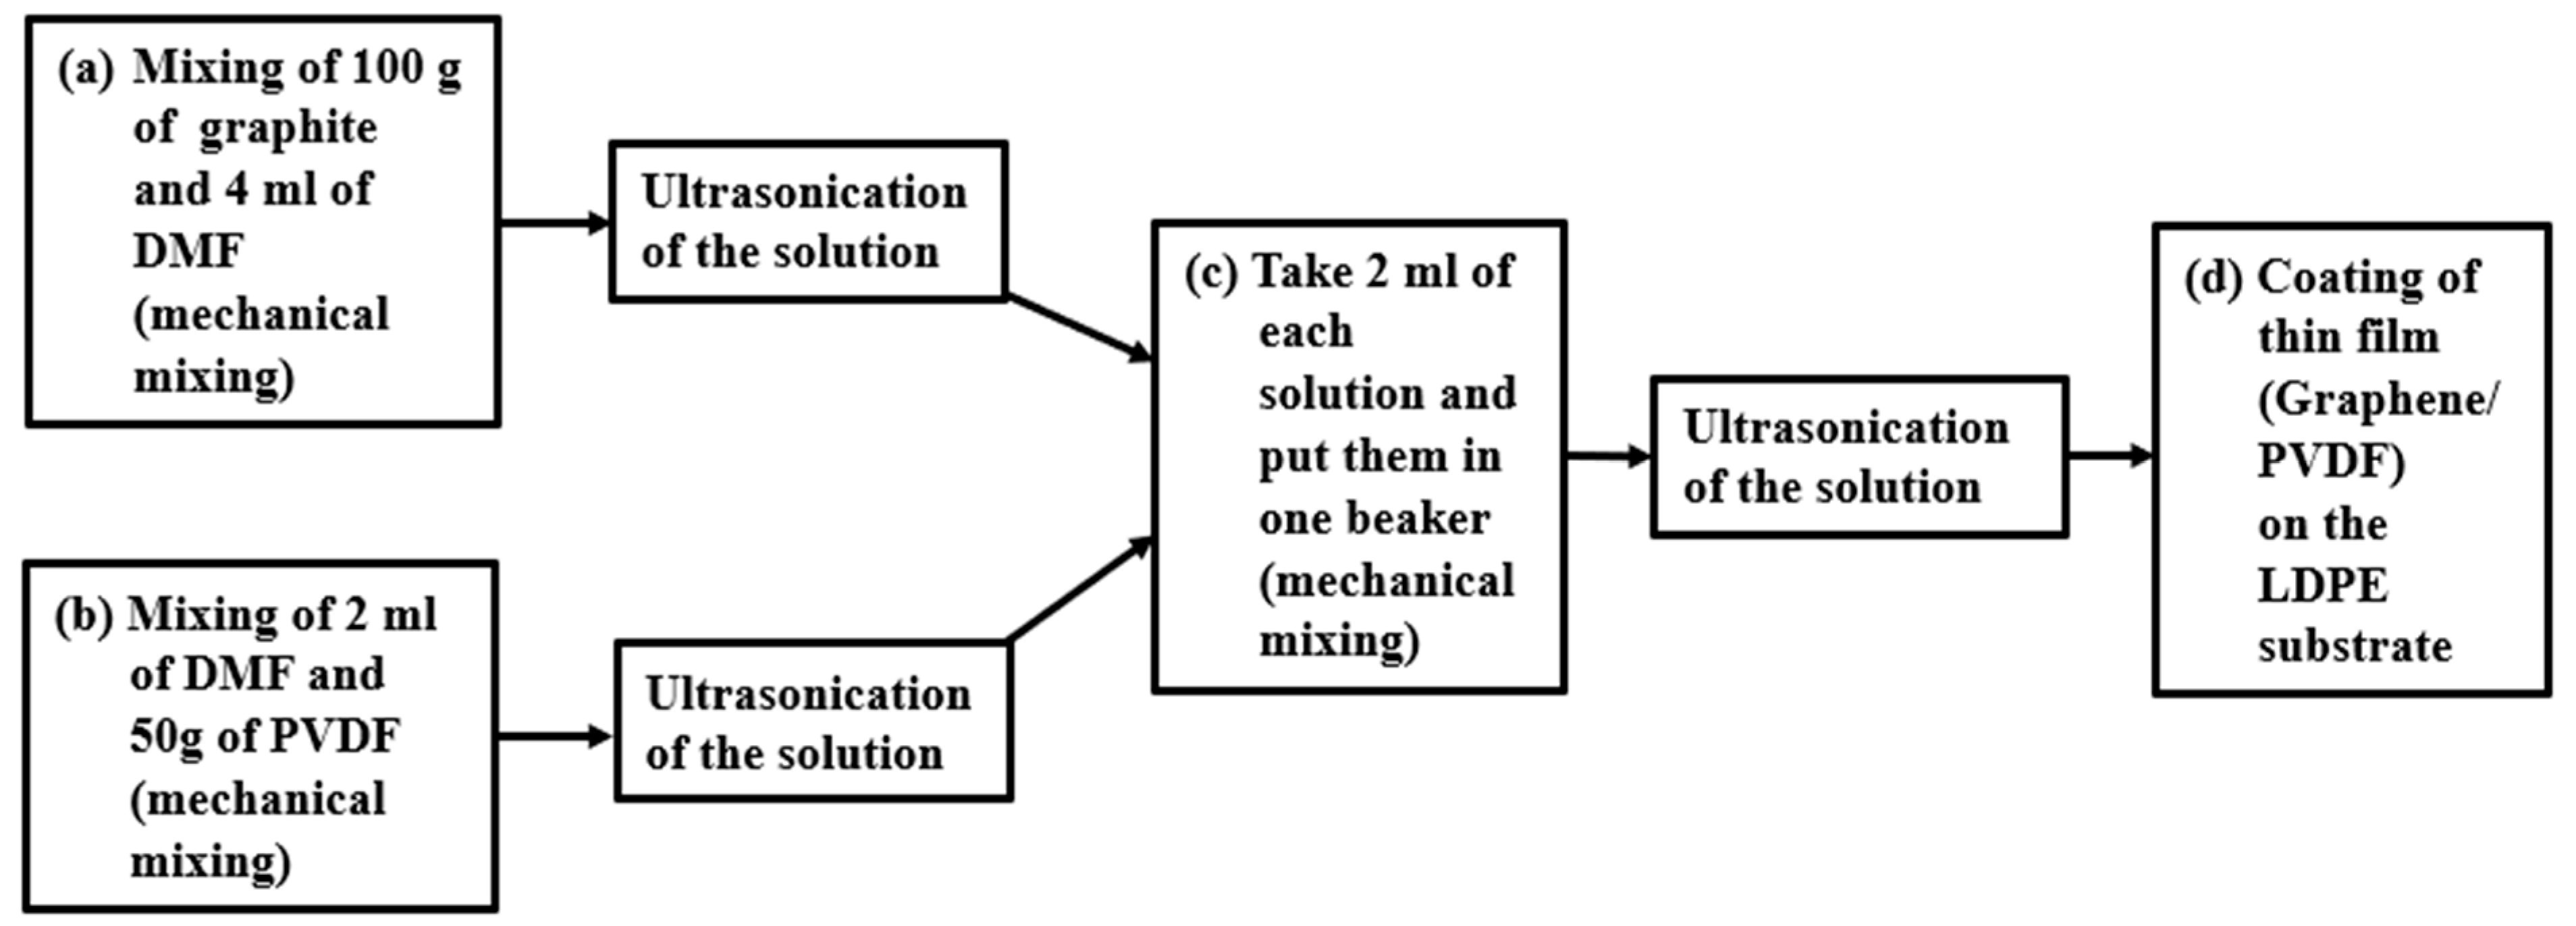
2.1. Preparation of the Gr/PVDF Nanocomposites

The preparation of the Gr/PVDF nanocomposite followed a procedure that has been presented previously in our work [10,23]. Figure 1 shows the schematic preparation procedure of the Gr/PVDF nanocomposite. The graphite particles of 1.0 μm (purity of 99.9%) and dimethylformamide (DMF, HCON(CH3)2, 99.8%, Alfa Aesar, Heysham, UK) solvent were added to a beaker, and the solution was thoroughly mixed using a glass rod to break the large graphite particles. The sonication process was conducted at intervals of 10 min to prevent the aggregation of graphite particles. The solution was kept in a static condition at room temperature for 12 h to allow the large graphite particles to settle at the bottom of the container. PVDF solution was prepared by dissolving PVDF powder (99.999%, Mw = 534,000 g/mol, Alfa Aesar) in DMF solvent. PVDF/DMF solution was stirred and placed in an ultra sonicator to ensure that the PVDF powder was completely broken down. The solution was also kept in a laboratory fume hood for 12 h at room temperature. The top portion of the prepared graphene solution was then carefully mixed with the prepared PVDF solution. The concentration of graphene in PVDF was 2.5% by weight. This optimized concentration was obtained via the measurement of the electrical conductivity versus graphene concentration in PVDF. The solution was again ultrasonicated and then kept settling for 12 h before preparing the films. A thin and transparent flexible polyethylene sheet of thickness 0.1 mm (high density, 99%, Thermos Scientific Chemicals, Waltham, MA, USA) was chosen as the substrate. Polyethylene (PE) was selected as the sensor diaphragm due to its high flexibility, superior impact resistance, and ability to deform without breaking under impact. The substrate was cut into 12 mm × 12 mm size to design a sensor. The substrate was rubbed with sandpaper to better adhere the composite to the surface and then rinsed with isopropanol to wash away any contaminants before applying 20–22 µm thick graphene/PVDF nanocomposite using a doctor blade method. The width of sensor film was 4 mm (see Figure 2a). Films were slow-dried in vacuum conditions (~10 mTorr) for 12 h and heated at 50 °C for 2 h.

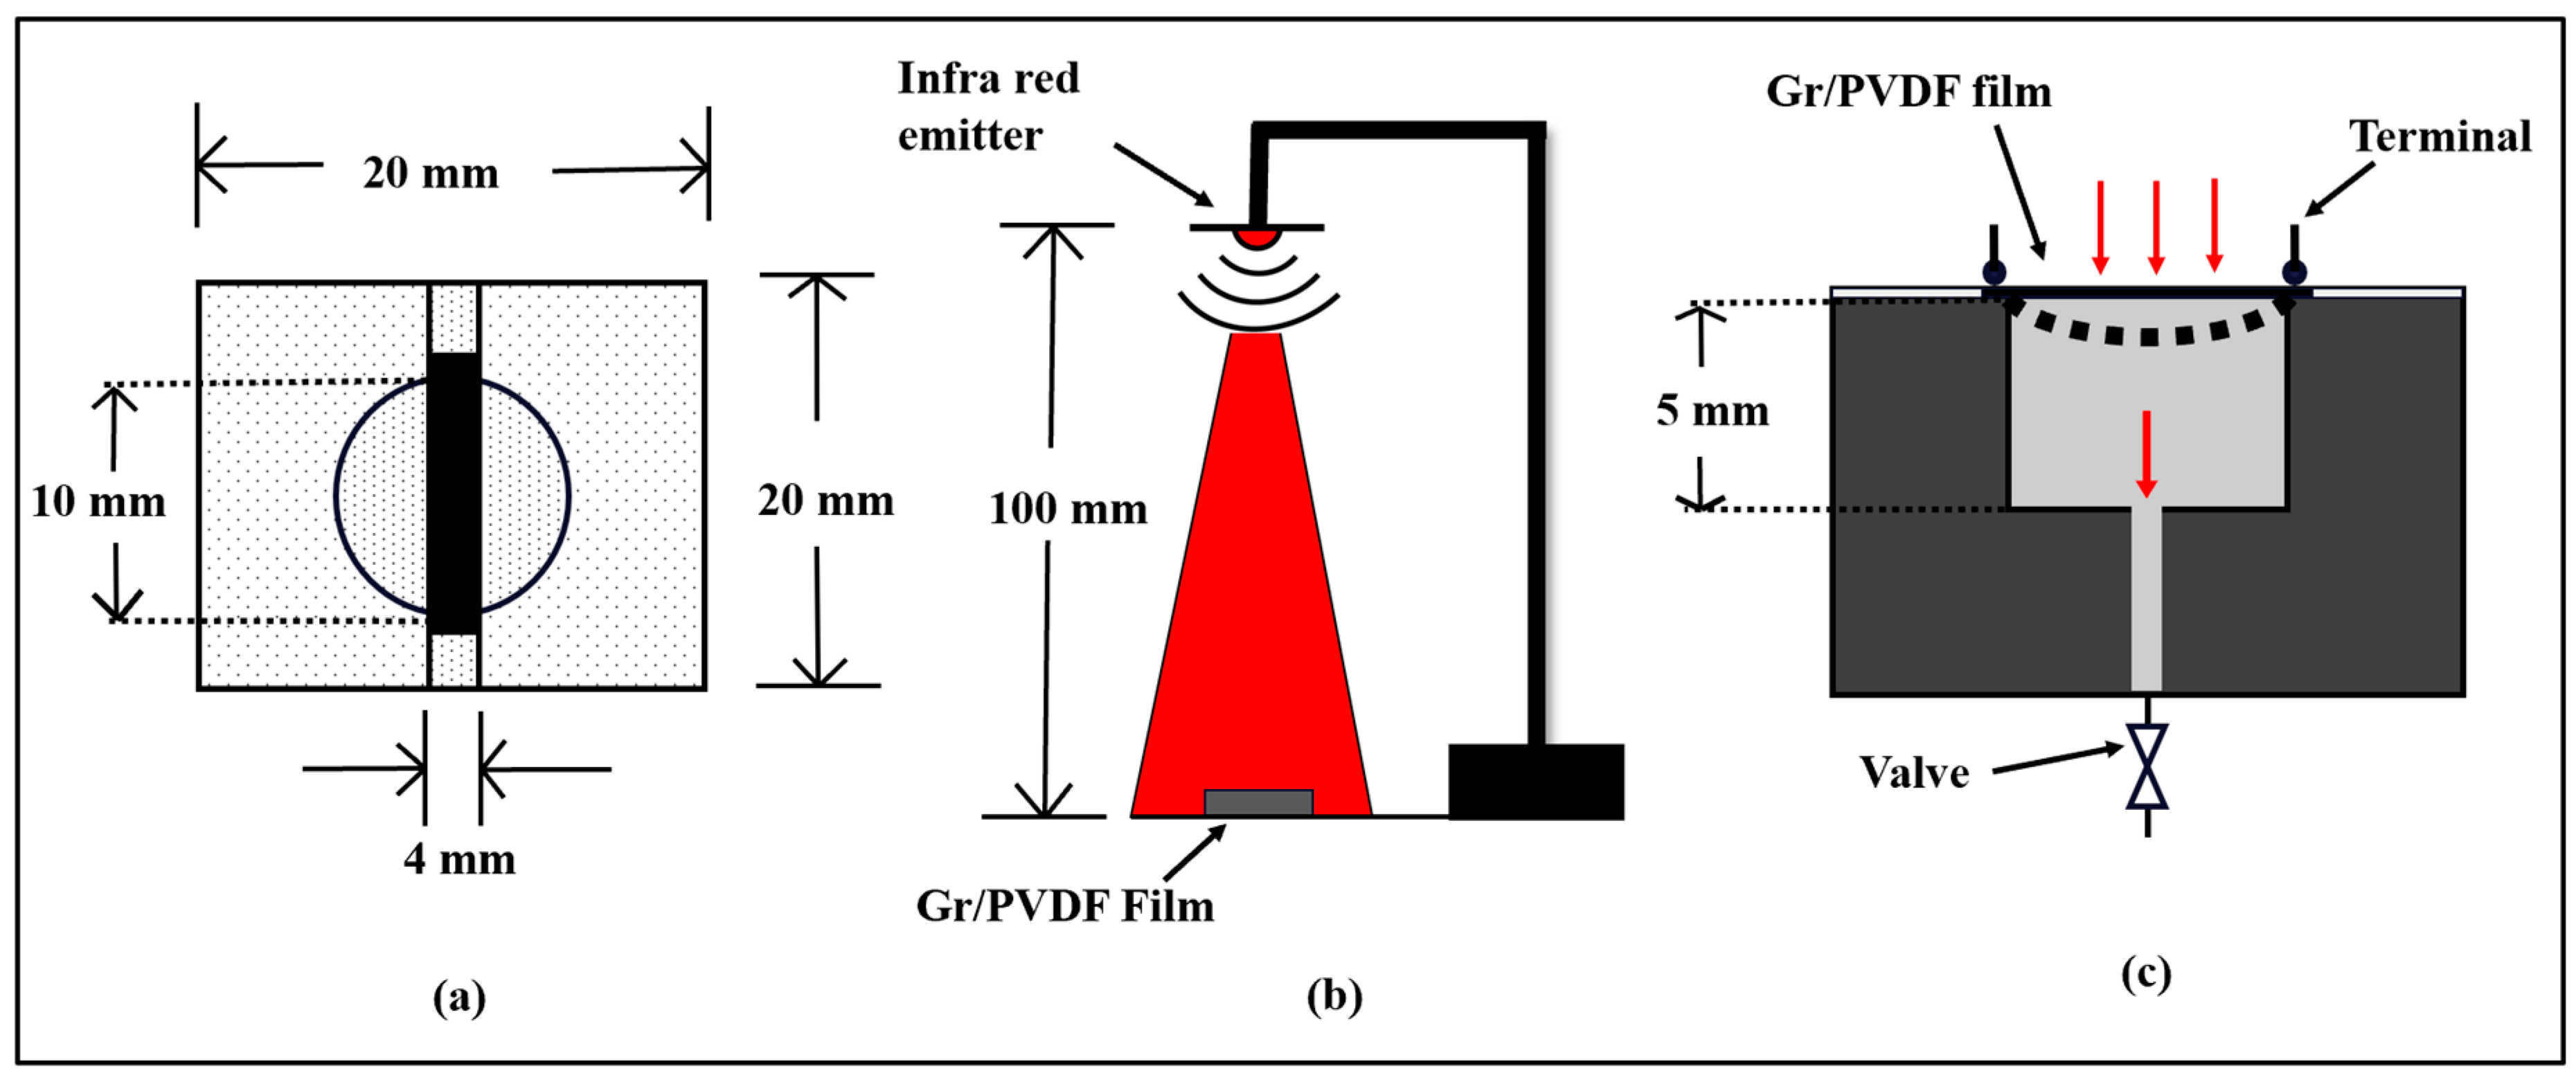
2.2. Preparation of the Sensor Test Fixture

The schematic diagrams of the sensor, IR annealing setup, and sensor testing instrument are presented in Figure 2. A cubic (20 × 20 × 10) mm with a hole at the center was used as a test fixture, which has a center opening (10 mm diameter and 5 mm depth). The thin film was then mounted on the surface containing the 5 mm hole in the cube. A high-pressure compressor was connected to the test fixture through the valve attached to the 5 mm hole. A pressure gauge was installed to regulate the applied pressure. When the gauge pressure is applied through the valve, the thin Gr/PVDF film deforms into a dome-shaped structure. To avoid possible delamination of composite films from the substrate, we kept the thickness of films below 10 microns. The IR annealing was carried out using a gold tube IR lamp (the Westinghouse WES31-1892) at an intensity of the sensor surface ~1.3 W/cm2, as shown in Figure 2b. The temperature of sensor was monitored using a thermocouple in order to avoid melting of PE substrate.
The resistance of the film was recorded using a Keithley multimeter connected to a computer through a custom-made LabVIEW interface. The response graphs were obtained as a function of resistance and applied pressure on the film sensor. The response was varied quantitatively using the following equation ΔR = (R – R0) × 100/R0, where ΔR is the relative resistance, R is the final resistance, and R0 is the initial resistance.
To study the change of electrical conductivity with annealing conditions, the films were measured using a planer electrode configuration. A thin layer of Au (~75 nm) was coated on the films to measure electrical properties. The width and spacing of the Au electrodes were 6 mm and 4 mm, respectively. The resistance of composite films between Au electrodes was measured using a high mega ohm multimeter (Keithly Model: 22-816). The scanning electron microscopy (SEM) images were collected using a field emission microscope (Philips XL30 FEG SEM). The Raman spectra of the films were obtained using an excitation wavelength of 514 nm with a Xplore Plus Raman microscope (Horiba Jobin Yvon Inc., Longjumeau, France). A tensile test was performed using the ASTM D3039 test machine. Each sample was stretched at a rate of 100 μm/min, and the change in resistance versus strain of the thin film was recorded by a multimeter. The test specimens were the same as the composite samples used in pressure sensor testing.

3. Results and Discussion

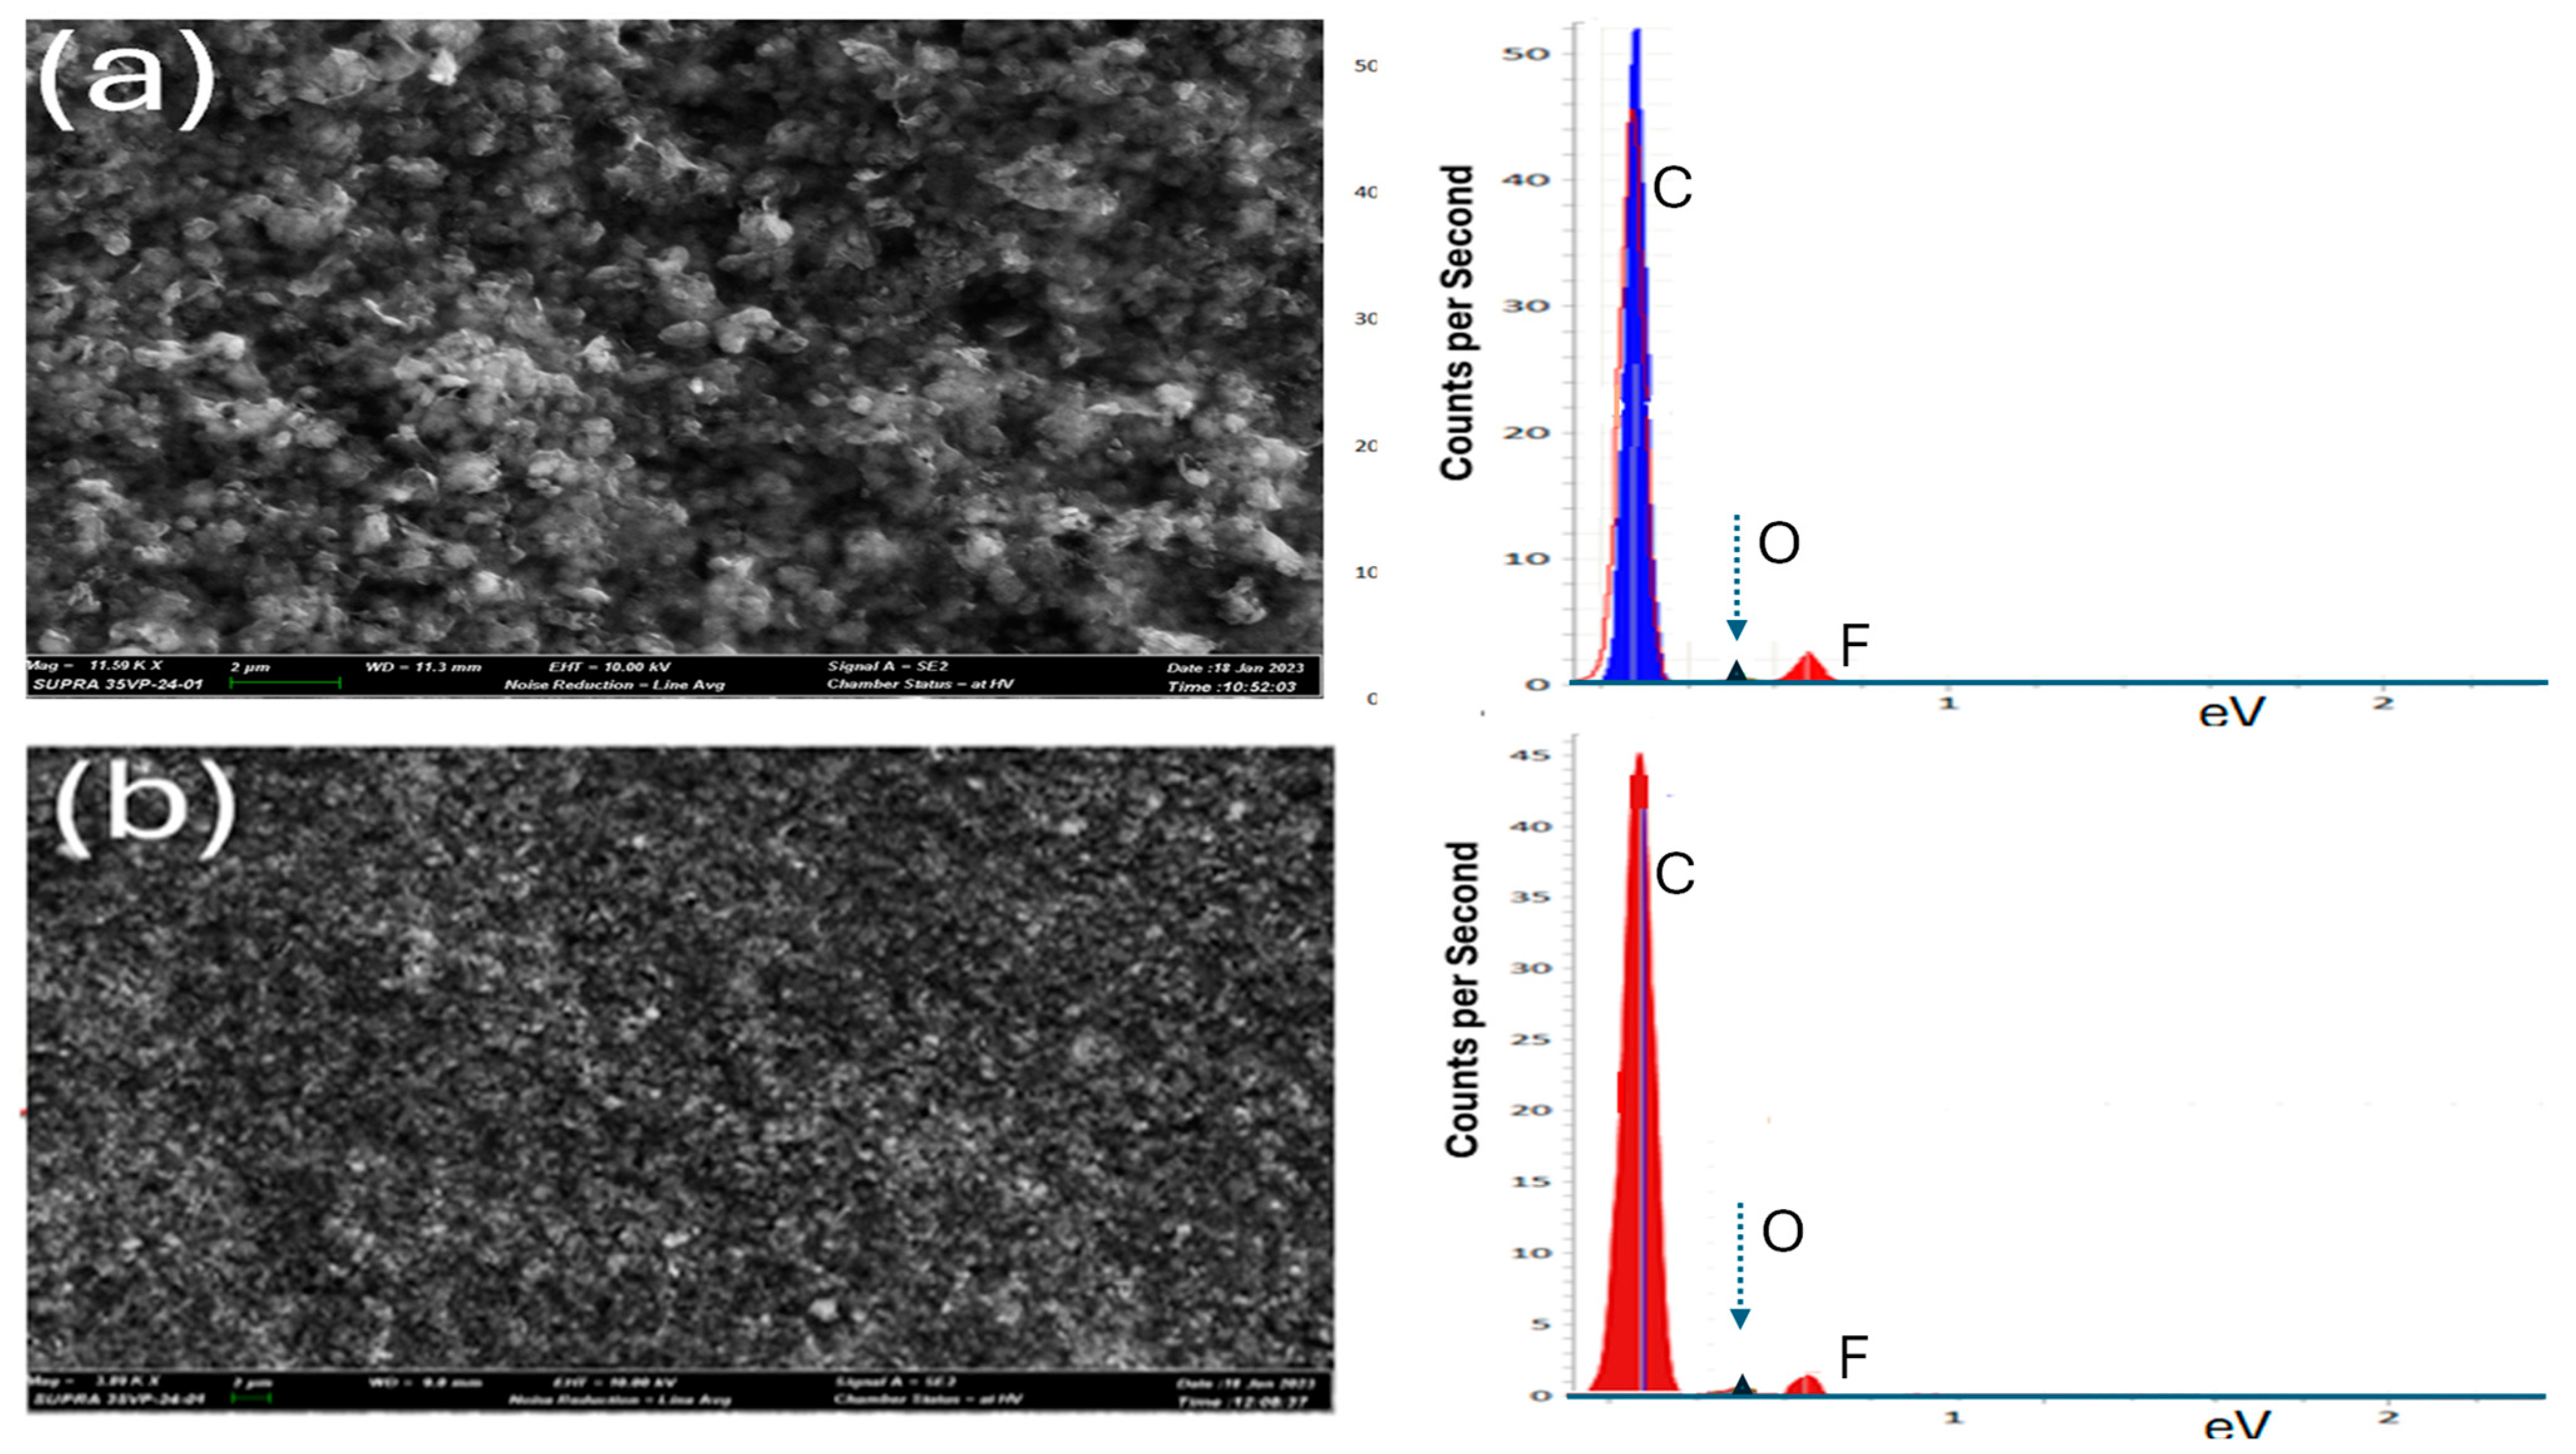
3.1. Characterization of Gr/PVDF Nanocomposite

Figure 3 shows the SEM images of the 2 min IR-annealed and the as-deposited film of Gr/PVDF nanocomposites. The SEM analysis is important for analyzing the surface morphology and microstructural characteristics of the materials. As-deposited film shows an irregular dispersion of graphene within the PVDF matrix, with noticeable agglomeration and significant surface roughness. These samples often exhibit interfacial gaps between graphene sheets and the PVDF, indicating weak adhesion. The 2 min IR-annealed examples exhibited a more uniform dispersion of graphene, a smoother surface, and enhanced interfacial adhesion. Annealing facilitates better bonding and reduces internal stresses, leading to a more organized and crystalline structure in the PVDF matrix, ultimately improving the material’s mechanical and electrical properties. The energy dispersive X-ray spectroscopy (EDS) images of graphene/PVDF composites provide valuable insights into the elemental composition and distribution within the material. In as-deposited film composites, EDS images typically reveal an uneven distribution of carbon and fluorine elements, indicating a poor dispersion of graphene within the PVDF matrix in contrast to the 2 min IR-annealed films.

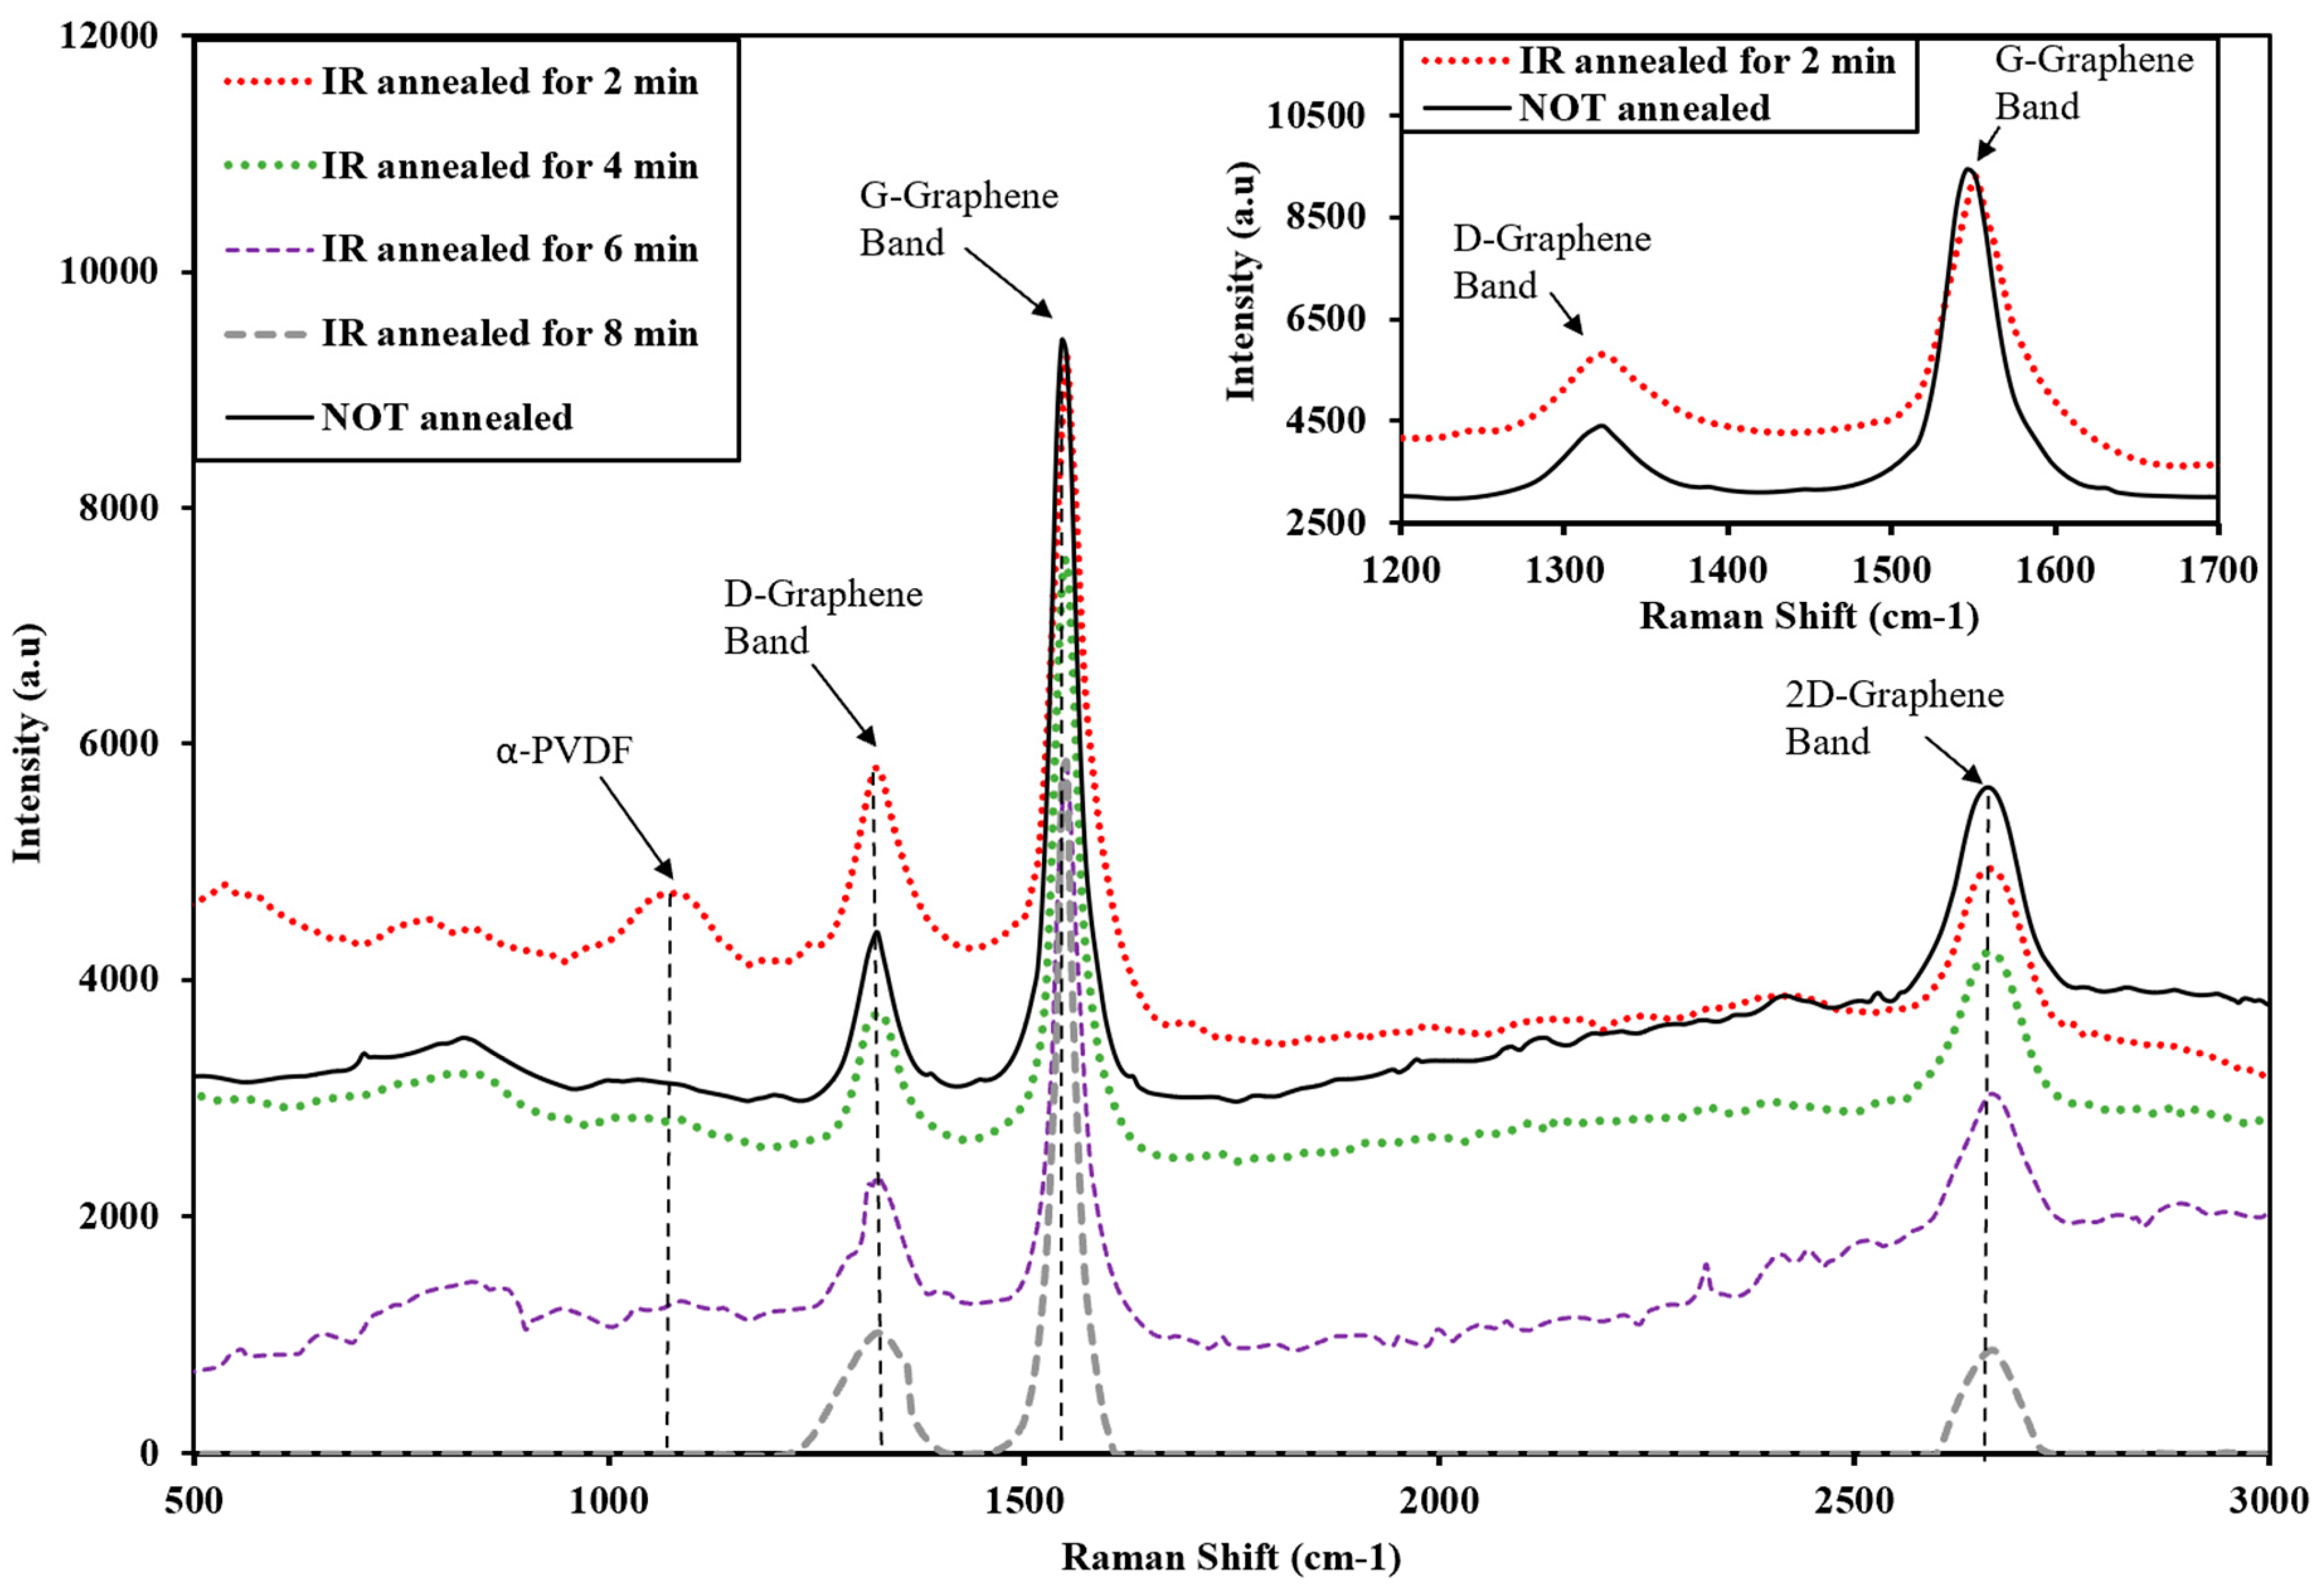
3.2. Raman Spectroscopy

Raman spectroscopy was used to characterize the nanocomposites’ quality and thickness since it is non-destructive and has a high spatial and spectral resolution. For graphene, the sp2 carbon bonds result in a high polarization of π bonds, which gives an intense Raman signal. Figure 4 shows the Raman spectra of Gr/PVDF; the films were annealed using the infrared light at different times (2, 4, 6, and 8 min) obtained from 500 to 3000 cm–1. The spectra show four dominant peaks at approximately 1079, 1317, 1551, and 2675 cm–1. The film that was annealed for 2 min indicated a high intensity, and the film that was annealed for 8 min indicated the least intensity. The intensity peak at 1079 cm–1 indicated a formation of the alpha phase of PVDF. It appeared predominantly for the film annealed for 2 min, whereas films annealed for 4, 6, and 8 did not show any dominant peak for PVDF. The most prominent peaks in the PVDF Raman spectrum are associated with the C–F stretching and bending modes, as well as the skeletal vibrations of the carbon backbone. Three dominant peaks at 1317, 1551, and 2675 cm−1 were attributed to graphene D, G, and 2D bands, respectively. The G band corresponds to the vibration of the carbon atoms in the graphene lattice, while the 2D band arises from the double resonance process involving two phonons.
The average intensity ratios of I2D/IG and ID/IG bands for all films indicated the presence of multi-layer graphene. In our work, the graphene used in this work has three–four layers. The single-layer graphene exhibited neither piezoresistive behavior nor low resistance, making it less suitable for sensor applications. The ID/IG ratio for all films was an average of about 0.22, indicating that the film had few defects. The piezoresistive effect in graphene is intricately tied to the intensity ratios of the Raman peaks I2D/IG and ID/IG. In this study, the calculated intensity ratios for various IR annealing times ranging from 0, 2, 4, 6, and 8 min were examined. The I2D/IG ratios were found to be 0.42, 0.29, 0.38, 0.05, and 0.14, respectively; while the ID/IG ratios were measured at 0.20, 0.44, 0.24, 0.03, and 0.17 for the corresponding annealing times. These ratios are the key indicators of structural changes and defects within the graphene lattice induced by mechanical strain. The I2D/IG ratio reflects the degree of graphene layer stacking and the extent of sp2 hybridization; while the ID/IG ratio indicates the presence of structural defects such as vacancies, edges, or grain boundaries. When pressure is applied, it alters the lattice structure of graphene, influencing the material’s electrical resistance. Therefore, the changes in the ratios of I2D/IG and ID/IG are important since they provide insights into the piezoresistive behavior of graphene, allowing for precise characterization and optimization in sensor applications.

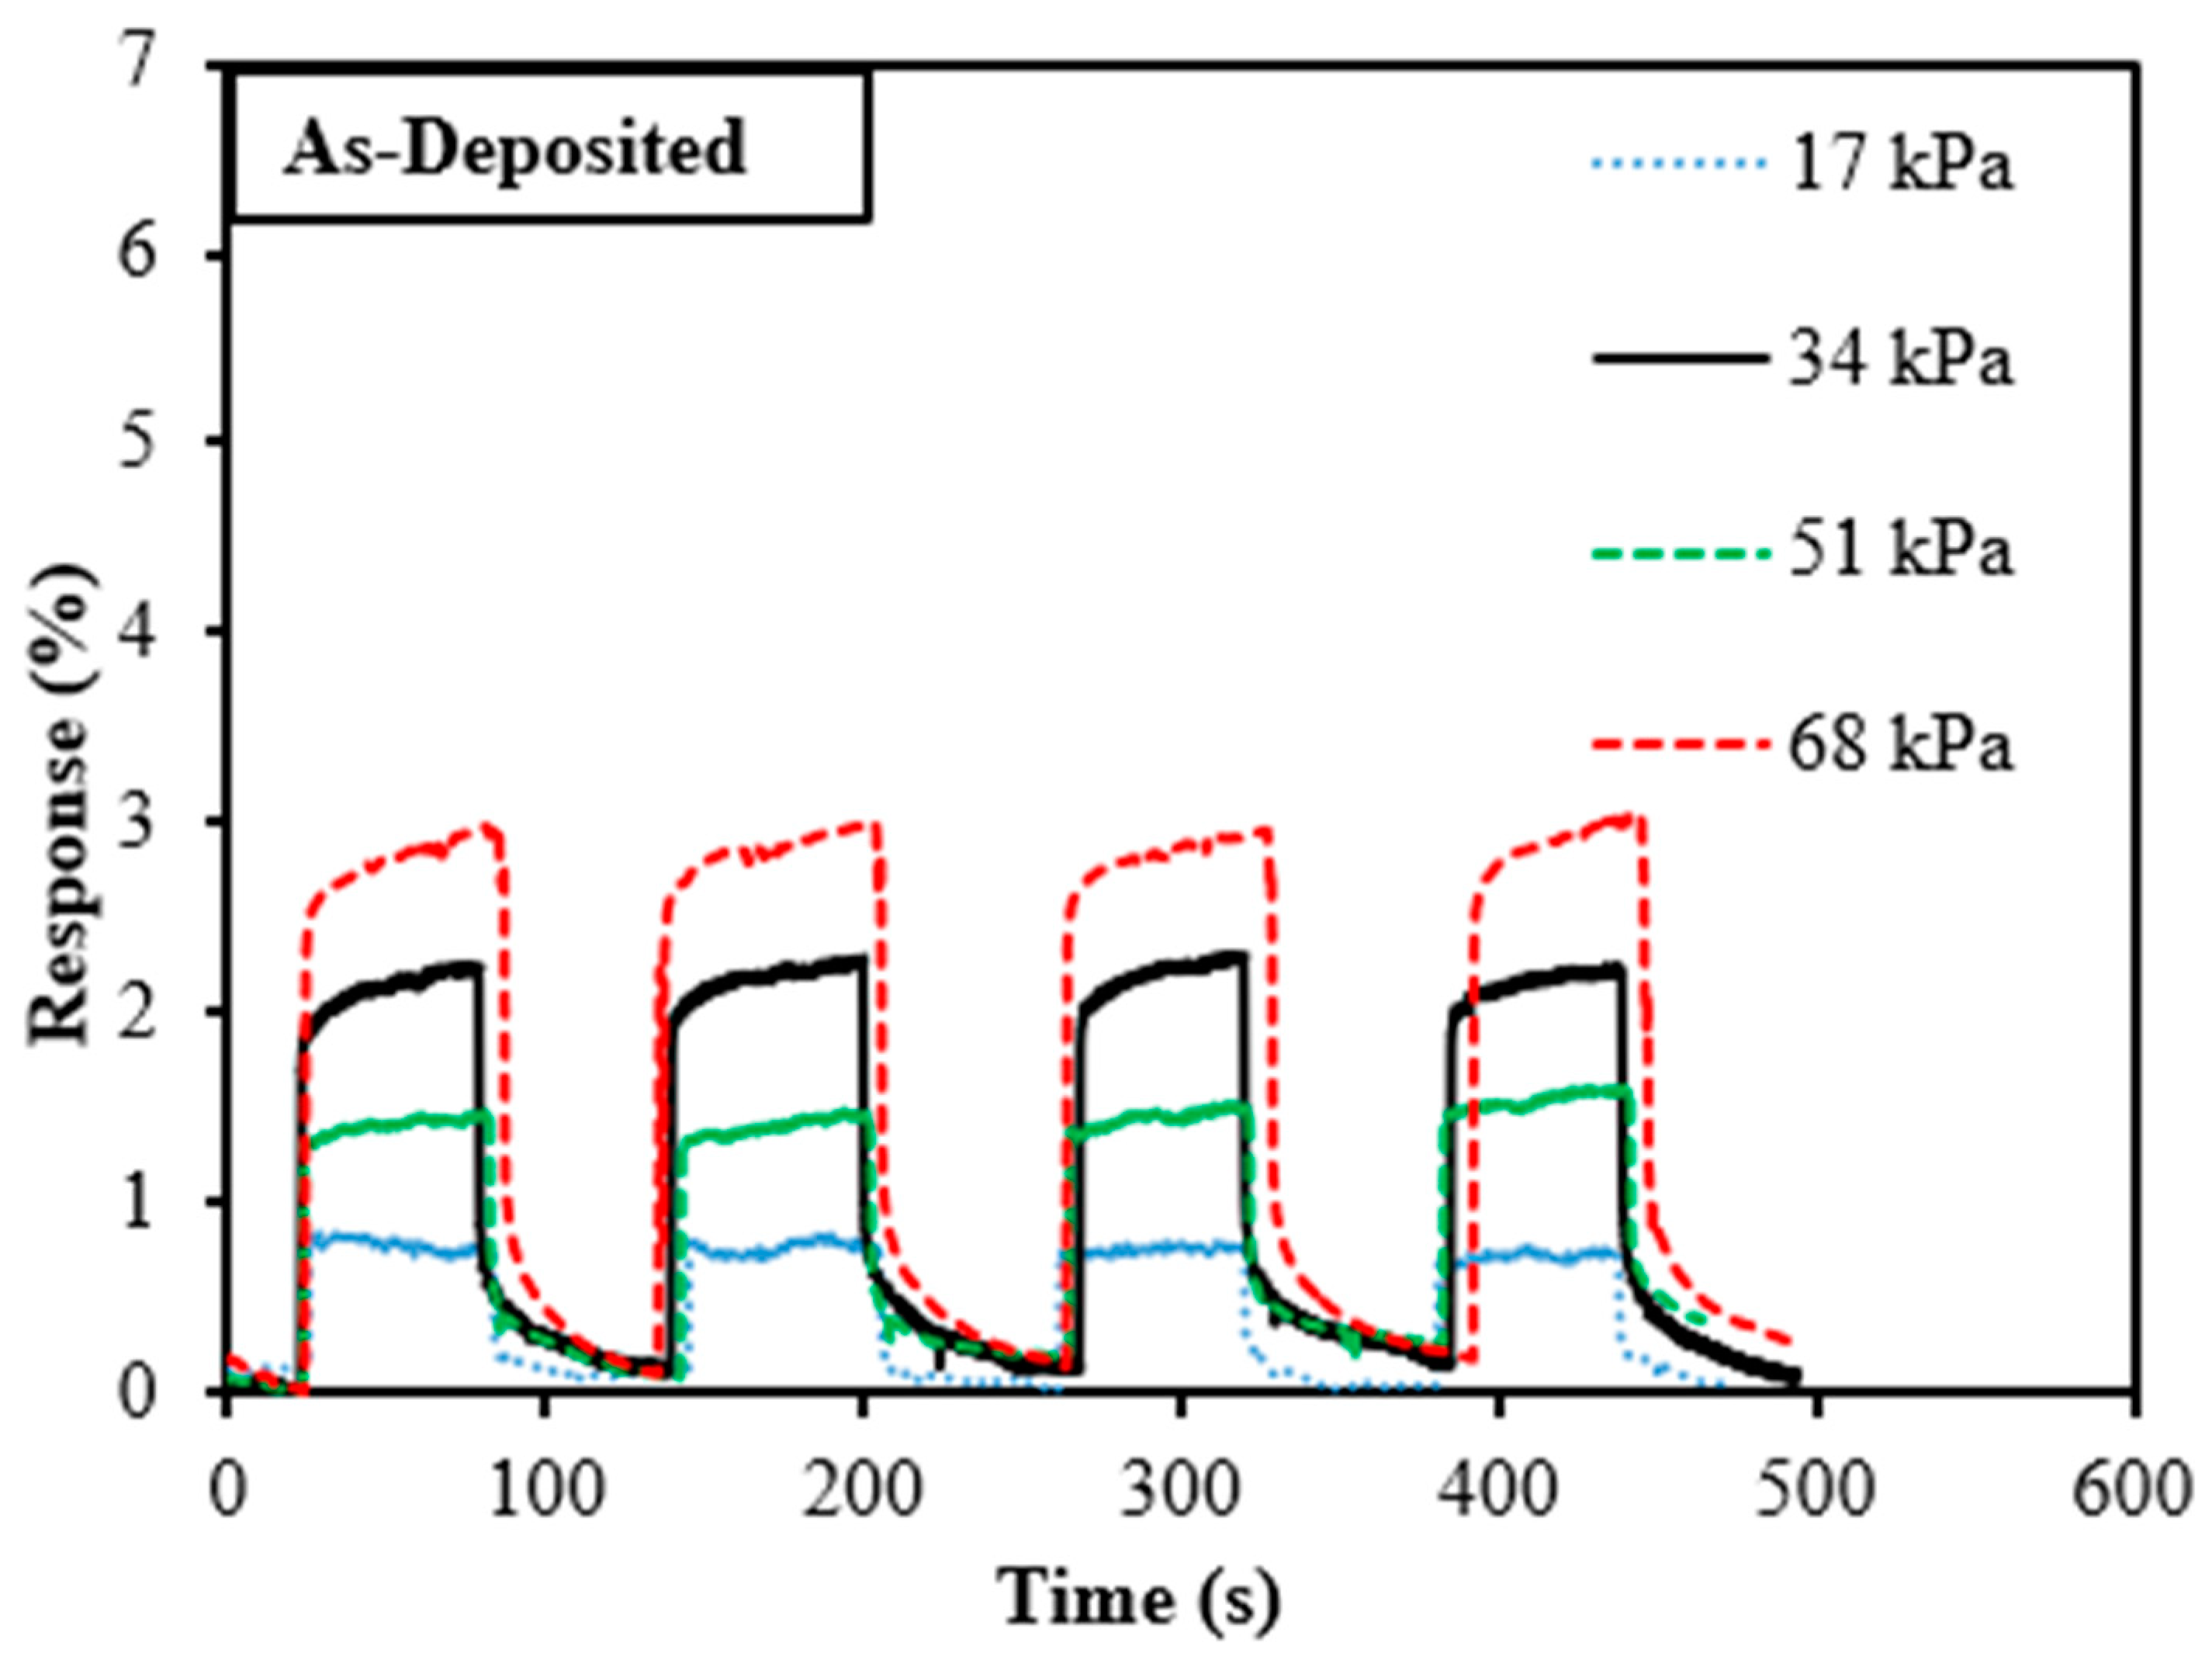
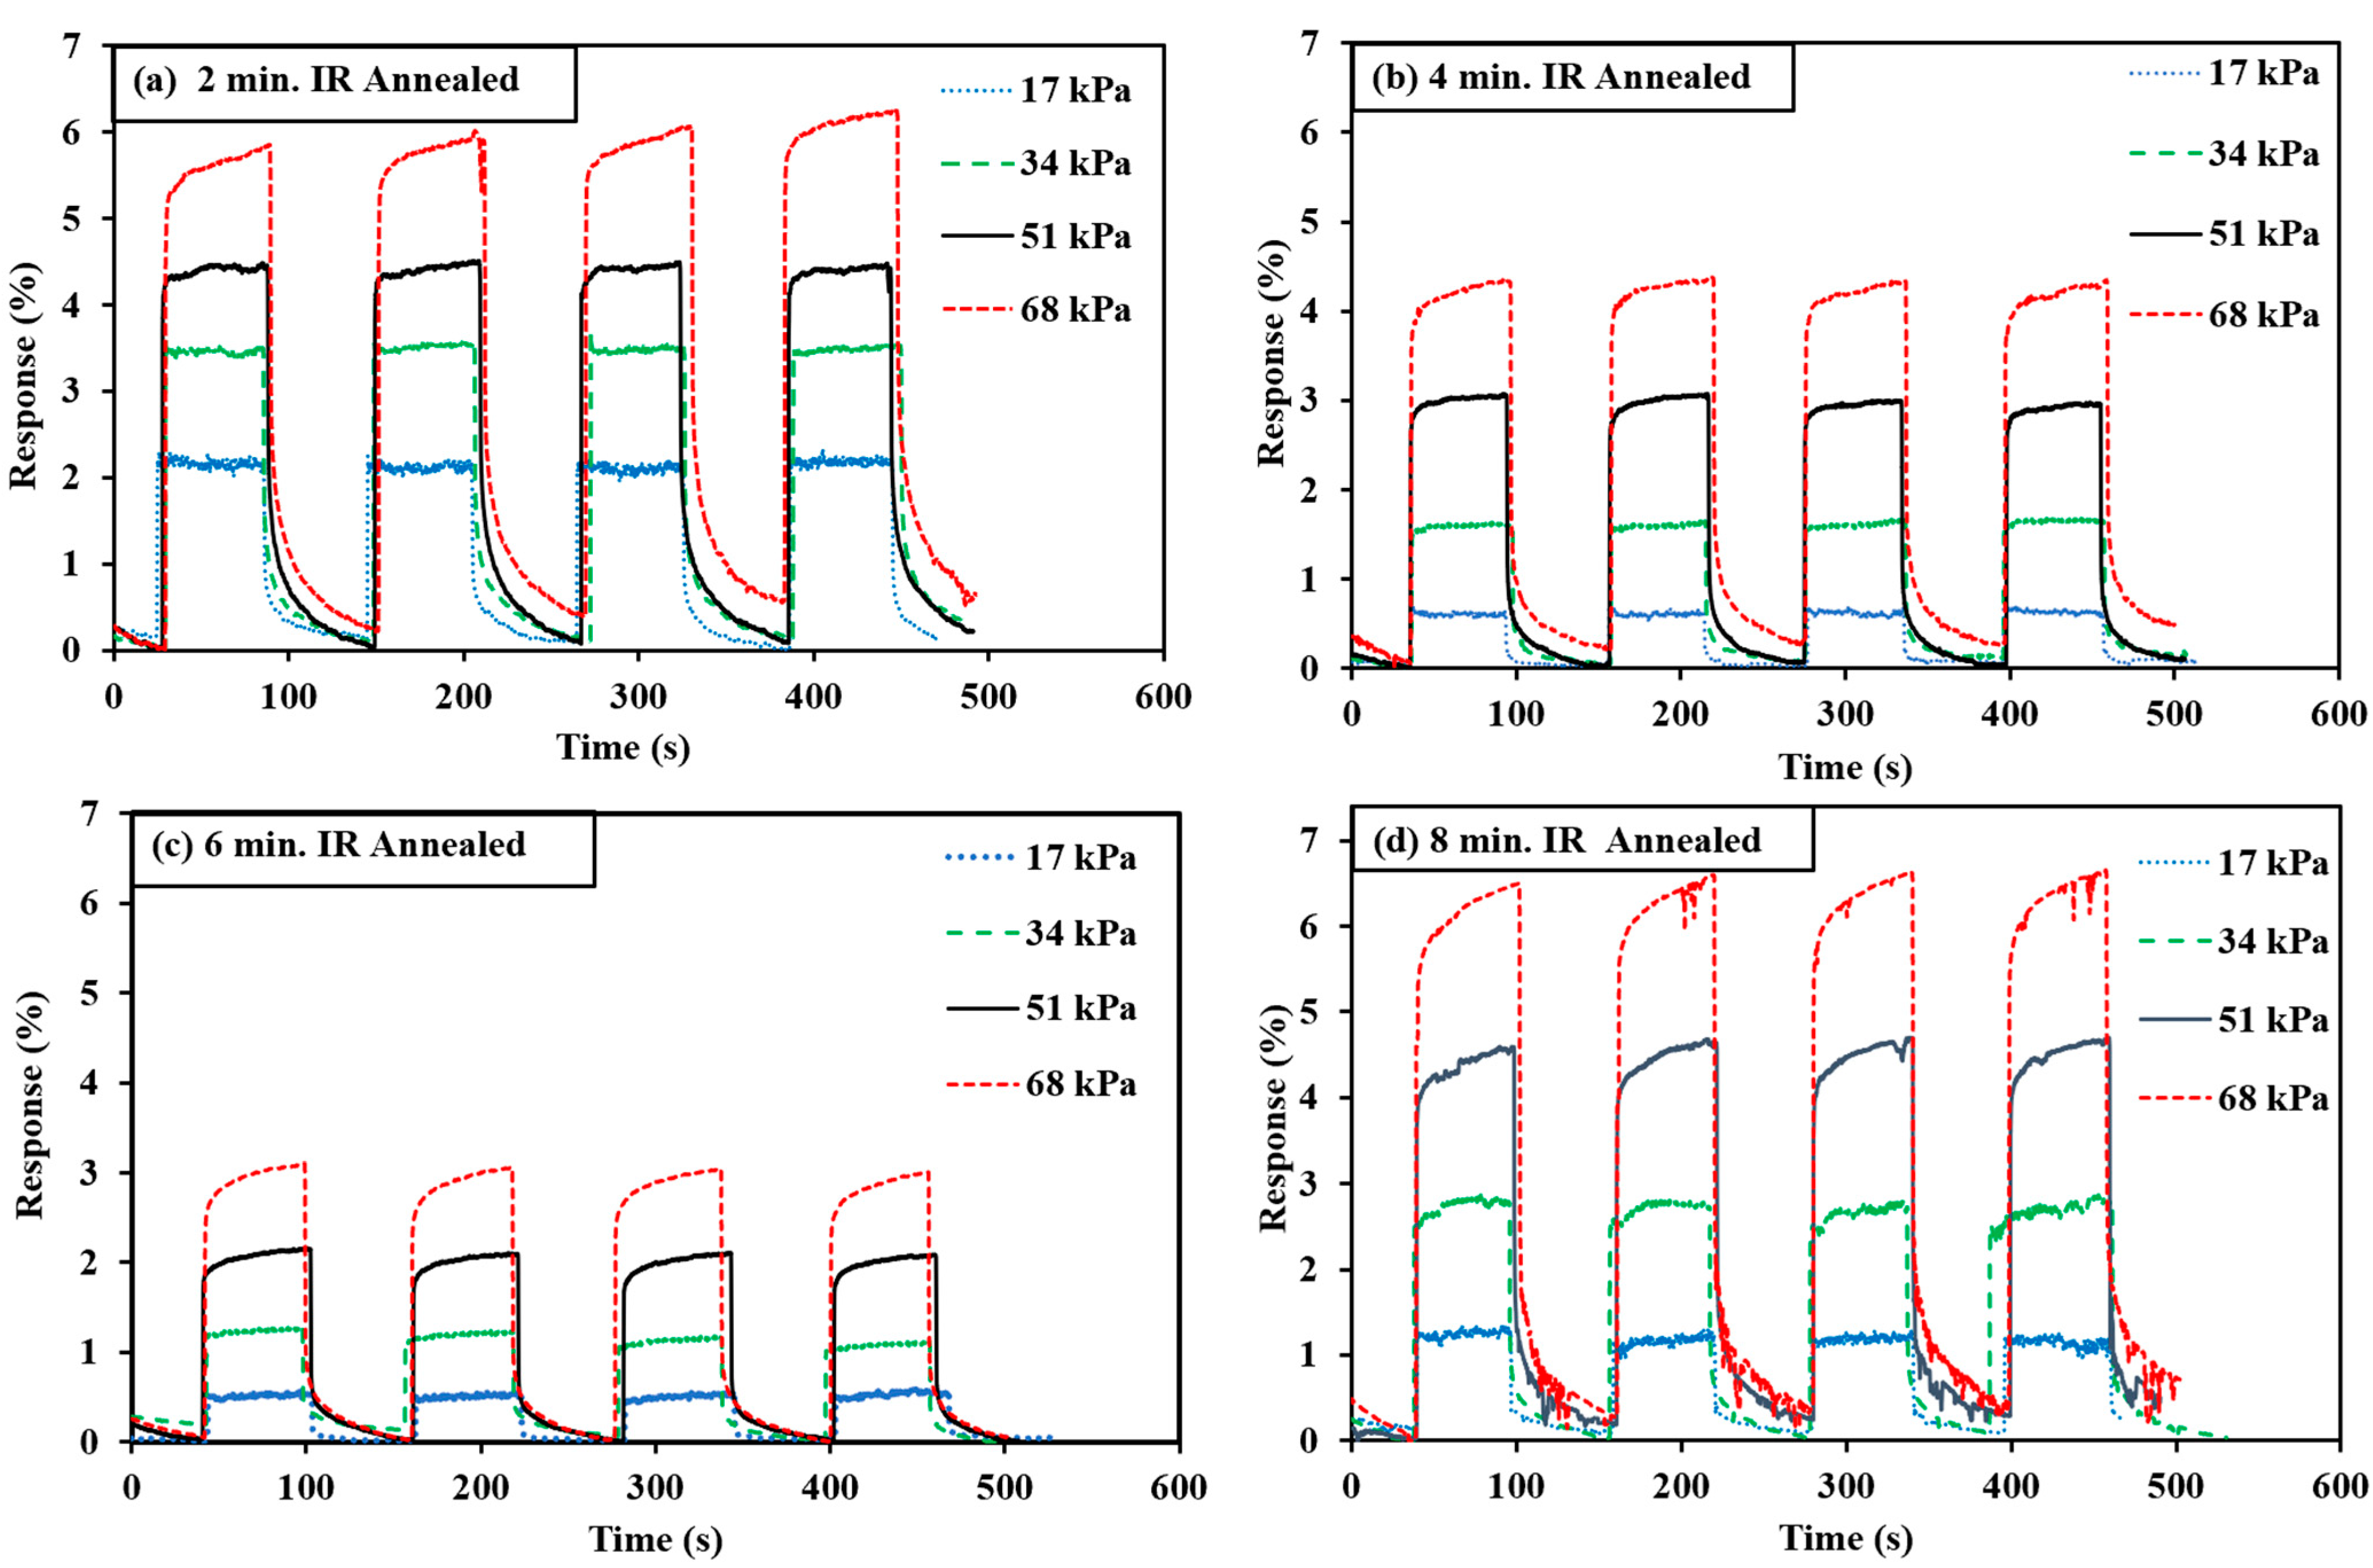
3.3. Sensor Performance and Testing

Different films were fabricated for this process; these films were fabricated using the same fabrication procedures, materials, and process parameters. The films were analyzed and tested to evaluate their uniformity, electrical properties, and other relevant parameters for this study. This process was conducted to check the reproducibility of the fabrication process and identify any sources of variability or inconsistencies, thus enhancing the reliability and validity of the findings. The response of the Gr/PVDF films to varying external pressures is illustrated in Figure 5 and Figure 6a–d. Four different pressure ranges were applied to the films—that is, 17, 34, 51, and 68 kPa—to compare the linearity, sensitivity, and repeatability of the five prepared films. The sensor response (ΔR/R, where, ΔR is the change in resistance and R0 is the initial resistance) showed a linear increase with an increase in applied pressure, as shown in Figure 7a. The trendline is also with the error bars, and the coefficient of determination (R2) for all films is above 0.991. Linearity is one of the key parameters by which to measure the performance of a pressure sensor since it reflects the stability of sensor sensitivity [24,25] The sensitivity (S) is another important parameter in determining the sensing performance of a pressure sensor; it can be defined as S = (ΔR/R0)/ΔP, where ΔP is the change in the applied pressure.
The films that were annealed for 8, 4, and 2 min indicated a relatively high sensitivity of 0.10 kPa–1, 0.07 kPa–1, and 0.07 kPa–1, respectively. The film annealed for 6 min and the as-deposited film had a relatively low sensitivity of 0.05 kPa–1 and 0.04 kPa–1. Figure 7a shows a clear response for all the films; the film annealed for 2 and 8 min indicated a high response for all the applied pressure compared with the other films. It was further determined that annealing for 8 min induced high sensitivity and low stability. The film annealed for 8 min also produced inconsistent electrical signals, with more cycles of repeated loading/unloading and sudden changes in pressure. This inconsistency might have been caused by the nanocomposite becoming more crystalline and the substrate losing its flexibility due to the high exposure to heat. This is also confirmed by the low intensity and the absence of the PVDF peaks in the Raman spectra of this film.
It can be concluded from this comparative analysis that annealing the films for 2 min using infrared light showed an improved sensitivity compared with all other films. This is attributed to the annealing effects, which enhance the conductivity by reducing the graphene defects. The annealing process also helps to improve the interconnection in the interface between graphene and PVDF, which enhances the conductive pre-networks. The applied pressure causes an increase in the conductivity because of the increase in elastic deformation, which leads to an increase in the contact sites of the graphene and PVDF [26,27]. This improvement can also be attributed to the lower agglomeration of the graphene in the matrix and better dispersion. Annealing also helps in the formation of the beta phase of PVDF, which is responsible for outstanding electrical characteristics. Finally, the PVDF binder helps the active material to mitigate the stresses of contraction and to maintain the adhesion of graphene to the conductive network, which is important in the repeatability and reproducibility test [28,29]. All fabricated sensors were tested for more than 1000 cycles and found to be very stable. There was no statistically noticeable change in sensor response, response time, or recovery time was found.

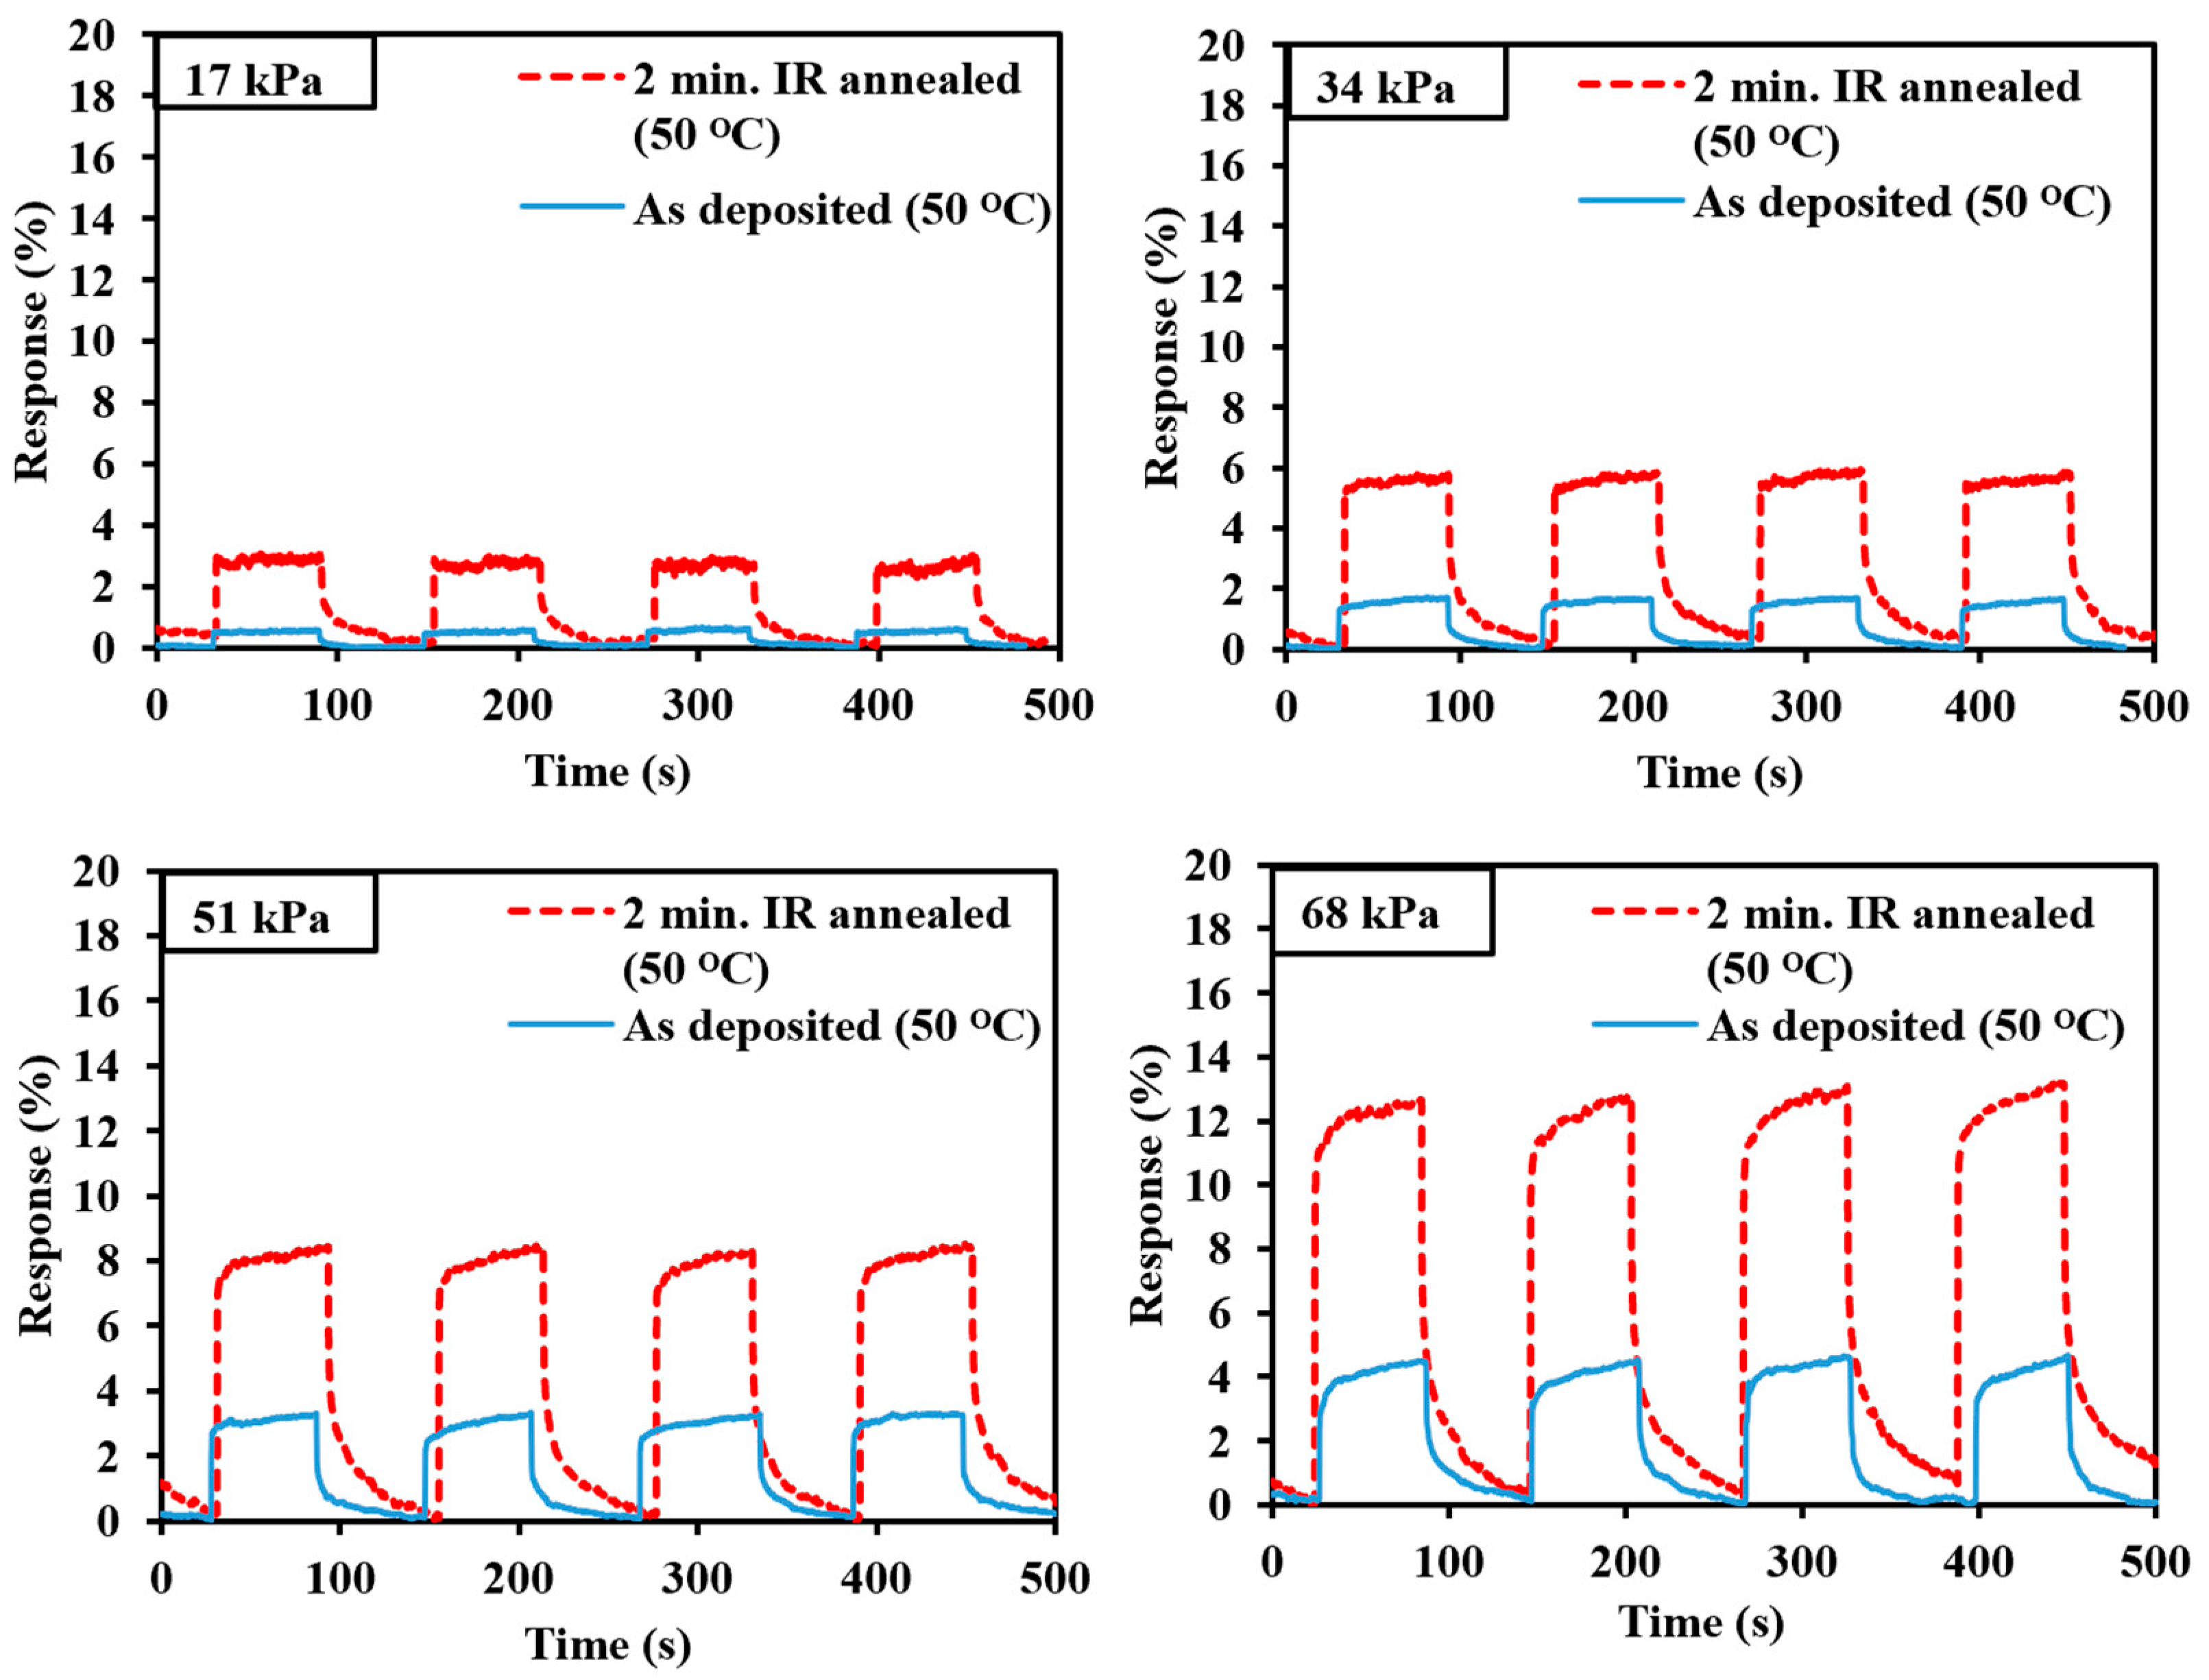
3.4. Temperature Effect on Pressure Sensor Sensitivity of Gr/PVDF Nanocomposite

The variation of resistance with the pressure of the Gr/PVDF films was also investigated at an elevated temperature of 50 °C. The composite film was annealed for 2 min, and the as-deposited film was utilized for this comparative test. The 2 min annealed film was used since it showed an improved sensitivity compared with the other annealed films. Figure 8 shows the pressure response at room temperature and a constant temperature of 50 °C. The IR-annealed film, compared with the as-deposited film, has the highest response for all the applied pressures. Figure 9 gives a clear illustration of the relative resistance change and pressure response for these nanocomposite films. These experimental results show that the response at 50 °C was higher than at room temperature for all films, indicating a considerable influence of temperature on the nanocomposites.
The linearity and repeatability of the resistance change rate (ΔR/R) with pressure did not change compared with the films at room temperature. This study shows that it is crucial to investigate the influence of temperature on the behavior of the Gr/PVDF nanocomposite pressure sensors. It is also important to characterize the behavior of these composites across different temperature ranges to understand the sensitivity and response behavior of the sensor clearly. The effect of temperature with respect to the Gr/PVDF composite is complex due to the complex nature of the polymer matrix and the effect of its material properties [30,31]. The interaction between these materials is affected by temperature, therefore affecting the sensitivity of the pressure sensor.
Graphene exhibits moderately high electrical conductivity at room temperature, and when pressure is applied, the interatomic distances in the graphene lattice change, providing high pressure sensitivity. The elevated temperatures decrease the conductivity of the graphene by changing the electron–phonon coupling, impacting the overall sensor performance. The low-density polyethylene substrate used may also have some influence on the sensitivity of the sensor because the increase in temperature causes the substrate to thermally expand, therefore stretching the Gr/PVDF membrane, which leads to an increase in resistance. From this study, the pressure sensitivity of the Gr/PVDF composite is influenced by the temperature, and the effects are complex. These effects depend on factors such as material properties, the interconnection between the two materials, the applied temperature range, and the substrate used [32,33,34].

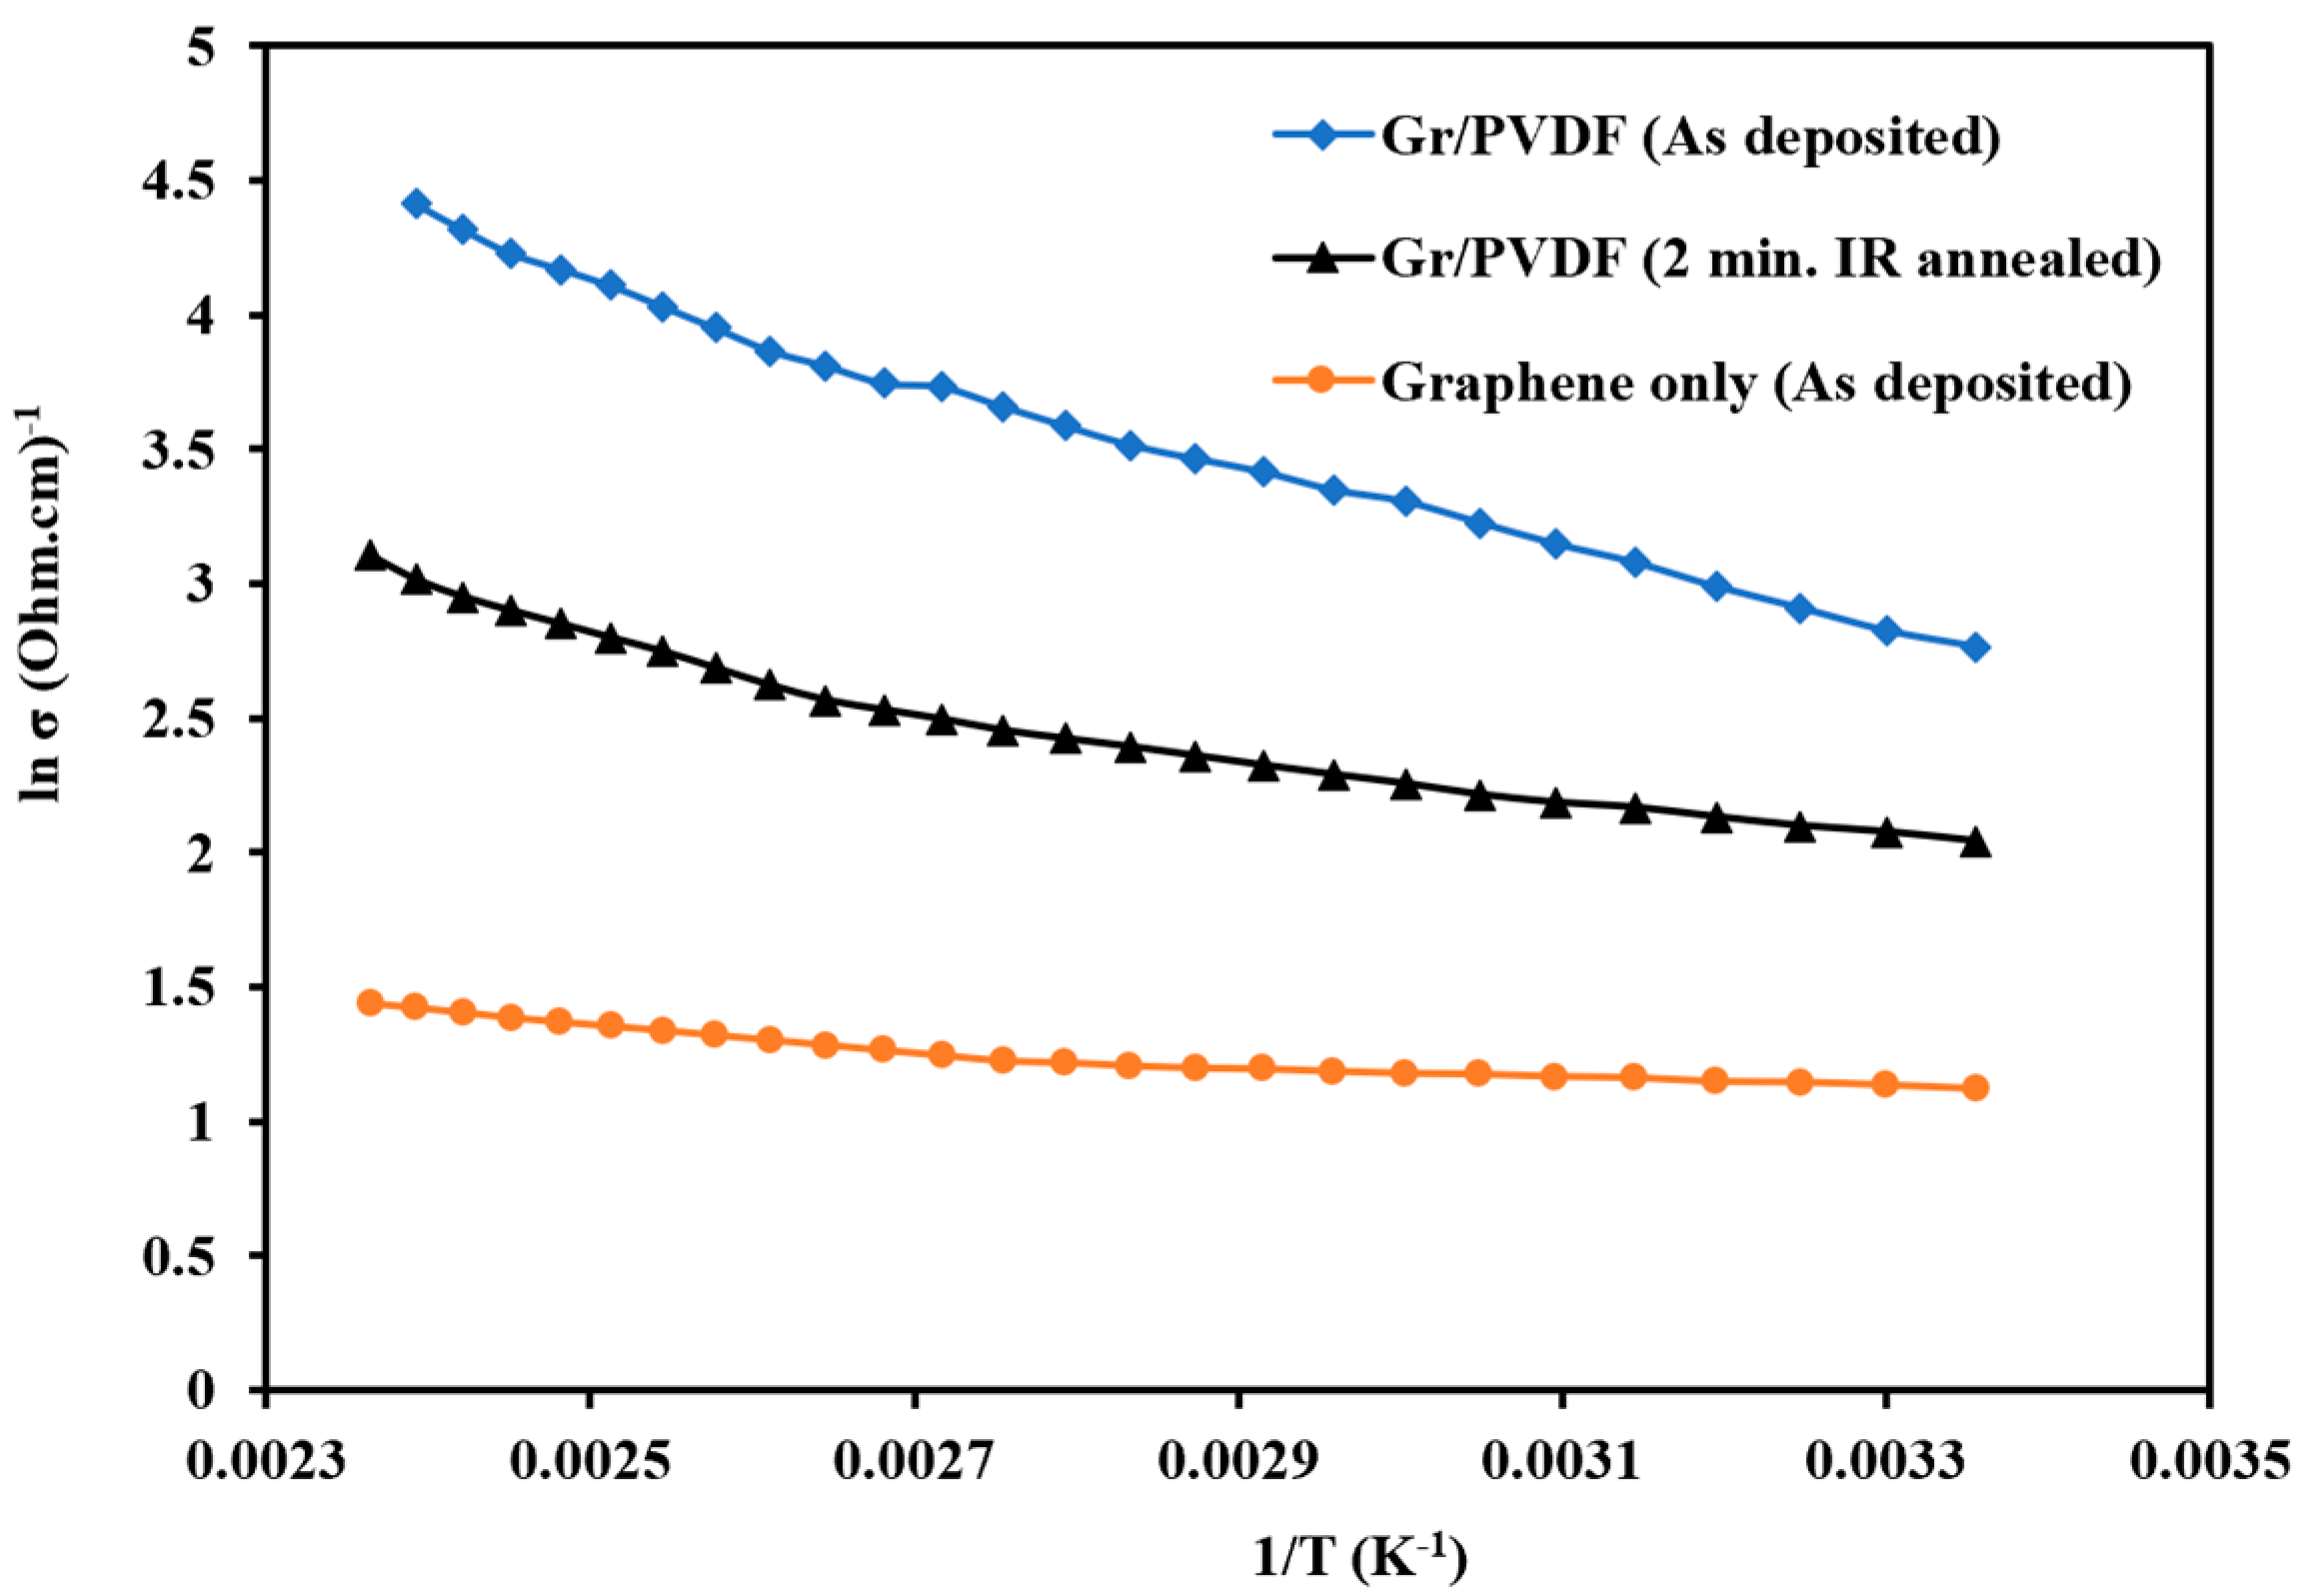
3.5. Temperature Dependence on Electrical Conductivity

The variation of the logarithm of electrical conductivity against the reciprocal of temperature for graphene, as-deposited Gr/PVDF, and 2 min IR-annealed Gr/PVDF nanocomposites is shown in Figure 10. The temperature dependence on the electrical conductivity of these films was measured in the room temperature to 150 °C temperature range. Figure 10 shows a decreasing trend in conductivity with increasing temperature; this can be described by the Arrhenius equation s = s 0     e x p ( E a K b     T ) , where s is the conductivity, so is the pre-exponential factor, Ea is the activation energy, T is temperature, and Kb is the Boltzmann constant. The calculated activation energy for graphene, as-deposited Gr/PVDF, and 2 min IR-annealed Gr/PVDF was found to be 0.03, 0.14, and 0.09 eV/K, respectively. The observed characteristic shows the semiconductor nature of the graphene, which may be due to the transfer of carriers from the valence band to the conduction band [35,36].
Another factor contributing to this trend is the increase in electron-phonon interactions, leading to electron scattering due to a high temperature of the phonons, which hinders the movement of charge carriers in the material. The presence of PVDF polymer introduce complexity to the variation of electrical conductivity with temperature. The properties of polymers can change significantly with temperature due to their complex nonlinear behavior, phase transitions, and sensitivity to thermal degradation [37]. It is important to carry out a detailed characterization for Gr/PVDF composites to understand their temperature dependence because exact temperature dependence can vary based on the specific materials, their preparation methods, and the intended application. PVDF is also a multi-functional polymer exhibiting piezoelectricity, piezoresistive, or ferroelectricity properties, which change significantly with temperature, making it challenging to determine the precise behavior of graphene and Gr/PVDF composites over a range of temperatures [38].

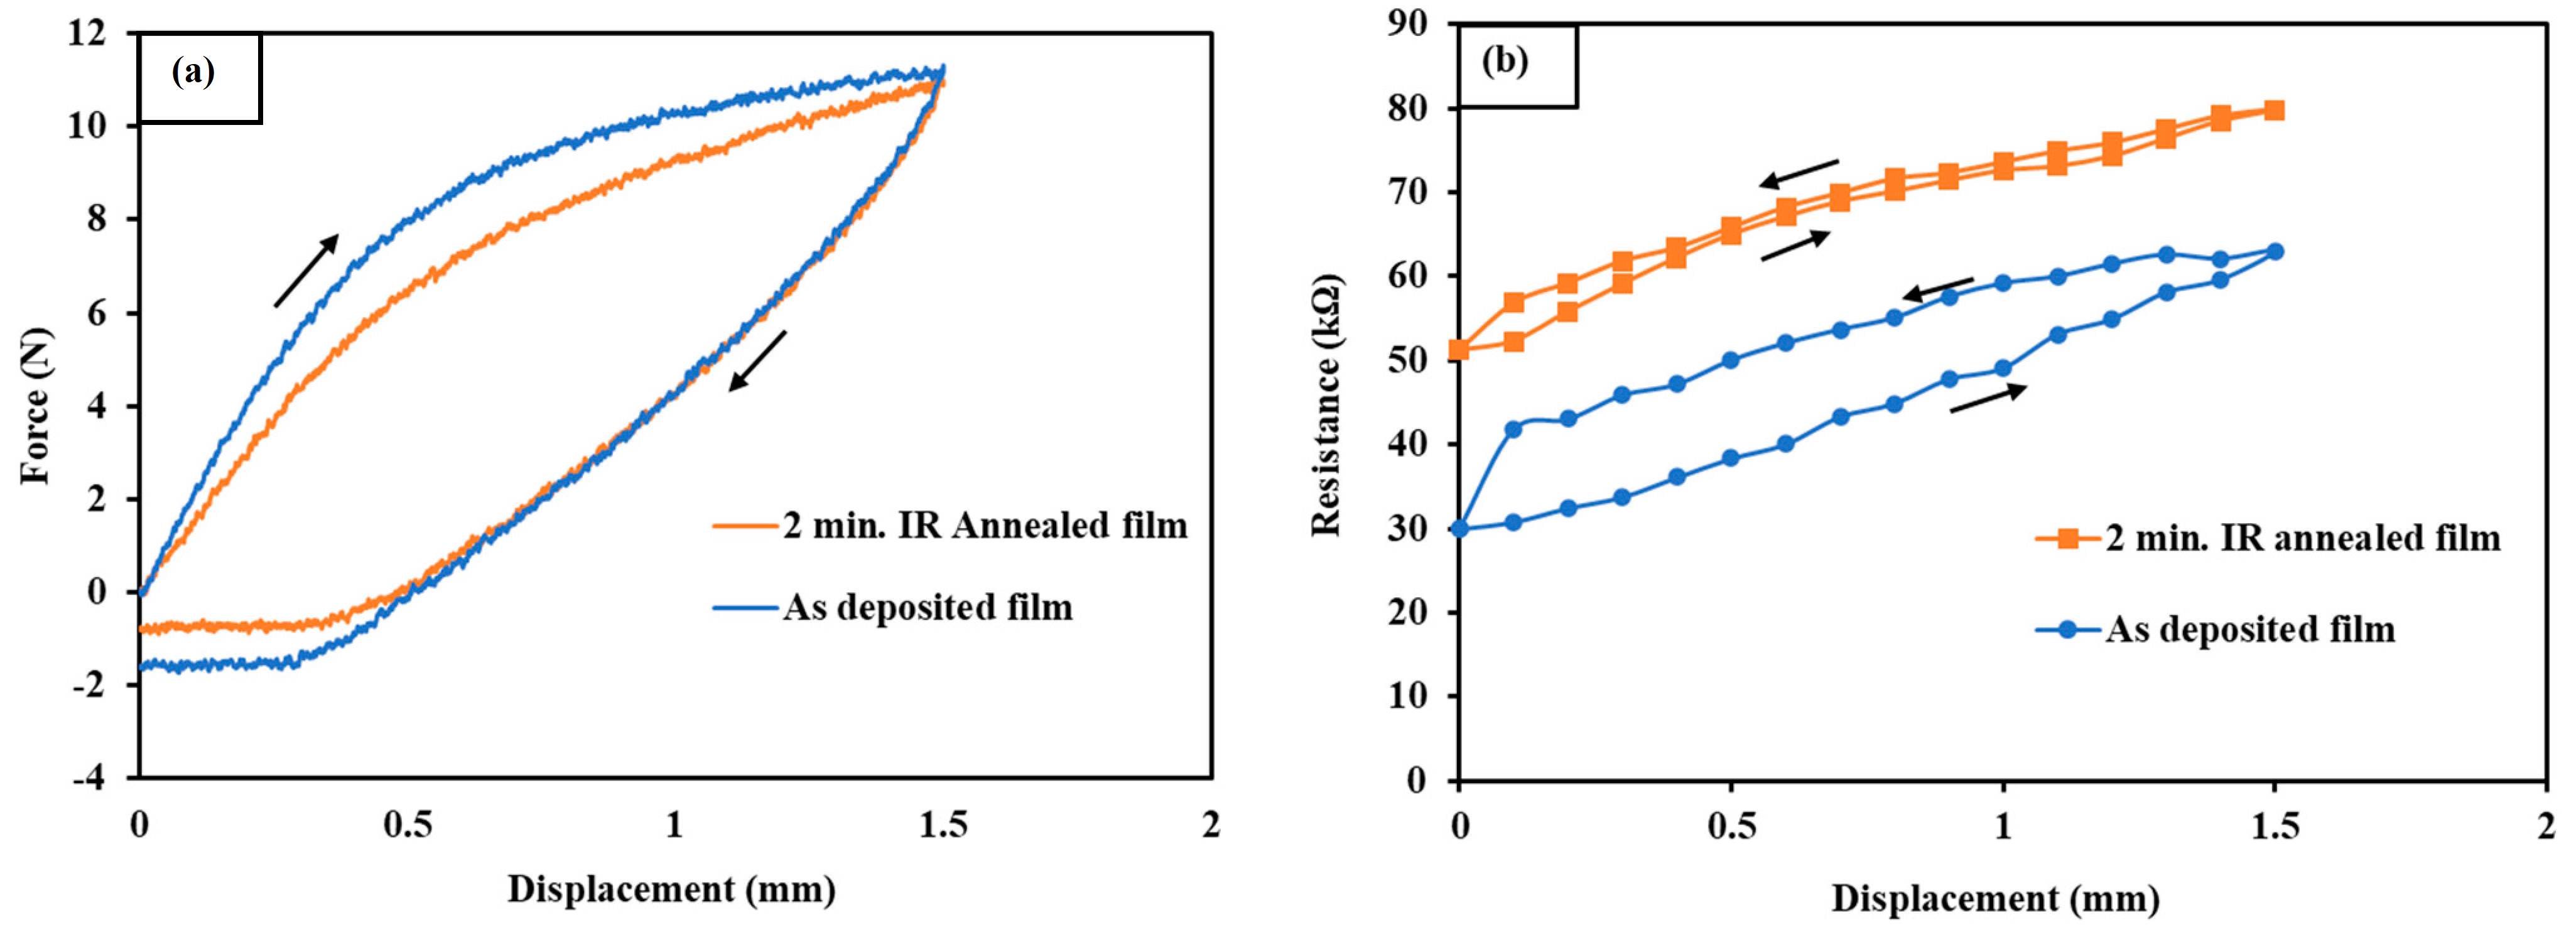
3.6. Mechanical Properties of the Gr/PVDF Nanocomposite

The mechanical properties of the different film samples were measured using a universal testing machine (UTM). Figure 11a shows the load versus extension for the 2 min IR-annealed and the as-deposited films. Figure 11b,c depict the variation of resistance and strain in the composites, respectively. The tests on the two films were conducted at a constant elongation velocity of 100 μm/min at room temperature, and the change in resistance of the thin films was recorded with a multimeter. The load versus elongation was monitored until the breaking point of the electrical connection was reached.
The change in resistance followed linear variation up to a strain value of approximately 0.38 for the annealed film and 0.12 for the as-deposited film and then exponentially increased. The annealed film had a maximum stretch of up to 7 mm at 14 N of applied load before a loss of conductivity, while the as-deposited film had a stretch of 5 mm at 12 N. It is observed that the as-deposited film exhibits a higher response compared with the 2 min IR-annealed film under a force ranging from 8 N to 10 N. The exact reason for this phenomenon is currently unknown. The higher stretch value in annealed film can be attributed to an improvement in the interconnection between the graphene and PVDF. Annealing enhances the cross-links and reduces the graphene defects. The tensile strength and Young’s modulus of polymer-based nanocomposites depend on the polymer matrixes. The mechanical properties can also be enhanced via good interfacial interactions and the synergistic effect of the fillers [38,39]. The graph of load versus extension gives us more insight into the stretchability property of the fabricated pressure sensor. This is another important characteristic of a reliable sensor that is used in applications where they may be subjected to mechanical loading and unloading, such as wearable devices and biomedical sensors.

3.7. Hysteresis in a Gr/PVDF Nanocomposite

Hysteresis study for Gr/PVDF nanocomposite is important in designing pressure sensors that offer accurate and reliable measurements because the sensor is involved in mechanical deformation. Figure 12a depicts the relationship between the applied force and the displacement during the loading and unloading cycles in annealed and as-deposited Gr/PVDF nanocomposite films. The as-deposited film had a larger area under the hysteresis loop than the IR-annealed film. The plot shown in Figure 12b indicates that both films had linear resistance changes with displacement. These results give insight into the composite mechanical behavior, sensitivity, and dynamic response. Hysteresis can also be used to analyze the sensor’s durability and reliability since it is subjected to repetitive loading and unloading cycles. This can also provide information about Gr/PVDF nanocomposite fatigue and degradation, which is essential for dynamic sensor applications. Hysteresis behavior can be influenced by several factors, such as annealing, the interconnection between graphene and PVDF matrix, the substrate used, and the composition of nanocomposites, such as the ratio between graphene concentration and the polymer matrix [40,41]. Finally, further studies and characterization are needed to understand this behavior. The electrical conductivity of the nanocomposite under different loading and unloading conditions can also be carried out to assess its performance in different electronic sensor applications. Table 2 gives a summary of the electrical and mechanical properties of graphene, PVDF, and the experimental data for Gr/PVDF nanocomposite.

4. Challenges and Future Research Efforts of Gr/PVDF Nanocomposite

This study indicates that the IR annealing of Gr/PVDF nanocomposite improves the performance of the sensor and provides a greater potential for commercialization. However, further improvements are required to optimize the sensor applications. The interconnection of the nanocomposite and the adhesion of Gr/PVDF to the substrate is important. The improvement in the adhesion of the Gr/PVDF to the substrate helps improve the mechanical stability of the sensor during the continuous loading and unloading pressure cycles. Improving the adhesion will also improve the durability, repeatability, and reproducibility characteristics of the sensor.
The interconnection between graphene and the polymer matrix can be improved by different coating techniques and by optimizing the annealing process. Even though graphene’s unique properties are very promising for flexible polymer sensors, there are still a few challenges that need to be investigated. For example, different polymer materials have been used to synthesize graphene-based composites in the past [46,47]. However, none of these polymers exhibit a strong piezoresistive behavior compared with PVDF. The preparation process needs to be addressed so that a well-dispersed composite is achieved. This will help reduce the traps of charges within the interfaces to give a superconductive composite. The dielectric properties of the composite should also be further investigated; this will help to address the electrical polarizability and molecular dynamics in polymers and other nanomaterials. Also, the thermal conductivity and the interfacial thermal resistance in the composites are important to study. Furthermore, as the thermal properties are optimized, the mechanical properties of the nanocomposites should be addressed for the ideal application of the nanocomposites [48,49].
It is a challenge to obtain real pressure change at high temperatures in Gr/PVDF nanocomposites due to the temperature-dependent resistance of the material, as shown in Figure 10. However, few techniques can be utilized to address this issue. First, researchers can calibrate the resistance–temperature relationship of the nanocomposite to accurately compensate for temperature variations during pressure measurements. Also, they can utilize temperature-controlled environments or incorporate temperature sensors directly into the experimental setup to monitor and adjust for temperature fluctuations in real-time. By accounting for temperature effects, precise pressure measurements at high-temperature conditions can be derived to facilitate the characterization and optimization of Gr/PVDF nanocomposites for various applications.
Advanced research efforts should be carried out to understand the sensitivity of nanocomposites towards various applications. The main challenges in the use of Gr/PVDF nanocomposites involve the attainment of better graphene dispersion and fine polymer/graphene interfaces. Due to the tendency of graphene aggregation, homogeneous dispersal has been found essential to enhance the properties of the graphene/polymer. Improving the compatibility of the polymer/graphene is essential to improve the crystallization, viscoelastic properties, and storage modulus of the nanocomposites. With these future research efforts, the full potential of the Gr/PVDF nanocomposites will be realized, which will aid us in achieving the commercialization of the practical application of the Gr/polymer nanocomposites [50].

5. Conclusions

A highly sensitive pressure sensor was developed using Gr/PVDF composite film deposited on a PE substrate utilizing a solvent casting process. The intensity ratio of IG/I2D, estimated via Raman spectroscopy, indicated that the fabricated Gr/PVDF nanocomposite film had a multi-layered graphene present. The films annealed with IR light for 2 min exhibited a fast response during the loading and unloading process, as well as exceptional mechanical stability. The annealing of Gr/PVDF enhanced its electrical conductivity, mechanical strength, and thermal stability due to the improvement of the interconnection between the graphene and PVDF matrix. This improved interconnection is responsible for the highly sensitive pressure sensor because the conducting networks are improved within the composite medium. This work shows that Gr/PVDF nanofilms can be utilized for future electronics and potential applications in various sectors, such as the aerospace and automotive industries, as well as in biomedical applications.

Author Contributions

Supervision, conceptualization, methodology, and final review—A.H.J.; hardware, software, data collection, and writing—V.K.S.; Raman spectroscopy—A.B.; lifecycle assessment and sensor data analysis—K.T. and K.S.; data analysis and final inspection of the manuscript—A.C.J. All authors have read and agreed to the published version of the manuscript.

Funding

This research received no external funding.

Data Availability Statement

Data are contained within the article.

Acknowledgments

The authors are grateful to Ray Hixon at the Department of Mechanical, Industrial, and Manufacturing Engineering for providing partial support for this research project.

Conflicts of Interest

The authors declare no conflicts of interest.

References

  1. Almassri, A.M.; Hasan, W.Z.W.; Ahmad, S.A.; Ishak, A.J.; Ghazali, A.M.; Talib, D.N.; Wada, C. Pressure Sensor: State of the Art, Design, and Application for Robotic Hand. J. Sens. 2015, 2015, 1–12. [Google Scholar]
  2. Eaton, W.P.; Smith, J.H. Micromachined pressure sensors: Review and recent developments. Smart Mater. Struct. 1997, 6, 50–539. [Google Scholar]
  3. Maharjan, S.; Jayatissa, A.H. A Review of Flexible Sensors. In Nanomaterials for Energy and Sensor Applications; CRC Press: Boca Raton, FL, USA, 2022; pp. 137–153. [Google Scholar]
  4. Xu, F.; Li, X.; Shim, Y.; Li, L.; Wand, W.; He, L. Recent Developments for Flexible Pressure Sensors: A Review. Micromachines 2018, 9, 580. [Google Scholar] [CrossRef] [PubMed]
  5. Samoei, V.K.; Maharjan, S.; Jayatissa, A.H. Graphene Nanocomposites for Pressure Sensors Applications. In Applications of Nanocomposites; CRC Press: Boca Raton, FL, USA, 2022; pp. 122–137. [Google Scholar]
  6. Maharjan, S.; Samoei, V.K.; Jayatissa, A.H.; Noh, J.H.; Sano, K. Knittle Pressure Sensor Based on Graphene/Polyvinylidene Fluoride Nanocomposite Coated on Polyester Fabric. Materials 2022, 16, 7087. [Google Scholar]
  7. Yu, W.; Sisi, L.; Haiyan, Y.; Jie, L. Progress in the functional modification of graphene/graphene oxide: A review. RSC Adv. 2020, 10, 15328. [Google Scholar]
  8. Xiao, P.; Yi, N.; Zhang, T.; Huang, Y.; Chang, H.; Yang, Y.; Zhou, Y.; Chen, Y. Construction of a fish-like robot based on high-performance graphene/PVDF bimorph actuation materials. Adv. Sci. 2016, 6, 1500438. [Google Scholar]
  9. Silva, M.; Alves, N.M.; Paiva, M.C. Graphene-polymer nanocomposites for biomedical applications. Polym. Adv. Technol. 2018, 29, 687–700. [Google Scholar]
  10. Manu, B.R.; Gupta, A.; Jayatissa, A.H. Tribological properties of 2D materials and composites—A review of recent advances. Materials 2021, 14, 1630. [Google Scholar] [CrossRef]
  11. Lee, S.J.; Yoon, S.J.; Jeon, I.Y. Graphene/Polymer nanocomposites: Preparation, mechanical properties, and application. Polymers 2022, 14, 4733. [Google Scholar] [CrossRef]
  12. Maharjan, S.; Samoei, V.K.; Jayatissa, A.H. Graphene/PVDF Nanocomposite-Based Accelerometer for Detection of Low Vibrations. Materials 2023, 16, 1586. [Google Scholar] [CrossRef]
  13. Shuai, C.; Zeng, Z.; Yang, Y.; Qi, F.; Peng, S.; Yang, W.; He, C.; Wang, G.; Qian, G. Graphene oxide assists polyvinylidene fluoride scaffold to reconstruct electrical microenvironment of bone tissue. Mater. Des. 2020, 190, 108564. [Google Scholar]
  14. Itapu, B.M.; Jayatissa, A.H. A Review in Graphene/Polymer Composites. Chem. Sci. Int. J. 2018, 3, 1–16. [Google Scholar]
  15. Zheng, X.; Yu, H.; Yue, S.; Xing, R.; Zhang, Q.; Liu, Y.; Zhang, B. Functionalization of graphene and dielectric property relationships in PVDF/graphene nanosheets composites. Int. J. Electrochem. Sci. 2018, 13, 1–13. [Google Scholar]
  16. Widakdo, J.; Lei, W.-C.; Anawati, A.; Manjunatha, S.T.; Austria, H.F.M.; Setiawan, O.; Huang, T.-H.; Chiao, Y.-H.; Hung, W.-S.; Ho, M.-H. Effects of Co-Solvent-induced self-assembled graphene-PVDF composite film on piezoelectric application. Polymers 2022, 15, 137. [Google Scholar] [CrossRef] [PubMed]
  17. Huang, T.; Yang, S.; He, P.; Sun, J.; Zhang, S.; Li, D.; Meng, Y.; Zhou, J.; Tang, H.; Liang, J.; et al. Phase-separation-induced PVDF/graphene coating on fabrics toward flexible piezoelectric sensors. ACS Appl. Mater. Interfaces 2018, 10, 30732–30740. [Google Scholar]
  18. Al-Saygh, A.; Ponnamma, D.; AlMaadeed, M.A.; Vijayan, P.P.; Karim, A.; Hassan, M.K. Flexible pressure sensor based on PVDF nanocomposites containing reduced graphene oxide-titania hybrid nanolayers. Polymers 2017, 9, 33. [Google Scholar] [CrossRef]
  19. Seraji, S.M.; Jin, X.; Yi, Z.; Feng, C.; Salim, N.V. Ultralight porous poly (vinylidene fluoride)-graphene nanocomposites with compressive sensing properties. Nano Res. 2021, 14, 2620–2629. [Google Scholar]
  20. Zhang, L.; Zha, D.A.; Du, T.; Mei, S.; Shi, Z.; Jin, Z. Formation of superhydrophobic microspheres of poly (vinylidene fluoride–hexafluoropropylene)/graphene composite via gelation. Langmuir 2011, 27, 8943–8949. [Google Scholar]
  21. Abzan, N.; Kharaziha, M.; Labbaf, S. Development of three-dimensional piezoelectric polyvinylidene fluoride-graphene oxide scaffold by non-solvent induced phase separation method for nerve tissue engineering. Mater. Des. 2019, 167, 107636. [Google Scholar]
  22. Cao, Y.; Liang, M.; Liu, Z.; Wu, Y.; Xiong, X.; Li, C.; Wang, X.; Jiang, N.; Yu, J.; Lin, C.-T. Enhanced thermal conductivity for poly (vinylidene fluoride) composites with nano-carbon fillers. RSC Adv. 2016, 6, 68357–68362. [Google Scholar]
  23. Samoei, V.K.; Jayatissa, A.H.; Sano, K. Flexible Pressure Sensor Based on Carbon Black/PVDF Nanocomposite. Chem. Sci. Int. J. 2024, 33, 1–10. [Google Scholar]
  24. Maharjan, S.; Samoei, V.K.; Amili, O.; Sano, K.; Honma, H.; Jayatissa, A.H. Design and fabrication of a graphene/polyvinylidene fluoride nanocomposite-based airflow sensor. ACS Omega 2022, 7, 7981–7988. [Google Scholar] [PubMed]
  25. Cheng, M.; Zhu, G.; Zhang, F.; Tang, W.-L.; Jianping, S.; Yang, J.-Q.; Zhu, L.-Y. A review of flexible force sensors for human health monitoring. J. Adv. Res. 2022, 26, 53–68. [Google Scholar]
  26. Tai, G.; Wei, D.; Su, M.; Li, P.; Xie, L.; Yang, J. Force-sensitive interface engineering in flexible pressure sensors: A review. Sensors 2022, 22, 2652. [Google Scholar] [CrossRef]
  27. Mohamadi, S.; Sharifi-Sanjani, N.; Foyouhi, A. Evaluation of graphene nanosheets influence on the physical properties of PVDF/PMMA blend. J. Polym. Res. 2013, 20, 46. [Google Scholar]
  28. Salam, M.A.E.; Elkomy, G.M.; Osman, H.; Nagy, M.R.; El-Sayed, F. Structure–electrical conductivity of polyvinylidene fluoride/graphite composites. J. Reinf. Plast. Compos. 2012, 31, 1342–1352. [Google Scholar]
  29. Ahmad, K.; Pan, W.; Shi, S.L. Electrical conductivity, and dielectric properties of multiwalled carbon nanotube and alumina composites. Appl. Phys. Lett. 2006, 13, 89. [Google Scholar]
  30. Zhang, Y.F.; Zhao, Y.H.; Bai, S.L.; Yuan, X. Numerical simulation of thermal conductivity of graphene filled polymer composites. Compos. Part B Eng. 2016, 106, 324–331. [Google Scholar]
  31. Zhao, Y.H.; Wu, Z.K.; Bai, S.L. Study on thermal properties of graphene foam/graphene sheets filled polymer composites. Compos. Part A Appl. Sci. Manuf. 2015, 72, 200–206. [Google Scholar]
  32. Zhang, X.; Yeung, K.K.; Gao, Z.; Li, J.; Sun, H.; Xu, H.; Zhang, K.; Zhang, M.; Chen, Z.; Yuen, M.M.; et al. Exceptional thermal interface properties of a three-dimensional graphene foam. Carbon 2014, 66, 201–209. [Google Scholar]
  33. Li, A.; Zhang, C.; Zhang, Y.F. Thermal conductivity of graphene-polymer composites: Mechanisms, properties, and applications. Polymers 2017, 9, 437. [Google Scholar] [CrossRef]
  34. Samoei, V.K.; Maharjan, S.; Sano, K.; Jayatissa, A.H. Effect of Annealing on Graphene/PVDF Nanocomposites. ACS Omega 2023, 8, 13876–13883. [Google Scholar] [PubMed]
  35. Davaji, B.; Cho, H.D.; Malakoutian, M.; Lee, J.-K.; Panin, G.; Kang, T.W.; Lee, C.H. A patterned single layer graphene resistance temperature sensor. Sci. Rep. 2017, 7, 8811. [Google Scholar]
  36. Chuang, C.; Woo, T.-P.; Mahjoub, A.M.; Ouchi, T.; Hsu, C.-S.; Chin, C.-P.; Aoki, N.; Lin, L.-H.; Ochiai, Y.; Liang, C.-T. Current Scaling and Dirac Fermion Heating in Multi-Layer Graphene. J. Nanosci. Nanotechnol. 2015, 15, 1195–1198. [Google Scholar]
  37. Oseli, A.; Aulova, A.; Gergesova, M.; Emri, I. Effect of temperature on mechanical properties of polymers. In Encyclopedia of Continuum Mechanics; Springer: Berlin/Heidelberg, Germany, 2018; pp. 747–766. [Google Scholar]
  38. Dallaev, R.; Pisarenko, T.; Sobola, D.; Orudzhev, F.; Ramazanov, S.; Trčka, T. Brief review of PVDF properties and applications potential. Polymers 2022, 14, 4793. [Google Scholar] [CrossRef]
  39. Hsissou, R.; Seghiri, R.; Benzekri, Z.; Hilali, M.; Rafik, M.; Elharfi, A. Polymer composite materials: A comprehensive review. Compos. Struct. 2021, 262, 113640. [Google Scholar]
  40. Wang, S.; Li, Q. Design, Synthesis and processing of PVDF-based dielectric polymers. Iet Nanodielectrics 2018, 1, 80–91. [Google Scholar]
  41. Wang, H.; Wu, Y.; Cong, C.; Shang, J.; Yu, T. Hysteresis of electronic transport in graphene transistors. ACS Nano 2010, 4, 7221–7228. [Google Scholar]
  42. Memarian, F.; Fereidoon, A.; Ganji, M.D. Graphene Young’s modulus: Molecular mechanics and DFT treatments. Superlattices Microstruct. 2015, 85, 348–356. [Google Scholar]
  43. Mbayachi, V.B.; Ndayiragije, E.; Sammani, T.; Taj, S.; Mbuta, E.R. Graphene synthesis, characterization and its applications: A review. Results Chem. 2021, 3, 100163. [Google Scholar]
  44. Layek, R.K.; Nandi, A.K. A review on synthesis and properties of polymer functionalized graphene. Polymer 2013, 54, 5087–5103. [Google Scholar]
  45. Kim, H.S.; Lee, D.W.; Kim, D.H.; Kong, D.S.; Choi, J.; Lee, M.; Murillo, G.; Jung, J.H. Dominant role of Young’s modulus for electric power generation in PVDF–BaTiO3 composite-based piezoelectric nanogenerator. Nanomaterials 2018, 8, 777. [Google Scholar] [CrossRef] [PubMed]
  46. Wang, W.; Jayatissa, A.H. Computational and experimental study of electrical conductivity of graphene/poly (methyl methacrylate) nanocomposite using Monte Carlo method and percolation theory. Synth. Met. 2015, 204, 141–147. [Google Scholar]
  47. Wang, W.; Jayatissa, A.H. Comparison study of graphene based conductive nanocomposites using poly (methyl methacrylate) and polypyrrole as matrix materials. J. Mater. Sci. Mater. Electron. 2015, 26, 7780–7783. [Google Scholar]
  48. Puértolas, J.; García-García, J.; Pascual, F.; González-Domínguez, J.; Martínez, M.; Ansón-Casaos, A. Dielectric behavior and electrical conductivity of PVDF filled with functionalized single-walled carbon nanotubes. Compos. Sci. Technol. 2017, 152, 263–274. [Google Scholar]
  49. Moldovan, O.; Iñiguez, B.; Deen, M.J.; Marsal, L.F. Graphene electronic sensors–review of recent developments and future challenges. IET Circuits Devices Syst. 2015, 9, 446–453. [Google Scholar]
  50. Kim, H.; Abdala, A.A.; Macosko, C.W. Graphene/polymer nanocomposites. Macromolecules 2010, 43, 6515–6530. [Google Scholar]
Figure 1. Schematic flow chart of the Gr/PVDF nanocomposite preparation for the thin-film pressure sensor.
Inorganics 12 00228 g001
Figure 2. Schematic representation of the experimental setup: (a) top view of the mounted film; (b) annealing setup (4 mm indicates the width of composite film); (c) test fixture for the pressure sensing experiment (the top area of sensor area was a circular hole, which has a diameter of 10 mm).
Inorganics 12 00228 g002
Figure 3. Scanning electron microscopy (SEM) images of (a) 2 min. IR-annealed (b) as-deposited Gr/PVDF films and the corresponding EDS images. Both EDS spectra have peaks corresponding to C, O, and F.
Inorganics 12 00228 g003
Figure 4. Raman spectra of Gr/PVDF nanocomposite.
Inorganics 12 00228 g004
Figure 5. Sensing responses of as-deposited Gr/PVDF nanocomposites.
Inorganics 12 00228 g005
Figure 6. Sensing responses of Gr/PVDF nanocomposites for the annealed films using IR light ((ad) represent the annealing times of 2, 4, 6, and 8 min, respectively).
Inorganics 12 00228 g006
Figure 7. (a) The relationship between the resistance response and the average value of pressure (kPa) for Gr/PVDF films. (b) The relationship between the resistance response and the annealing time at different pressure ranges for the Gr/PVDF nanocomposites.
Inorganics 12 00228 g007
Figure 8. Pressure response at a constant temperature of 50 °C for 2 min IR-annealed (red line) and as-deposited (blue line) films at different pressures of 17, 34, 51, and 68 kPa.
Inorganics 12 00228 g008
Figure 9. Sensor response versus pressure with error bars at room temperature and a constant temperature of 50 °C for 2 min IR-annealed and as-deposited films. Results indicate a linear dependance of the resistance response on pressure (kPa).
Inorganics 12 00228 g009
Figure 10. Arrhenius plots of electrical conductivity and temperature for graphene, as-deposited Gr/PVDF, and 2 min IR-annealed Gr/PVDF nanocomposites in a temperature range of 25–150 °C.
Inorganics 12 00228 g010
Figure 11. (a) Tensile test of the as-deposited and 2 min IR-annealed Gr/PVDF nanocomposite; (b,c) indicate a change in resistance versus strain to the breakpoint of electrical conductivity.
Inorganics 12 00228 g011
Figure 12. (a) Hysteresis loop for 2 min IR-annealed and as-deposited Gr/PVDF nanocomposite. (b) Relation between resistance (kΩ) and displacement (mm) for 2 min IR-annealed and as-deposited films to investigate the mechanical properties of the nanocomposites. The arrows show the loading and unloading cycles.
Inorganics 12 00228 g012
Table 1. Fabrication methods of Gr/PVDF nanocomposite and its potential applications.
CompositesFabrication MethodsApplicationsRef.
Graphene/PVDFMixing technique with different co-solvent mixtures (acetone, THF, water, and EtOH)Piezoelectric nanogenerator composite films[16]
Electrospun PVDF/Graphene MembraneSolution mixing techniqueHumidity sensor[17]
PVDF/Reduced Graphene Oxides (rGO) compositeHydrothermal method and simple mixing techniqueFlexible pressure sensors (improved sensitivity by 333.46% at 5 kPa, compared with individual PVDF composite rGO-titania TNL)[18]
PVDF/GraphenePrepared by gelation-induced crystallization of PVDF/cyclohexanone by varying the temperature and mixing timeCompressible sensors for sports and wearable electronics[19]
Poly(vinylidene fluoride-hexafluoropropylene) (PVDF-HFP)/grapheneGelation methodWater-repellent catalyst-supporting materials[20]
GO-PVDFNon-solvent-induced phase separation methodNerve tissue engineering[21]
(PVDF) with zero-dimensional super fullerene (SF), one-dimensional carbon nanotubes (CNT), and two-dimensional graphene sheets (GS)Solution mixing followed by hot pressingAdvanced thermal management[22]
Graphene/Polyvinylidene Fluoridesolution-phase mixing technique and dip-coating methodKnittle pressure sensor[6]
Graphene/Polyvinylidene Fluoridesolution-phase mixing technique Accelerometer for detection of low vibrations and airflow sensor[10,23]
Table 2. The approximate response time for the films for the recovery when IR light is turned on and off.
MaterialYoungs ModulusElectrical ConductivityActivation Energy (Ea)Pressure SensitivityRef.
Graphene1000 ± 100 GPa104–106 S/cm[42,43]
PVDF2.5–3.2 GPa10–11–10–8 S/cm[44,45]
As-deposited Gr/PVDF10.2 GPa1.23 S/cm0.03 eV/K0.047(This work)
2 min IR-annealed Gr/PVDF27.1 GPa2.48 S/cm0.14 eV/K0.072(This work)
Disclaimer/Publisher’s Note: The statements, opinions and data contained in all publications are solely those of the individual author(s) and contributor(s) and not of MDPI and/or the editor(s). MDPI and/or the editor(s) disclaim responsibility for any injury to people or property resulting from any ideas, methods, instructions or products referred to in the content.

