Article

Novel Tricarbonylrhenium-Anthrapyrazole Complexes with DNA-Binding and Antitumor Properties: In Vitro and In Vivo Pharmacokinetic Studies with 99mTc-Analogue

by
Georgios Paparidis
1,
Melpomeni Akrivou
2,
George Psomas
3,
Ioannis S. Vizirianakis
2,4,
Antonios Hatzidimitriou
3,
Catherine Gabriel
5,6,
Dimosthenis Sarigiannis
5,6 and
Dionysia Papagiannopoulou
1,*
1
Laboratory of Pharmaceutical Chemistry, School of Pharmacy, Faculty of Health Sciences, Aristotle University of Thessaloniki, 54124 Thessaloniki, Greece
2
Laboratory of Pharmacology, School of Pharmacy, Faculty of Health Sciences, Aristotle University of Thessaloniki, 54124 Thessaloniki, Greece
3
Department of General and Inorganic Chemistry, Faculty of Chemistry, Aristotle University of Thessaloniki, 54124 Thessaloniki, Greece
4
Department of Health Sciences, School of Life & Health Sciences, University of Nicosia, Nicosia 2417, Cyprus
5
Environmental Engineering Laboratory, Department of Chemical Engineering, Aristotle University of Thessaloniki, 54124 Thessaloniki, Greece
6
HERACLES Research Center on the Exposome and Health, Center for Interdisciplinary Research and Innovation, Balkan Center, Bldg. B, 10th km Thessaloniki-Thermi Road, 57001 Thessaloniki, Greece
*
Author to whom correspondence should be addressed.
Inorganics 2024, 12(9), 254; https://doi.org/10.3390/inorganics12090254
Submission received: 19 August 2024 / Revised: 6 September 2024 / Accepted: 19 September 2024 / Published: 21 September 2024
(This article belongs to the Special Issue Biological Activity of Metal Complexes)

Abstract

:
Organometallic complexes of fac-tricarbonylrhenium have been shown to exhibit anticancer properties. Anthrapyrazole anticancer agents act as DNA intercalators and topoisomerase IIα inhibitors, leading to double-strand breaks (DBS) and cell cycle arrest. This work involves the synthesis and biological evaluation of novel fac-tricarbonyl-rhenium complexes with anthrapyrazole derivatives. The anthrapyrazole moiety was synthesized from 1,8-dihydroxyanthraquinone, and three ligands L1, L2 and L3 were prepared. Ligand L1 coordinates via the phenolic O and pyrazole N as bidentate chelator forming the fac-[Re(CO)3(κ2-N,O)(MeOH)]-type complex, ReL1. Ligand L2 contains a pendant picolylamine N,N′-chelating system, forming the bidentate fac-[Re(CO)3(κ2-N,N′)Br]-type complex, ReL2. Ligand L3 contains a pendant picolylaminomonoacetic acid chelating system, forming a tridentate fac-[Re(CO)3(κ3-N,N′,O)]-type complex, ReL3. Complex ReL4 contains a picolylamine chelator, forming a complex with structure fac-[Re(CO)3(κ2-N,N′)Br], which was synthesized as a model for ReL2, and its coordination mode was resolved by X-ray crystallography. The complexes were characterized spectroscopically, and their biological properties were evaluated in vitro, in terms of DNA binding as well as for the cytotoxicity against CT-26 tumor cell line. Tumor cell cytotoxicity was high for ligand L2 and complex ReL2, exhibiting IC50 values of 0.36 and 0.64 μΜ, respectively. The most promising complex ReL2 was evaluated further by the preparation of its congener γ-emitting technetium-99m radio-complex, 99mTcL2. The in vitro uptake in CT26 tumor cells and the in vivo uptake in CT26 tumor-bearing mice of 99mTcL2 was determined, and its pharmacokinetic profile was established. These data indicate that the 99mTc complex has suitable properties to enter tumor cells in vitro and in vivo, and therefore ReL2 is promising for further evaluation.

Graphical Abstract

1. Introduction

The development of metal complexes in therapeutics, especially in the treatment of cancer, has made significant advances to date [1,2,3,4,5,6,7]. Platinum-based drugs have been used as first-line anticancer agents for half a century now [8]. In this area of research, organometallic complexes of fac-tricarbonylrhenium have attracted attention in terms of their potential pharmaceutical applications for the development of novel antitumor and antimicrobial agents, as well as of luminescent probes for optical imaging [9,10,11,12,13]. The utilization of the fac-tricarbonylrhenium core is attractive for pharmaceutical applications due to its thermodynamic and kinetic stability, as well as for its versatility in drug design, with the existence of a variety of suitable chelating strategies. In addition, a number of research results show strong biological properties, which warrants their future exploration [13].
DNA intercalators are small molecules that can reversibly bind in between adjacent base pairs of double-stranded DNA (dsDNA). By binding to DNA, intercalators may cause fatal perturbations in essential DNA-associated processes such as replication, transcription and repair. Such polyaromatic frameworks include anthracenes, acridines, anthraquinones, phenazines, quinolones, phenanthridines, etc. [14]. Metal complexes may also intercalate with nucleic acid sequences either by conjugation to an organic intercalator or by coordination with a suitable chelating system, also known in the literature as metallointercalators, containing phenanthroline, phenanthrenequinone diimine and other ligands with extended aromatic systems [15]. Tricarbonylrhenium complexes with polyaromatic ligands such as phenanthrolines [16], quinolones [17] and bipyridine [18] have also been reported as antitumor agents.
Drug molecules containing the anthraquinone group are known to have clinical applications in therapeutic regiments against cancer. The anthraquinone scaffold provides flatness, due to the aromatic polycyclic system, causing intercalation between the double helix of DNA and the inhibition of topoisomerase II enzyme. Anthraquinone-based antitumor cytotoxic agents such as daunorubicin, doxorubicin, mitoxantrone and pixantrone, used in tumor therapy, are both Topo-II inhibitors and intercalators [19,20]. In this light, Imstepf et al. developed tricarbonylrhenium-doxorubicin complexes that were evaluated for their ability to inhibit Topo-IIα [21].
The anthraquinone scaffold participates in redox processes, leading to the production of free radicals, which enhances the cytotoxic profile of the compound in both cancer and normal cells. The cardiotoxicity of anthraquinone derivatives led to the design and development of an alternative scaffold [22]. Anthrapyrazoles, such as losoxantrone, contain a pyrazole ring in the chromophore site instead of the quinone group, and they exhibit significantly reduced cardiotoxicity, as shown in preclinical and clinical studies [23].
In this work, we developed new anthrapyrazole-based ligands suitable for complexation with tricarbonylrhenium as potential antitumor agents, taking into consideration the reduced cardiotoxicity as well as the presence of coordinating atoms in this moiety. Therefore, we designed ligands to coordinate with fac-tricarbonylrhenium core either directly with the (N,O)-donor atoms of the anthrapyrazole pharmacophore, ligand L1 or indirectly via the pendant bidentate (N,N)- and tridentate (N,N,O)-donor atom systems, ligands L2 and L3, respectively (Figure 1). The ligands and the rhenium complexes were evaluated in vitro for their ability to interact with calf-thymus (CT) DNA as well as for their cytotoxic properties in a tumor cell line. Complex ReL2, which exhibited the best biological properties, was translated to the analogous γ-emitting 99mTcL2 complex, which was evaluated in vitro and in vivo for its tumor uptake and distribution properties. Also, in order to simulate the structure of ReL2, the model complex ReL4, which also contains a picolylamine chelator and shares the same coordination mode of fac-[Re(CO)3(κ2-N,N′)Br], was synthesized and characterized by X-ray crystallography.

2. Results and Discussion

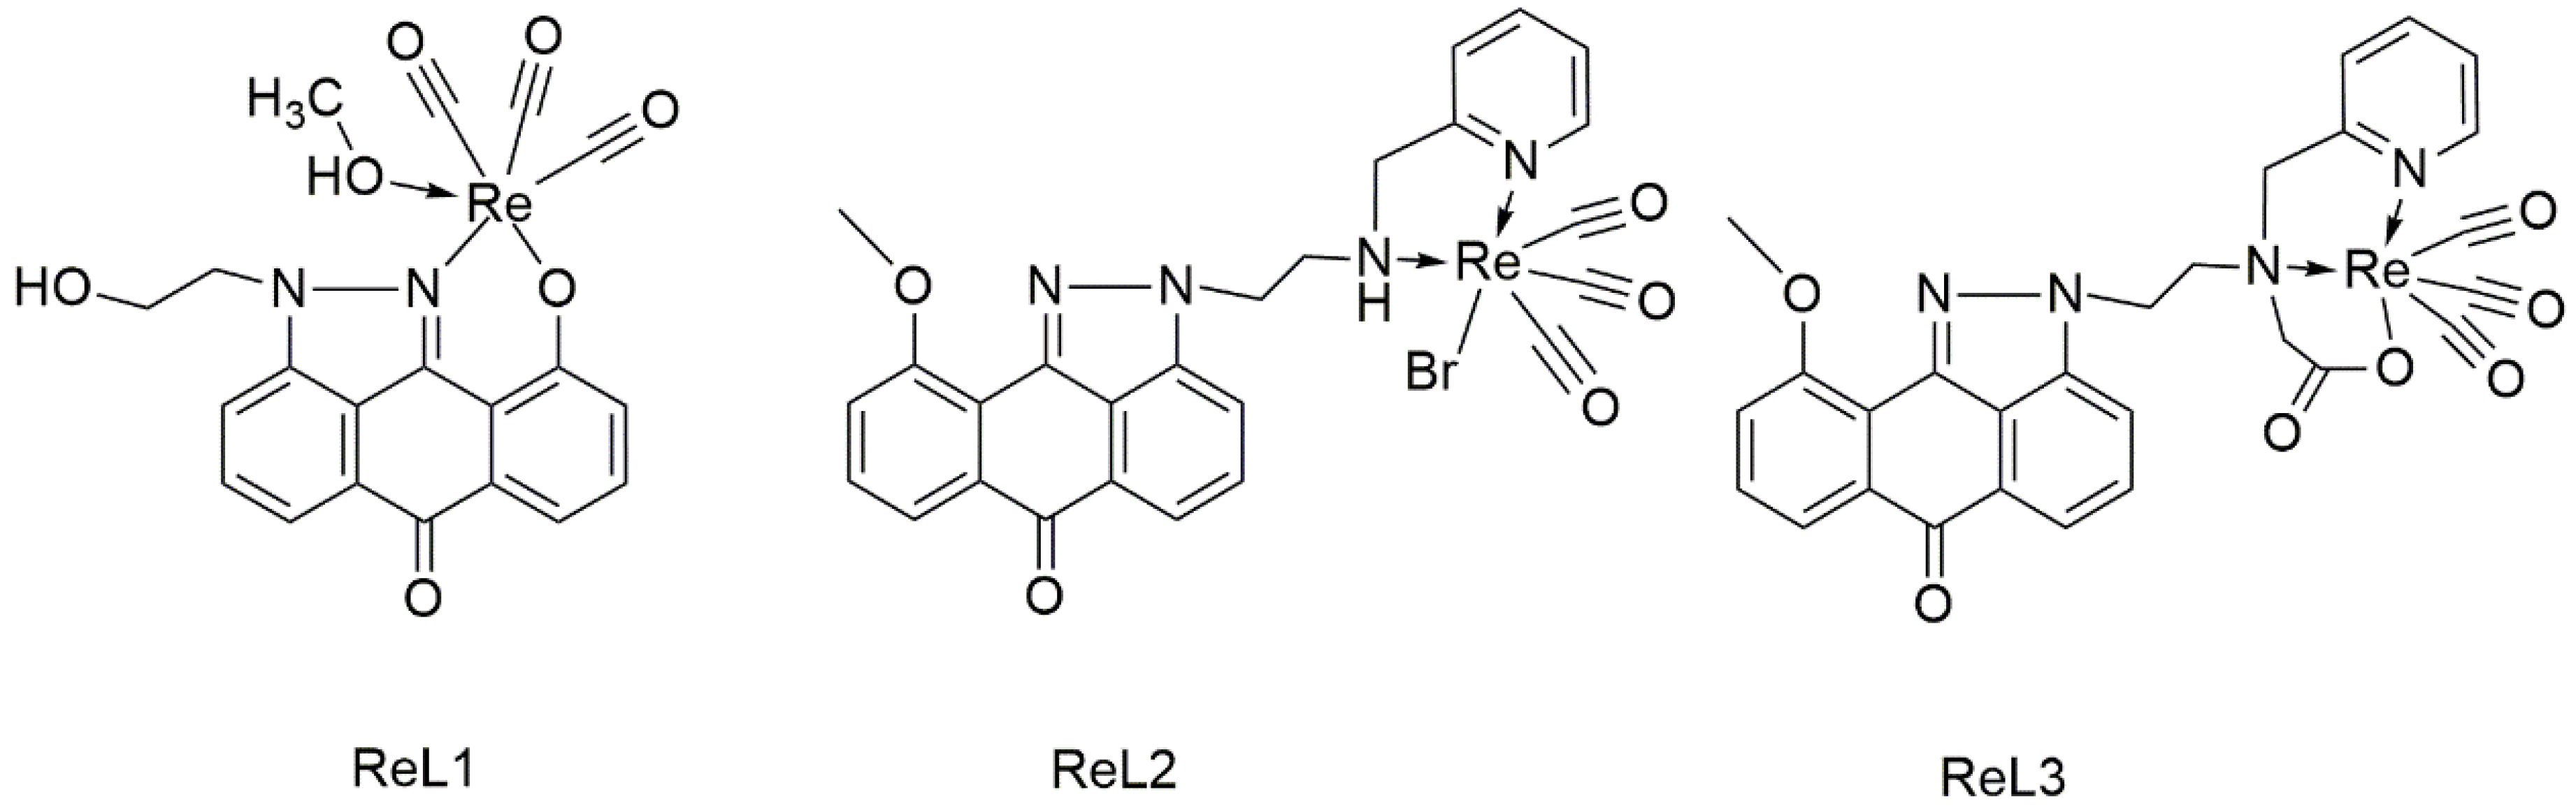
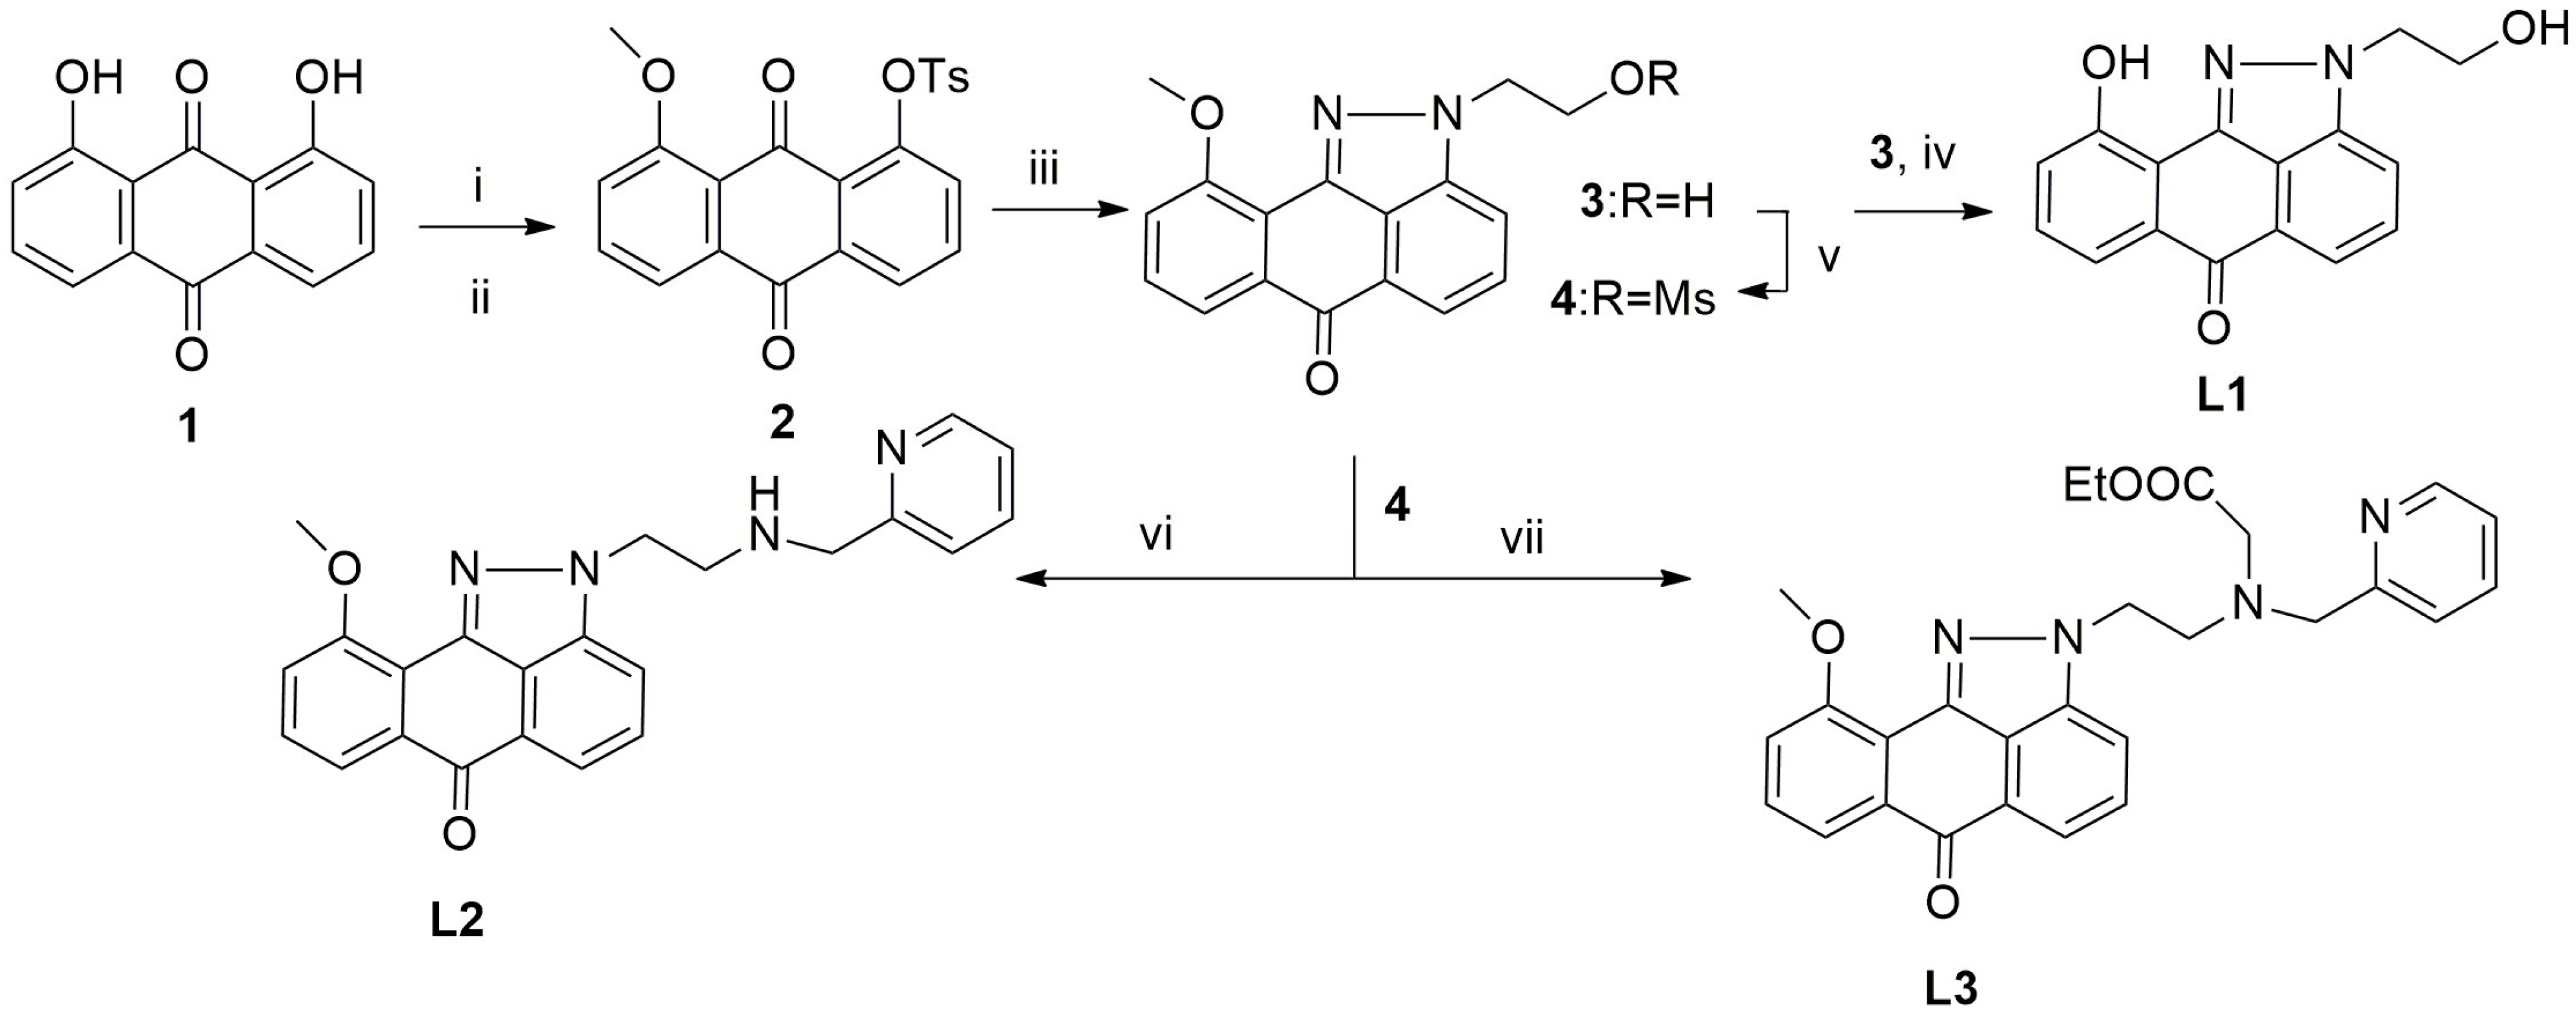
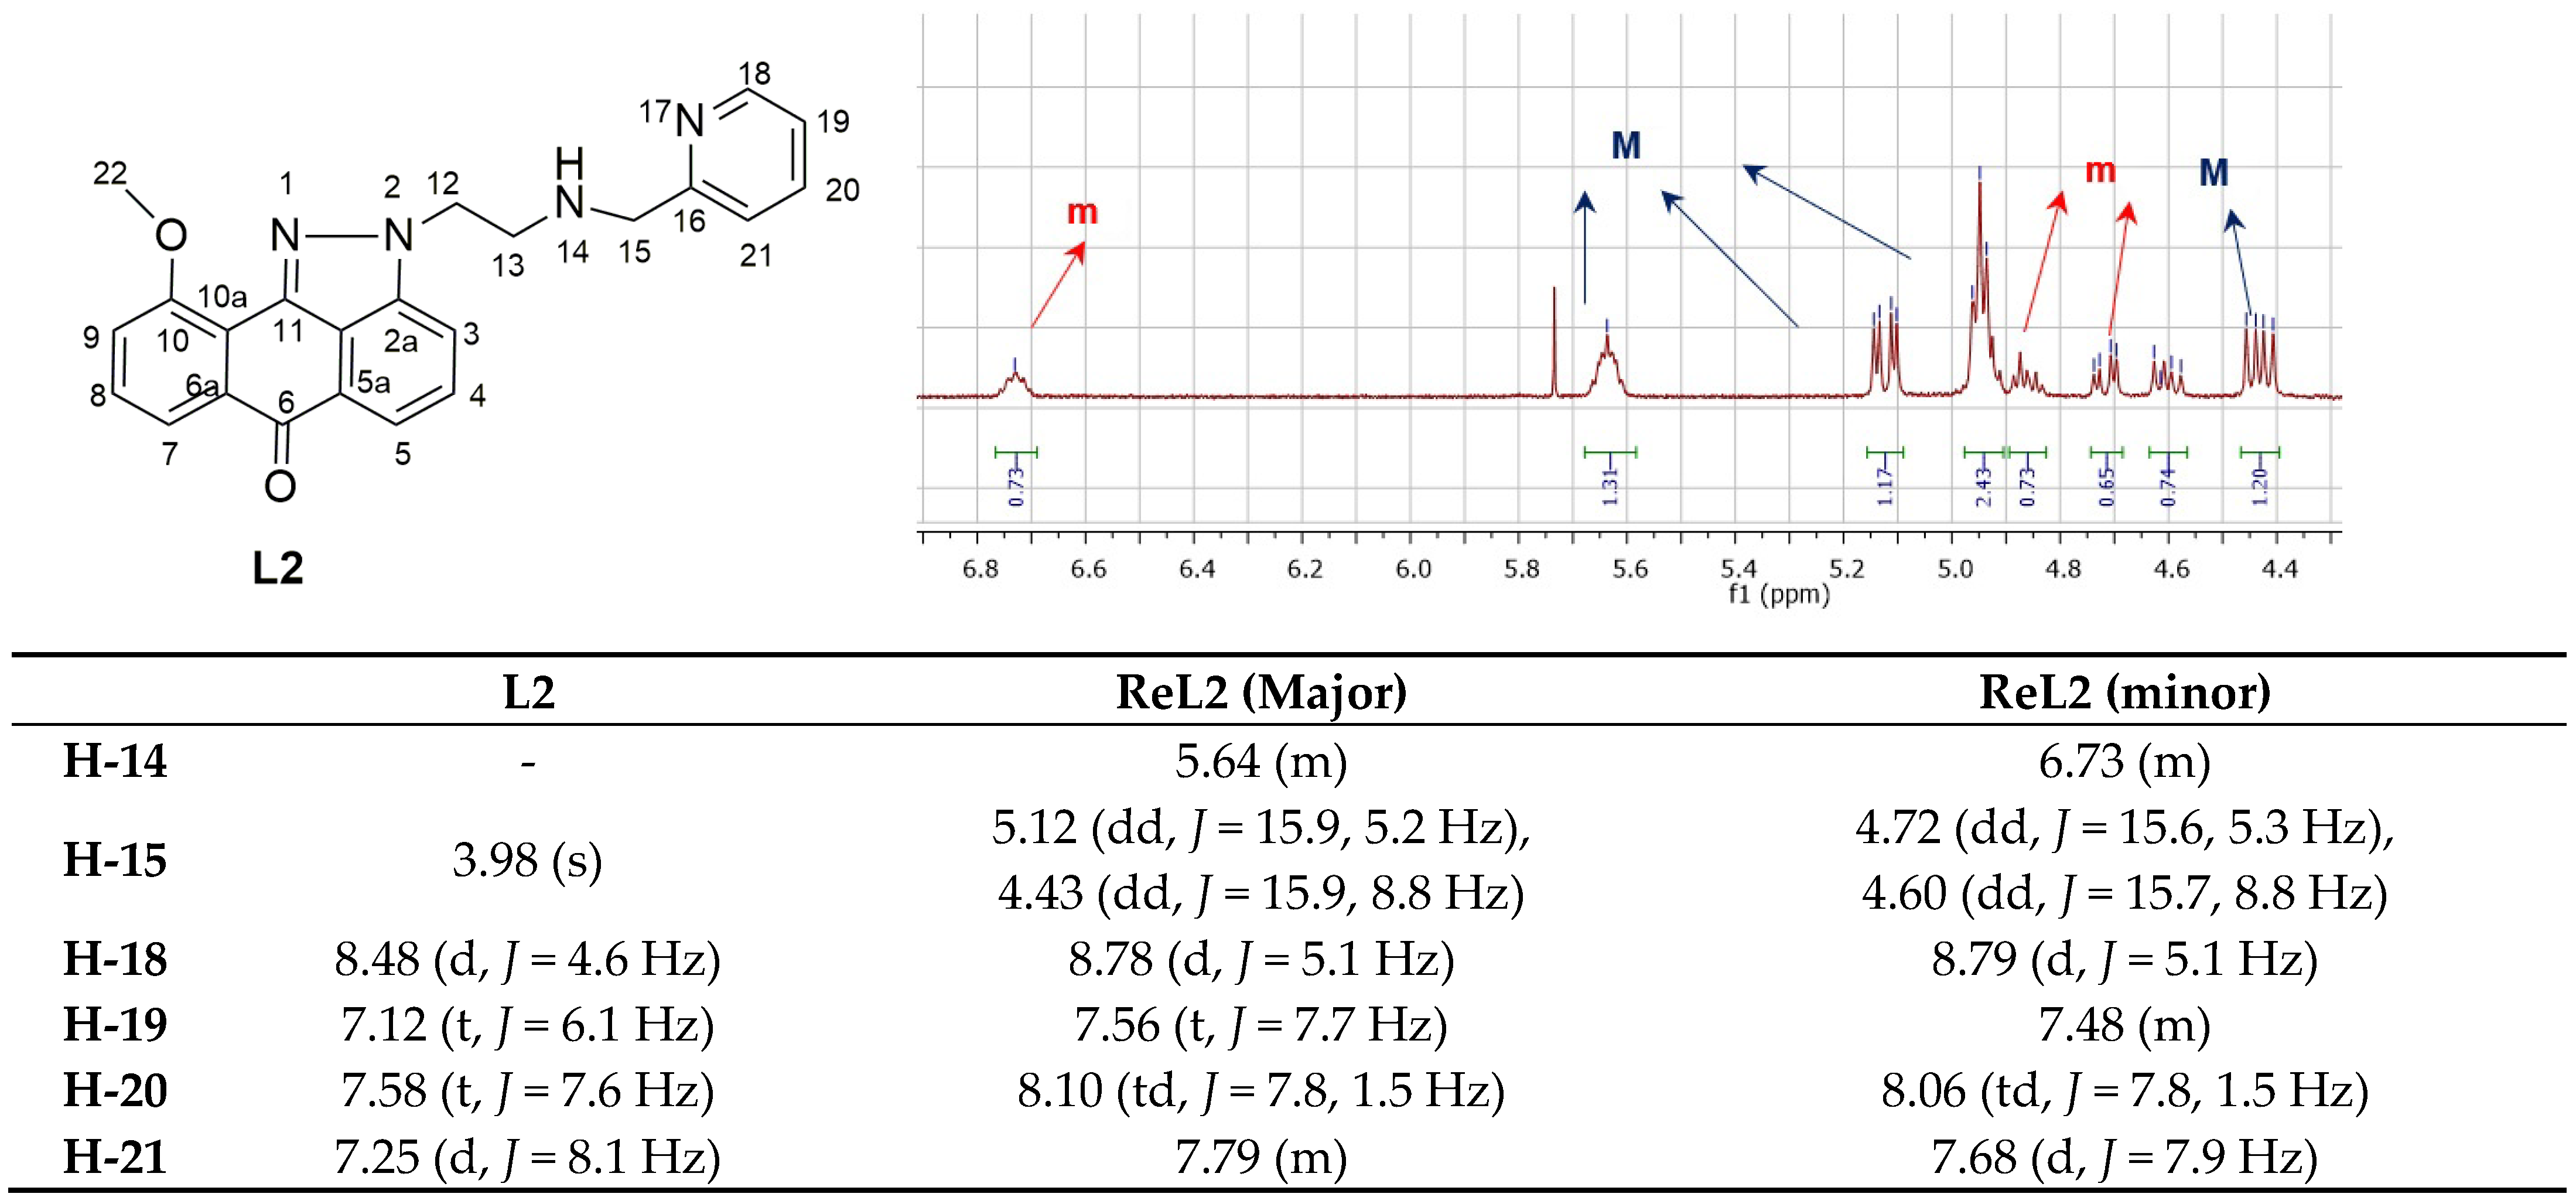
2.1. Synthesis and Spectroscopic Characterization of Rhenium Complexes

Synthesis of the ligands L1, L2 and L3 followed the route depicted in Scheme 1. The intermediate compound 3 was synthesized according to methods reported in the literature for similar anthraquinones [24].
The bidentate ligand L1 was prepared after the demethylation of 3 with BBr3. L1 offers a bidentate N,O-donor system for direct complexation of the phenolic O and pyrazole N with tricarbonylrhenium. The complex was prepared by reaction of L1 with equimolar amounts of the precursor [Re(CO)5Br] in refluxing methanol for 24 h. The product was isolated by column chromatography as a red solid in average yield. The NMR analysis of the complex and the free ligand shows analogous proton and carbon signals, where in the 1H-NMR spectrum of the complex, the phenolic proton signal of L1 at 9.87 ppm is absent, and in the 13C-NMR spectrum, the carbon of the C=N pyrazole ring is downfield-shifted to 160.30 ppm versus 154.43 ppm of L1. Furthermore, three CO carbons of the tricarbonylrhenium core appear at 197.89, 197.35 and 196.83 ppm. These NMR signals indicate the N,O-coordination of the metal core. The IR spectrum of the complex exhibits the characteristic bands of the ligand and a CO stretch at 2025, 1930 and 1900 cm−1 of the asymmetric tricarbonylrhenium core. High-resolution mass analysis revealed a signal that corresponded to negative molecular ions at m/z 579.0101 (60%) and 581.0139 (100%) for a [M−H]- pattern that matches the calculated values for M = C20H15N2O7Re and corresponds to the formula fac-[Re(CO)3(κ2-L1)(MeOH)], as shown in Figure 1.
Ligands L2 and L3 were synthesized after the mesylation of the intermediate compound 3 and reaction of the mesylate compound 4 with the bidentate chelator 2-picolylamine to form L2 or the tridentate chelator ethyl 2-((pyridin-2-ylmethyl)amino)acetate to form L3. These ligands were designed as part of the pendant approach, where metal complexation takes place with donor atoms that do not belong to the anthrapyrazole moiety.
L2 offers a bidentate N,N′-donor system from 2-picolylamine moiety for complexation with tricarbonylrhenium. The complex was prepared by reaction of L2 with equimolar amounts of the precursor [Re(CO)5Br] in refluxing methanol for 3 h. The product precipitated from the reaction mixture as a yellow solid in average yield. The NMR analysis of the complex shows the presence of two diastereomers due to the pseudooctahedral rhenium coordination and the prochiral secondary amine nitrogen donor. The ratio of the isomers is approximately 60:40, based on NMR and HPLC integration of the signals. In the 1H-NMR spectrum of the complex, differences in the shifts of the two isomers were detected, some of which are shown in Figure 2. In particular, both isomers exhibit the characteristic pattern of (N,N’) coordination due to picolylamine fragment, where the 2 protons of H-15 are split in two dd signals; in addition, the N-H can be observed at 5.64 and 6.73 ppm, respectively.
In the 13C-NMR spectrum, the CO signals of the tricarbonylrhenium core exhibit shifts at 197.89, 197.35 and 196.83 ppm. The IR spectrum of the complex exhibits the characteristic bands of the ligand and in addition the CO stretch at 2021, 1909 and 1867 cm−1 of the asymmetric tricarbonylrhenium core. The NMR and IR signals are in agreement with a fac-[Re(CO)3(N,N′)Br] coordination mode. Furthermore, the high-resolution mass analysis revealed a signals that correspond to positive molecular ions [M − Br + DMSO]+ at m/z 731.0995 (60%), 733.1125 (100%). Diastereomeric tricarbonylrhenium complexes have been synthesized previously by our group and others in the literature [25,26,27,28].
L3 offers a tridentate N,N′,O-donor system of 2-((pyridin-2-ylmethyl)amino)acetate moiety for complexation with tricarbonylrhenium. The complex was prepared by reaction of L3 with equimolar amounts of the precursor fac-[Re(CO)3(MeOH)3](OTf) in refluxing methanol for 24 h. The product was isolated by precipitation from methanol as a yellow solid in average yield. The NMR analysis of the complex and the free ligand shows analogous proton and carbon signals, where in the 1H-NMR spectrum of the complex the characteristic pattern of this N,N′,O-coordination is evident as the methylene protons next to pyridine appear two doublets at 4.85 ppm (J = 15.7 Hz) and 3.59 ppm (J = 16.6 Hz), respectively, and the acetate protons appear as two doublets at 4.28 ppm (J = 13.8 Hz) and 4.16 ppm (J = 13.3 Hz), respectively. Furthermore, in the 13C-NMR spectrum, the CO carbons of the tricarbonylrhenium core appear at 198.00 and 197.34 ppm. These NMR signals indicate the [N,N′,O] coordination of the metal core. The IR spectrum of the complex exhibits the characteristic bands of the ligand, with the exception of the carboxylate ester stretch at 1737 cm−1 of the ligand and in addition the CO stretch at 2023, 1912 and 1870 cm−1 of the asymmetric tricarbonylrhenium core. High-resolution mass analysis revealed a signal that corresponds to positive molecular ions at m/z 711.1006 (60%) and 713.1050 (100%) for an [M + H]+ pattern that matches the calculated values for M = C28H21N4O7Re and corresponds to the formula fac-[Re(CO)3(κ3-L3)], as shown in Figure 1.
Complex fac-[Re(CO)3Br(L4)] (Figure 3) was synthesized from L4 (synthesis is reported in Supplementary File, ESI: 1. Synthesis of Ligand L4) under the same conditions employed for ReL2 and was used as a model compound to corroborate the coordination mode of ReL2, which also contains a picolylamine chelator and shares the same coordination mode of fac-[Re(CO)3(κ2-N,N′)Br]. The complex was crystallized, and its structure was solved by X-ray crystallography. The IR and NMR characterization of ReL4 shows similar spectroscopic data with ReL2 such as the stretching frequencies of the carbon monoxide coordinated to Re(I), which is 2021, 1913, 1875 cm−1 for ReL4 vs. 2021, 1909, 1867 of ReL2. In the 13C-NMR spectrum, the CO signals of the tricarbonylrhenium core of ReL4 exhibit shifts at 196.40, 195.47, 191.60 ppm, similar to those of ReL2, indicating that the coordination of the two complexes is the same.

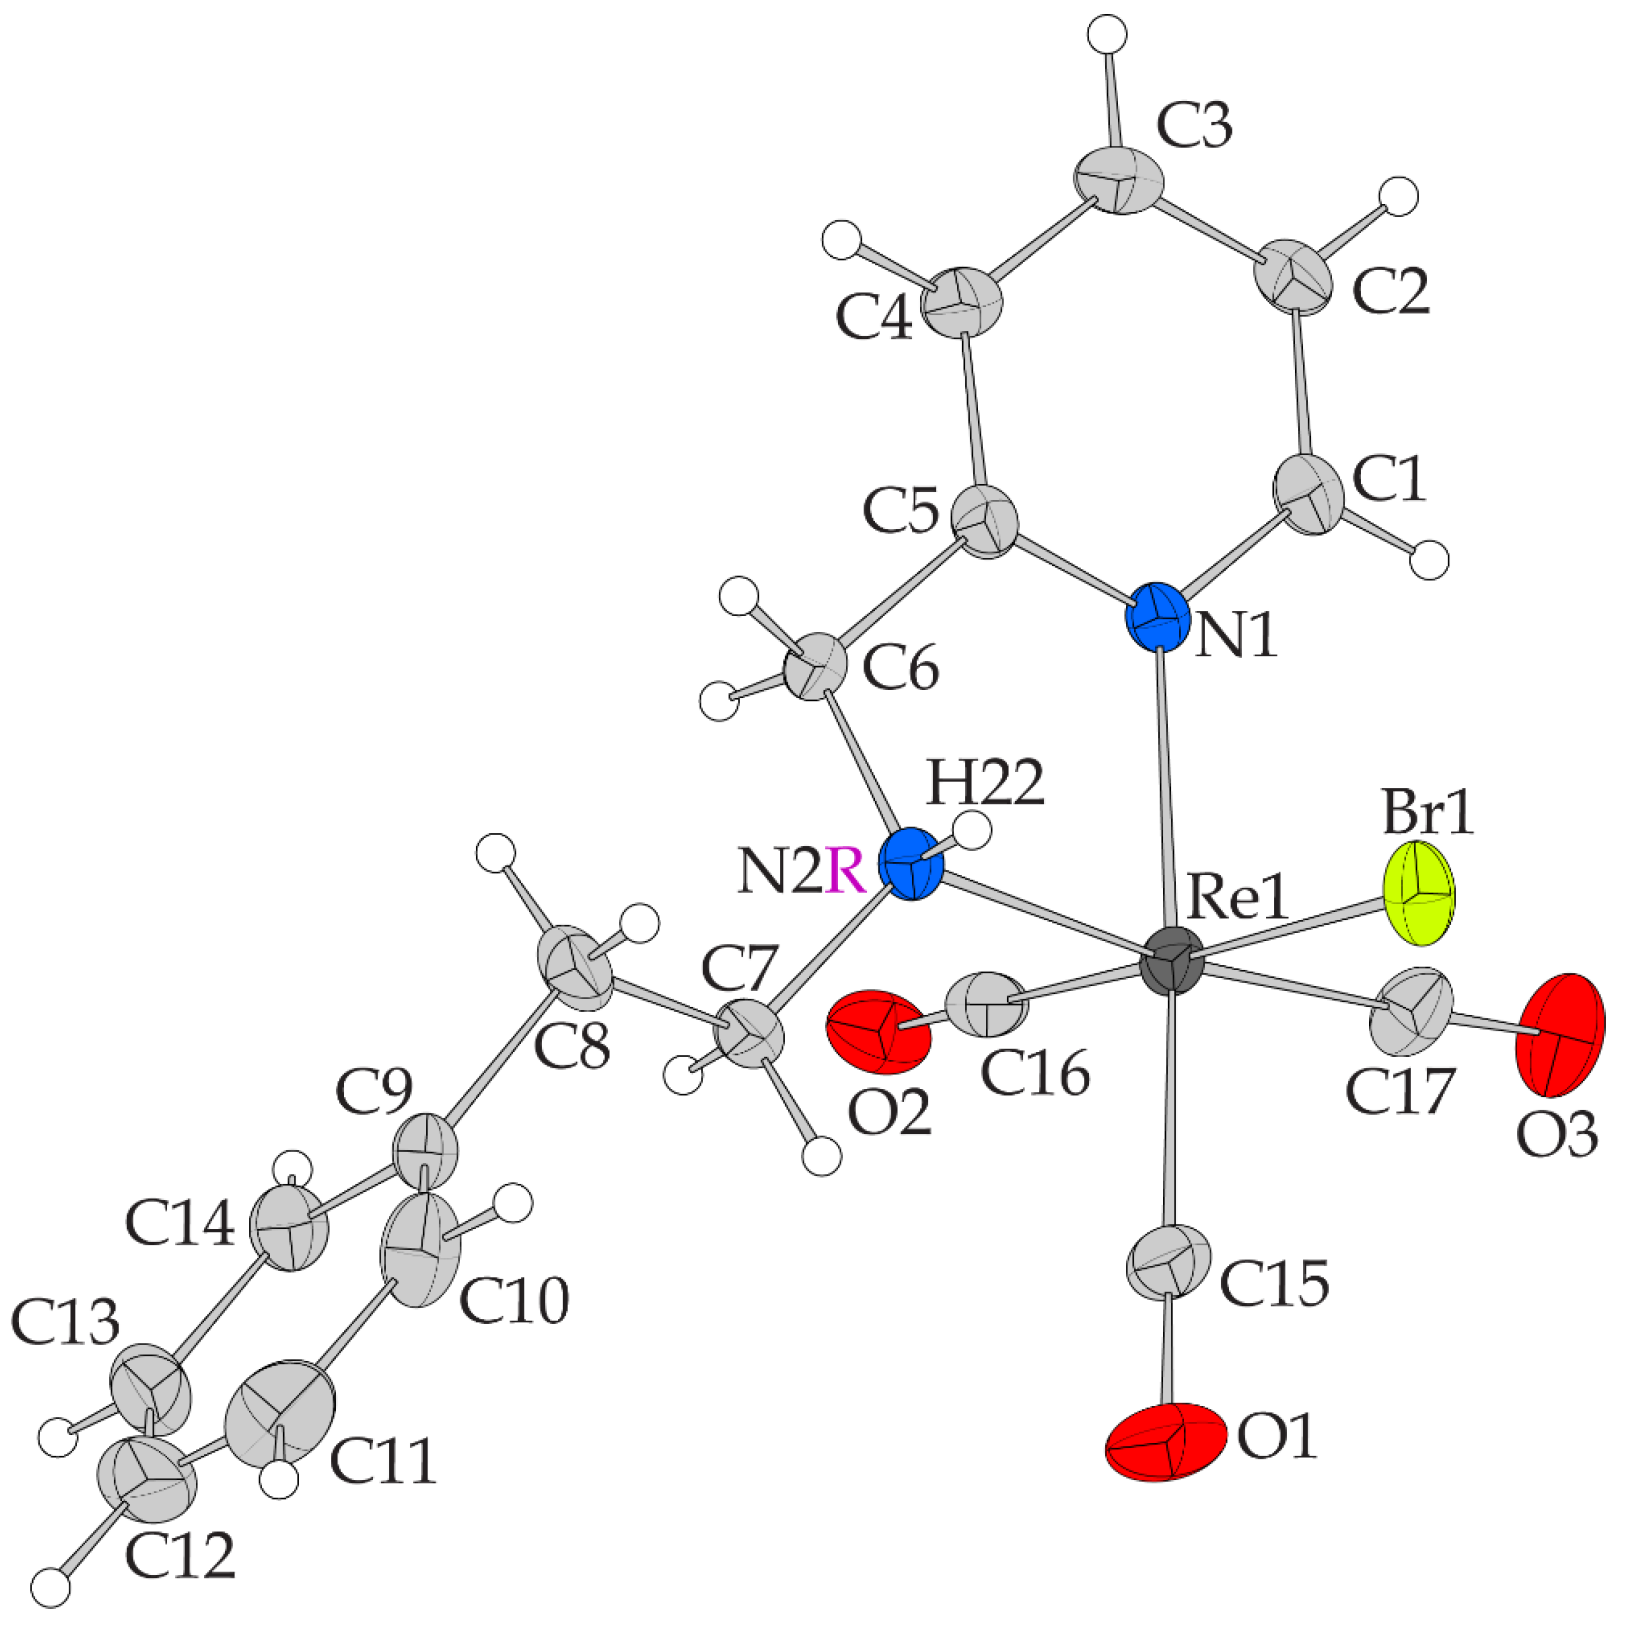
2.2. X-ray-Structure

A plot of the molecular structure of complex fac-[Re(CO)3Br(L4)] is depicted in Figure 3, and bond distances and angles are shown in Table 1. The compound crystallizes in the monoclinic space group P21/c, and four neutral independent complex molecules can be found in the unit cell. The complex is mononuclear, and the coordination geometry is distorted octahedral. L4 behaves as a bidentate ligand coordinated to rhenium(I) via the aromatic nitrogen atom N(1) and the amine nitrogen atom N(2), forming a five–membered chelate ring. Additionally, three carbon monoxide molecules are coordinated to Re(I) via the carbon atoms C(15), C(16), C(17) in facial orientation. The total coordination number of 6 is completed with the coordination of the bromine anion Br(1). The complex presents chirality on N(2) and from the four symmetrically equivalent molecules present in the unit cell, two of them are R type enantiomers, while the rest two are S conformers. In the ESI, we give both the cif files of the enantiomers and the plots of these isomers for comparison (S conformer Figure S1). The bond distances and angles of complex fac-[Re(CO)3Br(L4)] are similar to those found in other structures of rhenium(I)-tricarbonyl halide complexes coordinated to bidentate (N,N) donor ligands and forming five-membered ring, such as N,N′-bipyridine, pyridylimine and pyridylamine ligands [29,30,31,32].
In order to compare the distortion of the coordination octahedron of fac-[Re(CO)3Br(L4)] with the reported analog [Re(CO)3Br(L)] complexes, we used Octadist software version 3.1.0 [33] to compute the values of ζ and Σ (=deviations of the metal ion complex from an ideal octahedral structure) and Θ (=distortion from a perfect octahedral (Oh) to a trigonal prismatic (D3h) geometry). The parameter ζ is the average of the sum of the deviation of six unique metal–ligand bond lengths around the central metal atom (di) from the average value (dmean). The parameter Σ is the sum of the deviation of 12 unique cis ligand–metal–ligand angles (ϕi) from 90°. The parameter Θ is defined as the degree of trigonal distortion of the coordination geometry from an octahedron towards a trigonal prism. The Θ parameter is the sum of the deviation of 24 unique torsional angles between the ligand atoms on opposite triangular faces of the octahedron viewed along the pseudo-threefold axis (θi) from 60°. Comparison results are included in Table S1. From these results, it is concluded that [Re(CO)3Br(L4)] presents nearly the same coordination parameters and distortion with the analog octahedral complexes already published. The pyridine rings of neighboring complexes have a centroid-to-centroid distance of 3.986 Å indicating weak π–π interactions present in the crystal structure of [Re(CO)3Br(L4)], which give extra stability to the complex structure.

2.3. DNA-Binding Studies

The study of the interaction of anthrapyrazoles and their rhenium complexes with DNA is of great interest due to their ability to act as DNA intercalators. Interactions between a compound and CT DNA may cause changes to the absorption bands upon addition of CT DNA in various ratios (r) values (=[compound]/[DNA]). The UV–vis spectra of the anthrapyrazoles and their complexes in DMSO in the presence of increasing amounts of CT DNA are shown in Figure 4 and Figure S2. The UV–vis spectra of the compounds exhibited similar changes of the intraligand absorption band after the addition of a CT DNA solution, such as hypochromism up to 20%, as well as, in few cases, a red-shift (Table 2). The DNA-binding constants (Kb) of the complexes calculated by the Wolfe–Shimer equation [34] (Equation (1)) and plots [DNA]/(εA−εf) versus [DNA] (Figure S3) are similar to that of the corresponding free anthrapyrazoles (Table 2), except ReL3 complex, which exhibited much higher Kb than L3, suggesting that its coordination to Re(I) results in a significant increase in the affinity for CT DNA. The Kb values suggest a strong binding of the anthrapyrazole ligands L1, L2 and L3 to CT DNA, which are similar to that of the classical intercalator EB (=1.23 (±0.07) × 105 M−1) [35]. The Kb value of complex ReL3 (=1.09 (±0.15) × 106 M−1) is the highest DNA-binding constant among the herein examined compounds. However, the results obtained from the UV–vis spectroscopic titration studies (hypochromism) do not provide sufficient information to elucidate the type of interaction between the anthrapyrazoles and their rhenium complexes with DNA, and additional experiments are required to clarify the binding mode [24].
Viscosity measurements were performed by the addition of increasing amounts of the anthrapyrazoles and their rhenium complexes on a CT DNA solution (10−4 M). The relative DNA viscosity (η/η0) is sensitive to DNA length (L/L0), and their relation is expressed by the equation L/L0 = (η/η0)1/3 [36]. This study provides important information on the DNA-interaction mode of a tested compound by monitoring changes in DNA viscosity in the presence of a compound. During intercalation, the DNA bases are separated to host the intercalator, which leads to the elongation of DNA and increased DNA viscosity. In the case of partial and/or non-classic intercalation (e.g., groove-binding or electrostatic interaction), the compounds do not enter in-between the DNA bases, and a bend or a kink in the DNA helix may occur, which does not significantly affect the DNA length, and the DNA viscosity remains practically unchanged or may even show a slight decrease. In the viscosity measurement, all the compounds resulted in a relative increase in the DNA viscosity (Figure 5). Such results indicate the insertion of the compounds between the DNA bases due to an intercalative interaction.
The EB-displacing ability of the compounds by interaction with EB–DNA is considered to be useful in verifying the intercalation of a compound with DNA. EB is a typical intercalator, where the planar EB–phenanthridinium ring is inserted between adjacent base pairs on the double helix. The EB–DNA complex emits intense fluorescence at 592 nm (with λexitation = 540 nm), which may be quenched by a DNA-intercalating compound which competes with EB for DNA intercalation and is therefore used as a fluorescence dye [37].
The ligands and the rhenium complexes did not exhibit significant fluorescence in the presence of CT DNA and EB at 540 nm excitation; therefore, the complexes can be used as EB competitors in this study. The fluorescence emission spectra of pre-treated EB–CT DNA were obtained for [EB] = 20 μM, [DNA] = 26 μM and for increasing amounts of the compounds (up to r = 0.04) (shown in Figure 6 and Figure S4). The addition of increasing amounts of the ligands and rhenium complexes resulted in a substantial decrease in the intensity of the emission band of the DNA–EB complex at 592 nm (the fluorescence intensity in the highest competitor concentration was up to 43.5% of the initial EB–DNA fluorescence one, Table 3). Therefore, the tested compounds exhibited EB-displacing ability by competing with EB in binding to DNA (Figure 6B), proving thus, indirectly, their interaction with CT DNA via intercalation [38]. As seen from the Stern–Volmer plots of EB–DNA fluorescence studies in the presence of the competitors (Figure S5), the quenching of EB–DNA by the compounds is in agreement (R = 0.99) with the linear Stern–Volmer equation (Equation (2)), which proves the displacement of EB from EB–DNA by the compounds [34]. The obtained values of KSV (Table 3) may show tight binding of the complexes to DNA. Since the fluorescence lifetime of EB–DNA (τ0) is 23 ns [39], the Kq values were calculated with Equation (3). All quenching constants are higher than 1010 M−1s−1, indicating the presence of a static quenching mechanism which reveals the formation of a new adduct between the studied complexes and DNA, indirectly confirming intercalation as the most possible mode of interaction [37].

2.4. In Vitro Cell Studies

The cytotoxicity of the anthrapyrazole ligands L1, L2 and L3, as well as that of the respective rhenium complexes ReL1, ReL2 and ReL3, was assessed in vitro in colorectal adenocarcinoma cells CT26. The anthrapyrazole ligands L1, L2, L3 and their rhenium complexes ReL1, ReL2 and ReL3 were incubated at 10−5 M concentration with the cells. Compounds L2 and ReL2 affected cell viability, exhibiting in average 82.55 ± 1.19 and 98.61 ± 0.85% decrease in cell proliferation and 83.92 ± 1.66 and 79.46 ± 1.35% cell death (Figure 7). Τhe other four compounds tested (L1, L3, ReL1, ReL3) resulted in no significant cytotoxicity or cell death after incubation with the cells in this concentration. The most cytotoxic compounds L2 and ReL2 were tested at lower concentrations up to 10−7 M, and the IC50 was calculated to be 0.36 μM for L2 and 0.64 μM for ReL2 (Figure S6). The cytotoxicity of these compounds is in the same range as for other standard cytotoxic agents from the literature, such as doxorubicin and cisplatin [40,41]. The fact that ligands L1 and L3 are not active in this concentration range is clearly attributed to their structure. By comparison to anthrapyrazoles and similar compounds in the literature, it is evident that the pyrazole nitrogen substitution is important for its cytotoxicity [24,42,43,44], while both losoxantrone and mitoxantrone clinical agents contain -NCH2CH2NHCH2CH2OH moieties.

2.5. Radiotracer Studies

Technetium-99m (99mTc) is a γ-emitting radionuclide with excellent physical properties (t1/2: 6.01 h, 0.142 MeV). In addition, its low-cost commercial availability from 99Mo/99mTc generators makes it an efficient choice in nuclear medicine for SPECT imaging. Technetium and rhenium are considered congener metals, and usually, they form isostructural complexes with similar biological properties [45]. The first in vivo evaluation of the potential ability of ReL2 to be distributed to the tumor was conducted by preparing an analogous γ-emitting radiotracer, fac-[99mTc][Tc(CO)3(L2)(H2O)]+ (99mTcL2). Furthermore, in an effort to explain the low biological activity of the complex ReL3, we prepared the analogous radiotracer 99mTcL3.
99mTcL2 and 99mTcL3 were synthesized by reaction of the aqua ion fac-[99mTc][Tc(CO)3(H2O)3]+ with 10−3 M of the ligand L2 or L3 for 30 min at 55–65 °C, with high radiochemical purity of >95%. 99mTcL2, tR = 19.2 min was identified by comparative RP-HPLC studies, using complexes [Re(CO)3(L2)Br] (ReL2), tR = 21.1/21.3 min and [Re(CO)3(L2)(MeOH)]+ (ReL2′) (which was formed from ReL2 by precipitation of bromide with silver salts) tR = 19.1 min as references (Figure S7). 99mTcL3, tR = 21.3 min and ReL3, tR = 21.4 min were identified. The lipophilicity value of the HPLC-purified 99mTcL2 was found to be 2.45 ± 0.06, and that of 99mTcL3 was found to be 2.27 ± 0.12, which indicates that the complexes could penetrate cell membranes and be distributed across various tissues and organs. The stability of 99mTcL2 was tested after incubation with 1 mM histidine and rat plasma, and the percentage of intact tracer was found to be 95% at 4 h in histidine and 82% at 4 h in rat plasma, where it exhibited 54% protein binding. Respectively, 99mTcL3 was 93% stable in histidine and 95% stable in rat plasma (with low protein binding of 16.4%) at 4 h.
The cellular uptake of tracer 99mTcL2 and 99mTcL3 was performed in CT26 cells over 240 min. 99mTcL2 exhibited a time-dependent increase in cell uptake reaching 5.42 ± 0.19% cells at 240 min after incubation. 99mTcL3 exhibited low cell uptake. In detail, Table 4 shows the results obtained:
Biodistribution studies were performed in CT26 tumor-bearing mice at time points of 30 and 120 min post intravenous injection of 99mTcL2 (Table 5). The radiotracer 99mTcL2 exhibited hepatobiliary and renal elimination, while the percentage of radioactivity in the blood was 4.16 ± 1.31% ID/g at 120 min. The tumor uptake of 99mTcL2 was 2.42 ± 0.04 and 3.10 ± 1.21% ID/g at 30 and 120 min, respectively, which shows retention of the tracer in the tumor up to 2 h.

3. Materials and Methods

3.1. General

All chemicals were reagent-grade. For the chromatographic purifications, Silica gel 60 (0.040–0.063 mm) from Merck (Darmstadt, Germany) was used. The precursors [Re(CO)5Br] and [Re(CO)5(OTf)] were prepared according to literature procedures [46,47]. For labeling with 99mTc, a vial containing 5.5 mg of NaBH4, 4 mg of Na2CO3, and 15 mg of Na-K tartrate was purged with CO gas prior to addition of Na99mTcO4, as described in the literature [48]. Solvents used for high-performance liquid chromatography (HPLC) were HPLC-grade, and solvents used for mass spectroscopy (MS) were MS-grade. To prepare the HPLC mobile phase, the solvents were filtered through membrane filters (0.22 μm, Millipore, Milford, MA, USA) and degassed. UV–visible (UV–vis) spectra were recorded on a Hitachi U-2001 (Hitachi, Tokyo, Japan) dual beam spectrophotometer. C, H and N elemental analysis were performed on a Perkin-Elmer 240B elemental analyzer (Perkin Elmer, Waltham, MA, USA). Fluorescence spectra were recorded in solution on a Hitachi F-7000 (Hitachi, Tokyo, Japan) fluorescence spectrophotometer. Viscosity experiments were carried out using an ALPHA L Fungilab (Barcelona, Spain) rotational viscometer equipped with an 18 mL LCP spindle and the measurements were performed at 100 rpm. The ESI-HRMS spectra were recorded on an Agilent Q-TOF Mass Spectrometer, G6540B model with Dual AJS ESI-MS (Santa Clara, CA, USA). IR spectra were recorded on a Spectrum BX spectrophotometer (Perkin Elmer, Waltham, MA, USA) in the region 4000–500 cm−1. NMR spectra were recorded on a DD2 500 MHz spectrometer (Agilent, Santa Clara, CA, USA), respectively. The HPLC system used comprised an Agilent HP 1100 series pump (HP, Waldbronn, Germany), connected to a Gabi gamma detector (Raytest, Straubenhardt, Germany) and an HP 1100 multiple wavelength detector. RP-HPLC analyses of the rhenium and technetium-99m complexes were performed using an Agilent Eclipse XDB C18 column (25 cm × 4.6 mm, 5 μm) by applying a binary gradient method of Solvent A: H2O—0.1% TFA and Solvent B: Methanol. The flow rate was set at 1 mL/min, and the composition was as follows: (min, A%, B%); (0, 100, 0); (15, 25, 75); (20, 5, 95); (25, 5, 95); (27, 100, 0); (30, 100, 0).
Calf thymus (CT) DNA (Merck, Darmstadt, Germany) was diluted in buffer (consisting of 15 mM trisodium citrate and 150 mM NaCl at pH 7.0) followed by continuous stirring for three days for the preparation of the DNA stock solution, which was kept at 4 °C for up to a week. The ratio of UV absorbance of the CT DNA stock solution at 260 and 280 nm (A260/A280) was measured to be 1.85, indicating that it was free of protein contamination [49]. The DNA concentration was determined by the UV absorbance at 260 nm after 1:20 dilution using ε = 6600 M−1cm−1 [50].
CAUTION! 99mTc is a gamma (γ)-emitter with nuclear properties of t1/2 = 6 h and γ-energy, 140 keV). Its handling was performed according to Greek legislation and the EU regulations (2013/59/Euratom). 99mTc was obtained as sodium pertechnetate in sterile saline from a commercial 99Mo/99mTc generator (AHEPA General Hospital, Thessaloniki, Greece).

3.2. Syntheses

1-Τosyl-8-methoxy-9,10-anthraquinone (2): 1,8-dihydoxy-anthraquinone (240 mg, 1 mmol) and potassium carbonate (138 mg, 1 mmol) were dissolved in dry acetone (50 mL). To this solution, dimethyl sulfate (130 μL, 1.3 mmol) was added dropwise, and the mixture was refluxed for 24 h. Then, sulfuric acid 0.1 M (5 mL) was added, and the mixture was concentrated to dryness under vacuum, followed by the addition of distilled water (300 mL). The precipitate that contained 1-hydroxy-8-methoxy-9,10-anthraquinone was isolated through filtration under vacuum, and the crude product was purified by silica gel (15 g) column chromatography with petroleum ether:ethyl acetate, 90:10–80:20, to afford a yellow solid. Yield: 120 mg, 47.2%. Rf: (SiO2, petroleum ether:ethyl acetate, 9:1) 0.62. 1H NMR (500 MHz, CDCl3, ppm) δ: 12.99 (s, 1H), 7.97 (d, J = 7.7 Hz, 1H), 7.79–7.72 (m, 2H), 7.62 (t, J = 7.9 Hz, 1H), 7.37 (d, J = 8.5 Hz, 1H), 7.29 (d, J = 8.4 Hz, 1H), 4.08 (s, 3H). Then, 1-hydroxy-8-methoxy-9,10-anthraquinone (3 g, 11.8 mmol), potassium carbonate (1.63 g, 11.8 mmol) and p-toluenesulfonyl chloride (4.6 g, 24 mmol) were mixed in dry acetone (300 mL). The mixture was refluxed for 72 h. A brown solid formed, which was filtered under vacuum and dried. Yield: 2.2 g, 45.7%. Rf: (SiO2, petroleum ether:ethyl acetate, 7:3) 0.5. m.p. 190–193 °C [24]. 1H NMR (500 MHz, CDCl3, ppm) δ: 8.17 (dd, J = 7.7, 1.2 Hz, 1H), 7.87 (d, J = 8.3 Hz, 2H), 7.83 (dd, J = 7.6, 0.7 Hz, 1H), 7.66 (t, J = 8.0 Hz, 2H), 7.57 (dd, J = 8.1, 1.1 Hz, 1H), 7.30 (t, J = 8.9 Hz, 3H), 4.02 (s, 3H), 2.38 (s, 3H). 13C NMR (126 MHz, CDCl3, ppm) δ: 197.22, 187.33, 182.69, 180.65, 159.56, 146.91, 145.36, 134.65, 134.59, 134.47, 133.29, 132.40, 129.98, 129.59, 129.16, 128.91, 125.76, 123.23, 119.17, 118.26, 56.65, 21.68. ESI-HRMS (m/z): Calc. for Μ = C22H16SO6: 409.0740 [M + H]+, 431.0560 [M + Na]+; Found: 409.0726 [M + H]+, 431.0566 [M + Na]+.
2-(2-Hydroxyethyl)-10-methoxy-anthra [1,9-cd]pyrazol-6(2H)-one (3): Compound 2 (200 mg, 0.49 mmol) and 2-hydroxyethylhydrazine (168 μL, 2.47 mmol) were dissolved in anhydrous Ν,Ν-dimethylformamide (DMF) (10 mL). The mixture was heated at 130 °C, under nitrogen, for 4 h. The reaction mixture was partitioned between ethyl acetate (50 mL) and water (50 mL), and the organic phase was collected and concentrated to dryness. The crude product was purified by silica gel column chromatography (60 g) with ethyl acetate:petroleum ether, starting with 70:30 up to 90:10, to afford a yellow solid. Yield: 36 mg, 25%. Rf: (SiO2, ethyl acetate:petroleum ether, 9:1) 0.01. m.p. 245–248 °C [8]. 1H NMR (500 MHz, CDCl3, ppm) δ: 8.11 (d, J = 7.8 Hz, 1H), 8.03 (d, J = 7.1 Hz, 1H), 7.76 (d, J = 8.2 Hz, 1H), 7.66 (t, J = 7.7 Hz, 1H), 7.51 (t, J = 8.0 Hz, 1H), 7.28 (d, J = 5.4 Hz, 1H), 4.68 (t, J = 4.8 Hz, 2H), 4.27 (t, J = 4.8 Hz, 2H), 4.12 (s, 3H). 13C NMR (126 MHz, d6-DMSO, ppm) δ: 183.01, 156.40, 139.46, 136.47, 134.31, 129.09, 128.28, 125.28, 123.38, 121.07, 120.97, 120.44, 117.40, 116.83, 60.92, 56.62, 52.71. ESI-HRMS (m/z): Calc. for M=C17H14N2O3: 295.1077 [Μ + H]+, 317.0897 [M + Na]+; Found: 295.1083 [M + H]+, 317.0897 [M + Na]+.
2-(2-Hydroxyethyl)-10-hydroxy-anthra [1,9-cd]pyrazol-6(2H)-one (L1): Compound 3 (260 mg, 0.88 mmol) was dissolved in anhydrous dichloromethane (50 mL) and was stirred at −10 °C. To this solution, boron tribromide 1 M (5.85 mL, 5.2 mmol) in dichloromethane was added dropwise, under nitrogen, for 1 h. The mixture was then stirred at rt (25 °C) for 24 h. Then, distilled water was added (50 mL) dropwise at −10 °C, for 1 h. The reaction mixture was partitioned between aqueous NaHCO3 1 M (50 mL) and dichloromethane (50 mL) and the organic phase was collected and concentrated to dryness. The crude product was washed three times with dichloromethane (3 × 10 mL), and a brown solid formed, which was filtered and dried. Yield: 160 mg, 65%. RP-HPLC retention time (tR): 18.2 min. Rf: (SiO2, ethyl acetate) 0.38. m.p. 190–193 °C. IR (cm−1, KBr): 3406, 3076, 2934, 1636, 1593, 1459, 1396, 1351, 1282, 1262. 1H NMR (500 MHz, d6-DMSO, ppm) δ: 9.87 (s, 1H), 8.11 (d, J = 8.2 Hz, 1H), 7.94 (d, J = 7.1 Hz, 1H), 7.85 (d, J = 7.6 Hz, 1H), 7.75 (t, J = 7.6 Hz, 1H), 7.44 (t, J = 7.9 Hz, 1H), 7.35 (d, J = 7.9 Hz, 1H), 4.97 (br, 1H), 4.66 (t, J = 5.3 Hz, 2H), 3.92 (t, J = 5.3 Hz, 2H). 13C NMR (126 MHz, d6-DMSO, ppm) δ: 183.21, 154.43, 139.40, 137.17, 134.26, 129.19, 128.71, 125.56, 122.95, 121.11, 120.49, 120.31, 118.67, 117.37, 60.87, 52.68. ESI-HRMS (m/z): Calc. for Μ=C16H12N2O3: 279.0775 [M−H], 248.0580 [M−CH3OH]; Found: 279.0658 [M−H], 248.0489 [M−CH3OH].
2-(2-Μethylsulfonylethyl)-10-methoxy-anthra [1,9-cd]pyrazol-6(2H)-one (4): Compound 3 (250 mg, 0.85 mmol) and triethylamine (840 μL, 5.9 mmol) were dissolved in anhydrous dichloromethane (50 mL). To this solution, methanesulfonyl chloride (490 μL, 5.9 mmol) in dry dichloromethane (5 mL) was added dropwise at −10 °C, under nitrogen, for 30 min. The mixture was stirred at 25 °C, under nitrogen, for 4 h. The reaction mixture was concentrated to dryness under vacuum and was extracted between distilled water (50 mL) and ethyl acetate (50 mL). The organic phase was concentrated to dryness under vacuum, to afford a yellow solid. Yield: 317 mg, 85%. Rf: (SiO2, ethyl acetate) 0.26. m.p. 155–158 °C. 1H NMR (500 MHz, CDCl3, ppm) δ: 8.14 (d, J = 7.8 Hz, 1H), 8.08 (d, J = 7.1 Hz, 1H), 7.81 (d, J = 8.2 Hz, 1H), 7.70 (t, J = 7.7 Hz, 1H), 7.53 (t, J = 8.0 Hz, 1H), 7.32 (d, J = 8.2 Hz, 1H), 4.92 (t, J = 5.1 Hz, 2H), 4.81 (t, J = 5.1 Hz, 2H), 4.14 (s, 3H), 2.80 (s, 3H). 13C NMR (126 MHz, CDCl3, ppm) δ (ppm): 182.93, 156.40, 138.95, 138.01, 134.79, 129.80, 129.51, 126.26, 123.38, 121.77, 121.46, 119.48, 115.87, 115.15, 68.16, 56.45, 48.92, 37.42. ESI-HRMS (m/z): Calc. for M=C18H16N2SO5: 373.0853 [M + H]+, 395.0672 [M + Na]+. Found: 373.0850 [M + H]+, 395.0666 [M + Na]+.
2-(2-Picolylaminolethyl)-10-methoxy-anthra [1,9-cd]pyrazol-6(2H)-one (L2): Compound 4 (290 mg, 0.75 mmol) and 2-(aminomethyl)pyridine (1.48 mL, 15 mmol) were dissolved in anhydrous methanol (70 mL), and the mixture was refluxed for 24 h. The reaction mixture was concentrated to dryness under vacuum and extracted in ethyl acetate–water (3 × 50 mL). The organic phase was concentrated to dryness under vacuum. The crude product was purified by silica gel (20 g) column chromatography with dichloromethane:methanol, 95:5, to afford a brown oil. Yield: 110 mg, 39%. tR: 16.4 min. Rf: (SiO2, dichloromethane:methanol, 9:1) 0.18. IR (cm−1, KBr): 3451, 1639, 1578, 1455, 1281, 1270. 1H NMR (500 MHz, CDCl3, ppm) δ: 8.48 (d, J = 4.6 Hz, 1H), 8.12 (d, J = 7.9 Hz, 1H), 8.04 (d, J = 7.2 Hz, 1H), 7.76 (d, J = 8.2 Hz, 1H), 7.63 (t, J = 7.7 Hz, 1H), 7.58 (t, J = 7.6 Hz, 1H), 7.48 (td, J = 8.1, 1.1 Hz, 1H), 7.28 (d, J = 8.2 Hz, 1H), 7.25 (d, J = 8.1 Hz, 1H), 7.12 (t, J = 6.2 Hz, 1H), 4.74 (t, J = 6.0 Hz, 2H), 4.09 (s, 3H), 3.98 (s, 2H), 3.34 (t, J = 5.8 Hz, 2H), 2.37 (s, 1H). 13C NMR (126 MHz, CDCl3, ppm) δ: 183.65, 159.02, 156.30, 149.24, 138.76, 137.78, 136.48, 134.81, 128.62, 128.06, 126.16, 124.00, 122.13, 122.06, 121.67, 121.06, 120.62, 115.71, 114.97, 56.46, 54.72, 49.86, 48.98. ESI-HRMS (m/z): Calc. for C23H20N4O2: 385.1659 [M + H]+ 407.1478 [M + Na]+. Found: 385.1640 [M + H]+, 407.1466 [M + Na]+.
Εthyl 2-((2-(10-methoxy-6-oxodibenzo[cd,g]indazol-2(6H)-yl)ethyl)(pyridin-2-ylmethyl)amino) acetate (L3): First, ethyl 2-((pyridin-2-ylmethyl)amino)acetate was prepared by a modification of the procedure published elsewhere [51]. Specifically, ethyl bromoacetate (1.67 g, 10 mmol), 2-(aminomethyl)pyridine (1.48 mL, 15 mmol) and potassium carbonate (4 g, 30 mmol) were dissolved in dry acetonitrile (200 mL). The mixture was refluxed for 1 h. The reaction mixture was filtered and concentrated to dryness under vacuum. The crude product was purified by silica gel (60 g) flash chromatography with dichloromethane:methanol: aqueous ammonia solution 10%, 90:10:0.1, to afford a brown oil. Yield: 1.3 g, 67%. Rf: (SiO2, dichloromethane:methanol: aqueous ammonia solution 10%, 9:1:0.1) 0.69. 1H NMR (500 MHz, CDCl3) δ (ppm): 8.56 (d, J = 4.2 Hz, 1H), 7.65 (td, J = 7.7, 1.8 Hz, 1H), 7.34 (t, J = 7.8 Hz, 1H), 7.19–7.14 (m, 1H), 4.18 (dq, J = 14.6, 7.1 Hz, 2H), 3.96 (s, 2H), 3.48 (s, 2H), 1.27 (t, J = 7.1 Hz, 3H).
Consequently, compound 4 (390 mg, 1.01 mmol) and ethyl 2-((pyridin-2-ylmethyl)amino)acetate (1.3 g, 6.7 mmol) were dissolved in dry methanol (100 mL). The mixture was refluxed, under nitrogen, for 72 h. The reaction mixture was concentrated to dryness under vacuum and extracted in ethyl acetate–water (3 × 50 mL). The organic phase was concentrated to dryness under vacuum. The crude product was purified by silica gel (60 g) column chromatography with dichloromethane:methanol, 98:2, to afford a brown oil. Yield: 160 mg, 34%. tR: 17.3 min. Rf: (SiO2, dichloromethane:methanol, 9:1) 0.55. IR (cm−1, KBr): 3451, 2936, 1737, 1647, 1455, 1290, 1270. 1H NMR (500 MHz, CDCl3, ppm) δ: 8.44 (d, J = 4.8 Hz, 1H), 8.12 (d, J = 7.8 Hz, 1H), 8.03 (d, J = 7.1 Hz, 1H), 7.69 (dd, J = 8.2, 2.0 Hz, 1H), 7.59 (t, J = 7.7 Hz, 1H), 7.48 (t, J = 8.0 Hz, 1H), 7.36 (m, 1H), 7.28 (d, J = 8.2 Hz, 1H), 7.08 (d, J = 7.8 Hz, 1H), 7.03 (m, 1H), 4.66 (t, J = 6.4 Hz, 2H), 4.13 (dd, J = 14.0, 6.8 Hz, 2H), 4.10 (s, 3H), 4.00 (d, J = 2.3 Hz, 2H), 3.51 (d, J = 2.7 Hz, 2H), 3.39 (t, J = 6.4 Hz, 2H), 1.22 (t, J = 7.1 Hz, 3H). 13C NMR (126 MHz, d6-DMSO, ppm) δ: 183.71, 171.18, 158.69, 156.22, 148.53, 138.63, 137.42, 136.65, 134.75, 128.55, 127.88, 126.01, 123.97, 123.06, 122.14, 121.65, 121.12, 120.52, 115.67, 115.26, 60.57, 56.48, 55.56, 53.92, 51.53, 48.81, 14.22. ESI-HRMS (m/z): Calc. for M=C27H26N4O4: 471.2027 [M + H]+, 493.1846 [M + Na]+. Found: 471.2032 [M + H]+, 493.1846 [M + Na]+.
Synthesis of ReL1: [Re(CO)5Br] (81.2 mg, 0.20 mmol) and L1 (56 mg, 0.20 mmol) were dissolved in methanol (40 mL), and the mixture was refluxed for 24 h. The mixture was concentrated to dryness under vacuum, followed by the addition of distilled water (10 mL). After 24 h, a precipitate was formed at room temperature and was isolated through filtration under vacuum. The crude product was purified by silica gel (60 g) column chromatography with dichloromethane:methanol, 98:2–90:10, to afford a red solid. Yield: 45 mg, 38.5%. tR: 18.8 min. Rf: (SiO2, dichloromethane:methanol, 9:1) 0.67. m.p. 249–252 °C. Calc. for C20H15N2O7Re: C, 41.31; H, 2.60; N, 4.82; Found: C 41.55; H 2.91; N 4.71. IR (cm−1, KBr): 3432 (O-H), 2936(C-H), 2025(CO), 1930(CO), 1900(CO), 1636 (C=O), 1566(C=N), 1459 (arom. C-C, C-N), 1282(C-O). 1H NMR (500 MHz, d6-DMSO, ppm) δ: 8.10 (d, J = 8.3 Hz, 1H), 7.95 (d, J = 7.0 Hz, 1H), 7.87 (dd, J = 8.2,7.2 Hz, 1H), 7.54 (dd, J = 7.5, 1.0 Hz, 1H), 7.40 (t, J = 8.2, 7.6 Hz, 1H), 7.18 (dd, J = 7.3, 1.0 Hz, 1H), 5.07 (t, J = 5.4 Hz, 1H), 4.89–4.84 (m, 1H), 4.05–3.87 (m, 2H), 5.03 (t, J = 5.3 Hz, 1H), 4.90–4.85 (m, 2H), 4.03–3.96 (m, 1H), 3.96–3.89 (m, 1H). 13C NMR (126 MHz, d6-DMSO, ppm) δ: 197.88, 197.36, 196.86, 182.96, 160.30, 140.80, 138.65, 133.86, 131.39, 131.13, 126.59, 126.39, 121.40, 120.48, 117.96, 116.92, 116.49, 60.30, 52.36. ESI-HRMS (m/z): Calc. for M = C20H15N2O7Re: 579.0318 (60%), 581.0311 (100%) [M−H]. Found: 579.0101 (60%), 581.0139 (100%) [M−H].
Synthesis of ReL2: [Re(CO)5Br] (65 mg, 0.16 mmol) and L2 (60 mg, 0.16 mmol) were dissolved in methanol (35 mL), and the mixture was refluxed for 3 h. The yellow solid formed was filtered under vacuum, recrystallized from methanol–water and dried. Yield: 55 mg, 47%. tR: 21.1 min, 21.3 min. Rf: (SiO2, dichloromethane:methanol, 9:1) 0.89. m.p. 336–339 °C. Calc. for C26H20N4O5ReBr: C, 42.51; H, 2.74; N, 7.63; Found: C 42.82; H 2.99; N 7.68. IR (cm−1, KBr): 3448, 3168 (Ν-H), 2935 (C-H), 2021 (CO), 1909 (CO), 1867 (CO), 1654 (C=O), 1636 (C=N), 1438 (arom. C-C, C-N), 1284 (C-O), 1267 (C-O). 1H NMR (500 MHz, d6-DMSO, ppm) Major/δ: 8.78 (d, J = 5.1 Hz, 1H), 8.17 (d, J = 8.2 Hz, 1H), 8.10 (td, J = 7.8, 1.5 Hz, 1H), 7.96 (dd, J = 7.1, 1.7 Hz, 1H),7.92 (dd, J = 7.8, 1.0 Hz, 1H), 7.79 (m, 2H), 7.56 (t, J = 7.7 Hz, 1H), 7.55 (t, J = 8.0 Hz, 1H), 7.45 (d, J = 7.6 Hz, 1H), 5.64 (s, 1H), 5.12 (dd, J = 15.9, 5.2 Hz, 1H), 4.94 (dd, J = 12.2, 5.8 Hz, 2H), 4.43 (dd, J = 15.9, 8.8 Hz, 1H), 3.80 (s, 3H), 3.74 (m, 2H); minor/δ: 8.79 (d, J = 5.1 Hz), 8.18 (d, J = 8.2 Hz, 1H), 8.06 (td, J = 7.8, 1.5 Hz), 7.96 (dd, J = 7.1, 1.7 Hz, 1H), 7.93 (dd, J = 7.8, 1.0 Hz, 1H), 7.79 (t, J = 7.7 Hz, 1H), 7.68 (d, J = 7.9 Hz), 7.55 (t, J = 8.0 Hz, 1H), 7.49 (d, J = 7.6 Hz, 1H), 7.48 (m, 1H), 6.73 (s, 1H), 4.97–4.83 (m, 2H), 4.72 (dd, J = 15.6, 5.3 Hz, 1H), 4.60 (dd, J = 15.7, 8.8 Hz), 3.91 (s), 3.74 (m, 2H). 13C NMR (126 MHz, d6-DMSO, ppm) Major/δ: 197.87, 196.58, 192.21, 182.97, 160.69, 156.57, 153.12, 140.38, 138.80, 137.46, 134.33, 129.57, 128.99, 125.90, 125.53, 123.52, 123.26, 120.94, 120.45, 116.90, 109.98, 58.64, 57.44, 56.62, 47.26; minor/δ: 197.87, 196.58, 192.21, 182.97, 161.80, 156.51, 153.05, 140.34, 138.92, 137.26, 134.34, 129.63, 128.91, 125.79, 125.54, 123.31, 123.26, 121.05, 120.62, 117.06, 116.77, 58.80, 57.68, 56.69, 47.26. ESI-HRMS (m/z): Calc. for M=C26H20N4O5ReBr: 653.0946 (60%), 655.0783 (100%) [M−Br]+, 731.0995 (60%), 733.1125 (100%) [M−Br + DMSO]+. Found: 653.0747 (60%), 655.0960 (100%) [M−Br]+, 731.1110 (60%), 733.1138 (100%) [M−Br + DMSO]+.
Synthesis of ReL3: [Re(CO)5(OTf)] (22 mg, 0.05 mmol) was dissolved in methanol (7 mL), and the mixture was refluxed for 1 h for the formation of [Re(CO)3(MeOH)3]+. L3 (24 mg, 0.05 mmol) was added, and the mixture was refluxed for 24 h. The reaction mixture was concentrated to ~3 mL, and after cooling, a yellow solid was formed, which was filtered under vacuum and dried. Yield: 21 mg, 60%. tR: 21.4 min. Rf: (SiO2, dichloromethane:methanol, 9:1) 0.78. m.p. 327–330 °C. Calc. for C28H21N4O7Re: C, 47.25; H, 2.97; N, 7.87; Found: C, 47.48; H 3.15; N 7.56. IR (cm−1, KBr): 3449, 2941 (C-H), 2023 (CO), 1912 (CO), 1870 (CO), 1651 (C=O), 1457 (arom. C-C, C-N), 1296 (C-O), 1267 (C-O). 1H NMR (500 MHz, d6-DMSO, ppm) δ: 8.78 (d, J = 5.4 Hz, 1H), 8.30 (d, J = 8.2 Hz, 1H), 8.16 (t, J = 7.7 Hz, 1H), 7.98 (d, J = 7.1 Hz, 1H), 7.94 (d, J = 7.7 Hz, 1H), 7.81 (t, J = 7.8 Hz, 1H), 7.72 (d, J = 7.9 Hz, 1H), 7.59 (t, J = 6.6 Hz, 1H), 7.56 (t, J = 7.9 Hz, 1H), 7.51 (d, J = 8.1 Hz, 1H), 5.13–5.03 (m, 2H), 5.04 (d, J = 15.5 Hz, 1H), 4.85 (d, J = 15.7 Hz, 1H), 4.28 (dt, J = 13.8, 7.0 Hz, 1H), 4.16 (dt, J = 13.3, 6.7 Hz, 1H), 4.03 (d, J = 16.6 Hz, 1H), 4.02 (s, 3H), 3.59 (d, J = 16.6 Hz, 1H). 13C NMR (126 MHz, d6-DMSO, ppm) δ: 198.00, 197.34, 182.96, 178.92, 159.68, 156.54, 152.55, 141.18, 138.80, 137.28, 134.42, 129.62, 128.93, 126.45, 125.56, 124.27, 123.60, 121.16, 120.96, 120.58, 117.20, 117.16, 67.99, 67.45, 61.32, 56.68, 45.69. ESI-HRMS (m/z): Calc. for M=C28H21N4O7Re: 711.0999 (60%), 713.0994 (100%) [M + H]+. Found: 711.1006 (60%), 713.1050 (100%) [M + H]+.
Synthesis of tricarbonylrheniumbromo(2-phenyl-N-(pyridin-2-ylmethyl)ethanamine), ReL4: [Re(CO)5Br] (40 mg, 0.1 mmol) and L4 (21 mg, 0.1 mmol) (synthesis of L4 is reported in ESI)) were dissolved in methanol (3 mL), and the mixture was refluxed for 3 h. The complex crystallized from methanol 1 mL at 4 °C, after 2 days. Yield: 25 mg (45%). Calc. for C17H16BrN2O3Re: C, 36.30; H, 2.87; N, 4.98; Found: C, 36.59; H, 3.15; N, 4.77. IR (cm−1, KBr): 3448, 3209 (N-H), 2926 (C-H), 2021 (CO), 1913 (CO), 1875 (CO), 1489 (arom. C-C, C-N), 1438 (arom. C-C, C-N). 1H NMR (500 MHz, CDCl3, ppm) δ: 8.82 (d, J = 5.2 Hz, 1H), 7.84 (t, J = 7.8 Hz, 1H), 7.42 (d, J = 7.8 Hz, 1H), 7.36–7.23 (m, 6H), 4.71 (dd, J = 14.7, 3.9 Hz, 1H), 4.18–4.09 (m, 1H), 3.91–3.89 (m, 1H), 3.70–3.57 (m, 1H), 3.43–3.34 (m, 1H), 3.17–3.01 (m, 2H).; 13C NMR (126 MHz, CDCl3, ppm) δ: 196.40 (CO), 195.47 (CO), 191.60 (CO), 158.43, 153.26, 139.02, 136.65, 129.03, 128.80, 127.20, 125.28, 121.96, 60.16, 59.23, 35.11 ESI-HRMS (m/z): Calc. for M=C17H16BrN2O3Re: 481.0685 (60%), 483.0689 (100%) [M−Br]+; 559.0807 (60%), 561.0795 (100%) [M−Br + DMSO]+; Found: 481.0724 (60%), 483.0746 (100%) [M-Br]+; 559.0864 (60%), 561.0893 (100%) [M−Br + DMSO]+.

3.3. X-ray Crystallography of fac-[Re(CO)3Br(L4)]

X-ray quality crystals of compound fac-[Re(CO)3Br(L4)] were grown in the mother liquor. A crystal suitable for X-ray diffraction with dimensions 0.14 × 0.09 × 0.07 mm was mounted at rt on a Bruker Kappa APEX2 diffractometer equipped with a triumph monochromator using Mo Kα (λ = 0.71073 Å, source operating at 50 kV and 30 mA) radiation. Unit cell dimensions were determined and refined using the angular settings of 173 high-intensity reflections (>10σ(I)) in the range 11 < 2θ < 36°. Intensity data were recorded using φ and ω–scans. The crystal remained intact during the data collection. The frames collected were integrated using the Bruker SAINT Software package V7.60A [52], and a narrow-frame algorithm. Data were corrected for absorption using the numerical method (SADABS) based on crystal dimensions [53]. The structure was solved using the SUPERFLIP package [54], incorporated in CRYSTALS. Data refinement (full-matrix least-squares methods on F2), and all subsequent calculations were carried out using the CRYSTALS version 14.61 build 6236 program package [55,56,57]. All non–hydrogen atoms were refined anisotropically.
Hydrogen atoms riding on parent carbon atoms were located from difference Fourier maps and refined at idealized positions riding on the parent atoms with isotropic displacement parameters Uiso(H) = 1.2Ueq(C) or 1.5Ueq(methylene and -NH hydrogens) and at distances C--H 0.95 Å and N-H 0.85 Å. All methylene and NH hydrogen atoms were allowed to rotate but not to tip. Illustrations with 50% ellipsoids probability were drawn by CAMERON [58,59]. Crystallographic data for the complex are presented in Table 6.
Further details on the crystallographic studies as well as atomic displacement parameters are given as Supporting Information in the form of cif files.
Crystallographic data were submitted to the Cambridge Crystallographic Data Center, No. 2374416. Copies of the data are available free of charge upon application to CCDC, 12 Union Road, Cambridge, CB2 1EZ, UK. Telephone: +(44)-1223-336033; E-mail: [email protected], or via https://www.ccdc.cam.ac.uk/structures/ (accessed on 30 July 2024).

3.4. DNA-Binding Studies

3.4.1. Study by UV–Vis Spectroscopy
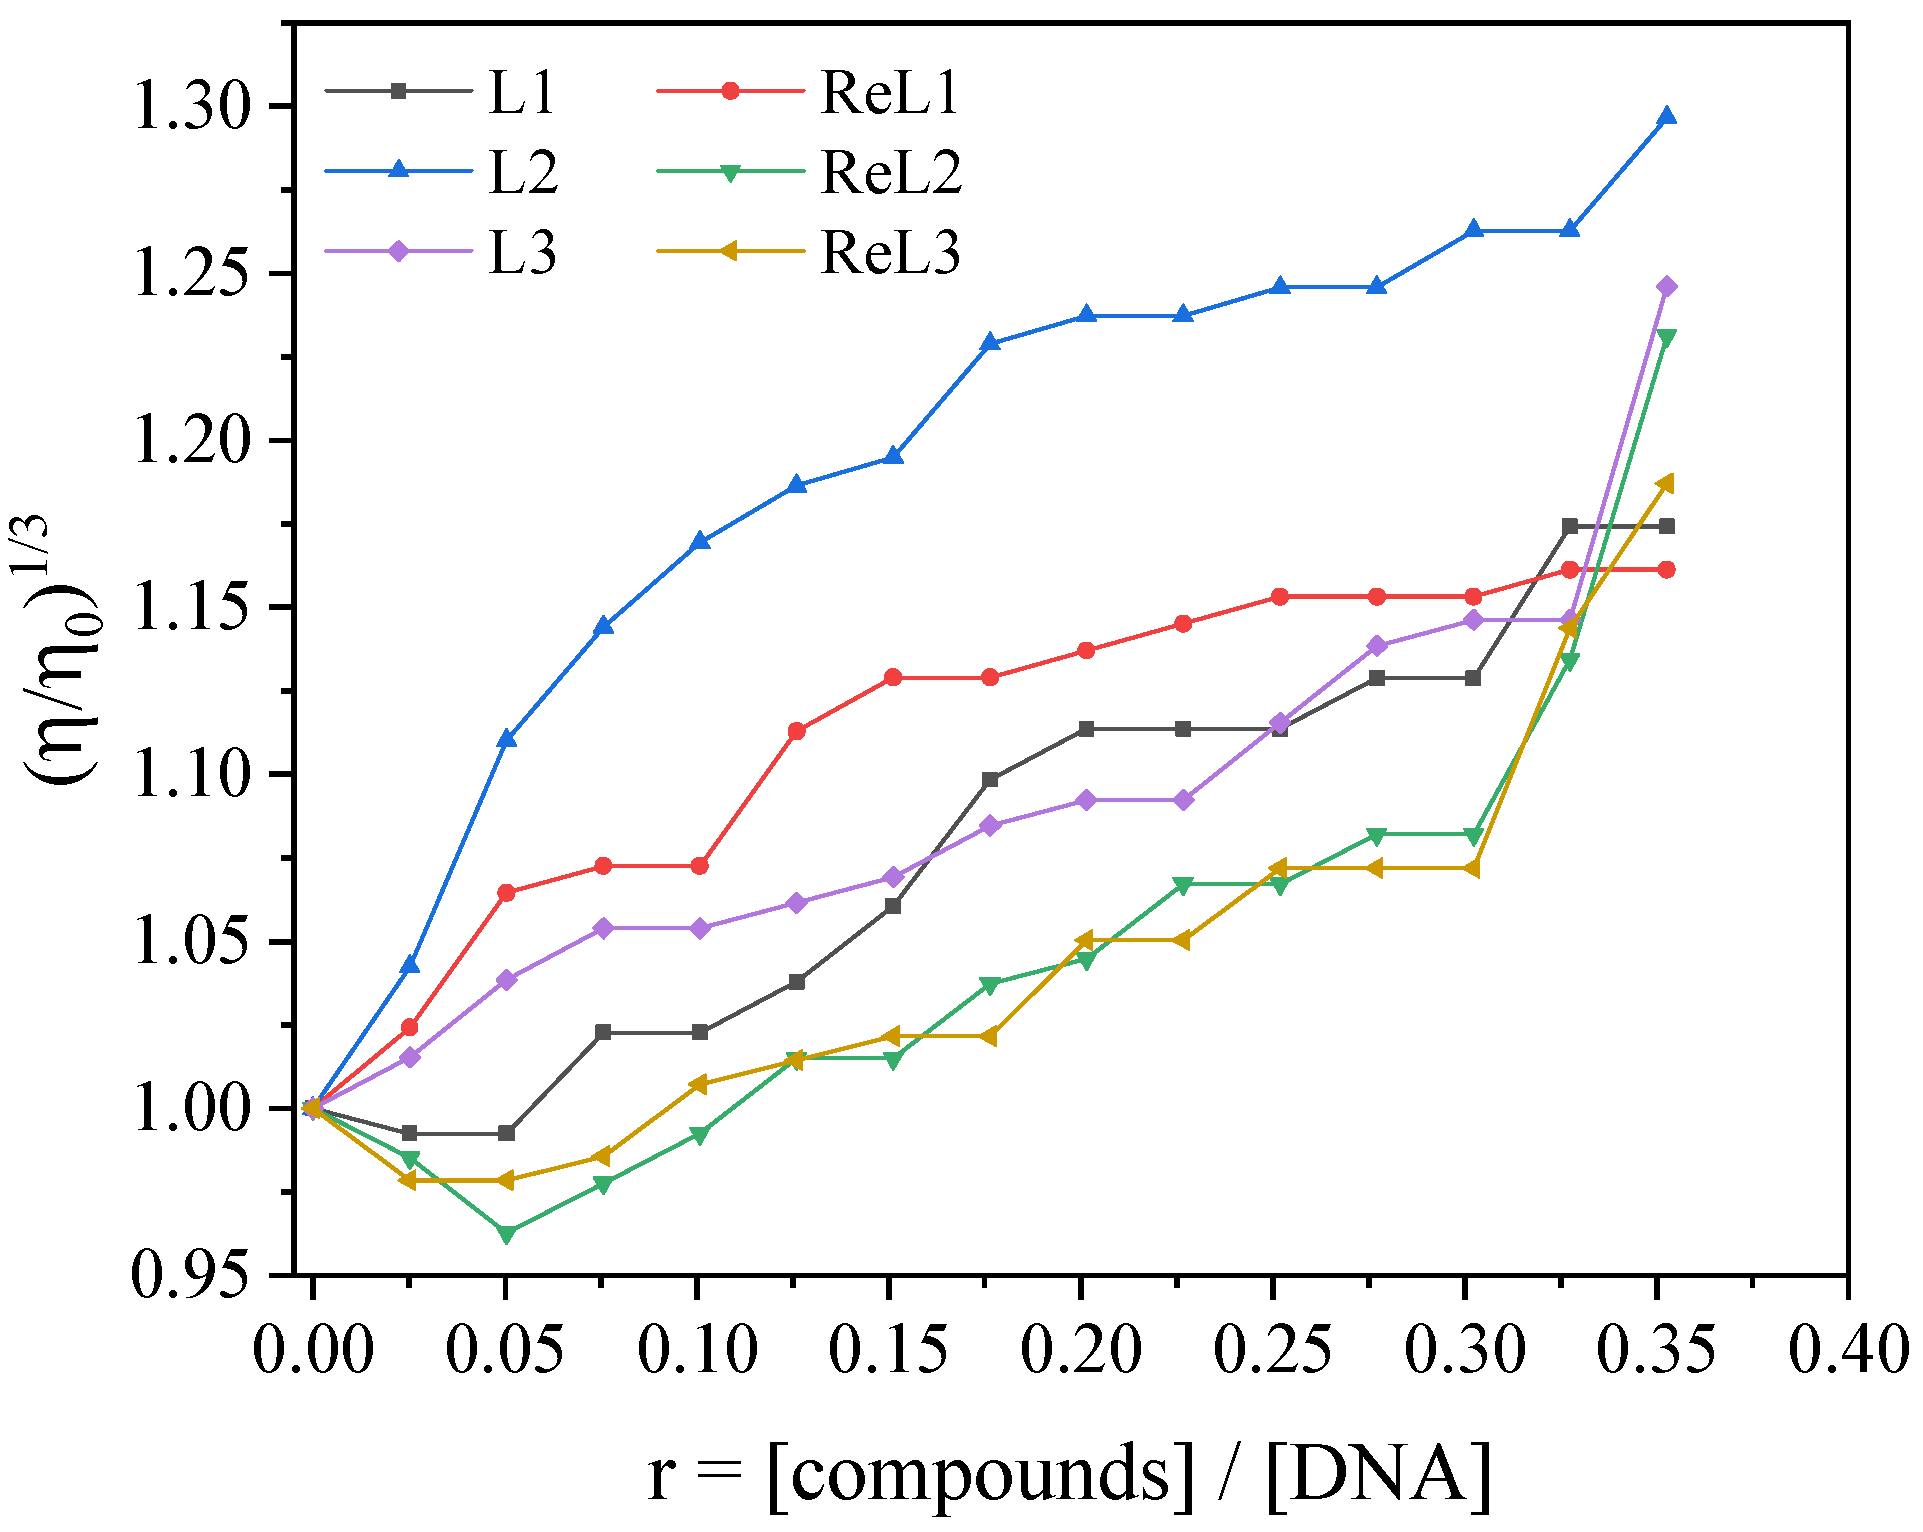
The interaction of the compounds with CT DNA as well as their possible binding modes were investigated by UV–vis spectroscopy and the respective binding constants (Kb) were calculated. The UV–vis spectra of CT DNA were recorded under a constant DNA concentration in the presence of each compound at various mixture ratios (r) [compound]/[DNA]. To obtain the binding constant Kb (in M−1), the changes in the absorbance of each compound at the corresponding λmax of their UV–vis spectra were recorded at increasing CT DNA concentrations (different r values), and it was calculated by the ratio of slope to the y intercept in plots [DNA]/(εA – εf) vs. [DNA], according to the Wolfe–Shimer equation [34]:
[ DNA ] ( ε A ε f ) = [ DNA ] ( ε b ε f ) + 1 K b ( ε b ε f )
where [DNA] is the concentration of DNA in base pairs, εA = Aobsd/[compound], εf = the extinction coefficient of the unbound compound, and εb = the extinction coefficient of the compound in the fully bound form.

3.4.2. Viscometry

The viscosity of DNA ([DNA] = 0.1 mM) was measured in buffer solution (150 mM NaCl and 15 mM trisodium citrate at pH 7.0) and in increasing amounts of the tested compounds. The measurements were performed at room temperature. The data are presented as (η/η0)1/3 vs. r, where η is the viscosity of DNA in the presence of the compound, and η0 is the viscosity of DNA without the compound.

3.4.3. Competition Studies with Ethidium Bromide (EB) via Fluorescence Spectroscopy

The ability of the compounds to displace EB from its DNA–EB complex was investigated by fluorescence emission spectroscopy. The DNA–EB adduct was prepared by mixing 20 μM EB and 26 μM CT DNA in buffer (150mM NaCl and 15mM trisodium citrate at pH 7.0). The intercalating effect of the compounds was studied by adding incremental amounts of the compound into a solution of the DNA–EB adduct. The effect of the addition of each compound to DNA–EB was obtained by measuring the changes of fluorescence emission spectra at the excitation wavelength of 540 nm. The compounds did not exhibit significant fluorescence at rt with or without DNA under the same conditions; therefore, the observed quenching is attributed to the displacement of EB from its EB–DNA adduct. The Stern–Volmer constant (KSV) was employed to evaluate the quenching efficiency of the compounds. The KSV value (in M−1) of the compounds was calculated as the slope of the plot I0/I vs. [Q], according to the linear Stern–Volmer equation (Equation (2)) [37]:
I o I = 1 + K q τ 0 [ Q ] = 1 + K S V [ Q ]
where I is the emission intensity in the presence of the compound, I0 is the emission intensity without the presence of the quencher (i.e., the compound under study), Kq = the quenching constant of the EB–DNA system, and τo = the average lifetime of EB–DNA without the quencher. Taking τo = 23 ns as the fluorescence lifetime of the EB–DNA system [38], the EB–DNA quenching constants (Kq, in M−1s−1) of the compounds were determined from Equation (3) [37]:
KSV = Kq · τo

3.5. In Vitro Cell Studies

3.5.1. Cell Cultures

Murine Balb/c colorectal carcinoma CT26 cells were a gift from Prof. C. Chlichlia and were grown in a culture containing DMEM medium that was supplemented with 10% (v/v) FBS in the presence of penicillin and streptomycin (1%) at 37 °C and in a humidified atmosphere containing 5% (v/v) CO2. The medium was renewed every 2 days (<90% confluency in the plates) to allow logarithmic cellular growth in culture. The cells were detached by using trypsin-EDTA solution (25%) (GIBCO Laboratories, Grand Island, NY, USA). The compounds were dissolved in DMSO and then added at the appropriate concentrations in the cell cultures.

3.5.2. Assessment of Proliferation Capacity of CT26 Cells Exposed to Anthrapyrazole Derivatives

The CT26 cells were plated in 24-well plates at a density of 1 × 10⁵ cells/mL. Following the attachment of cells to the plate, the compounds were added in the cultures at various concentrations (10−5–10−7 M). Then, the cells were permitted to grow for an additional 48 h. Subsequently, the cells were detached via trypsinization, and the cell density (number of cells/mL) was measured using a Neubauer chamber. The cell proliferation rate of CT26 cultures was expressed as a percentage (%) of cell growth compared to the control-untreated cell cultures. Furthermore, viability and cellular death were also assessed by using the trypan-blue dye exclusion method.

3.6. 99mTc Radiochemistry and In Vitro Radiotracer Studies

Synthesis of 99mTcL2 and 99mTcL3: A fresh solution of fac-[99mTc(CO)3(H2O)3]+ (400 μL, 370–480 ΜΒq) at pH 7 was transferred to a vial containing a methanolic solution of the ligand L2 or L3 (50 μL of 10−2 M) and an aqueous solution of ascorbic acid (50 μL of 10−1 M). The vial was sealed, flushed with N2 for 5 min and heated at 55–65 °C for 60 min. The reaction mixtures were analyzed by HPLC. The 99mTc complexes were purified by HPLC, and after evaporation of the solvents, they were reconstituted in 1% Tween 80 saline solution prior to further study.
Lipophilicity: The lipophilicity of the radiocomplexes was determined by the shake-flask method. 99mTcL2 or 99mTcL3 (20 μL) were mixed with 2 mL of 1-octanol and 1.98 mL of phosphate buffer (PBS, 0.1 M, pH 7.4) in a centrifuge tube. The mixture was vortexed at rt for 1 min and centrifuged at 3500 rpm for 5 min. Aliquots (50 μL) of both 1-octanol and PBS phases were withdrawn and counted in a gamma counter. The experiment was conducted in triplicates. The distribution coefficient (D) was calculated by dividing the radioactivity of the organic phase with that of the aqueous phase, and the results are expressed as logD7.4.
Stability studies: Histidine challenge: The purified 99mTcL2 or 99mTcL3 (50 μL, approx. 11–15 ΜBq) was mixed with a solution of L-histidine (1 mM) in 0.1 M PBS, pH 7.4 (0.45 mL) and incubated at 37 °C for 4 h. The mixtures were analyzed by HPLC at 1 and 4 h.
Rat plasma stability: 99mTcL2 or 99mTcL3 (100–120 μL, 25–30 ΜBq) was mixed with undiluted rat plasma (0.5 mL) at 37 °C for 4 h. Samples were withdrawn at 1 and 4 h, which were mixed with three times the volume of acetonitrile, to precipitate the proteins. The mixture was centrifuged at 5000 rpm for 10 min and the supernatant solution was separated from the solids. The radioactivity of the solution and the solid was measured in a γ-counter, and the solution was analyzed by HPLC.
Cellular uptake of 99mTcL2 and 99mTcL3: The CT26 cells were seeded at a density of 1 × 10⁶ cells/mL in 24-well plates and were allowed to attach for 6 h. Aliquots of 99mTcL2 or 99mTcL3 (20–40 μL, 0.9 MBq) were added to each plate and the cells were incubated for 15, 60, 120, and 240 min at 37 °C in an atmosphere containing 5% (v/v) CO2. The culture medium was withdrawn and the cells were detached using trypsin-EDTA (200 μL 0.25% w/v). After 2 min incubation, DMEM was added in the culture. The solution containing the cells was transferred to a tube followed by centrifugation, (5 min, 2000 rpm) and the cells were washed with 1 × PBS twice (150 and 120 μL). The radioactivity of the cells and supernatant was counted in γ–counter to evaluate the cellular uptake. The experiment was conducted in triplicates for each time point.

3.7. Biodistribution Studies of 99mTcL2 in Mice

The experiment was approved by the Aristotle University Committee for Animal Experimentation (License No 114251/528), and was performed according to the European guidelines 2010/63/EU and Greek legislation (PD 56) for animal experimentation. Balb/c mice, 10–12 weeks old, with a median weight of 20–25 g, were housed in suitable animal facilities (Laboratory of Development-Breeding of Animal Models and Biomedical Research, Faculty of Health Sciences, Aristotle University, EU License No EL 54 BIOexp-10) with food and water ad libitum and constant conditions of temperature, humidity and regular light cycles of 12/12 h light/dark. The 3R alternatives (Replacement, Refinement, Reduction) were considered in all animal experiments, while the mice were not subjected to pain or discomfort during the experimentation.
Balb/c were implanted subcutaneously with 5 × 10⁶ CT26 cells on the hind right flank. One week after inoculation, when the tumor size was between 0.4–1 cm, the animals were injected in the tail vein with ~370 kBq of the HPLC-purified tracer 99mTcL2 in 0.1 mL saline each. Animals were sacrificed at 30 and 120 min post-injection (p.i.) by cervical dislocation, which was followed by blood withdrawal and myocardial excision. Organs and tissues of interest were excised and weighed, and their radioactivity was measured by a γ scintillator. The radioactivity of the samples was decay-corrected by the use of a standard solution corresponding to 1% of the injected dose. The radioactivity of the tissues and organs is expressed as a percentage of the injected dose per gram tissue (% ID/g). Values are quoted as the mean% ID ± standard deviation (SD) of the four mice per group. Blood volume and muscle mass were estimated at 7 and 43% of body weight, respectively.

4. Conclusions

In this work, three new anthrapyrazole ligands and their respective tricarbonylrhenium complexes were synthesized and characterized. All compounds possess the ability to intercalate with DNA. Complex ReL1 acts as a metallointercalator with strong DNA-binding affinity. However, it was not cytotoxic at the tested concentration range and cell line, which is attributed to the ligand’s Ν-substituent. The anthrapyrazole pendant complexes ReL2 and ReL3 show strong DNA-binding affinities, with ReL3 exhibiting the highest DNA-binding constant among the tested compounds. Tumor cell cytotoxicity was high for ligand L2 and complex ReL2 with submicromolar IC50 values of 0.36 and 0.64 μΜ, respectively. The low cytotoxicity of ReL3 can be attributed also to its low cell uptake, based on the radiotracer studies with its analogous 99mTcL3. As complex ReL2 was the most cytotoxic, its γ-emitting analogue 99mTcL2 was evaluated for its tumor cell uptake and biodistribution properties in tumor-bearing mice. It was observed that this tracer exhibits high tumor uptake in vitro as well as accumulation in the tumor in vivo. ReL2 is a cytotoxic DNA-intercalator with suitable pharmacokinetic properties to be distributed in tumors in vivo and may be considered for further studies. Also, future design should focus on compounds with suitable substituents which is critical for cytotoxicity.

Supplementary Materials

The following supporting information can be downloaded at: https://www.mdpi.com/article/10.3390/inorganics12090254/s1, 1. Synthesis of Ligand L4; 2. NMR spectra of L1-L4 and ReL1-ReL4; 3. IR spectra; Figure S1: ORTEP diagram of the S enantiomer of ReL4; Table S1: Computed octahedral distortion parameters; Figure S2: UV-vis spectra of DMSO solution of L1, L2, ReL1 and ReL2 in the presence of increasing amounts of CT DNA; Figure S3: Plot of ([DNA])/(εAf)) versus [DNA] for compounds L1–L3 and ReL1–ReL3. Figure S4: Fluorescence emission spectra of compounds L1-L3 and ReL1-ReL2; Figure S5: Stern–Volmer quenching plot of EB–DNA fluorescence for compounds L1–L3 and ReL1–ReL3; Figure S6: IC50 curve of L2 and ReL2. Figure S7: HPLC analysis of L2, ReL2, ReL2′ and 99mTcL2.

Author Contributions

Conceptualization, D.P. and G.P. (Georgios Paparidis); methodology, G.P. (George Psomas), I.S.V., A.H. and C.G.; resources, D.S., I.S.V., G.P. (George Psomas) and D.P.; data curation, G.P. (Georgios Paparidis) and M.A.; writing—original draft preparation, G.P. (Georgios Paparidis), G.P. (George Psomas), I.S.V. and A.H.; writing—review and editing, D.P.; supervision, D.P., I.S.V. and G.P. (George Psomas). All authors have read and agreed to the published version of the manuscript.

Funding

This research received no external funding.

Institutional Review Board Statement

The experiment was approved by the Aristotle University Committee for Animal Experimentation (License No 114251/528), and was performed according to the European guidelines 2010/63/EU and Greek legislation (PD 56) for animal experimentation.

Data Availability Statement

The data of this work are provided within the manuscript and in the Supplementary Materials.

Acknowledgments

The authors are grateful to I. Iakovou, Head of the AHEPA Hospital Nuclear Medicine Laboratory, for donating 99mTc to perform the study.

Conflicts of Interest

The authors declare no conflicts of interest.

References

  1. Muhammad, N.; Guo, Z. Metal-Based Anticancer Chemotherapeutic Agents. Curr. Opin. Chem. Biol. 2014, 19, 144–153. [Google Scholar] [CrossRef]
  2. Ye, R.; Tan, C.; Chen, B.; Li, R.; Mao, Z. Zinc-Containing Metalloenzymes: Inhibition by Metal-Based Anticancer Agents. Front. Chem. 2020, 8, 402. [Google Scholar] [CrossRef]
  3. Simpson, P.V.; Desai, N.M.; Casari, I.; Massi, M.; Falasca, M. Metal-Based Antitumor Compounds: Beyond Cisplatin. Future Med. Chem. 2019, 11, 119–135. [Google Scholar] [CrossRef]
  4. Wernitznig, D.; Kiakos, K.; Del Favero, G.; Harrer, N.; Machat, H.; Osswald, A.; Jakupec, M.A.; Wernitznig, A.; Sommergruber, W.; Keppler, B.K. First-in-Class Ruthenium Anticancer Drug (KP1339/IT-139) Induces an Immunogenic Cell Death Signature in Colorectal Spheroids in Vitro†. Metallomics 2019, 11, 1044–1048. [Google Scholar] [CrossRef]
  5. King, A.P.; Wilson, J.J. Endoplasmic Reticulum Stress: An Arising Target for Metal-Based Anticancer Agents. Chem. Soc. Rev. 2020, 49, 8113–8136. [Google Scholar] [CrossRef]
  6. Anthony, E.J.; Bolitho, E.M.; Bridgewater, H.E.; Carter, O.W.L.; Donnelly, J.M.; Imberti, C.; Lant, E.C.; Lermyte, F.; Needham, R.J.; Palau, M.; et al. Metallodrugs Are Unique: Opportunities and Challenges of Discovery and Development. Chem. Sci. 2020, 11, 12888–12917. [Google Scholar] [CrossRef]
  7. Ortega, E.; Vigueras, G.; Ballester, F.J.; Ruiz, J. Targeting Translation: A Promising Strategy for Anticancer Metallodrugs. Coord. Chem. Rev. 2021, 446, 214129. [Google Scholar] [CrossRef]
  8. Ghosh, S. Cisplatin: The First Metal Based Anticancer Drug. Bioorg. Chem. 2019, 88, 102925. [Google Scholar] [CrossRef]
  9. Clède, S.; Lambert, F.; Saint-Fort, R.; Plamont, M.A.; Bertrand, H.; Vessières, A.; Policar, C. Influence of the Side-Chain Length on the Cellular Uptake and the Cytotoxicity of Rhenium Triscarbonyl Derivatives: A Bimodal Infrared and Luminescence Quantitative Study. Chem. A Eur. J. 2014, 20, 8714–8722. [Google Scholar] [CrossRef] [PubMed]
  10. Leonidova, A.; Pierroz, V.; Adams, L.A.; Barlow, N.; Ferrari, S.; Gra, B. Enhanced Cytotoxicity through “Click” Conjugation of a Luminescent Re (I) Complex to a Cell-Penetrating Lipopeptide. ACS Med. Chem. Lett. 2014, 5, 809–814. [Google Scholar] [CrossRef] [PubMed]
  11. Leonidova, A.; Pierroz, V.; Rubbiani, R.; Heier, J.; Ferrari, S.; Gasser, G. Towards Cancer Cell-Specific Phototoxic Organometallic Rhenium (I) Complexes. Dalton Trans. 2014, 43, 4287–4294. [Google Scholar] [CrossRef] [PubMed]
  12. Knopf, K.M.; Murphy, B.L.; Macmillan, S.N.; Baskin, J.M.; Barr, M.P.; Boros, E.; Wilson, J.J. In Vitro Anticancer Activity and in Vivo Biodistribution of Rhenium (I) Tricarbonyl Aqua Complexes. J. Am. Chem. Soc. 2017, 139, 14302–14314. [Google Scholar] [CrossRef] [PubMed]
  13. Schindler, K.; Zobi, F. Anticancer and Antibiotic Rhenium Tri- and Dicarbonyl Complexes: Current Research and Future Perspectives. Molecules 2022, 27, 539. [Google Scholar] [CrossRef] [PubMed]
  14. Rescifina, A.; Zagni, C.; Varrica, M.G.; Pistarà, V.; Corsaro, A. Recent Advances in Small Organic Molecules as DNA Intercalating Agents: Synthesis, Activity, and Modeling. Eur. J. Med. Chem. 2014, 74, 95–115. [Google Scholar] [CrossRef] [PubMed]
  15. Liu, H.-K.; Sadler, P.J. Metal Complexes as DNA Intercalators. Acc. Chem. Res. 2011, 44, 349–359. [Google Scholar] [CrossRef]
  16. Lee, L.C.-C.; Leung, K.-K.; Lo, K.K.-W. Recent Development of Luminescent Rhenium (i) Tricarbonyl Polypyridine Complexes as Cellular Imaging Reagents, Anticancer Drugs, and Antibacterial Agents. Dalton Trans. 2017, 46, 16357–16380. [Google Scholar] [CrossRef]
  17. Pagoni, C.C.; Xylouri, V.S.; Kaiafas, G.C.; Lazou, M.; Bompola, G.; Tsoukas, E.; Papadopoulou, L.C.; Psomas, G.; Papagiannopoulou, D. Organometallic Rhenium Tricarbonyl—Enrofloxacin and—Levofloxacin Complexes: Synthesis, Albumin—Binding, DNAi—Interaction and Cell Viability Studies. JBIC J. Biol. Inorg. Chem. 2019, 24, 609–619. [Google Scholar] [CrossRef]
  18. Nasiri Sovari, S.; Kolly, I.; Schindler, K.; Djuric, A.; Srdic-Rajic, T.; Crochet, A.; Pavic, A.; Zobi, F. Synthesis, Characterization, and in Vivo Evaluation of the Anticancer Activity of a Series of 5- and 6-(Halomethyl)-2,2′-Bipyridine Rhenium Tricarbonyl Complexes. Dalton Trans. 2023, 52, 6934–6944. [Google Scholar] [CrossRef]
  19. Frederick, C.A.; Williams, L.D.; Ughetto, G.; Van der Marel, G.A.; Van Boom, J.H.; Rich, A.; Wang, A.H.J. Structural Comparison of Anticancer Drug-DNA Complexes: Adriamycin and Daunomycin. Biochemistry 1990, 29, 2538–2549. [Google Scholar] [CrossRef]
  20. Mattioli, R.; Ilari, A.; Colotti, B.; Mosca, L.; Fazi, F.; Colotti, G. Doxorubicin and Other Anthracyclines in Cancers: Activity, Chemoresistance and Its Overcoming. Mol. Asp. Med. 2023, 93, 101205. [Google Scholar] [CrossRef]
  21. Imstepf, S.; Pierroz, V.; Rubbiani, R.; Felber, M.; Fox, T.; Gasser, G.; Alberto, R. Organometallic Rhenium Complexes Divert Doxorubicin to the Mitochondria. Angew. Chem. Int. Ed. 2016, 55, 2792–2795. [Google Scholar] [CrossRef]
  22. Cardinale, D.; Iacopo, F.; Cipolla, C.M. Cardiotoxicity of Anthracyclines. Front. Cardiovasc. Med. 2020, 7, 26. [Google Scholar] [CrossRef]
  23. Gogas, H.; Mansi, J.L. New Drugs. The Anthrapyrazoles. Cancer Treat. Rev. 1996, 21, 541–552. [Google Scholar] [CrossRef] [PubMed]
  24. Tan, J.H.; Zhang, Q.X.; Huang, Z.S.; Chen, Y.; Wang, X.D.; Gu, L.Q.; Wu, J.Y. Synthesis, DNA Binding and Cytotoxicity of New Pyrazole Emodin Derivatives. Eur. J. Med. Chem. 2006, 41, 1041–1047. [Google Scholar] [CrossRef] [PubMed]
  25. Haiyang, H.; Morley, J.E.; Twamley, B.; Groeneman, R.H.; Bucar, D.K.; MacGillivray, L.R.; Benny, P.D. Investigation of the Coordination Interactions of S-(Pyridin-2-Ylmethyl)-L-Cysteine Ligands with M(CO)3+ (M = Re, 99mTc). Inorg. Chem. 2009, 48, 10625–10634. [Google Scholar]
  26. Makris, G.; Radford, L.; Gallazzi, F.; Jurisson, S.; Hennkens, H.; Papagiannopoulou, D. Synthesis and Evaluation of fac-[99mTc/Re(CO)3]+ Complexes with a New (N,S,N) Bifunctional Chelating Agent: The First Example of a fac-[Re(CO)3(N,S,N-Sst2-ANT)] Complex Bearing a Somatostatin Receptor Antagonist Peptide. J. Organomet. Chem. 2016, 805, 100–107. [Google Scholar] [CrossRef]
  27. He, H.; Lipowska, M.; Xu, X.; Taylor, A.T.; Marzilli, L.G. Rhenium Analogues of Promising Renal Imaging Agents with a {99mTc(CO)3}+ Core Bound to Cysteine-Derived Dipeptides, Including Lanthionine. Inorg. Chem. 2007, 46, 590–596. [Google Scholar] [CrossRef]
  28. Suárez-Ortiz, G.A.; Hernández-Correa, R.; Morales-Moreno, M.D.; Toscano, R.A.; Ramirez-Apan, M.T.; Hernandez-Garcia, A.; Amézquita-Valencia, M.; Araiza-Olivera, D. Diastereomeric Separation of Chiral Fac-Tricarbonyl (Iminopyridine) Rhenium (I) Complexes and Their Cytotoxicity Studies: Approach toward an Action Mechanism against Glioblastoma. J. Med. Chem. 2022, 65, 9281–9294. [Google Scholar] [CrossRef]
  29. Song, X.; Lim, M.H.; Mohamed, D.K.B.; Wong, S.M.; Zhao, J.; Hor, T.S.A. Re (I) Carbonyl Complexes Containing Pyridyl-Imine and Amine Ligands: Synthesis, Characterization and Their Catalytic Olefin Epoxidation Activities. J. Organomet. Chem. 2016, 814, 1–7. [Google Scholar] [CrossRef]
  30. Saund, S.S.; Siegler, M.A.; Thoi, V.S. Electrochemical Degradation of a Dicationic Rhenium Complex via Hoffman-Type Elimination. Inorg. Chem. 2021, 60, 13011–13020. [Google Scholar] [CrossRef]
  31. Liu, W.; Heinze, K. Rhenium (I) and Platinum (II) Complexes with Diimine Ligands Bearing Acidic Phenol Substituents: Hydrogen-Bonding, Acid–Base Chemistry and Optical Properties. Dalton Trans. 2010, 39, 9554–9564. [Google Scholar] [CrossRef] [PubMed]
  32. Wang, W.; Spingler, B.; Alberto, R. Reactivity of 2-Pyridine–Aldehyde and 2-Acetyl–Pyridine Coordinated to [Re(CO)3]+ with Alcohols and Amines: Metal Mediated Schiff Base Formation and Dimerization. Inorganica Chim. Acta 2003, 355, 386–393. [Google Scholar] [CrossRef]
  33. Ketkaew, R.; Tantirungrotechai, Y.; Harding, P.; Chastanet, G.; Guionneau, P.; Marchivie, M.; Harding, D.J. OctaDist: A Tool for Calculating Distortion Parameters in Spin Crossover and Coordination Complexes. Dalton Trans. 2021, 50, 1086–1096. [Google Scholar] [CrossRef]
  34. Wolfe, A.; Shimer, G.; Meehan, T. Polycyclic Aromatic Hydrocarbons Physically Intercalate into Duplex Regions of Denatured DNA. Biochemistry 1987, 26, 6392–6396. [Google Scholar] [CrossRef] [PubMed]
  35. Zhao, G.; Lin, H.; Zhu, S.; Sun, H.; Chen, Y. Dinuclear Palladium (II) Complexes Containing Two Monofunctional [Pd(En)(Pyridine)Cl]+ Units Bridged by Se or S. Synthesis, Characterization, Cytotoxicity and Kinetic Studies of DNA-Binding. J. Inorg. Biochem. 1998, 70, 219–226. [Google Scholar] [CrossRef]
  36. Luis García-Giménez, J.; González-Álvarez, M.; Liu-González, M.; Macías, B.; Borrás, J.; Alzuet, G. Toward the Development of Metal-Based Synthetic Nucleases: DNA Binding and Oxidative DNA Cleavage of a Mixed Copper (II) Complex with N-(9H-Purin-6-Yl) Benzenesulfonamide and 1,10-Phenantroline. Antitumor Activity in Human Caco-2 Cells and Jurkat T Lymphocy. J. Inorg. Biochem. 2009, 103, 923–934. [Google Scholar] [CrossRef]
  37. Lakowicz, J.R. Principles of Fluorescence Spectroscopy, 3rd ed.; Plenum Press: New York, NY, USA, 2006. [Google Scholar]
  38. Wilson, W.D.; Ratmeyer, L.; Zhao, M.; Strekowski, L.; Boykin, D. The Search for Structure-Specific Nucleic Acid-Interactive Drugs: Effects of Compound Structure on RNA versus DNA Interaction Strength. Biochemistry 1993, 32, 4098–4104. [Google Scholar] [CrossRef] [PubMed]
  39. Heller, D.P.; Greenstock, C.L. Fluorescence Lifetime Analysis of DNA Intercalated Ethidium Bromide and Quenching by Free Dye. Biophys. Chem. 1994, 50, 305–312. [Google Scholar] [CrossRef]
  40. Sharma, A.; Özayral, S.; Caserto, J.S.; ten Cate, R.; Anders, N.M.; Barnett, J.D.; Kandala, S.K.; Henderson, E.; Stewart, J.; Liapi, E.; et al. Increased Uptake of Doxorubicin by Cells Undergoing Heat Stress Does Not Explain Its Synergistic Cytotoxicity with Hyperthermia. Int. J. Hyperth. 2019, 36, 712–720. [Google Scholar] [CrossRef]
  41. Shimolina, L.E.; Gulin, A.A.; Paez-Perez, M.; López-Duarte, I.; Druzhkova, I.N.; Lukina, M.M.; Gubina, M.V.; Brooks, N.J.; Zagaynova, E.V.; Kuimova, M.K.; et al. Mapping Cisplatin-Induced Viscosity Alterations in Cancer Cells Using Molecular Rotor and Fluorescence Lifetime Imaging Microscopy. J. Biomed. Opt. 2020, 25, 126004. [Google Scholar] [CrossRef]
  42. Showalter, H.D.; Johnson, J.L.; Hoftiezer, J.M.; Turner, W.R.; Werbel, L.M.; Leopold, W.R.; Shillis, J.L.; Jackson, R.C.; Elslager, E.F. Anthrapyrazole Anticancer Agents. Synthesis and Structure-Activity Relationships against Murine Leukemias. J. Med. Chem. 1987, 30, 121–131. [Google Scholar] [CrossRef] [PubMed]
  43. Kostakis, I.K.; Magiatis, P.; Pouli, N.; Marakos, P.; Skaltsounis, A.L.; Pratsinis, H.; Léonce, S.; Pierré, A. Design, Synthesis, and Antiproliferative Activity of Some New Pyrazole-Fused Amino Derivatives of the Pyranoxanthenone, Pyranothioxanthenone, and Pyranoacridone Ring Systems: A New Class of Cytotoxic Agents. J. Med. Chem. 2002, 45, 2599–2609. [Google Scholar] [CrossRef] [PubMed]
  44. Zee-Cheng, R.K.Y.; Podrebarac, E.G.; Menon, C.S.; Cheng, C.C. Structural Modification Study of Bis (Substituted Aminoalkylamino) Anthraquinones. An Evaluation of the Relationship of the [2-[(2-Hydroxyethyl)Amino]Ethyl] Amino Side Chain with Antineoplastic Activity. J. Med. Chem. 1979, 22, 501–505. [Google Scholar] [CrossRef]
  45. Papagiannopoulou, D. Technetium-99m Radiochemistry for Pharmaceutical Applications. J. Label. Comp. Radiopharm. 2017, 60, 502–520. [Google Scholar] [CrossRef] [PubMed]
  46. Schmidt, S.; Trogler, W.; Basolo, F. Pentacarbonyl Rhenium Halides. Inorg. Synth. 1985, 23, 41. [Google Scholar]
  47. Nitschke, J.; Schmidt, S.P.; Trogler, W.C. Properties of (Trifluoromethanesulfonato) Pentacarbonylmanganese (I) and Rhenium (I). Reactions in Superacid Solvents. Inorg. Chem. 1985, 24, 1972–1978. [Google Scholar] [CrossRef]
  48. Alberto, R.; Schibli, R.; Egli, A.; Schubiger, A.P.; Abram, U.; Kaden, T.A. A Novel Organometallic Aqua Complex of Technetium for the Labeling of Biomolecules: Synthesis of [99mTc(OH2)3(CO)3]+ from [99mTcO4] in Aqueous Solution and Its Reaction with a Bifunctional Ligand. J. Am. Chem. Soc. 1998, 120, 7987–7988. [Google Scholar] [CrossRef]
  49. Marmur, J. A Procedure for the Isolation of Deoxyribonucleic Acid from Micro-Organisms. J. Mol. Biol. 1961, 3, 208-IN1. [Google Scholar] [CrossRef]
  50. Reichmann, M.E.; Rice, S.; Thomas, C.; Doty, P. A Further Examination of the Molecular Weight and Size of Desoxypentose Nucleic Acid. J. Am. Chem. Soc. 1954, 76, 3047–3053. [Google Scholar] [CrossRef]
  51. Policar, C.; Lambert, F.; Cesario, M.; Morgenstern-Badarau, I. An Inorganic Helix [Mn(IPG)(MeOH)]n[PF6]n[‡]: Structural and Magnetic Properties of a Syn-Anti Carboxylate-Bridged Manganese (II) Chain Involving a Tetradentate Ligand. Eur. J. Inorg. Chem. 1999, 1999, 2201–2207. [Google Scholar] [CrossRef]
  52. McInally, C. Apex2; Bruker Analytical X-Ray Systems, Inc.: Madison, WI, USA, 2006; p. M86-E01078. [Google Scholar]
  53. Sheldrick, G.M. SADABS: Area-Detector Absorption Correction; Siemens Industrial Automation, Inc.: Madison, WI, USA, 1996. [Google Scholar]
  54. Palatinus, L.; Chapuis, G. SUPERFLIP—A computer program for the solution of crystal structures by charge flipping in arbitrary dimensions. J. Appl. Crystallogr. 2007, 40, 786–790. [Google Scholar] [CrossRef]
  55. Betteridge, P.W.; Carruthers, J.R.; Cooper, R.I.; Prout, K.; Watkin, D.J. CRYSTALS version 12: Software for guided crystal structure analysis. J. Appl. Crystallogr. 2003, 36, 1487. [Google Scholar] [CrossRef]
  56. Watkin, D. The Control of Difficult Refinements. Acta Crystallogr. Sect. A 1994, 50, 411–437. [Google Scholar] [CrossRef]
  57. Prince, E. Mathematical Techniques in Crystallography and Materials Science; Springer: Berlin/Heidelberg, Germany, 1982. [Google Scholar]
  58. Watkin, D.J.; Prout, C.K.; Pearce, L.J. CAMERON, Chemical Crystallography Laboratory; University of Oxford: Oxford, UK, 1996. [Google Scholar]
  59. De Meulenaer, J.; Tompa, H. The Absorption Correction in Crystal Structure Analysis. Acta Crystallogr. 1965, 19, 1014–1018. [Google Scholar] [CrossRef]
Figure 1. Structures of rhenium anthrapyrazole complexes.
Inorganics 12 00254 g001
Scheme 1. (i) Me2SO4, 60 °C; (ii) p-toluenesulfonyl chloride (TsCl), 60 °C (46%); (iii) 2-hydroxyethyl-hydrazine, 130 °C (25%); (iv) BBr3, 25 °C (65%); (v) methylsulfonyl chloride (MsCl), 25 °C (85%); (vi) 2-picolylamine, 65 °C (39%); (vii) ethyl 2-((pyridin-2-ylmethyl)amino)acetate, 80 °C (67%).
Inorganics 12 00254 sch001
Figure 2. Representative section of the 1H NMR spectrum of ReL2 and table with proton shifts δ (in ppm) of L2 (CDCl3) and ReL2 (d6-DMSO); isomer designation Μ: major (blue), m: minor (red).
Inorganics 12 00254 g002
Figure 3. ORTEP of fac-[Re(CO)3Br(L4)] R-conformer.
Inorganics 12 00254 g003
Figure 4. UV–vis spectra of DMSO solution (1 × 10⁻⁴ M) of L3 and ReL3 in the presence of increasing amounts of CT DNA. The arrows show the changes upon addition of CT DNA.
Inorganics 12 00254 g004
Figure 5. Relative viscosity (η/η0)1/3 of CT DNA (0.1 mM) in buffer solution (150 mM NaCl and 15 mM trisodium citrate at pH 7.0) in the presence of the compounds (anthrapyrazoles L1L3 and complexes ReL1ReL3) at increasing amounts (r = [compound]/[DNA]).
Inorganics 12 00254 g005
Figure 6. (A) Fluorescence emission spectra (λexitation = 540 nm) of EB–DNA ([EB] = 20 μM, [DNA] = 26 μM) in buffer solution in increasing amounts of complex ReL3 (up to the value of r = 0.4). The arrow shows the changes of intensity upon addition of ReL3. (B) Plot of EB–DNA relative fluorescence intensity at λem = 592 nm (I/I0, in %) (in buffer solution of 150 mM NaCl and 15 mM trisodium citrate at pH = 7.0) vs. r (r = [compound]/[DNA]) in the presence of the compounds (up to 46.1% of the initial EB–DNA fluorescence emission intensity for L1, 46.0% for L2, 43.5% for L3, 51.5% for ReL1, 48.6% for ReL2, and 46.1% for ReL3).
Inorganics 12 00254 g006
Figure 7. Assessment of cell growth (A) and the proportion of dead cells (B) in cultures of CT 26 incubated with 10−5 M of each compound. The morphology of CT 26 treated with 10−5 M of either L2 (D) and ReL2 (C) along with the untreated control culture (E) is shown.
Inorganics 12 00254 g007
Table 1. Selected geometric parameters (Å, º).
Re1—Br12.6219 (7)
Re1—N12.171 (4)
Re1—N22.223 (4)
Re1—C151.919 (6)
Re1—C161.894 (7)
Re1—C171.897 (6)
O1—C151.140 (8)
O2—C161.127 (7)
O3—C171.156 (7)
N1—C11.342 (7)
N1—C51.346 (7)
N2—C61.469 (7)
N2—C71.505 (7)
Br1—Re1—N185.82 (12)
Br1—Re1—N284.56 (12)
N1—Re1—N275.39 (16)
Br1—Re1—C1592.5 (2)
N1—Re1—C15174.8 (2)
N2—Re1—C1599.5 (2)
Br1—Re1—C16178.08 (18)
N1—Re1—C1693.1 (2)
N2—Re1—C1693.6 (2)
C15—Re1—C1688.5 (3)
Br1—Re1—C1791.2 (2)
N1—Re1—C1798.5 (2)
N2—Re1—C17172.8 (2)
C15—Re1—C1786.5 (3)
C16—Re1—C1790.5 (3)
Table 2. Spectral features of the interaction of compounds L1–L3 and ReL1–ReL3 with CT DNA. UV band (λmax, in nm), percentage of the observed hyper-/hypo-chromism (ΔA/A0, %), red-/blue-shift (Δλmax, in nm) and DNA-binding constants (Kb, M−1).
Compoundλmax (nm) (ΔA/A0 (%) a, Δλmax (nm) b)Kb (M−1)
L1276 (−6 a, 0 b); 301 (sh) c (−5, 0); 323 (sh) (−7, 0); 439 (−7, 0)1.33 (±0.01) × 105
L2278 (−10, 0); 326 (sh) (−3.5, 0); 441 (−4, +2)7.74 (±0.03) × 104
L3277 (−7, +2); 325 (sh) (−7, 0); 441 (−6, 0)7.01 (±0.01) × 104
ReL1276 (−14, +3); 304 (−12, +2); 395 (−6.5, 0); 437 (sh) (−9, 0); 530 (−6, 0)1.24 (±0.04) × 105
ReL2278 (−20, +1); 300 (sh) (−10, 0); 435 (−5, +2)6.87 (±0.09) × 104
ReL3278 (−12, +2); 300 (sh) (−10, 0); 322 (sh) (−10, +2); 436 (−10, 0)1.09 (±0.15) × 106
a “+” denotes hyperchromism, “−” denotes hypochromism; b “+” denotes red-shift, “−” denotes blue-shift; c “sh” = shoulder.
Table 3. Percentage of EB–DNA fluorescence quenching (ΔI/Io, %), the Stern–Volmer (KSV, in M−1) and EB–DNA quenching constants (Kq, in M−1s−1) for compounds L1-L3 and ReL1–ReL3.
CompoundΔI/Ι0 (%)Ksv (M−1)Kq (M−1s−1)
L153.95.65 (±0.09) × 1052.46 (±0.04) × 1013
L254.05.27 (±0.08) × 1052.29 (±0.03) × 1013
L356.55.93 (±0.04) × 1052.58 (±0.02) × 1013
ReL148.54.47 (±0.05) × 1051.94 (±0.02) × 1013
ReL251.44.52 (±0.07) × 1051.96 (±0.03) × 1013
ReL353.94.60 (±0.07) × 1052.00 (±0.03) × 1013
Table 4. Percentage (%) of 99mTcL2 and 99mTcL3 uptake in CT26 cells.
15 min60 min120 min240 min
99mTcL21.29 ± 0.09%2.48 ± 0.25%3.94 ± 0.68%5.42 ± 0.19%
99mTcL30.49 ± 0.06%0.53 ± 0.04%0.55 ± 0.08%0.75 ± 0.11%
Table 5. Distribution of 99mTcL2 in CT26 tumor-bearing mice (%ID/g).
Organ%ID/g
30 min120 min
Blood6.48 ± 2.024.16 ± 1.31
Tumor (CT26)2.42 ± 0.043.10 ± 1.21
Heart8.91 ± 3.775.90 ± 1.16
Liver29.49 ± 9.4324.51 ± 7.12
Lungs15.36 ± 6.437.73 ± 2.29
Muscle2.17 ± 0.252.20 ± 0.51
Kidneys22.09 ± 8.9117.04 ± 3.53
Spleen6.78 ± 1.333.87 ± 0.87
Intestine11.38 ± 3.4319.84 ± 8.10
Stomach8.58 ± 6.6014.26 ± 7.53
Table 6. Experimental details.
Crystal Data
Chemical formulaC17H16BrN2O3Re
Mr562.43
Crystal system, space groupMonoclinic, P21/c
Temperature (K)295
a, b, c (Å)11.5730 (8), 20.8663 (11), 7.7637 (5)
β (°)99.867 (2)
V3)1847.1 (2)
Z4
Radiation typeMo Kα
µ (mm−1)8.76
Crystal size (mm)0.14 × 0.09 × 0.07
Data collection
DiffractometerBruker Kappa Apex2
Absorption correctionNumerical Analytical Absorption [56]
Tmin, Tmax0.45, 0.54
No. of measured, independent and
observed [I > 2.0σ(I)] reflections
17060, 3533, 3106
Rint0.029
(sin θ/λ)max−1)0.613
Refinement
R[F2 > 2σ(F2)], wR(F2), S0.036, 0.057, 1.00
No. of reflections3106
No. of parameters217
H-atom treatmentH-atom parameters constrained
Δρmax, Δρmin (e Å−3)1.54, −1.55
Disclaimer/Publisher’s Note: The statements, opinions and data contained in all publications are solely those of the individual author(s) and contributor(s) and not of MDPI and/or the editor(s). MDPI and/or the editor(s) disclaim responsibility for any injury to people or property resulting from any ideas, methods, instructions or products referred to in the content.

