

Efficacy of the CALM® Algorithm in Reducing Motion-Induced Artifacts in CBCT Imaging: A Fractal Dimension Analysis of Trabecular Bone
 ,
, 
Abstract
:1. Introduction
2. Materials and Methods
3. Results
4. Discussion
5. Limitations
6. Conclusions
Author Contributions
Funding
Institutional Review Board Statement
Data Availability Statement
Acknowledgments
Conflicts of Interest
References
- Sanchez-Molina, D.; Velazquez-Ameijide, J.; Quintana, V.; Arregui-Dalmases, C.; Crandall, J.R.; Subit, D.; Kerrigan, J.R. Fractal Dimension and Mechanical Properties of Human Cortical Bone. Med. Eng. Phys. 2013, 35, 576–582. [Google Scholar] [CrossRef] [PubMed]
- Sánchez, I.; Uzcátegui, G. Fractals in Dentistry. J. Dent. 2011, 39, 273–292. [Google Scholar] [CrossRef] [PubMed]
- White, S.C.; Rudolph, D.J. Alterations of the Trabecular Pattern of the Jaws in Patients with Osteoporosis. Oral Surg. Oral Med. Oral Pathol. Oral Radiol. Endodontology 1999, 88, 628–635. [Google Scholar] [CrossRef] [PubMed]
- Hua, Y.; Nackaerts, O.; Duyck, J.; Maes, F.; Jacobs, R. Bone Quality Assessment Based on Cone Beam Computed Tomography Imaging. Clin. Oral Implant. Res. 2009, 20, 767–771. [Google Scholar] [CrossRef] [PubMed]
- Carvalho, B.F.; De Castro, J.G.K.; De Melo, N.S.; De Souza Figueiredo, P.T.; Moreira-Mesquita, C.R.; De Paula, A.P.; Sindeaux, R.; Leite, A.F. Fractal Dimension Analysis on CBCT Scans for Detecting Low Bone Mineral Density in Postmenopausal Women. Imaging Sci. Dent. 2022, 52, 53. [Google Scholar] [CrossRef] [PubMed]
- Mostafa, R.A.; Arnout, E.A.; Fotouh, M.M.A.E. Feasibility of Cone Beam Computed Tomography Radiomorphometric Analysis and Fractal Dimension in Assessment of Postmenopausal Osteoporosis in Correlation with Dual X-Ray Absorptiometry. Dentomaxillofacial Radiol. 2016, 45, 20160212. [Google Scholar] [CrossRef] [PubMed]
- Chrcanovic, B.R.; Albrektsson, T.; Wennerberg, A. Bone Quality and Quantity and Dental Implant Failure: A Systematic Review and Meta-Analysis. Int. J. Prosthodont. 2017, 30, 219–237. [Google Scholar] [CrossRef] [PubMed]
- Voumard, B.; Maquer, G.; Heuberger, P.; Zysset, P.K.; Wolfram, U. “Peroperative Estimation of Bone Quality and Primary Dental Implant Stability”. J. Mech. Behav. Biomed. Mater. 2019, 92, 24–32. [Google Scholar] [CrossRef] [PubMed]
- Magat, G.; Oncu, E.; Ozcan, S.; Orhan, K. Comparison of Cone-Beam Computed Tomography and Digital Panoramic Radiography for Detecting Peri-Implant Alveolar Bone Changes Using Trabecular Micro-Structure Analysis. J. Korean Assoc. Oral Maxillofac. Surg. 2022, 48, 41–49. [Google Scholar] [CrossRef] [PubMed]
- Tibúrcio-Machado, C.S.; Michelon, C.; Zanatta, F.B.; Gomes, M.S.; Marin, J.A.; Bier, C.A. The Global Prevalence of Apical Periodontitis: A Systematic Review and Meta-analysis. Int. Endod. J. 2021, 54, 712–735. [Google Scholar] [CrossRef]
- Antony, D.P.; Thomas, T.; Nivedhitha, M.S. Two-Dimensional Periapical, Panoramic Radiography Versus Three-Dimensional Cone-Beam Computed Tomography in the Detection of Periapical Lesion After Endodontic Treatment: A Systematic Review. Cureus 2020, 12, e7736. [Google Scholar] [CrossRef] [PubMed]
- PradeepKumar, A.R.; Shemesh, H.; Nivedhitha, M.S.; Hashir, M.M.J.; Arockiam, S.; Maheswari, T.N.U.; Natanasabapathy, V. Diagnosis of Vertical Root Fractures by Cone-Beam Computed Tomography in Root-Filled Teeth with Confirmation by Direct Visualization: A Systematic Review and Meta-Analysis. J. Endod. 2021, 47, 1198–1214. [Google Scholar] [CrossRef]
- Kocak, A.T.Ö.; Bulut, D.G. Measurement of the Trabecular Bone Structure of the TMJ Region in Patients with Transverse Maxillary Deficiency: A CBCT Fractal Analysis Study. Oral Surgery, Oral Med. Oral Pathol. Oral Radiol. 2021, 132, 352–360. [Google Scholar] [CrossRef]
- Pauwels, R.; Faruangsaeng, T.; Charoenkarn, T.; Ngonphloy, N.; Panmekiate, S. Effect of Exposure Parameters and Voxel Size on Bone Structure Analysis in CBCT. Dentomaxillofacial Radiol. 2015, 44, 20150078. [Google Scholar] [CrossRef] [PubMed]
- Hernandez, D.; Eldib, M.E.; Hegazy, M.A.A.; Cho, M.H.; Cho, M.H.; Lee, S.Y. A Head Motion Estimation Algorithm for Motion Artifact Correction in Dental CT Imaging. Phys. Med. Biol. 2018, 63, 065014. [Google Scholar] [CrossRef] [PubMed]
- Spin-Neto, R.; Wenzel, A. Patient Movement and Motion Artefacts in Cone Beam Computed Tomography of the Dentomaxillofacial Region: A Systematic Literature Review. Oral Surg. Oral Med. Oral Pathol. Oral Radiol. 2016, 121, 425–433. [Google Scholar] [CrossRef] [PubMed]
- Magat, G.; Sener, S.O. Evaluation of Trabecular Pattern of Mandible Using Fractal Dimension, Bone Area Fraction, and Gray Scale Value: Comparison of Cone-Beam Computed Tomography and Panoramic Radiography. Oral Radiol. 2018, 35, 35–42. [Google Scholar] [CrossRef]
- Kato, C.N.; Barra, S.G.; Tavares, N.P.; Amaral, T.M.; Brasileiro, C.B.; Mesquita, R.A.; Abreu, L.G. Use of Fractal Analysis in Dental Images: A Systematic Review. Dentomaxillofacial Radiol. 2020, 49, 20180457. [Google Scholar] [CrossRef]
- Southard, T.E.; Southard, K.A.; Jakobsen, J.R.; Hillis, S.L.; Najim, C.A. Fractal Dimension in Radiographic Analysis of Alveolar Process Bone. Oral Surg. Oral Med. Oral Pathol. Oral Radiol. Endodontology 1996, 82, 569–576. [Google Scholar] [CrossRef]
- Bianchi, A.E.; Dolci, G., Jr.; Sberna, M.T.; Sanfilippo, S. Factors affecting bone response around loaded titanium dental implants: A literature review. J. Appl. Biomater. Biomech. 2005, 3, 135–140. [Google Scholar]
- Geraets, W.G.; Van Der Stelt, P.F. Fractal Properties of Bone. Dentomaxillofac Radiol. 2000, 29, 144–153. [Google Scholar] [CrossRef] [PubMed]
- Perrotti, V.; Iezzi, G.; De Sanctis, A.; Pasculli, A.; Piattelli, A.; Aprile, G. Correlation Between Bone Density and Fractal Dimension: A Pilot Study. Nonlinear Phenom. Complex Syst. 2020, 23, 130–132. [Google Scholar] [CrossRef]
- Hsu, J.-T.; Wang, S.-P.; Huang, H.-L.; Chen, Y.-J.; Wu, J.; Tsai, M.-T. The Assessment of Trabecular Bone Parameters and Cortical Bone Strength: A Comparison of Micro-CT and Dental Cone-Beam CT. J. Biomech. 2013, 46, 2611–2618. [Google Scholar] [CrossRef]
- Van Dessel, J.; Huang, Y.; Depypere, M.; Rubira-Bullen, I.; Maes, F.; Jacobs, R. A Comparative Evaluation of Cone Beam CT and Micro-CT on Trabecular Bone Structures in the Human Mandible. Dentomaxillofacial Radiol. 2013, 42, 20130145. [Google Scholar] [CrossRef]
- Ibrahim, N.; Parsa, A.; Hassan, B.; Van Der Stelt, P.; Aartman, I.H.A.; Wismeijer, D. The Effect of Scan Parameters on Cone Beam CT Trabecular Bone Microstructural Measurements of the Human Mandible. Dentomaxillofacial Radiol. 2013, 42, 20130206. [Google Scholar] [CrossRef]
- Pauwels, R.; Silkosessak, O.; Jacobs, R.; Bogaerts, R.; Bosmans, H.; Panmekiate, S. A Pragmatic Approach to Determine the Optimal kVp in Cone Beam CT: Balancing Contrast-to-Noise Ratio and Radiation Dose. Dentomaxillofacial Radiol. 2014, 43, 20140059. [Google Scholar] [CrossRef] [PubMed]
- Pauwels, R.; Beinsberger, J.; Stamatakis, H.; Tsiklakis, K.; Walker, A.; Bosmans, H.; Bogaerts, R.; Jacobs, R.; Horner, K. Comparison of Spatial and Contrast Resolution for Cone-Beam Computed Tomography Scanners. Oral Surg. Oral Med. Oral Pathol. Oral Radiol. 2012, 114, 127–135. [Google Scholar] [CrossRef]
- Pauwels, R.; Araki, K.; Siewerdsen, J.H.; Thongvigitmanee, S.S. Technical Aspects of Dental CBCT: State of the Art. Dentomaxillofacial Radiol. 2015, 44, 20140224. [Google Scholar] [CrossRef] [PubMed]
- Sindeaux, R.; Figueiredo, P.T.d.S.; de Melo, N.S.; Guimarães, A.T.B.; Lazarte, L.; Pereira, F.B.; de Paula, A.P.; Leite, A.F. Fractal Dimension and Mandibular Cortical Width in Normal and Osteoporotic Men and Women. Maturitas 2014, 77, 142–148. [Google Scholar] [CrossRef]
- Alman, A.C.; Johnson, L.R.; Calverley, D.C.; Grunwald, G.K.; Lezotte, D.C.; Hokanson, J.E. Diagnostic Capabilities of Fractal Dimension and Mandibular Cortical Width to Identify Men and Women with Decreased Bone Mineral Density. Osteoporos. Int. 2011, 23, 1631–1636. [Google Scholar] [CrossRef]
- Franciotti, R.; Moharrami, M.; Quaranta, A.; Bizzoca, M.E.; Piattelli, A.; Aprile, G.; Perrotti, V. Use of Fractal Analysis in Dental Images for Osteoporosis Detection: A Systematic Review and Meta-Analysis. Osteoporos. Int. 2021, 32, 1041–1052. [Google Scholar] [CrossRef] [PubMed]
- Bachtler, R.; Walter, C.; Schulze, R.K.W. Fractal Dimension in CBCT Images as Predictor for MRONJ: A Retrospective Cohort Study. Clin. Oral Investig. 2020, 25, 2113–2118. [Google Scholar] [CrossRef] [PubMed]
- Torres, S.; Chen, C.; Leroux, B.; Lee, P.; Hollender, L.; Schubert, M. Fractal Dimension Evaluation of Cone Beam Computed Tomography in Patients with Bisphosphonate-Associated Osteonecrosis. Dentomaxillofacial Radiol. 2011, 40, 501–505. [Google Scholar] [CrossRef]
- Kato, C.d.N.A.d.O.; Barra, S.G.; Abreu, L.G.; Machado, V.C.; Pinheiro, J.d.J.V.; Henriques, J.A.S.; Castro, W.H.; Brasileiro, C.B.; Mesquita, R.A. Fractal Analysis of Fibrous Dysplasia and Ossifying Fibroma in 2D and 3D CBCT Images. J. Oral Maxillofac. Surgery, Med. Pathol. 2022, 34, 791–799. [Google Scholar] [CrossRef]


| Site | Group | N | Mean | Std. Deviation | Std. Error | 95% Confidence Interval for Mean | Minimum | Maximum | p Value in Comparison to Group 1 | p Value in Comparison to Group 2 | |
|---|---|---|---|---|---|---|---|---|---|---|---|
| Lower Bound | Upper Bound | ||||||||||
| Site 1 [RM] | 1 | 10 | 1.166 | 0.029 | 0.009 | 1.145 | 1.187 | 1.122 | 1.206 | - | 0.975 |
| 2 | 10 | 1.136 | 0.027 | 0.009 | 1.116 | 1.155 | 1.104 | 1.193 | 0.975 | - | |
| 3 | 10 | 1.133 | 0.059 | 0.019 | 1.090 | 1.175 | 1.041 | 1.222 | 0.959 | 1.000 | |
| 4 | 10 | 1.140 | 0.060 | 0.019 | 1.097 | 1.183 | 1.039 | 1.218 | 0.989 | 1.000 | |
| 5 | 10 | 1.156 | 0.047 | 0.015 | 1.123 | 1.190 | 1.071 | 1.215 | 1.000 | 0.997 | |
| 6 | 10 | 1.139 | 0.039 | 0.012 | 1.111 | 1.167 | 1.088 | 1.188 | 0.988 | 1.000 | |
| 7 | 10 | 1.044 | 0.137 | 0.043 | 0.946 | 1.142 | 0.785 | 1.241 | 0.005 | 0.082 | |
| 8 | 10 | 1.109 | 0.087 | 0.027 | 1.047 | 1.171 | 0.943 | 1.238 | 0.604 | 0.990 | |
| Total | 80 | 1.128 | 0.075 | 0.008 | 1.111 | 1.145 | 0.785 | 1.241 | |||
| Site | Group | N | Mean | Std. Deviation | Std. Error | 95% Confidence Interval for Mean | Minimum | Maximum | p Value in Comparison to Group 1 | p Value in Comparison to Group 2 | |
|---|---|---|---|---|---|---|---|---|---|---|---|
| Lower Bound | Upper Bound | ||||||||||
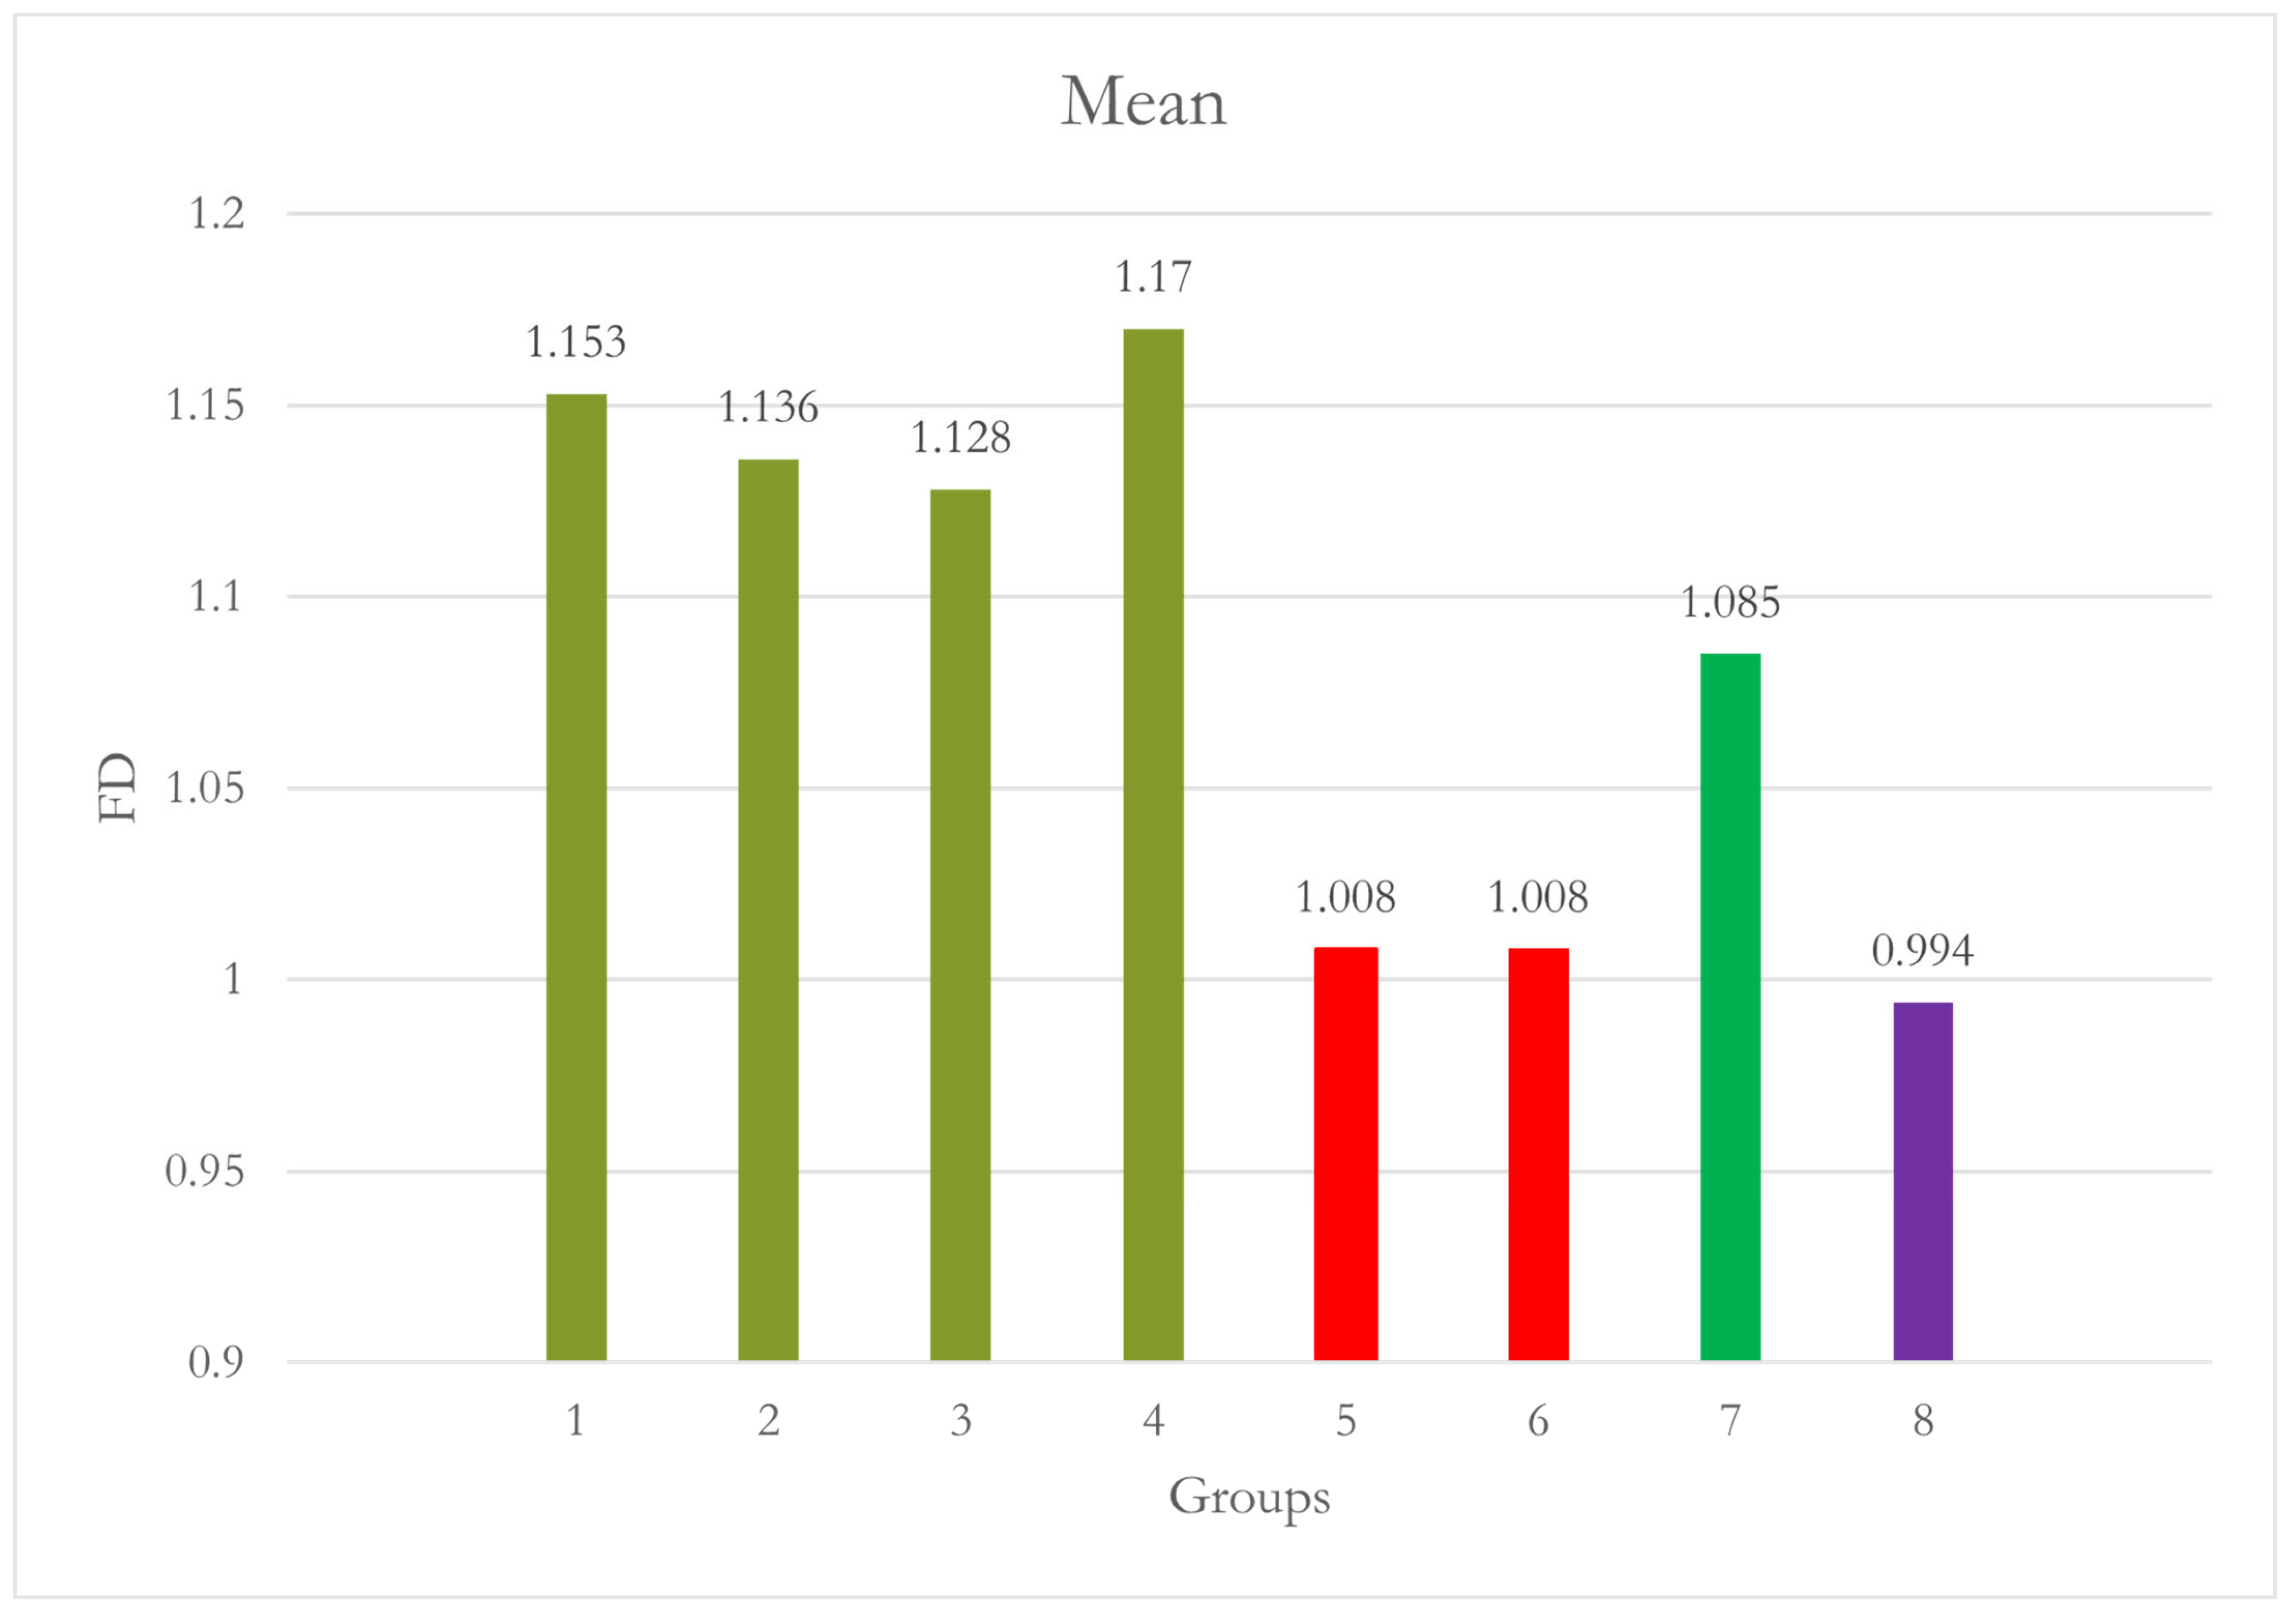
| Site 2 RPM | 1 | 10 | 1.153 | 0.025 | 0.008 | 1.135 | 1.171 | 1.116 | 1.185 | - | 1.000 |
| 2 | 10 | 1.136 | 0.025 | 0.008 | 1.118 | 1.154 | 1.093 | 1.161 | 1.000 | - | |
| 3 | 10 | 1.128 | 0.084 | 0.027 | 1.068 | 1.189 | 0.964 | 1.237 | 0.996 | 1.000 | |
| 4 | 10 | 1.170 | 0.022 | 0.007 | 1.153 | 1.186 | 1.142 | 1.208 | 1.000 | 0.976 | |
| 5 | 10 | 1.008 | 0.077 | 0.024 | 0.953 | 1.063 | 0.845 | 1.136 | 0.002 | 0.009 | |
| 6 | 10 | 1.008 | 0.103 | 0.033 | 0.934 | 1.082 | 0.792 | 1.167 | 0.002 | 0.009 | |
| 7 | 10 | 1.085 | 0.092 | 0.029 | 1.019 | 1.151 | 0.950 | 1.197 | 0.505 | 0.818 | |
| 8 | 10 | 0.994 | 0.115 | 0.036 | 0.912 | 1.077 | 0.823 | 1.199 | <0.001 | 0.002 | |
| Total | 80 | 1.085 | 0.100 | 0.011 | 1.063 | 1.107 | 0.792 | 1.237 | |||
| Site | Group | N | Mean | Std. Deviation | Std. Error | 95% Confidence Interval for Mean | Minimum | Maximum | p Value in Comparison to Group 1 | p Value in Comparison to Group 2 | |
|---|---|---|---|---|---|---|---|---|---|---|---|
| Lower Bound | Upper Bound | ||||||||||
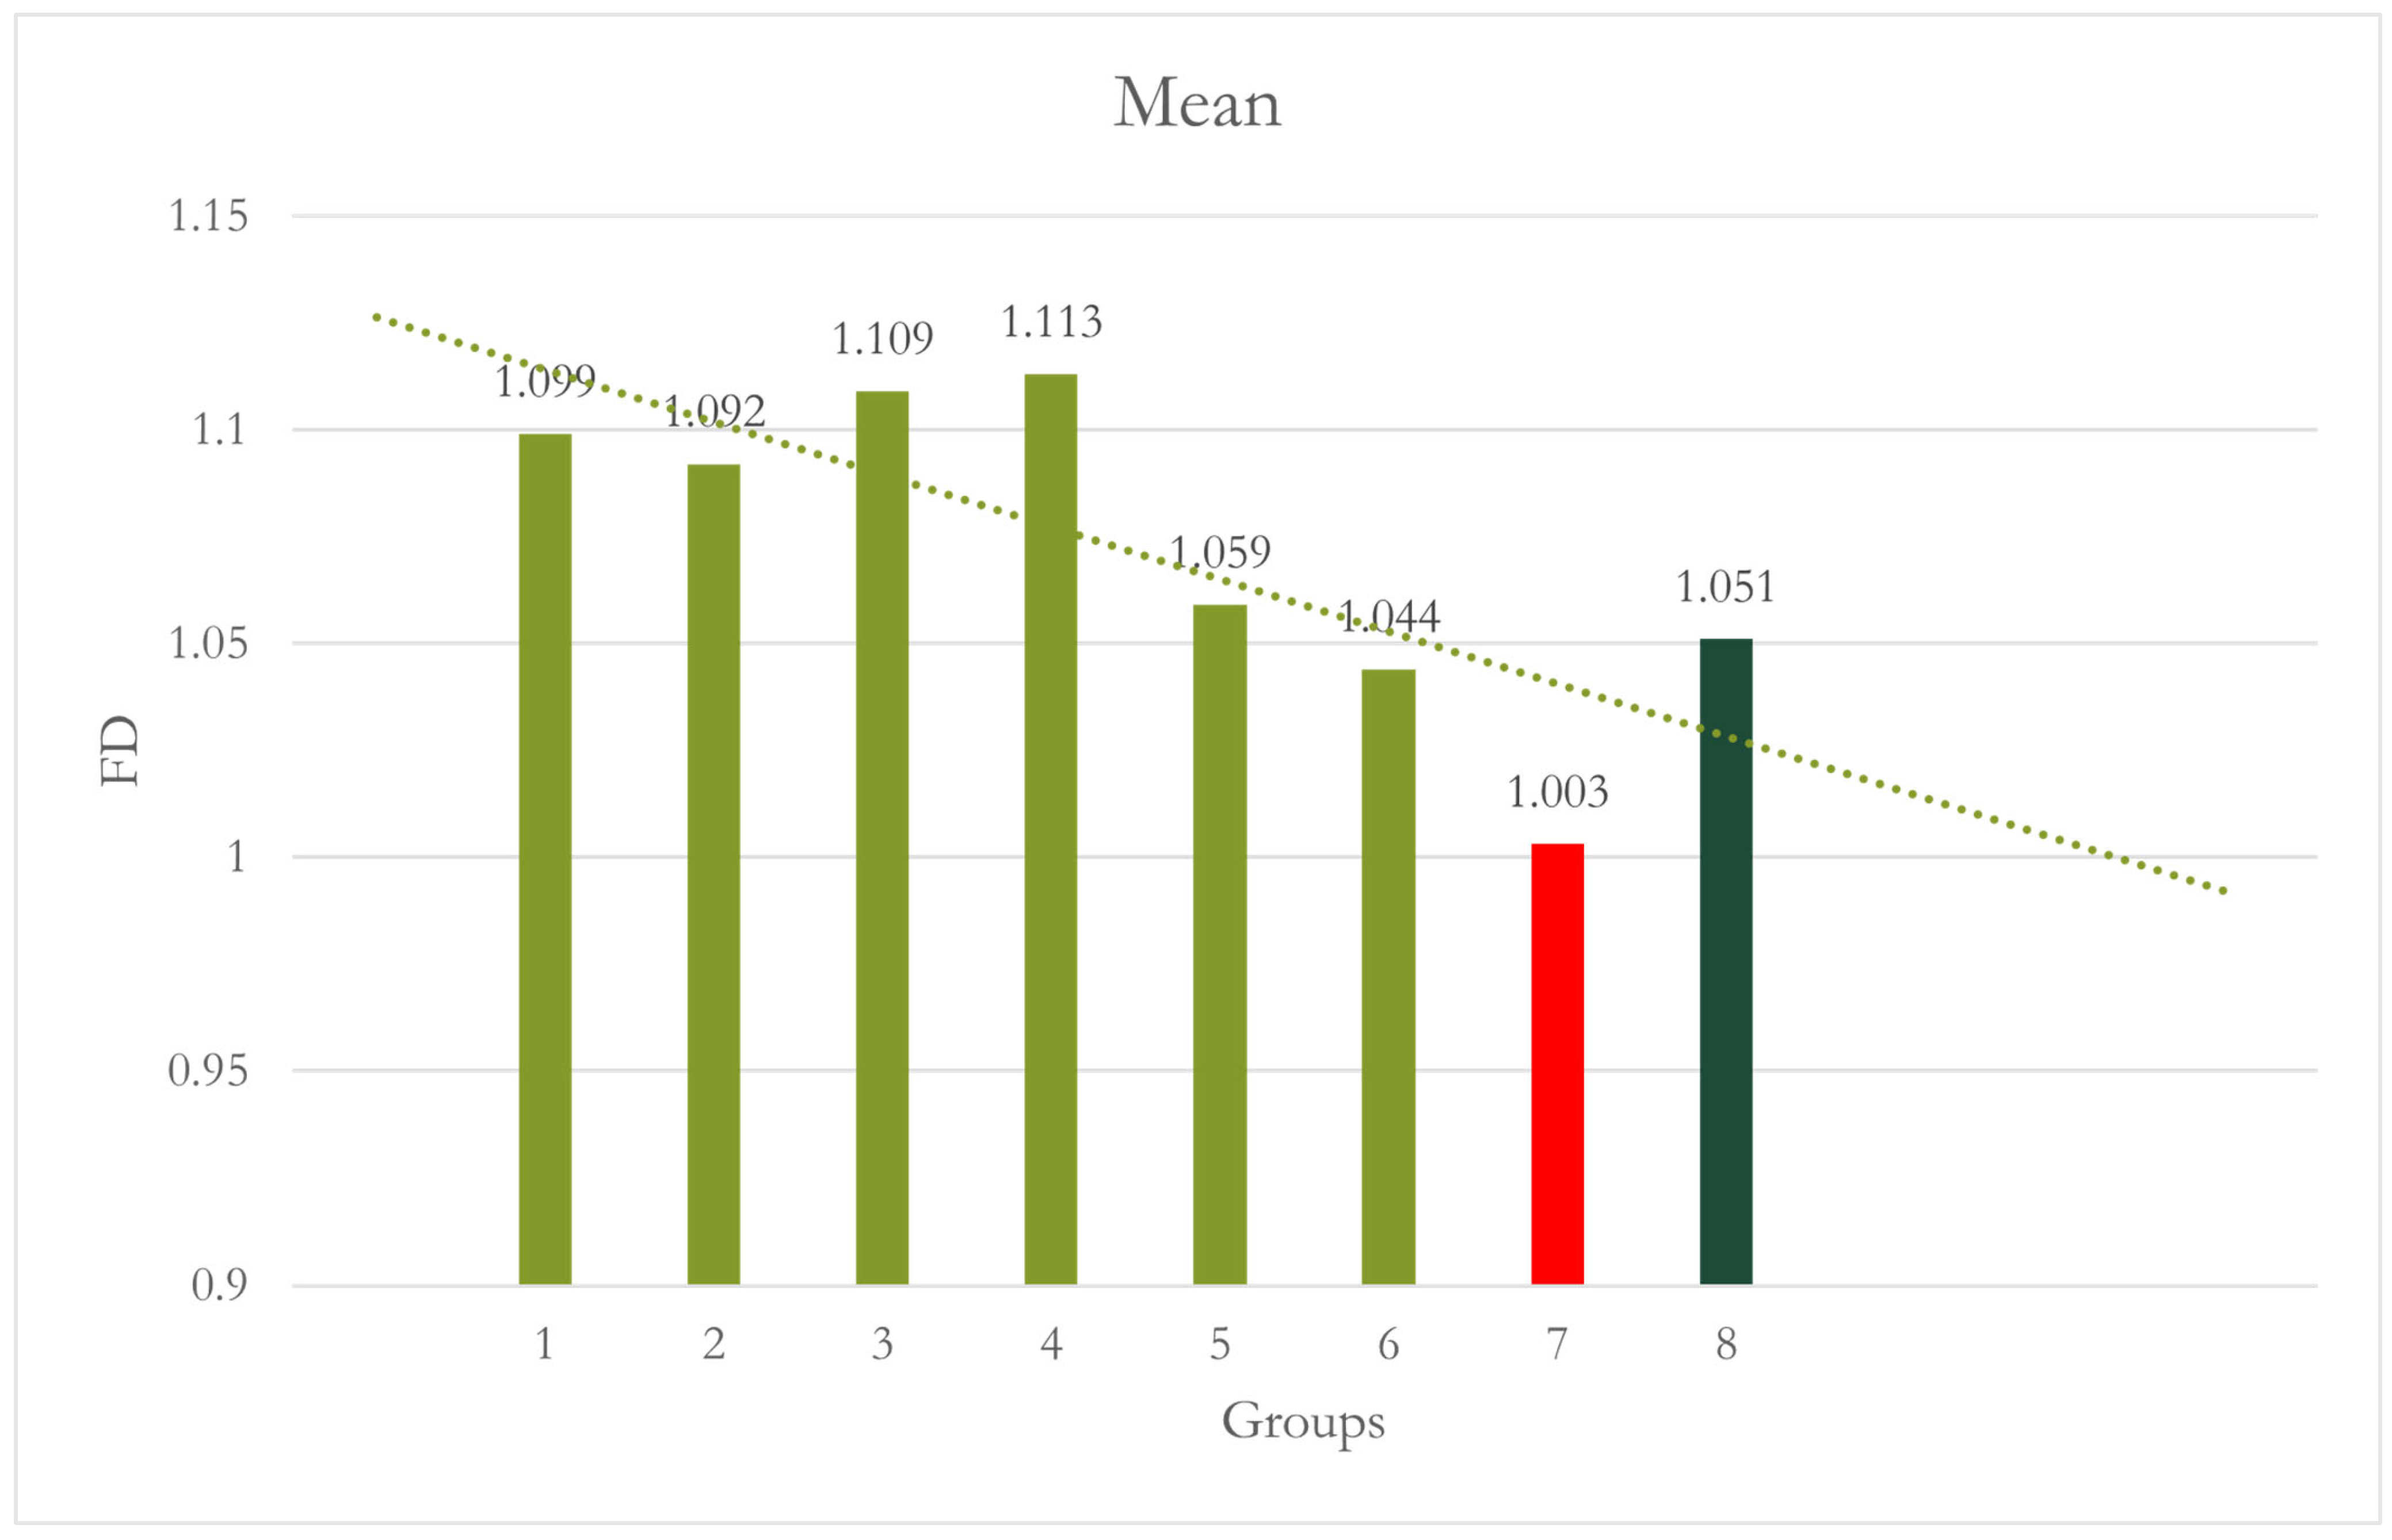
| Site 3 Anterior | 1 | 10 | 1.099 | 0.023 | 0.007 | 1.082 | 1.115 | 1.055 | 1.127 | - | 1.000 |
| 2 | 10 | 1.092 | 0.031 | 0.010 | 1.070 | 1.115 | 1.039 | 1.140 | 1.000 | - | |
| 3 | 10 | 1.109 | 0.030 | 0.009 | 1.088 | 1.130 | 1.067 | 1.149 | 1.000 | 0.992 | |
| 4 | 10 | 1.113 | 0.022 | 0.007 | 1.097 | 1.129 | 1.084 | 1.146 | 0.997 | 0.975 | |
| 5 | 10 | 1.059 | 0.067 | 0.021 | 1.011 | 1.107 | 0.959 | 1.162 | 0.538 | 0.734 | |
| 6 | 10 | 1.044 | 0.063 | 0.020 | 0.999 | 1.089 | 0.924 | 1.105 | 0.152 | 0.277 | |
| 7 | 10 | 1.003 | 0.064 | 0.020 | 0.957 | 1.049 | 0.892 | 1.097 | <0.001 | 0.001 | |
| 8 | 10 | 1.051 | 0.036 | 0.011 | 1.025 | 1.076 | 1.000 | 1.116 | 0.287 | 0.464 | |
| Total | 80 | 1.071 | 0.057 | 0.006 | 1.058 | 1.084 | 0.892 | 1.162 | |||
| Site | Group | N | Mean | Std. Deviation | Std. Error | 95% Confidence Interval for Mean | Minimum | Maximum | p Value in Comparison to Group 1 | p Value in Comparison to Group 2 | |
|---|---|---|---|---|---|---|---|---|---|---|---|
| Lower Bound | Upper Bound | ||||||||||
| Site 4 LPM | 1 | 10 | 1.045 | 0.045 | 0.014 | 1.012 | 1.077 | 0.976 | 1.095 | - | 1.000 |
| 2 | 10 | 1.054 | 0.051 | 0.016 | 1.018 | 1.090 | 0.977 | 1.122 | 1.000 | - | |
| 3 | 10 | 1.132 | 0.065 | 0.021 | 1.085 | 1.179 | 0.993 | 1.214 | 0.086 | 0.176 | |
| 4 | 10 | 1.126 | 0.100 | 0.032 | 1.054 | 1.198 | 0.989 | 1.259 | 0.138 | 0.263 | |
| 5 | 10 | 1.133 | 0.047 | 0.015 | 1.099 | 1.166 | 1.069 | 1.223 | 0.083 | 0.170 | |
| 6 | 10 | 1.159 | 0.044 | 0.014 | 1.128 | 1.191 | 1.073 | 1.215 | 0.007 | 0.017 | |
| 7 | 10 | 1.027 | 0.063 | 0.020 | 0.982 | 1.072 | 0.882 | 1.104 | 0.999 | 0.984 | |
| 8 | 10 | 1.100 | 0.096 | 0.030 | 1.031 | 1.168 | 0.938 | 1.209 | 0.604 | 0.799 | |
| Total | 80 | 1.097 | 0.079 | 0.009 | 1.079 | 1.114 | 0.882 | 1.259 | |||
| Site | Group | N | Mean | Std. Deviation | Std. Error | 95% Confidence Interval for Mean | Minimum | Maximum | p Value in Comparison to Group 1 | p Value in Comparison to Group 2 | |
|---|---|---|---|---|---|---|---|---|---|---|---|
| Lower Bound | Upper Bound | ||||||||||
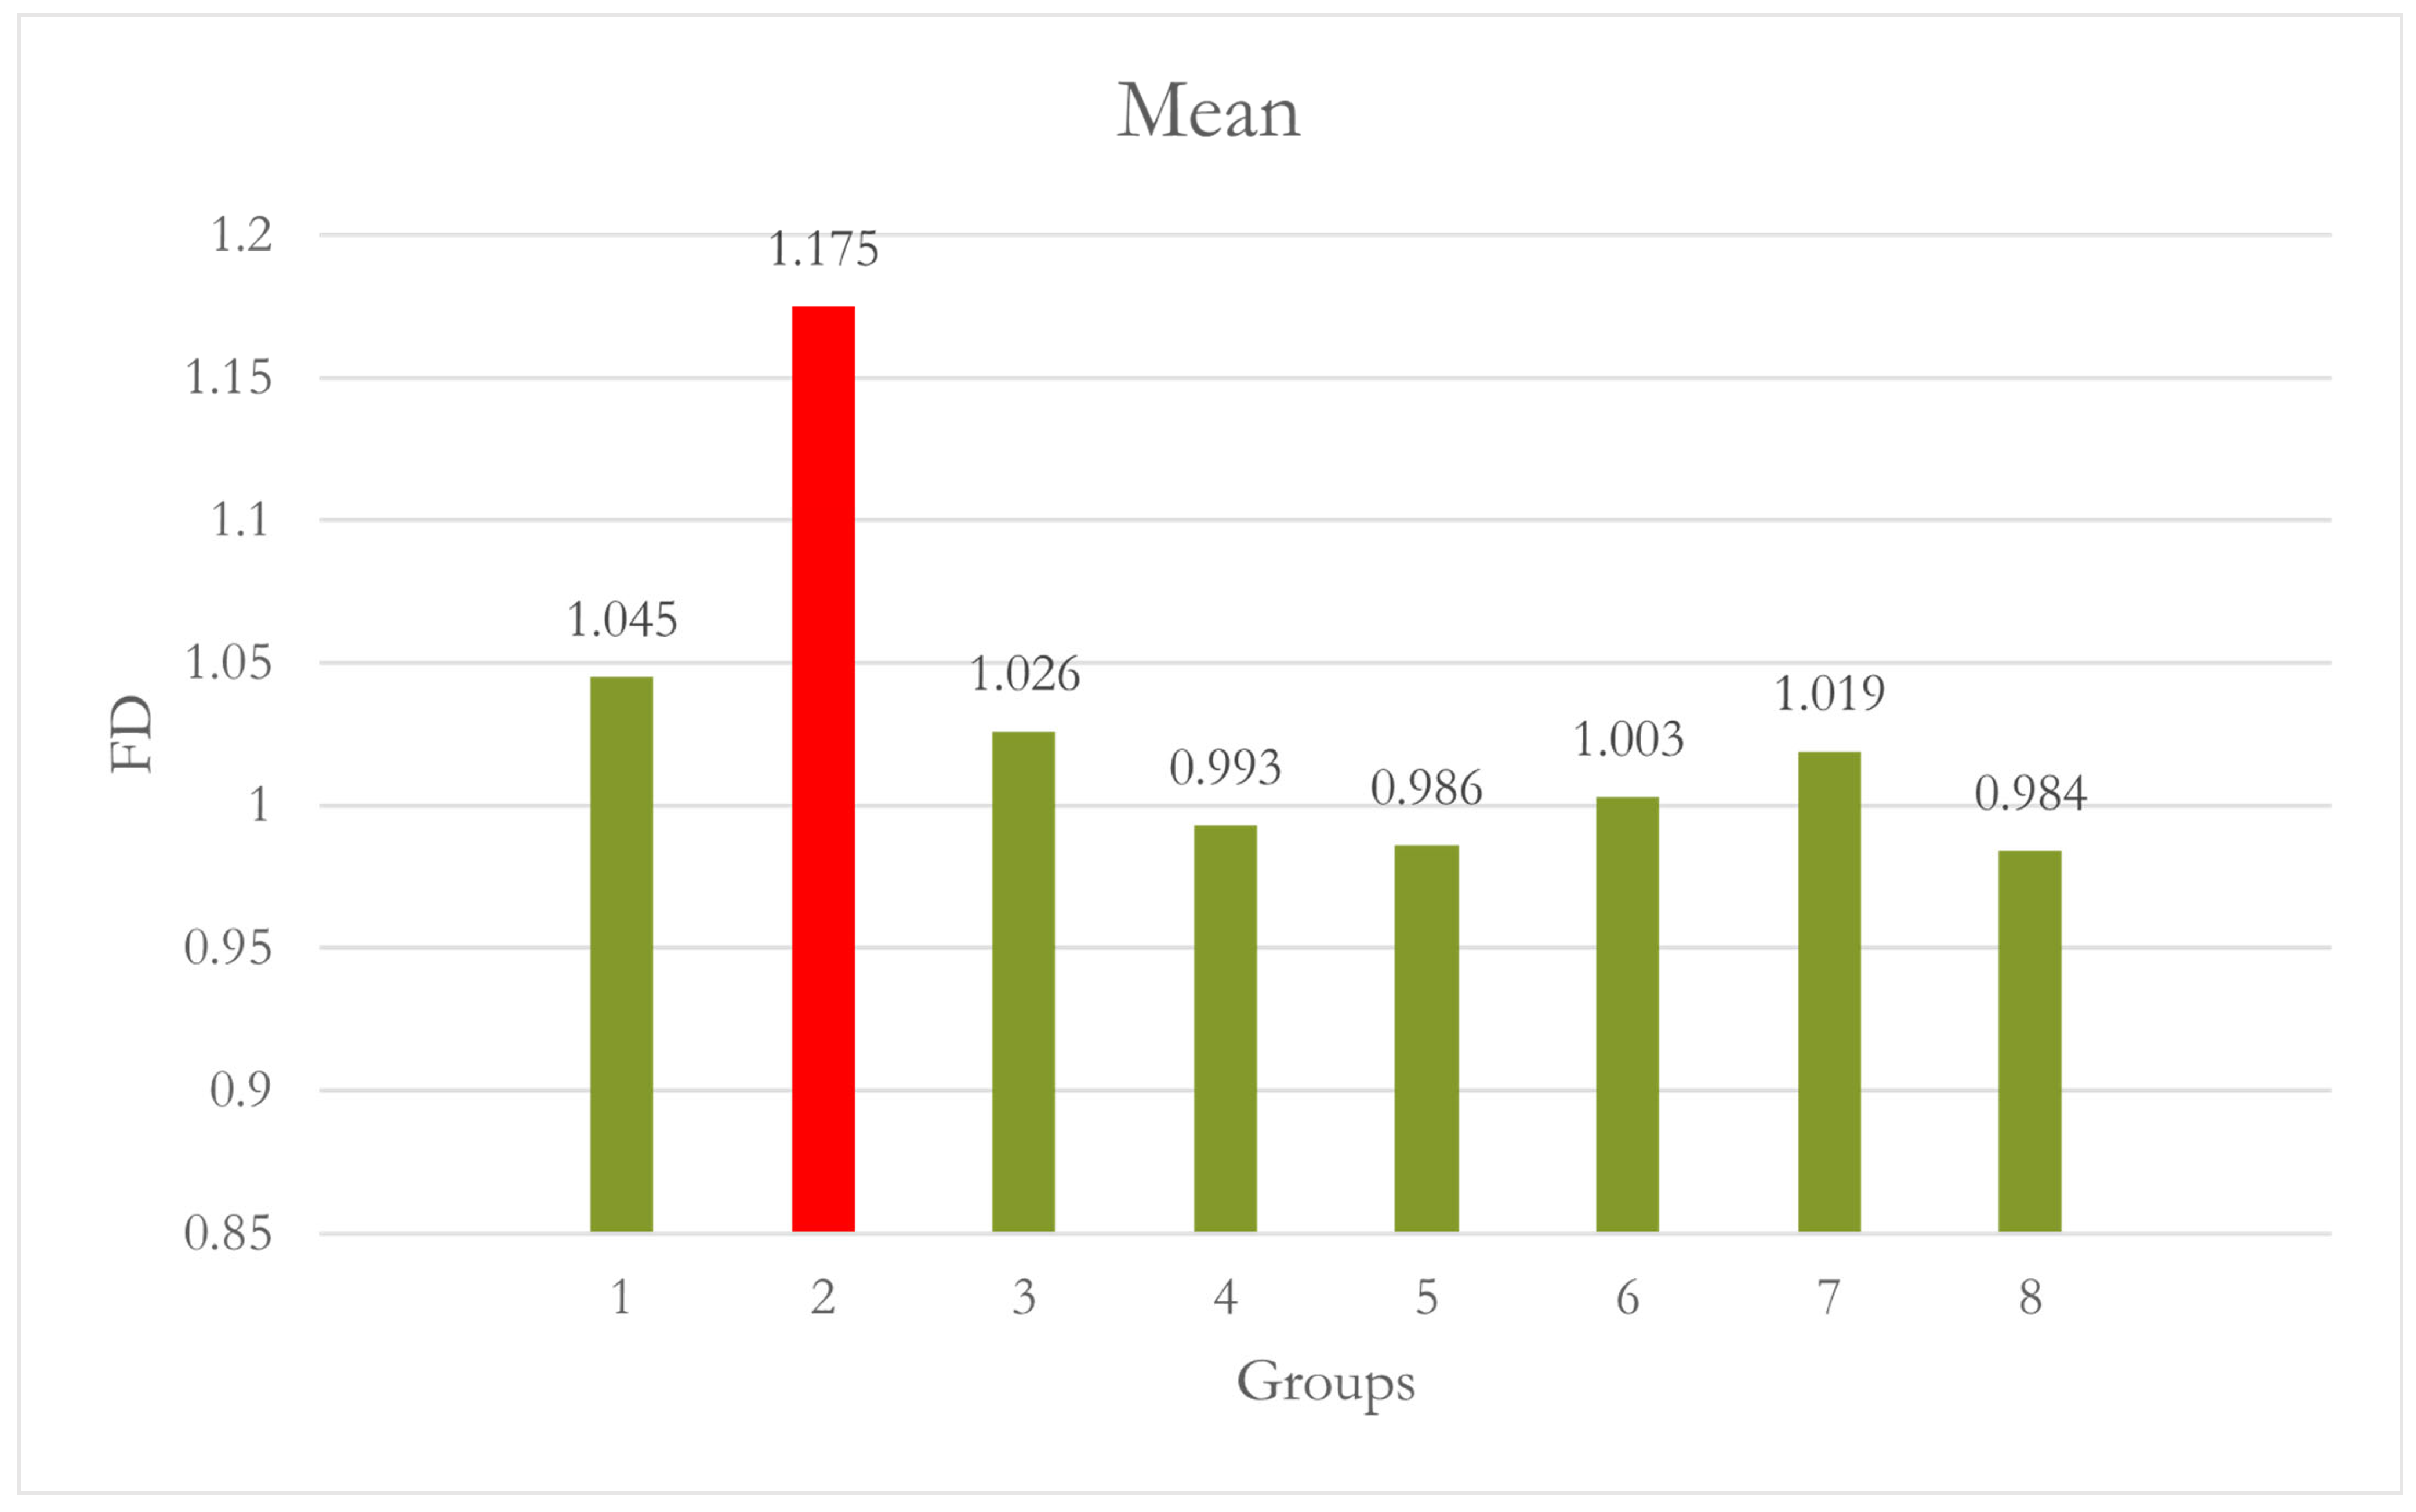
| Site 5 LM | 1 | 10 | 1.045 | 0.162 | 0.051 | 0.929 | 1.161 | 0.882 | 1.292 | - | 0.040 |
| 2 | 10 | 1.175 | 0.125 | 0.040 | 1.086 | 1.265 | 0.971 | 1.269 | 0.040 | - | |
| 3 | 10 | 1.026 | 0.094 | 0.030 | 0.959 | 1.093 | 0.949 | 1.265 | 1.000 | 0.010 | |
| 4 | 10 | 0.993 | 0.040 | 0.013 | 0.965 | 1.022 | 0.936 | 1.050 | 0.908 | 0.001 | |
| 5 | 10 | 0.986 | 0.048 | 0.015 | 0.952 | 1.021 | 0.920 | 1.052 | 0.838 | <0.001 | |
| 6 | 10 | 1.003 | 0.063 | 0.020 | 0.958 | 1.048 | 0.896 | 1.086 | 0.968 | 0.002 | |
| 7 | 10 | 1.019 | 0.068 | 0.021 | 0.970 | 1.067 | 0.928 | 1.118 | 0.998 | 0.006 | |
| 8 | 10 | 0.984 | 0.056 | 0.018 | 0.945 | 1.024 | 0.917 | 1.051 | 0.813 | <0.001 | |
| Total | 80 | 1.029 | 0.105 | 0.012 | 1.006 | 1.052 | 0.882 | 1.292 | |||
| Group | N | Mean | Std. Deviation | Std. Error | 95% Confidence Interval for Mean | Minimum | Maximum | p Value in Comparison to Group 1 | p Value in Comparison to Group 2 | |
|---|---|---|---|---|---|---|---|---|---|---|
| Lower Bound | Upper Bound | |||||||||
| 1 | 10 | 1.0604 | 0.15871 | 0.05019 | 0.9469 | 1.1739 | 0.86 | 1.29 | - | 0.997 |
| 2 | 10 | 1.0527 | 0.02951 | 0.00933 | 1.0316 | 1.0738 | 1.01 | 1.09 | 0.997 | - |
| 3 | 10 | 0.9808 | 0.03282 | 0.01038 | 0.9573 | 1.0043 | 0.94 | 1.04 | 0.187 | 0.265 |
| 4 | 10 | 0.9196 | 0.05350 | 0.01692 | 0.8813 | 0.9579 | 0.83 | 1.01 | 0.005 | 0.008 |
| Total | 80 | 1.0034 | 0.10154 | 0.01605 | 0.9709 | 1.0358 | 0.83 | 1.29 | ||
Disclaimer/Publisher’s Note: The statements, opinions and data contained in all publications are solely those of the individual author(s) and contributor(s) and not of MDPI and/or the editor(s). MDPI and/or the editor(s) disclaim responsibility for any injury to people or property resulting from any ideas, methods, instructions or products referred to in the content. |
© 2024 by the authors. Licensee MDPI, Basel, Switzerland. This article is an open access article distributed under the terms and conditions of the Creative Commons Attribution (CC BY) license (https://creativecommons.org/licenses/by/4.0/).
Share and Cite
Khubrani, Y.H.; Geha, H.; Katkar, R.A.; Maghsoodi-Zahedi, T.; Moore, W.; Abdelkarim, A.Z. Efficacy of the CALM® Algorithm in Reducing Motion-Induced Artifacts in CBCT Imaging: A Fractal Dimension Analysis of Trabecular Bone. Dent. J. 2024, 12, 262. https://doi.org/10.3390/dj12080262
Khubrani YH, Geha H, Katkar RA, Maghsoodi-Zahedi T, Moore W, Abdelkarim AZ. Efficacy of the CALM® Algorithm in Reducing Motion-Induced Artifacts in CBCT Imaging: A Fractal Dimension Analysis of Trabecular Bone. Dentistry Journal. 2024; 12(8):262. https://doi.org/10.3390/dj12080262
Chicago/Turabian StyleKhubrani, Yahia H., Hassem Geha, Rujuta A. Katkar, Taraneh Maghsoodi-Zahedi, William Moore, and Ahmed Z. Abdelkarim. 2024. "Efficacy of the CALM® Algorithm in Reducing Motion-Induced Artifacts in CBCT Imaging: A Fractal Dimension Analysis of Trabecular Bone" Dentistry Journal 12, no. 8: 262. https://doi.org/10.3390/dj12080262