Abstract
For controlling pesticide residues in food and ensuring food safety, multiresidue methods that can monitor a wide range of pesticides in various types of foods are required for regulatory monitoring. In this study, to demonstrate the applicability of liquid chromatography–quadrupole time-of-flight mass spectrometry (LC–QTOF-MS) for quantitative and confirmatory analysis of pesticide residues in cereal grains and legumes, the LC–QTOF-MS method using full-scan acquisition was validated for 151 pesticides in brown rice, soybeans, and peanuts at a spiked level of 0.01 mg/kg. With the exception of 5 out of 151 target pesticides, sufficiently high signal intensities were obtained at 0.005 μg/mL (corresponding to 0.01 mg/kg). Trueness was in the range 70–95%, with intra- and inter-day precisions below 16% and 24%, respectively, with the exception of 7 pesticides in brown rice, 10 pesticides in soybeans, and 9 pesticides in peanuts. No interfering peaks were observed near the retention times of the target pesticides. Furthermore, information on accurate fragment-ion masses obtained by a data-independent acquisition enabled unambiguous confirmation. The results suggest that the LC-QTOF-MS method is suitable for pesticide residues’ analysis of cereal grains and legumes, and can be utilized for regulatory routine analysis.
1. Introduction
Pesticides are used worldwide to increase crop yields by protecting crops from pests, including insects, rodents, fungi, and weeds; however, the intake of pesticide residues contained in foods may adversely affect human health [1]. To ensure food safety and protect consumer health, international organizations such as the Codex Alimentarius Commission, established by the Food and Agriculture Organization of the United Nations (FAO) and the World Health Organization (WHO), and the European Union (EU), as well as many individual countries, including Japan, have established maximum residue limits (MRLs) to regulate pesticide residue levels in foods. In Japan, MRLs are currently established for various foods with respect to more than 750 agricultural compounds, i.e., pesticides, veterinary drugs, and feed additives. Therefore, the need for multiresidue methods, which detect a wide range of pesticides in various types of foods, is increasing in laboratories concerned with the regulatory monitoring of pesticide residues.
Nowadays, liquid chromatography (LC) and gas chromatography (GC) coupled with triple quadrupole mass spectrometry (MS/MS) operated in selected reaction monitoring (SRM) mode are the most widely used techniques for analyzing pesticide residues in foods. They are highly sensitive and selective, which enables the robust quantification of trace amounts of pesticide residues in complex matrices. In recent years, LC and GC coupled with high-resolution mass spectrometry (HR-MS) methods, such as time-of-flight (TOF)-MS, quadrupole-TOF-MS (QTOF-MS), Orbitrap-MS, and quadrupole-Orbitrap-MS (QOrbitrap-MS) have also been employed for the screening and quantification of pesticide residues [2,3,4,5,6,7,8,9,10,11,12,13,14]. LC and GC coupled with HR-MS operating in full-scan mode with high mass accuracy have several advantages over LC–MS/MS and GC–MS/MS operating in SRM mode: (1) There are no limits on the number of target compounds that can be analyzed simultaneously [7,8]. (2) The optimization of MS parameters, for example, SRM transitions, cone voltage, or collision energy, for individual analytes is not needed [8,14]. (3) The adjustment of retention time windows for the target analytes is not required even if the mobile phase or analytical column is changed. (4) The methods allow retrospective analysis for nontarget or unknown compounds by reprocessing previously acquired data without re-injection of the samples [15,16,17]. Furthermore, hybrid HR-MS, such as QTOF-MS and QOrbitrap-MS, offer fragment-ion information, which could be used for confirmation purposes [2,11,18]. Accordingly, numerous methods based on LC or GC coupled with HR-MS have been published recently for analyzing pesticide residues in vegetables and fruits [3,4,5,8,9,10,11,13,14]. In our previous work, we reported the quantitative analyses of pesticide residues in tea [19] using LC–QTOF-MS and LC–Orbitrap-MS. However, to the best of our knowledge, few papers have reported the application and validation of LC coupled with HR-MS for the quantitative analysis of pesticide residues in cereal grains and legumes, such as rice, soybeans, and peanuts. Cereal grains and legumes comprise complex matrices, containing high amounts of lipids and/or starch, which can potentially interfere with the analyses and cause matrix effects. Therefore, they are considered to be difficult matrices for the analysis of trace amounts of pesticide residues [20].
The aim of the current study is to evaluate the applicability of LC–QTOF-MS for the quantitative analyses of pesticide residues in cereal grains and legumes containing high amounts of lipids and/or starch. Brown rice, soybeans, and peanuts are selected as representative foods, and the LC–QTOF-MS method is validated for 151 pesticides at a concentration of 0.01 mg/kg. In addition, data-independent acquisition (DIA) is carried out to obtain information regarding the fragment ions, and to demonstrate the capability of LC–QTOF-MS for confirmative analyses.
2. Materials and Methods
2.1. Reagents and Chemicals
Pesticide analytical grade toluene and acetonitrile, LC-MS grade water, and methanol were obtained from Kanto Chemical (Tokyo, Japan). Diatomaceous earth (Celite® 545), analytical grade ammonium acetate, dipotassium hydrogen phosphate, potassium dihydrogen phosphate, and pesticide analytical grade sodium chloride were purchased from FUJIFILM Wako Pure Chemical (Osaka, Japan).
Pesticide standards, except for aramite and etrimfos, were procured from Hayashi Pure Chemical (Osaka, Japan), Kanto Chemical, FUJIFILM Wako Pure Chemical, Dr. Ehrenstorfer (Augsburg, Germany), Riedel-de Haën (Seelze, Germany), and Sigma-Aldrich (St. Louis, MO, USA). Stock standard solutions of each pesticide were prepared in acetonitrile or methanol, depending on their solubility, at a concentration of 1 mg/mL. Standard solutions (100 μg/mL in methanol) of aramite and etrimfos were obtained from AccuStandard (New Haven, CT, USA). A mixed standard solution (1 μg/mL) was prepared by mixing the stock standard solutions and diluting with acetonitrile.
Leucine–enkephalin, used as a reference compound in LC–QTOF-MS analyses, was obtained from Waters (Milford, MA, USA). A 1-μg/mL leucine–enkephalin standard solution was prepared in methanol/water (1:1, v/v).
2.2. Materials
Brown rice and soybeans were purchased from a local market in Tokyo (Japan), and peanuts cultivated in Chiba (Japan) were obtained via the Internet. Brown rice and soybeans were ground using a centrifugal mill (Ultra Centrifugal Mill ZM 200; Retsch, Haan, Germany). Peanuts were milled using a laboratory mill (SCM-40A, Shibata, Japan).
Tandem graphitized carbon black (GCB)/primary secondary amine (PSA) cartridges (InertSep GC/PSA, 500 mg/500 mg) were bought from GL Sciences (Tokyo, Japan) and octadecylsilyl silica gel (ODS) cartridges (Mega Bond Elut C18, 1000 mg) were purchased from Agilent Technologies (Palo Alto, CA, USA).
2.3. Apparatus
LC–QTOF-MS analyses were performed using an Acquity UPLC I-class system (Waters) coupled to a Xevo G2-S QTOF mass spectrometer (Waters). The chromatographic separation was carried out using an Inertsil ODS-4 column (100 × 2.1 mm, 2 μm; GL Sciences). The mobile phases consisted of 5 mmol/L ammonium acetate in water (A) and 5 mmol/L ammonium acetate in methanol (B). The mobile phase was pumped at a flow rate of 0.3 mL/min with the following gradient profile: 5% B followed by increasing B to 95% at 10 min and holding it at this concentration for 3 min, increasing to 100% at 13.01 min and holding for 5 min, and finally, returning to 5% at 18.01 min. The column temperature was set to 40 °C. The injection volume was 3 μL. The retention times of the target pesticides are presented in Table 1.

Table 1.
Elemental composition, retention time, and calculated exact mass of the target pesticides.
The QTOF mass spectrometer was operated in resolution mode, providing a resolving power of >30,000 at full width at half maximum (FWHM), at m/z 556.2766. The following MS conditions were used: ionization mode, electrospray ionization in positive mode (ESI(+)); scan range, m/z 50–1000; source temperature, 120 °C; desolvation gas temperature, 450 °C; capillary voltage, 1000 V; cone voltage, 20 V; collision energy, low energy (4 eV) and high energy (ramp from 10 to 40 eV); desolvation gas (nitrogen), 800 L/h; cone gas (nitrogen), 50 L/h; collision gas, argon. Leucine–enkephalin (m/z 556.2766) was used as a reference compound, being introduced from a lock spray probe during analyses. The mass window of ±5 mDa was used for the extraction of chromatograms for each target pesticide. The calculated exact mass and retention time for each pesticide are summarized in Table 1.
2.4. Sample Preparation
Samples were prepared according to the official Japanese multiresidue method, namely, “Multi-residue Method I for Agricultural Chemicals by LC-MS (Agricultural Products),” except for the use of a tandem GCB/PSA cartridge instead of a GCB/aminopropylsilyl silica gel (NH2) cartridge for cleanup.
A 10.0 g sample was weighed in a glass tube and water (20 mL) was added; subsequently, it was left to stand for 30 min. Acetonitrile (50 mL) was added to the mixture; then it was homogenized using a homogenizer (Polytron PT 10–35 GT; Kinematica, Lucerne, Switzerland) for 1 min. The homogenate was filtered with suction, and then the residue was rehomogenized with acetonitrile (20 mL) before being filtered with suction. The filtrates were combined, and the resulting volume was adjusted to 100 mL by the addition of acetonitrile.
A 20 mL aliquot of the extract was added to a 50 mL polypropylene (PP) centrifuge tube containing sodium chloride (10 g) and phosphate buffer (pH 7.0, 0.5 mol/L). The mixture was shaken for 5 min by a shaker (SR-2w; Taitec, Saitama, Japan) and centrifuged for 5 min at 3000 rpm (Centrifuge 8100, Kubota, Japan). The resultant acetonitrile layer was loaded onto an ODS cartridge, which was preconditioned with acetonitrile (10 mL), and then eluted with acetonitrile (5 mL). The resultant eluates were combined and concentrated to approximately 0.5 mL by a rotary evaporator (NVC-2100/N-1000, Eyela, Tokyo, Japan) at <40 °C; it was then dried by evaporation under a nitrogen stream. The residue was redissolved in acetonitrile/toluene (3:1, v/v, 2 mL) and loaded onto a GCB/PSA cartridge, which was preconditioned with acetonitrile/toluene (3:1, v/v, 10 mL) and then eluted with acetonitrile/toluene (3:1, v/v, 20 mL). The eluate was concentrated to approximately 0.5 mL by a rotary evaporator at <40 °C and evaporated to dryness under a nitrogen stream; finally, the resultant residue was redissolved in methanol (4 mL) prior to LC–QTOF-MS analysis.
2.5. Method Validation
The LC–QTOF-MS method was validated using a nested experimental design for brown rice, soybeans, and peanuts. Samples were spiked in duplicate at a level of 0.01 mg/kg, and the recovery experiments were repeated on five different days. To prepare the spiked samples, a 1 mL aliquot of the 0.1 μg/mL mixed standard solution was added to 10.0 g of sample, and the mixture was allowed to stand for 30 min before proceeding with the subsequent sample preparation steps. The quantification was carried out using six-point calibration curves with solvent-based standard solutions prepared in methanol. The concentrations of the standard solutions used to construct the calibration curves, to allow quantification, were 0.00125, 0.0025, 0.00375, 0.005, 0.00625, and 0.0075 μg/mL. The linearity of each calibration curve over a wider range was examined in the range of 0.002–0.1 μg/mL.
Matrix-matched standards were prepared by evaporating a 100 μL aliquot of blank solution under a nitrogen stream and then redissolving it in 100 μL of the mixed standard solution in methanol. Matrix effects were evaluated by comparing peak areas of the matrix-matched standards with standards in solvents as follows: average peak area (n = 5) of matrix-matched standard/average peak area (n = 5) of standard in solvent.
3. Results and Discussion
3.1. Optimization of LC–QTOF-MS Conditions
A total of 151 LC-amenable pesticides, which had molecular weights from 189 to 746, were selected as target pesticides for this study. Because most of the target pesticides produced high-intensity signals under positive-mode operation of the instrument (c.f., negative-mode operation), and since the instrument used in this study was unable to simultaneously operate in both the positive and negative modes, LC–QTOF-MS analyses were carried out only in the positive mode, using the MS parameters optimized in a previous study [14]. The calculated exact mass of each pesticide is presented in Table 1. Quantification was performed by operating in full-scan acquisition mode using ions with the highest intensity among [M+H]+, [M+Na]+, and [M+NH4]+. For most of the target pesticides, the highest intensity was obtained for [M+H]+; only 10 compounds were observed to have their highest intensity for [M+NH4]+ and none of the compounds were seen at their highest intensity for [M+Na]+. The mass window for extracting the chromatograms of each pesticide was optimized by comparing the repeatability of the peak areas of the target compounds, obtained by replicate analyses (n = 5, 0.01 μg/mL) for the extraction of mass windows of ±2.5, ±5, and ±10 mDa. It should be noted that, in general, a narrow mass window for the extraction of chromatograms will result in low background noise and allow the discrimination of coeluting matrix components. This will increase sensitivity and selectivity; however, the use of a disproportionately narrow window will result in peak shape deterioration and low repeatability. Hence, mass windows of ±5 and ±10 mDa resulted in relative standard deviations (RSDs) of <5% for all the target pesticides; whereas the RSD values for 10 pesticides were >5% with a mass window of ±2.5 mDa. In addition, narrow mass windows produced higher signal-to-noise (S/N) ratios. Therefore, considering these results, the mass window was set to ±5 mDa, as a trade-off between S/N and peak area repeatability.
3.2. Method Validation
As mentioned earlier, the samples were prepared according to the official Japanese multiresidue method “Multi-residue Method I for Agricultural Chemicals by LC-MS (Agricultural Products)” prior to analysis by LC–QTOF-MS, except for the modification in the cleanup step. A tandem GCB/PSA cartridge was used instead of a tandem GCB/NH2 cartridge for cleanup because the PSA sorbent can more effectively remove acidic matrix components, such as organic acids and fatty acids, compared to a NH2 sorbent. The LC–QTOF-MS method was validated in terms of linearity, matrix effect, trueness, intra- and inter-day precisions, and selectivity for detection of the spiking at a concentration level of 0.01 mg/kg with 151 pesticides of brown rice, soybeans, and peanuts. Quantification was carried out using solvent-based calibration curves in this study.
Injecting a standard solution of 0.005 μg/mL, which corresponds to 0.01 mg/kg, five pesticides, i.e., hexaconazole, isoprocarb, methidathion, pentoxazone, and quizalofop ethyl, exhibited insufficient sensitivities, i.e., S/N < 10. Among them, the low sensitivity of quizalofop ethyl could be a consequence of a high background noise level due to polysiloxane contamination, which has a similar calculated exact mass (m/z 373.0981, [C10H31Si430SiO5]+). Therefore, the validation method was continued for 146, of the original 151, pesticides and achieved the required sensitivity of 0.005 μg/mL (corresponding to 0.01 mg/kg). Furthermore, because ferimzone and tricyclazole were detected at concentrations of 0.02 mg/kg and <0.01 mg/kg, respectively, in the brown rice sample used for the method validation in this study, ferimzone and tricyclazole were also excluded from the target compounds for method validation in brown rice. It should be noted that the residue levels of ferimzone and tricyclazole detected in brown rice were below the MRLs (2 ppm and 3 ppm, respectively) established in Japan.
The results of the recovery experiments are shown in Table 2. The trueness of the target pesticides was in the range of 70 to 120% and within the acceptable range of the criteria required by the Japanese [21] and EU [22] method validation guidelines, except for the cases of 7 pesticides in brown rice, 10 pesticides in soybeans, and 9 pesticides in peanuts. The intra- and inter-day precisions (expressed as RSD) were in most cases <10%. All target pesticides that achieved satisfactory trueness values fulfilled the precision criteria of the Japanese validation guideline, namely <25% for intra-day and <30% for inter-day precisions at 0.01 mg/kg [21]. Calibration curves for the target pesticides in the concentration range 0.00125–0.0075 μg/mL demonstrated sufficient linearity, with coefficients of determination (r2) of >0.99, with the exception of the five pesticides (hexaconazole, isoprocarb, methidathion, pentoxazone, and quizalofop-ethyl) for which the detection sensitivity was deemed to be insufficiently high. In addition, calibration curves were also linear in the wider range 0.002 to 0.1 μg/mL with r2 > 0.99, except for the cases of the aforementioned five pesticides. These five pesticides resulted in linear calibration curves in the range 0.01 to 0.1 μg/mL with r2 > 0.995.
Table 2.
Trueness and intra- and inter-day precision of the target pesticides.
It is well known that LC-MS/MS with ESI is susceptible to ion suppression, especially in complex food matrices, mainly due to the competition between analyte and coeluting matrix components [23]. Because the LC–QTOF-MS analyses were conducted using ESI in this study, ion suppression might also have occurred during these measurements. Thus, matrix effects were evaluated by comparing the peak areas of the matrix-matched standard solution at 0.005 μg/mL (corresponding to 0.01 mg/kg) to those of the standard solution prepared in methanol at the same concentration. The matrix effect values are shown in Table 3 and ranged from 0.8 to 1.1 for 134 (out of 144), 141 (out of 146), and 142 (out of 146) pesticides in brown rice, soybeans, and peanuts, respectively. The results indicate that no significant matrix effect occurred for most of the target pesticides studied, even though the soybean and peanut samples contained high amounts of lipids. Thus, these results suggested that the low trueness values for the acrinathrin (peanuts), cycloprothrin (brown rice), deltamethrin (peanuts), epoxiconazole (brown rice), fenpropathrin (brown rice), fipronil (brown rice), fluvalinate (brown rice, soybeans, and peanuts), hexythiazox (soybeans), imibenconazole (brown rice), and spinosyn A (brown rice and peanuts) samples were mainly caused by ion suppression.
Table 3.
Matrix effects of the target pesticides in brown rice, soybeans, and peanuts.
Figure 1 shows the extracted ion chromatograms of representative pesticides in soybeans. No interfering peaks were detected in the extracted ion chromatograms of blank samples at the retention times of the target pesticides, which indicate the high selectivity of the method. The only exceptions were tridemorph in soybeans and peanuts. The interfering peaks were, however, less than 1/10 of the peak areas of the 0.005 μg/mL (corresponding to 0.01 mg/kg) standard solution of the target pesticides, conforming to the criteria of the Japanese validation guideline [21]. In addition, the retention times of the target pesticides in the matrices were found to be in good agreement with those in the solvent standard solutions (within ±0.02 min). Furthermore, the RSDs of retention times were <0.5% in brown rice, soybeans, and peanuts, except five pesticides (hexaconazole, isoprocarb, methidathion, pentoxazone, and quizalofop-ethyl) that showed low sensitivity.
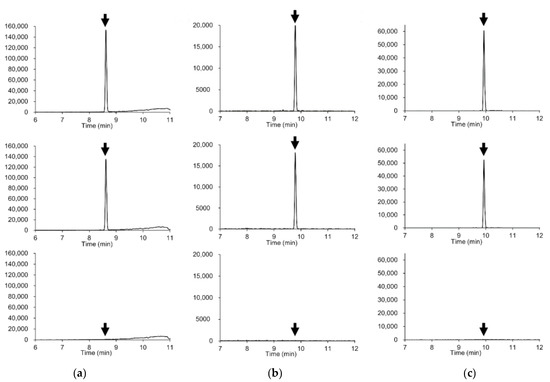
Figure 1.
Extracted ion chromatograms (mass window ±5 mDa) of representative compounds. (a) Azoxystrobin (m/z 404.1241); (b) Diazinon (m/z 305.1083), (c) Indoxacarb (m/z 528.0780). Upper plots: standard solution in solvent (0.005 μg/mL, corresponding to 0.01 mg/kg). Middle plots: soybeans spiked with 0.01 mg/kg of the pesticide. Lower plots: soybean blank extract.
The results of method validation revealed that LOQs, defined as the lowest concentration that can be quantified with satisfactory trueness values and precision, are 0.01 mg/kg for most pesticides (Table S1). MRLs of the target pesticides in brown rice, soybeans, and peanuts established in Japan are shown in Table S1. For pesticide/food combinations whose MRLs are not established, a uniform limit of 0.01 mg/kg is applied. As can be seen, MRLs are ≥0.01 mg/kg. Therefore, the proposed method exhibits sufficient sensitivity for regulatory purpose analysis.
3.3. Confirmation
For discriminating analytes from coeluting matrix components in complex foods at low concentrations, information on the exact mass and retention times of the target analytes may not be sufficient, even when using LC-Orbitrap-MS, which, compared to LC-TOF-MS, provides a high resolving power [19]. The EU guidelines [22] state that two ions, preferably a molecular adduct and at least one fragment ion, are required for accurate mass measurement by high-resolution MS. Hybrid HR-MS, such as QTOF-MS and QOrbitrap-MS, provide fragment-ion information via data dependent acquisition (DDA) and/or DIA [2,18]. In DDA, precursor ions are sequentially selected from full scans based on user-selected criteria (e.g., minimal intensity threshold, m/z values). In contrast, in DIA, all ionized compounds are subjected to fragmentation, and thus, DIA provides information regarding the fragment ions derived from all ions. In a previous study into pesticide residue analyses in vegetables and fruits using LC–QTOF-MS [14], we demonstrated DIA using the MSE technique (Waters) [24], which provided full-scan data on both the molecular adduct (at low collision energy) and fragment (at high collision energy) ions in a single run, without selecting the precursor ion. In the study reported herein, we further applied the MSE technique to brown rice, soybeans, and peanuts spiked at a level of 0.01 mg/kg. Figure 2 shows extracted ion chromatograms of molecular adduct and fragment ions from the soybean samples; Table 1 shows that the fragment ions could be detected at 0.005 μg/mL in the presence of the matrices. Among the 146 target pesticides, for 126 pesticides, we were able to detect one or more fragment ions; for 84 pesticides, we were able to detect one or more isotopic ions, and for 134 pesticides, we were able to detect one or more fragment ions and/or isotopic ions. Figure 3 shows extracted ion chromatograms of incurred ferimzone residue found in the rice sample used for validation in this study. As can be seen, the [M+H]+ (m/z 255.1604) for ferimzone together with its two fragments ions, i.e., [C9H10N]+ (m/z 132.0808) and [C6H10N3]+ (m/z 124.0869), were clearly detected, suggesting that the MSE technique could be a useful tool for obtaining fragment ion information for confirmation purposes. However, because the sensitivities of the fragment ion peaks for several pesticides were low, more sensitive methods, such as LC-MS/MS in SRM mode, may be required for confirmation, especially for the pesticides that were shown to be detected with low sensitivities using the LC–QTOF-MS technique described in this study.
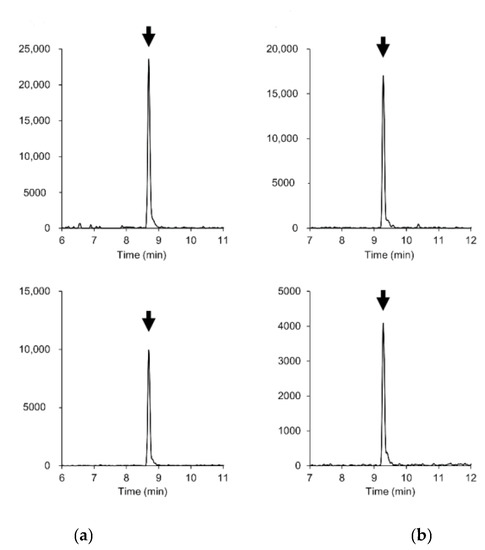
Figure 2.
Extracted ion chromatograms (mass window ±5 mDa) of parent and fragment ions of (a) boscalid and (b) cyazofamid in 0.01 mg/kg-spiked soybean blank extract. Upper plots: [M + H]+ ((a) m/z 343.0399, (b) m/z 325.0521). Lower plots: fragment ions ((a) m/z 307.0633, (b) m/z 108.0114).
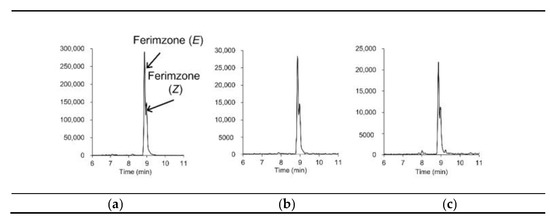
Figure 3.
Extracted ion chromatograms (mass window ±5 mDa) of incurred ferimzone residue in a rice sample: (a) parent ion ([M+H]+, m/z 255.1604) and (b,c) its fragment ions ((b) m/z 132.0808, (c) m/z 124.0869).
4. Conclusions
In this study, the multiresidue method using LC–QTOF-MS in full-scan acquisition mode was validated for the determination of 151 pesticides in cereal grains and legumes. Sufficiently high sensitivities were achieved at 0.005 μg/mL (corresponding to 0.01 mg/kg), with the exception of 5 of the 151 pesticides. Excellent results were obtained in terms of trueness, intra- and inter-day precision, and selectivity for most of the target pesticides at 0.01 mg/kg. The results revealed that the LC–QTOF-MS method offers reliable quantitative analysis of pesticide residues in cereal grains and legumes. In addition, we demonstrated the usefulness of the MSE technique for obtaining information on fragment ions for confirmation. Although we were unable to detect several parent and fragment ions owing to low S/N at 0.01 mg/kg, the LC–QTOF-MS method was shown to be suitable for regulatory-purpose analysis for most of the target pesticides.
Supplementary Materials
The following are available online at https://www.mdpi.com/2304-8158/10/1/78/s1, Table S1: MRLs set in Japan and LOQs of the target pesticides. Table S2: Results of method validation at MRL.
Author Contributions
Conceptualization, S.S.-S.; methodology, S.S.-S.; validation, S.S.-S.; investigation, S.S.-S.; writing—original draft preparation, S.S.-S.; writing—review and editing, S.S.-S. and H.A.; supervision, H.A.; funding acquisition, S.N. All authors have read and agreed to the published version of the manuscript.
Funding
This research was funded by the Ministry of Health, Labour, and Welfare of Japan, grant number H25-Syokuhin-ippan-002.
Institutional Review Board Statement
Not applicable.
Informed Consent Statement
Not applicable.
Data Availability Statement
The data presented in this study are available in the article or supplementary material.
Conflicts of Interest
The authors declare no conflict of interest.
References
- Mostafalou, S.; Abdollahi, M. Pesticides and human chronic diseases: Evidences, mechanisms, and perspectives. Toxicol. Appl. Pharmacol. 2013, 268, 157–177. [Google Scholar] [CrossRef] [PubMed]
- Wong, J.W.; Wang, J.; Chow, W.; Carlson, R.; Jia, Z.; Zhang, K.; Hayward, D.G.; Chang, J.S. Perspectives on liquid chromatography-high-resolution mass spectrometry for pesticide screening in foods. J. Agric. Food Chem. 2018, 66, 9573–9581. [Google Scholar] [CrossRef] [PubMed]
- García López, M.; Fussell, R.J.; Stead, S.L.; Roberts, D.; McCullagh, M.; Rao, R. Evaluation and validation of an accurate mass screening method for the analysis of pesticides in fruits and vegetables using liquid chromatography-quadrupole-time of flight-mass spectrometry with automated detection. J. Chromatogr. A 2014, 1373, 40–50. [Google Scholar] [CrossRef] [PubMed]
- Wang, Z.; Chang, Q.; Kang, J.; Cao, Y.; Ge, N.; Fan, C.; Pang, G.-F. Screening and identification strategy for 317 pesticides in fruits and vegetables by liquid chromatography-quadrupole time-of-flight high resolution mass spectrometry. Anal. Methods 2015, 7, 6385–6402. [Google Scholar] [CrossRef]
- Sivaperumal, P.; Anand, P.; Riddhi, L. Rapid determination of pesticide residues in fruits and vegetables, using ultra-high-performance liquid chromatography/time-of-flight mass spectrometry. Food Chem. 2015, 168, 356–365. [Google Scholar] [CrossRef]
- Kaufmann, A.; Dvorak, V.; Crüzer, C.; Butcher, P.; Maden, K.; Walker, S.; Widmer, M.; Schürmann, A. Study of high-resolution mass spectrometry technology as a replacement for tandem mass spectrometry in the field of quantitative pesticide residue analysis. J. AOAC Int. 2012, 95, 528–548. [Google Scholar] [CrossRef]
- Mezcua, M.; Malato, O.; García-Reyes, J.F.; Molina-Díaz, A.; Fernández-Alba, A.R. Accurate-mass databases for comprehensive screening of pesticide residues in food by fast liquid chromatography time-of-flight mass spectrometry. Anal. Chem. 2009, 81, 913–929. [Google Scholar] [CrossRef]
- Rajski, Ł.; del Mar Gómez-Ramos, M.; Fernández-Alba, A.R. Large pesticide multiresidue screening method by liquid chromatography-Orbitrap mass spectrometry in full scan mode applied to fruit and vegetables. J. Chromatogr. A 2014, 1360, 119–127. [Google Scholar] [CrossRef]
- Lacina, O.; Urbanova, J.; Poustka, J.; Hajslova, J. Identification/quantification of multiple pesticide residues in food plants by ultra-high-performance liquid chromatography-time-of-flight mass spectrometry. J. Chromatogr. A 2010, 1217, 648–659. [Google Scholar] [CrossRef]
- Wang, J.; Chow, W.; Chang, J.; Wong, J.W. Development and validation of a qualitative method for target screening of 448 pesticide residues in fruits and vegetables using UHPLC/ESI Q-Orbitrap based on data-independent acquisition and compound database. J. Agric. Food Chem. 2017, 65, 473–493. [Google Scholar] [CrossRef]
- Wang, J.; Chow, W.; Chang, J.; Wong, J.W. Ultrahigh-performance liquid chromatography electrospray ionization Q-Orbitrap mass spectrometry for the analysis of 451 pesticide residues in fruits and vegetables: Method development and validation. J. Agric. Food Chem. 2014, 62, 10375–10391. [Google Scholar] [CrossRef]
- Pérez-Ortega, P.; Lara-Ortega, F.J.; García-Reyes, J.F.; Beneito-Cambra, M.; Gilbert-López, B.; Martos, N.R.; Molina-Díaz, A. Determination of over 350 multiclass pesticides in jams by ultra-high performance liquid chromatography time-of-flight mass spectrometry (UHPLC-TOFMS). Food Anal. Methods 2016, 9, 1939–1957. [Google Scholar] [CrossRef]
- Gómez-Ramos, M.M.; Ferrer, C.; Malato, O.; Agüera, A.; Fernández-Alba, A.R. Liquid chromatography-high-resolution mass spectrometry for pesticide residue analysis in fruit and vegetables: Screening and quantitative studies. J. Chromatogr. A 2013, 1287, 24–37. [Google Scholar] [CrossRef]
- Saito-Shida, S.; Nemoto, S.; Teshima, R.; Akiyama, H. Quantitative analysis of pesticide residues in vegetables and fruits by liquid chromatography quadrupole time-of-flight mass spectrometry. Food Addit. Contam. A 2016, 33, 119–127. [Google Scholar] [CrossRef]
- Gómez-Pérez, M.L.; Romero-González, R.; Vidal, J.L.; Frenich, A.G. Identification of transformation products of pesticides and veterinary drugs in food and related matrices: Use of retrospective analysis. J. Chromatogr. A 2015, 1389, 133–138. [Google Scholar] [CrossRef]
- Ibáñez, M.; Portolés, T.; Rúbies, A.; Muñoz, E.; Muñoz, G.; Pineda, L.; Serrahima, E.; Sancho, J.V.; Centrich, F.; Hernández, F. The power of hyphenated chromatography/time-of-flight mass spectrometry in public health laboratories. J. Agric. Food Chem. 2012, 60, 5311–5323. [Google Scholar] [CrossRef][Green Version]
- Polgár, L.; García-Reyes, J.F.; Fodor, P.; Gyepes, A.; Dernovics, M.; Abrankó, L.; Gilbert-López, B.; Molina-Díaz, A. Retrospective screening of relevant pesticide metabolites in food using liquid chromatography high resolution mass spectrometry and accurate-mass databases of parent molecules and diagnostic fragment ions. J. Chromatogr. A 2012, 1249, 83–91. [Google Scholar] [CrossRef]
- Álvarez-Ruiz, R.; Pico, Y. Sequential window acquisition of all theoretical fragments versus information dependent acquisition for suspected-screening of pharmaceuticals in sediments and mussels by ultra-high pressure liquid chromatography-quadrupole time-of-flight-mass spectrometry. J. Chromatogr. A 2019, 1595, 81–90. [Google Scholar] [CrossRef]
- Saito-Shida, S.; Hamasaka, T.; Nemoto, S.; Akiyama, H. Multiresidue determination of pesticides in tea by liquid chromatography-high-resolution mass spectrometry: Comparison between Orbitrap and time-of-flight mass analyzers. Food Chem. 2018, 256, 140–148. [Google Scholar] [CrossRef]
- Huertas Pérez, J.F.; Sejerøe-Olsen, B.; Fernández Alba, A.R.; Schimmel, H.; Dabrio, M. Accurate determination of selected pesticides in soya beans by liquid chromatography coupled to isotope dilution mass spectrometry. Talanta 2015, 137, 120–129. [Google Scholar] [CrossRef]
- Ministry of Health, Labour and Welfare, Japan (MHLW). Guideline for the Validation of Analytical Methods for Agricultural Chemical Residues in Food. Available online: https://www.mhlw.go.jp/english/topics/foodsafety/positivelist060228/dl/181130_21.pdf (accessed on 24 November 2020).
- European Commission. Analytical Quality Control and Method Validation Procedures for Pesticides Residues Analysis in Food and Feed. Document No. SANTE/12682/2019. Available online: https://www.eurl-pesticides.eu/userfiles/file/EurlALL/AqcGuidance_SANTE_2019_12682.pdf (accessed on 24 November 2020).
- Furey, A.; Moriarty, M.; Bane, V.; Kinsella, B.; Lehane, M. Ion suppression; a critical review on causes, evaluation, prevention and applications. Talanta 2013, 115, 104–122. [Google Scholar] [CrossRef]
- Masiá, A.; Ibáñez, M.; Blasco, C.; Sancho, J.V.; Picó, Y.; Hernández, F. Combined use of liquid chromatography triple quadrupole mass spectrometry and liquid chromatography quadrupole time-of-flight mass spectrometry in systematic screening of pesticides and other contaminants in water samples. Anal. Chim. Acta 2013, 761, 117–127. [Google Scholar] [CrossRef]


Publisher’s Note: MDPI stays neutral with regard to jurisdictional claims in published maps and institutional affiliations. |
© 2021 by the authors. Licensee MDPI, Basel, Switzerland. This article is an open access article distributed under the terms and conditions of the Creative Commons Attribution (CC BY) license (http://creativecommons.org/licenses/by/4.0/).