
Role of Glucosinolates in the Nutraceutical Potential of Selected Cultivars of Brassica rapa

 , ,
, , 
Abstract
:1. Introduction
2. Materials and Methods
2.1. Plant Materials and Chemicals
2.2. Extraction and Determination of Glucosinolates
2.3. In Vitro Assays
2.3.1. Treatments
2.3.2. Growth Inhibition Assay
2.3.3. Comet Assay
2.3.4. DNA Laddering Assay
2.4. In Vivo Assays
2.4.1. Anti/Toxicity and Anti/Genotoxicity Assays
2.4.2. Longevity Assay
2.5. Statistical Analysis
3. Results and Discussion
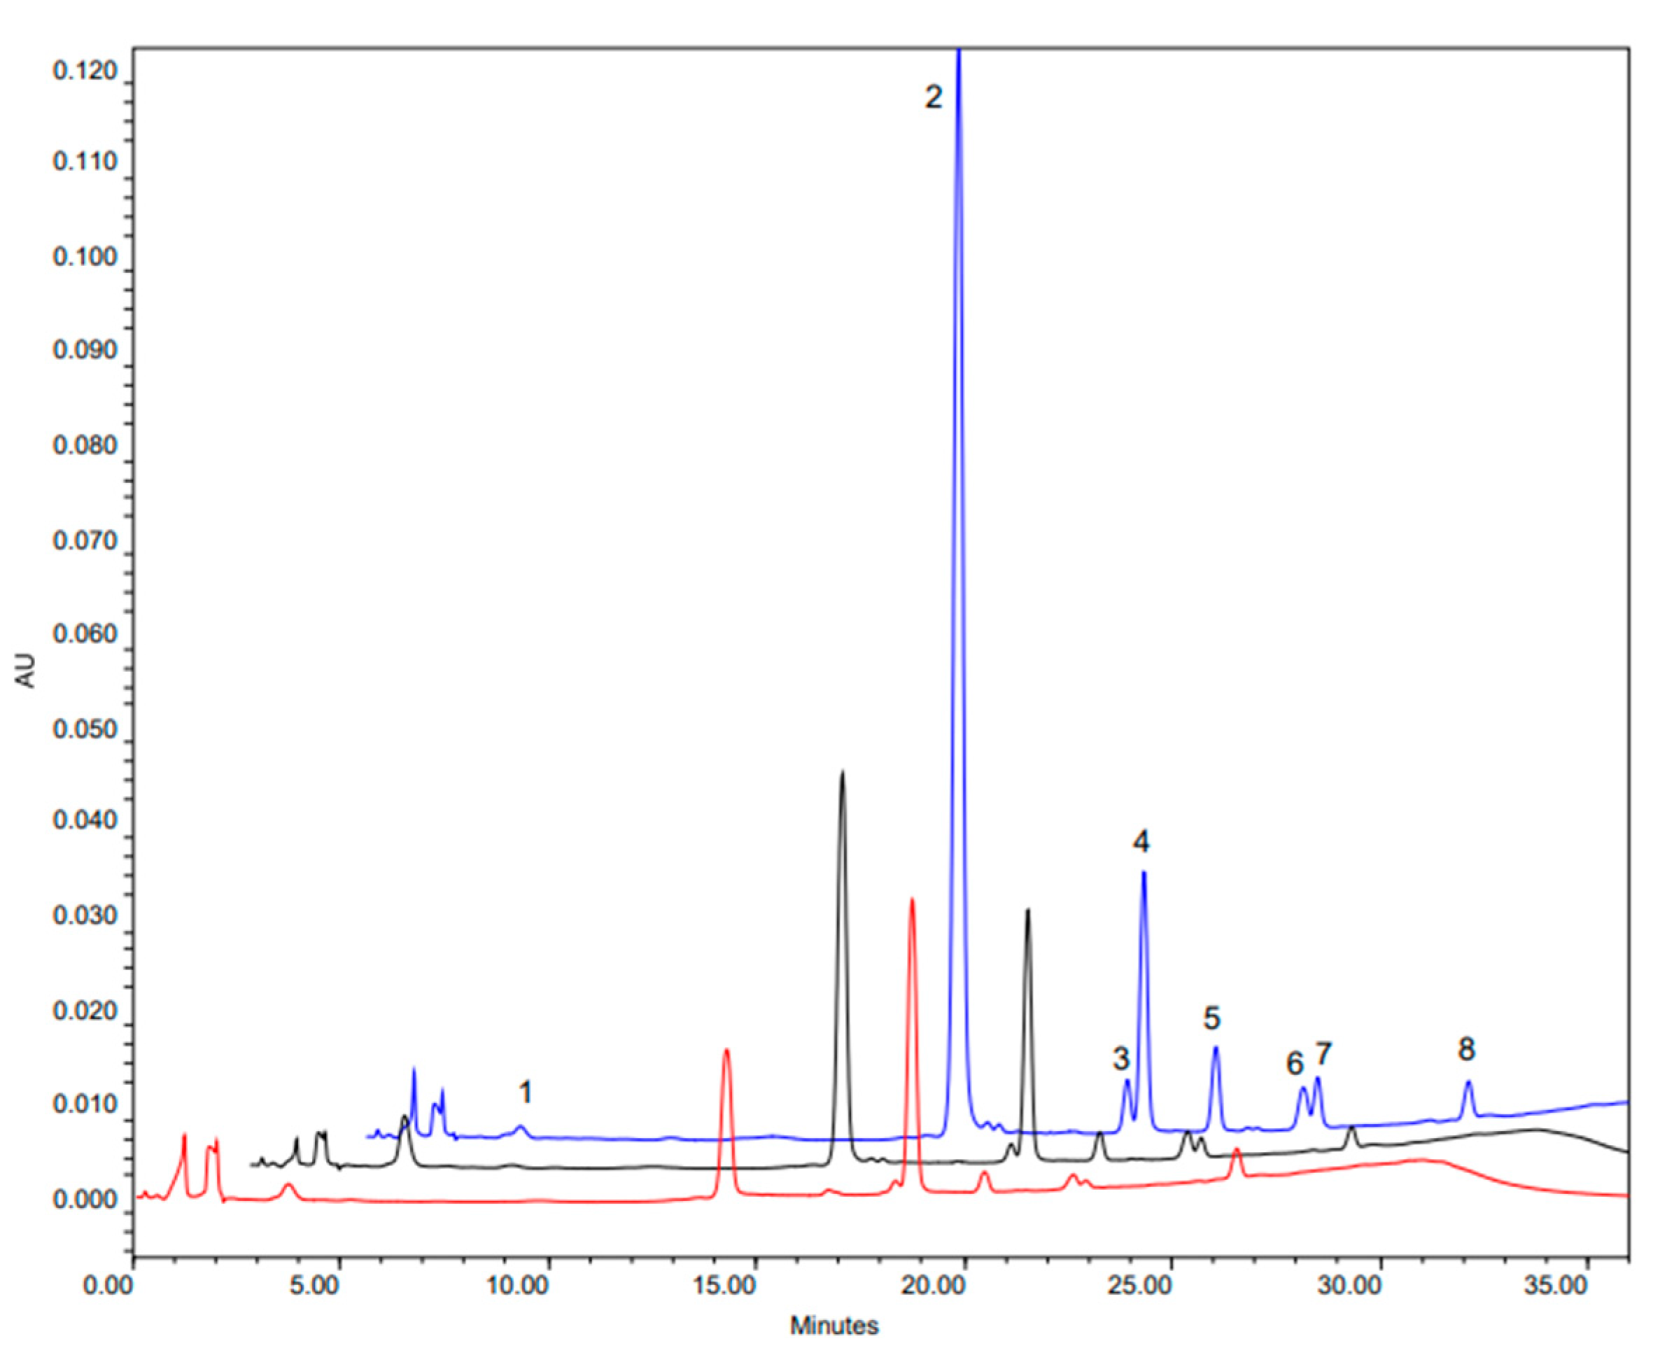
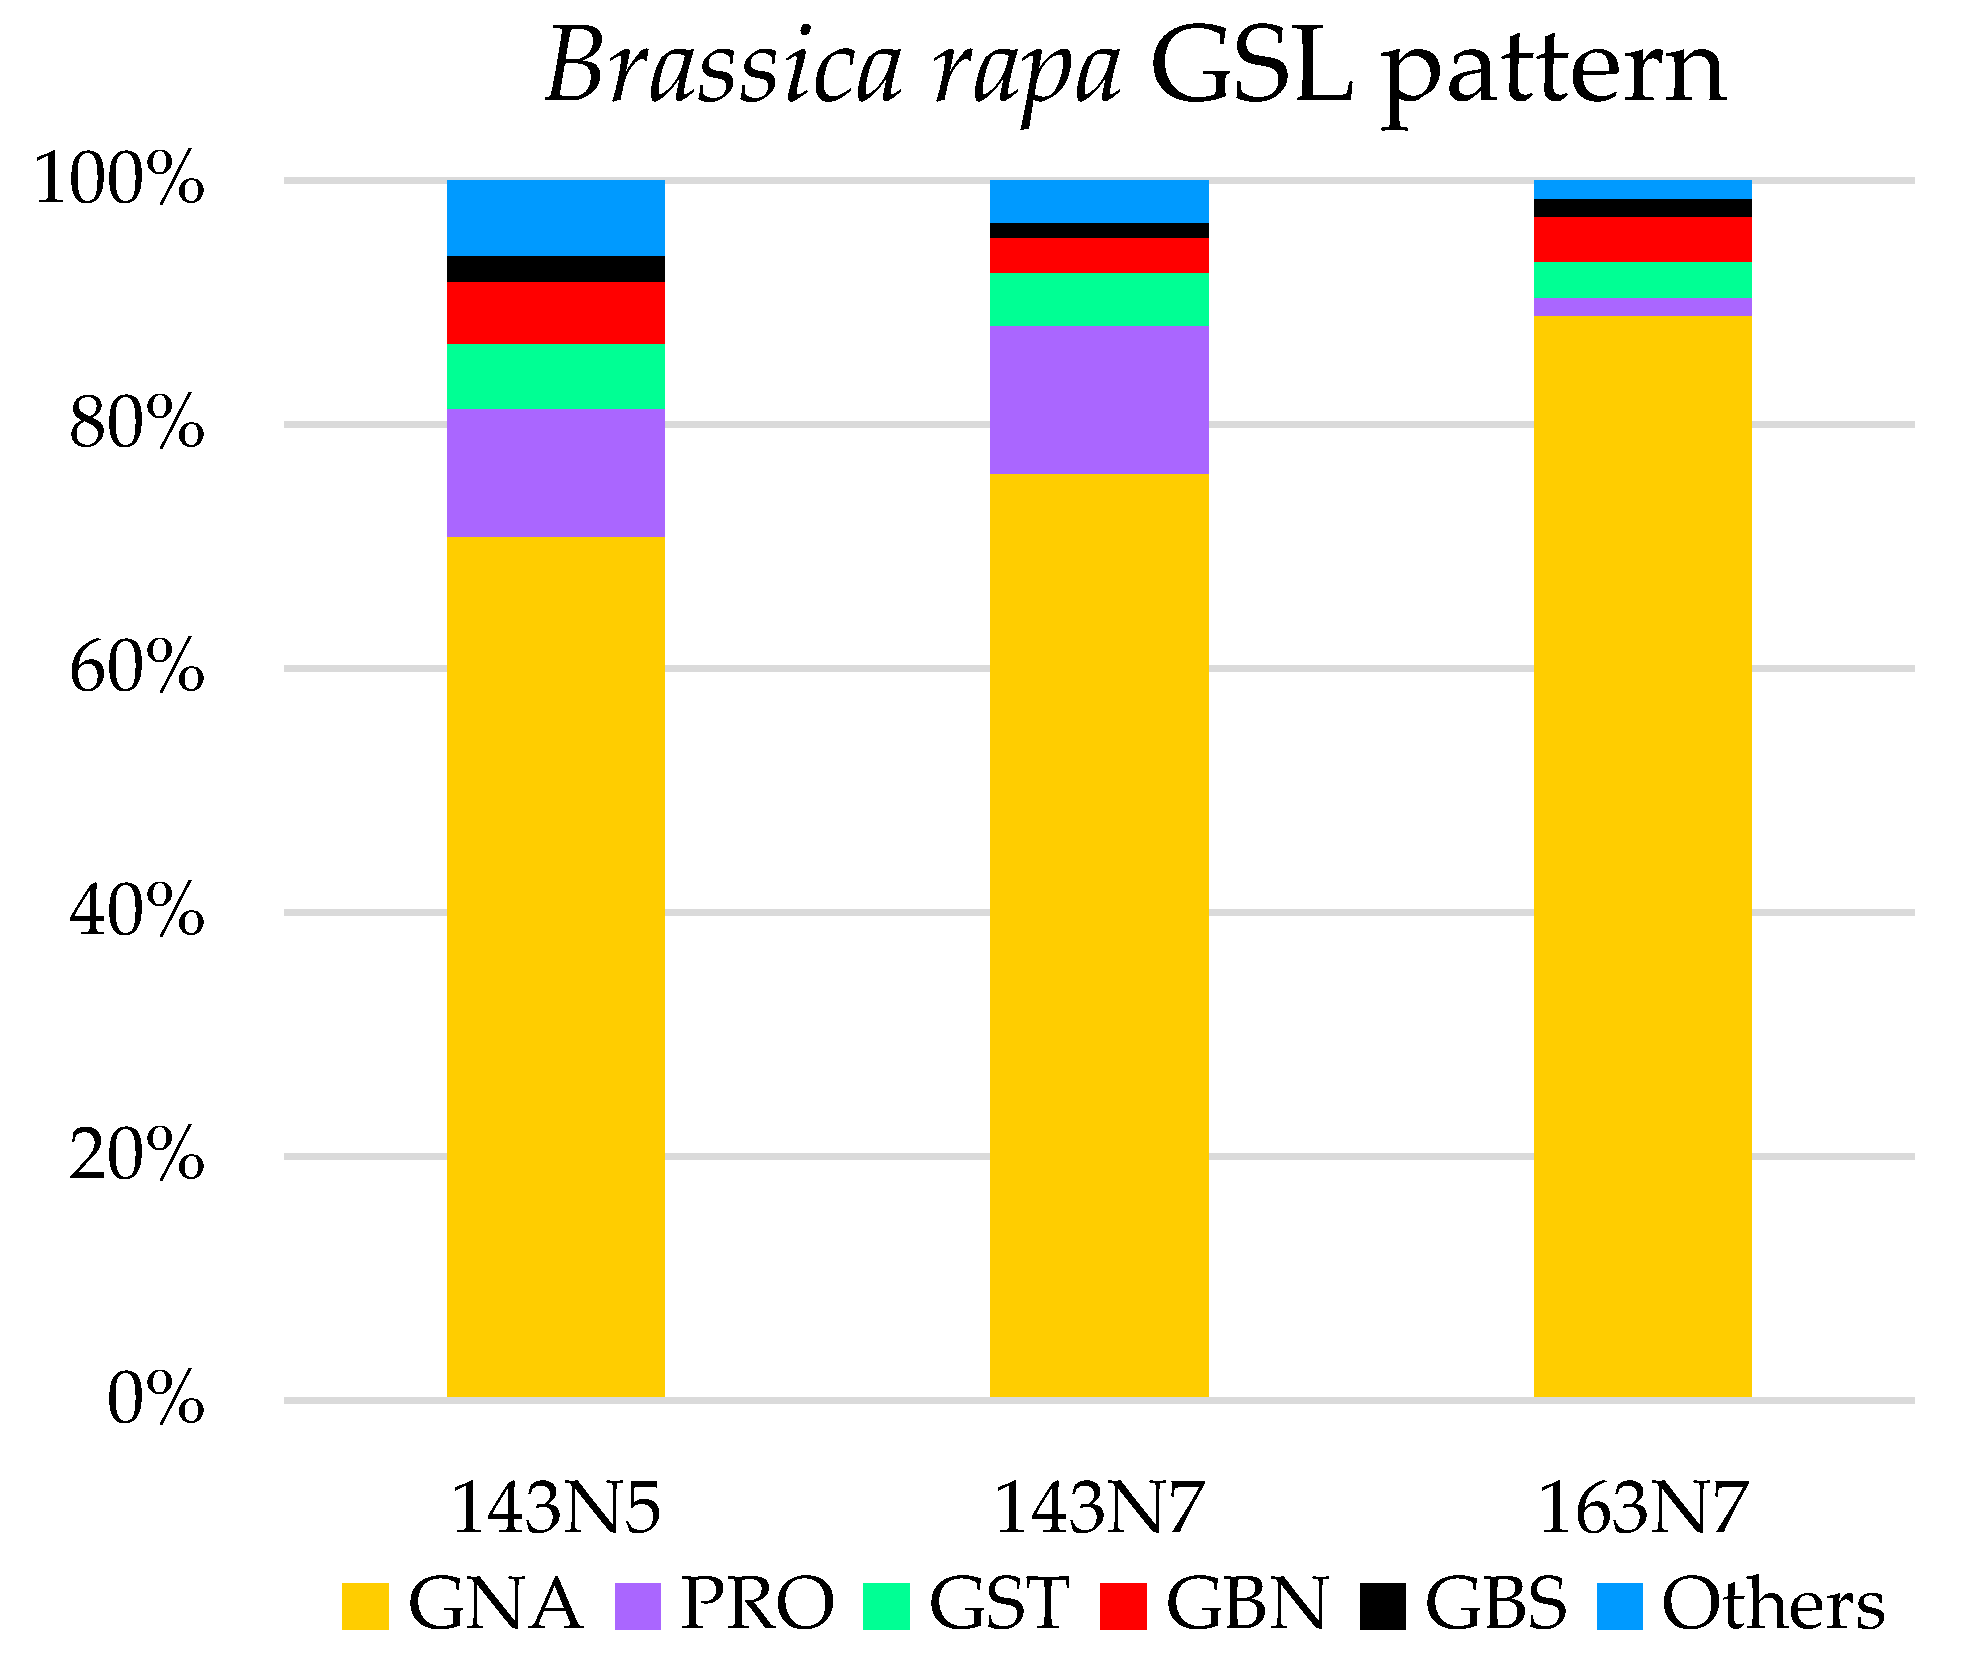
3.1. Glucosinolate Profile Determination
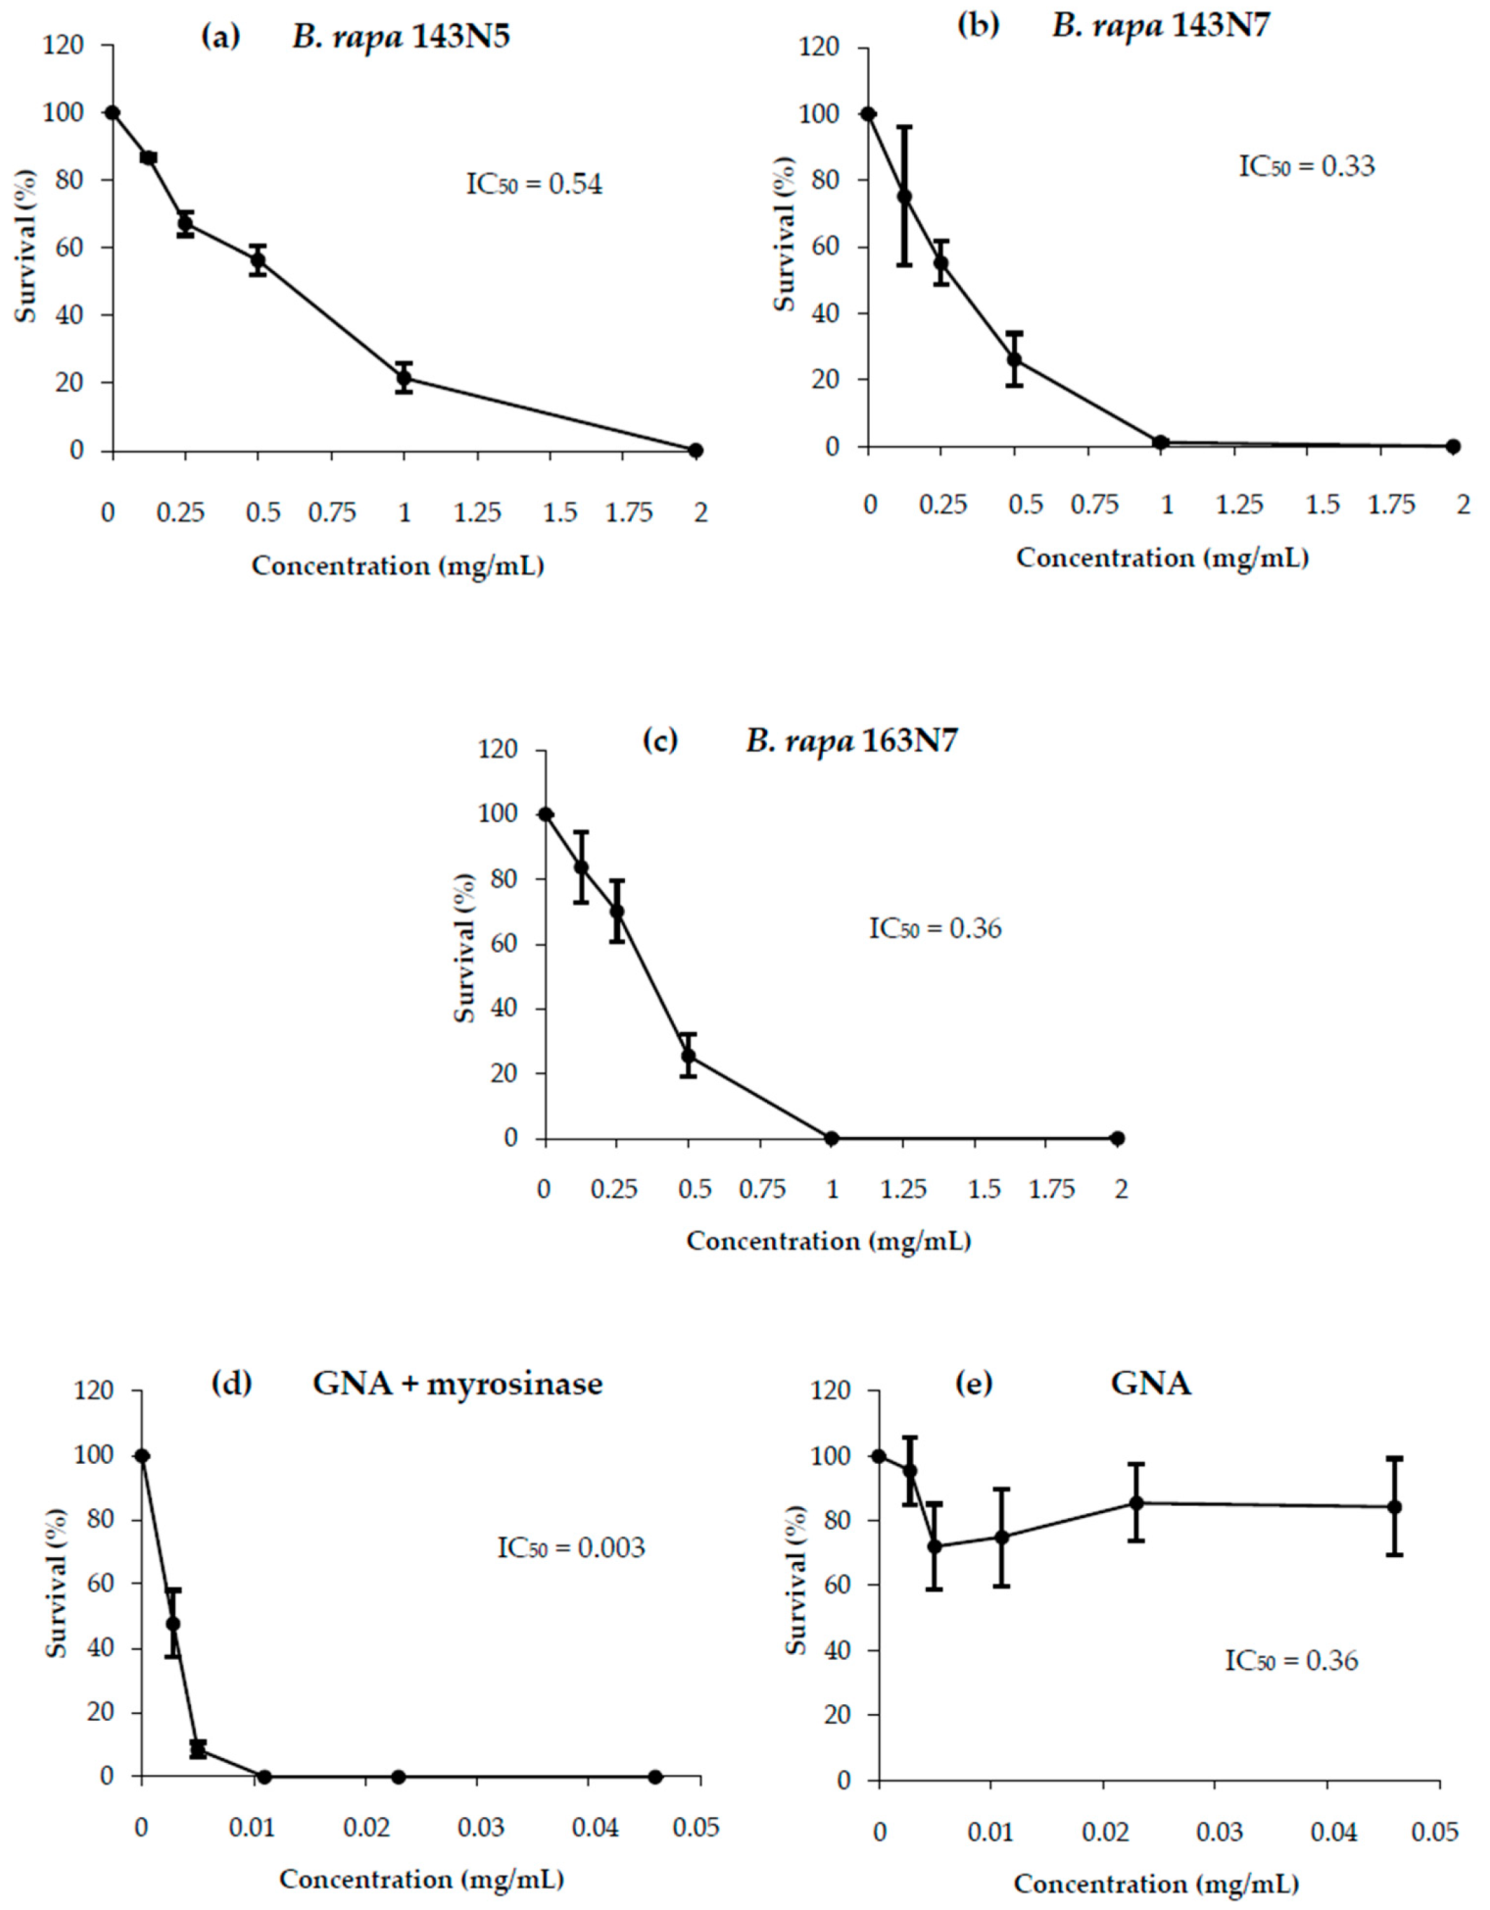
3.2. Activity Against Tumour Cell Proliferation
3.2.1. Cytotoxicity
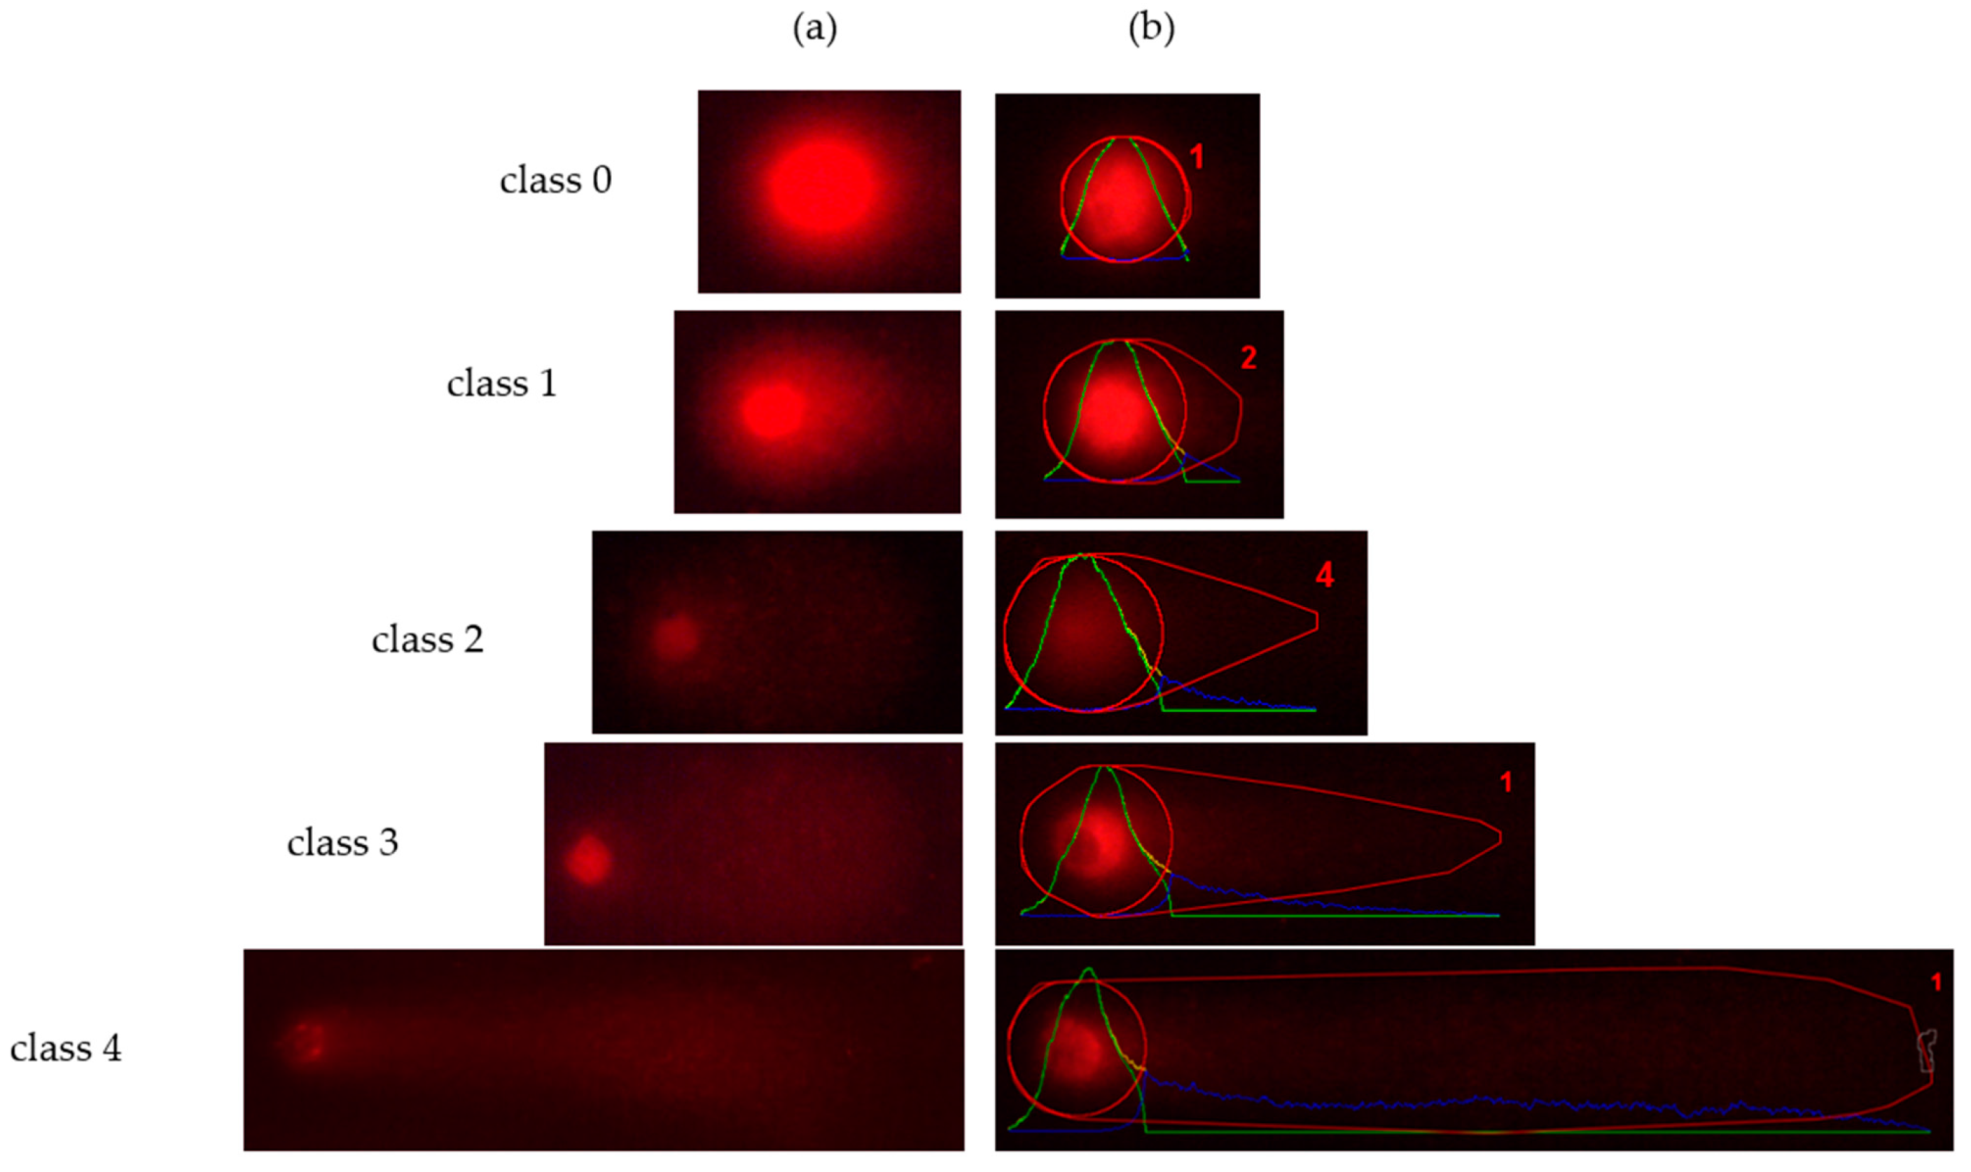
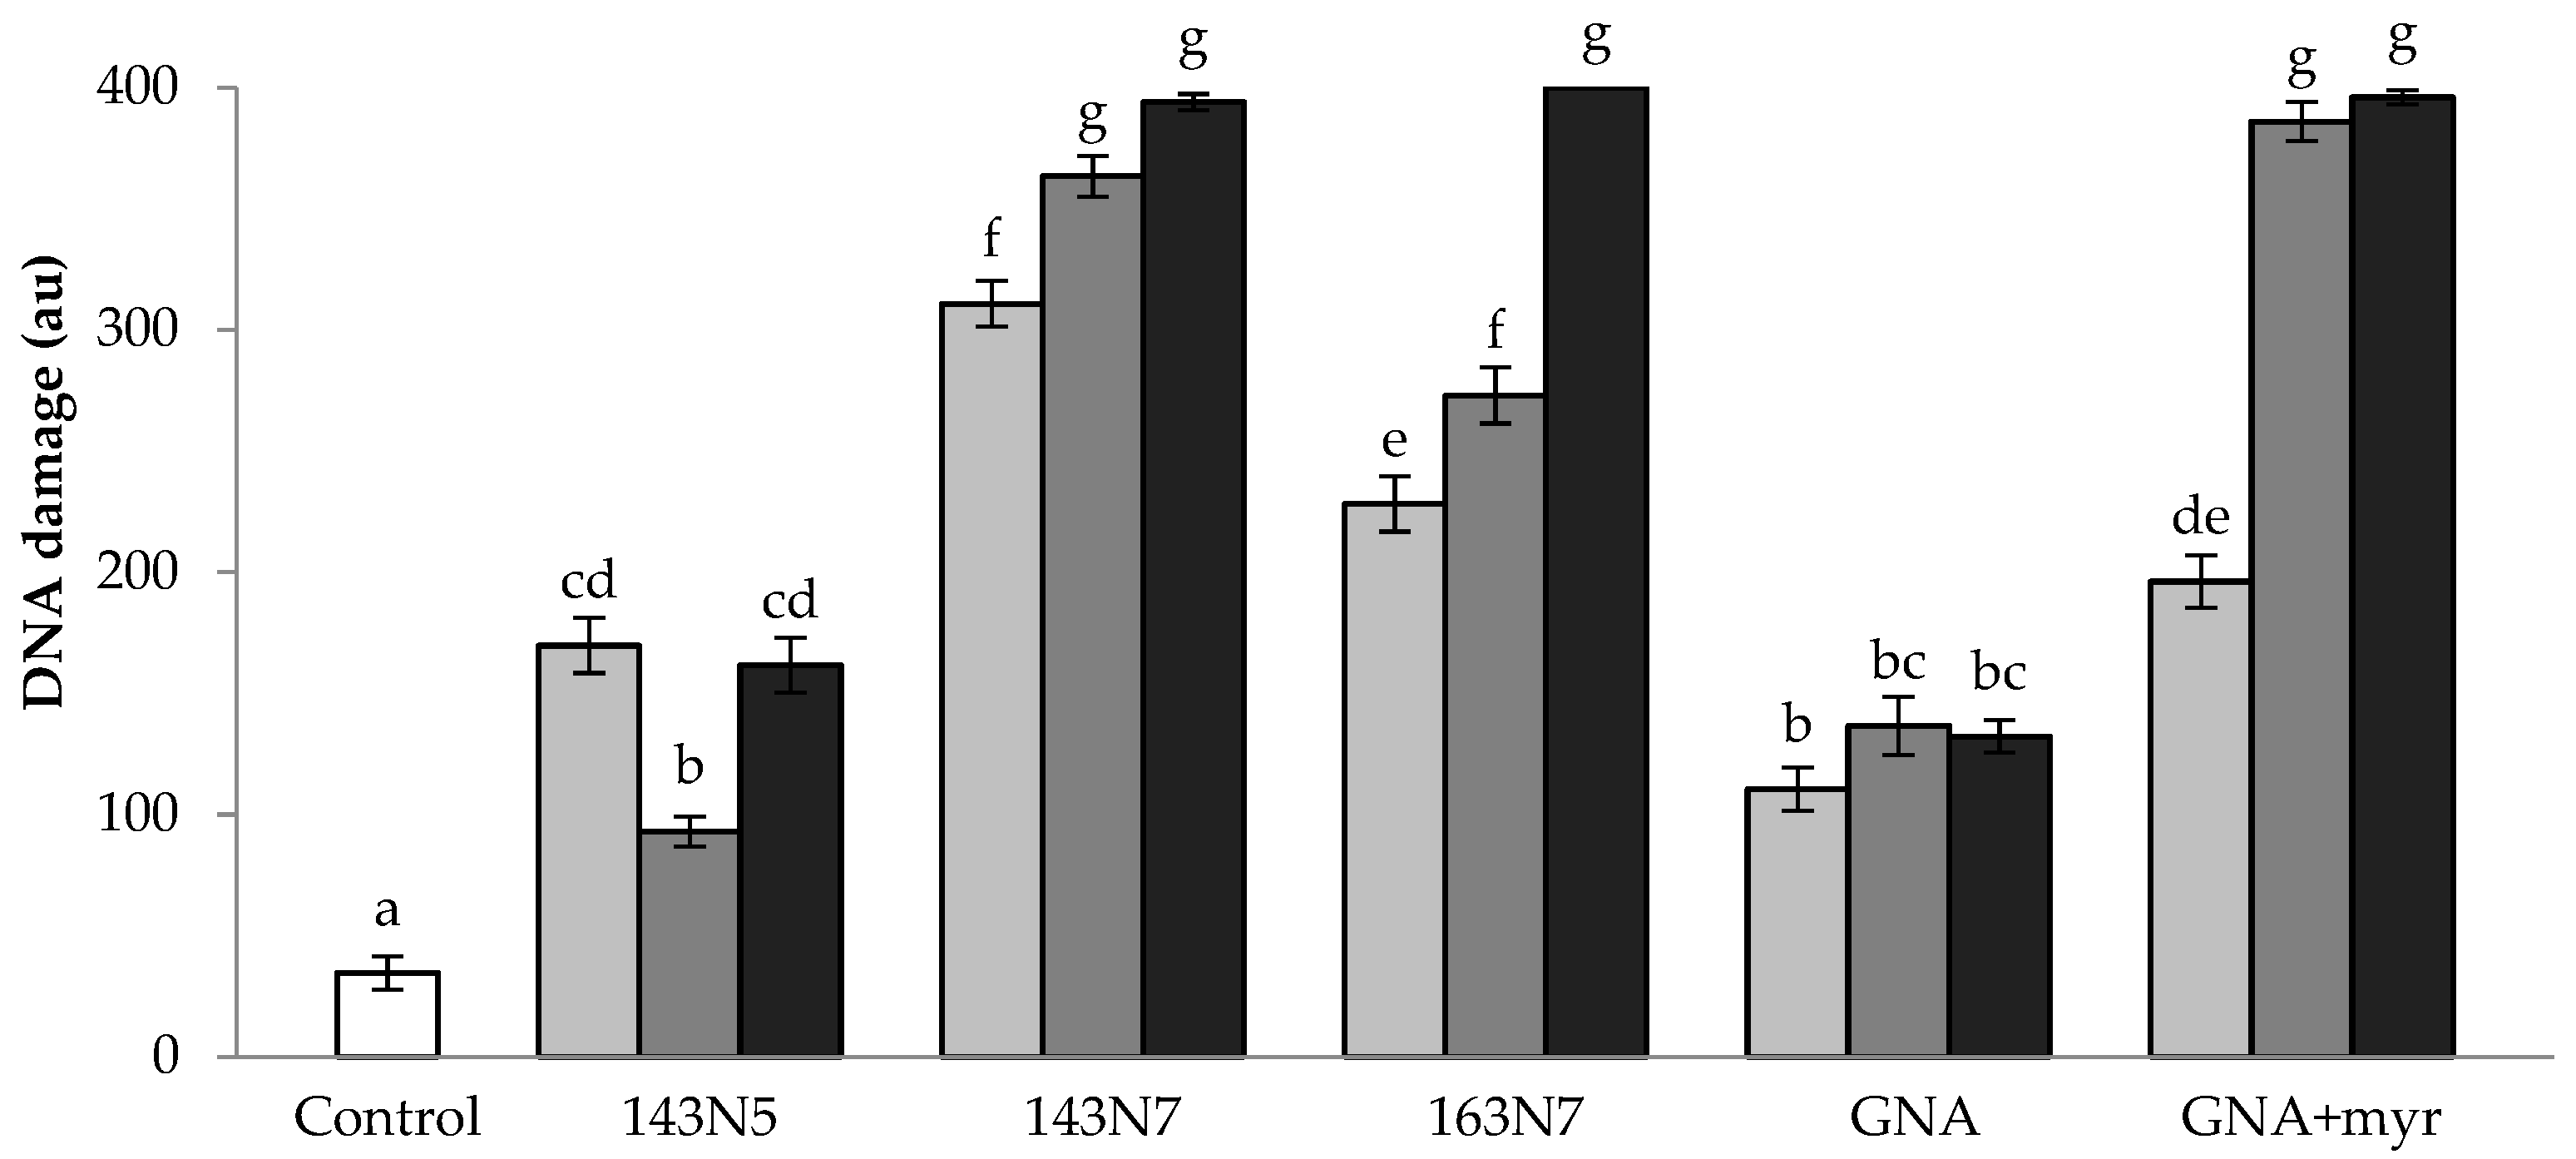
3.2.2. DNA Damage
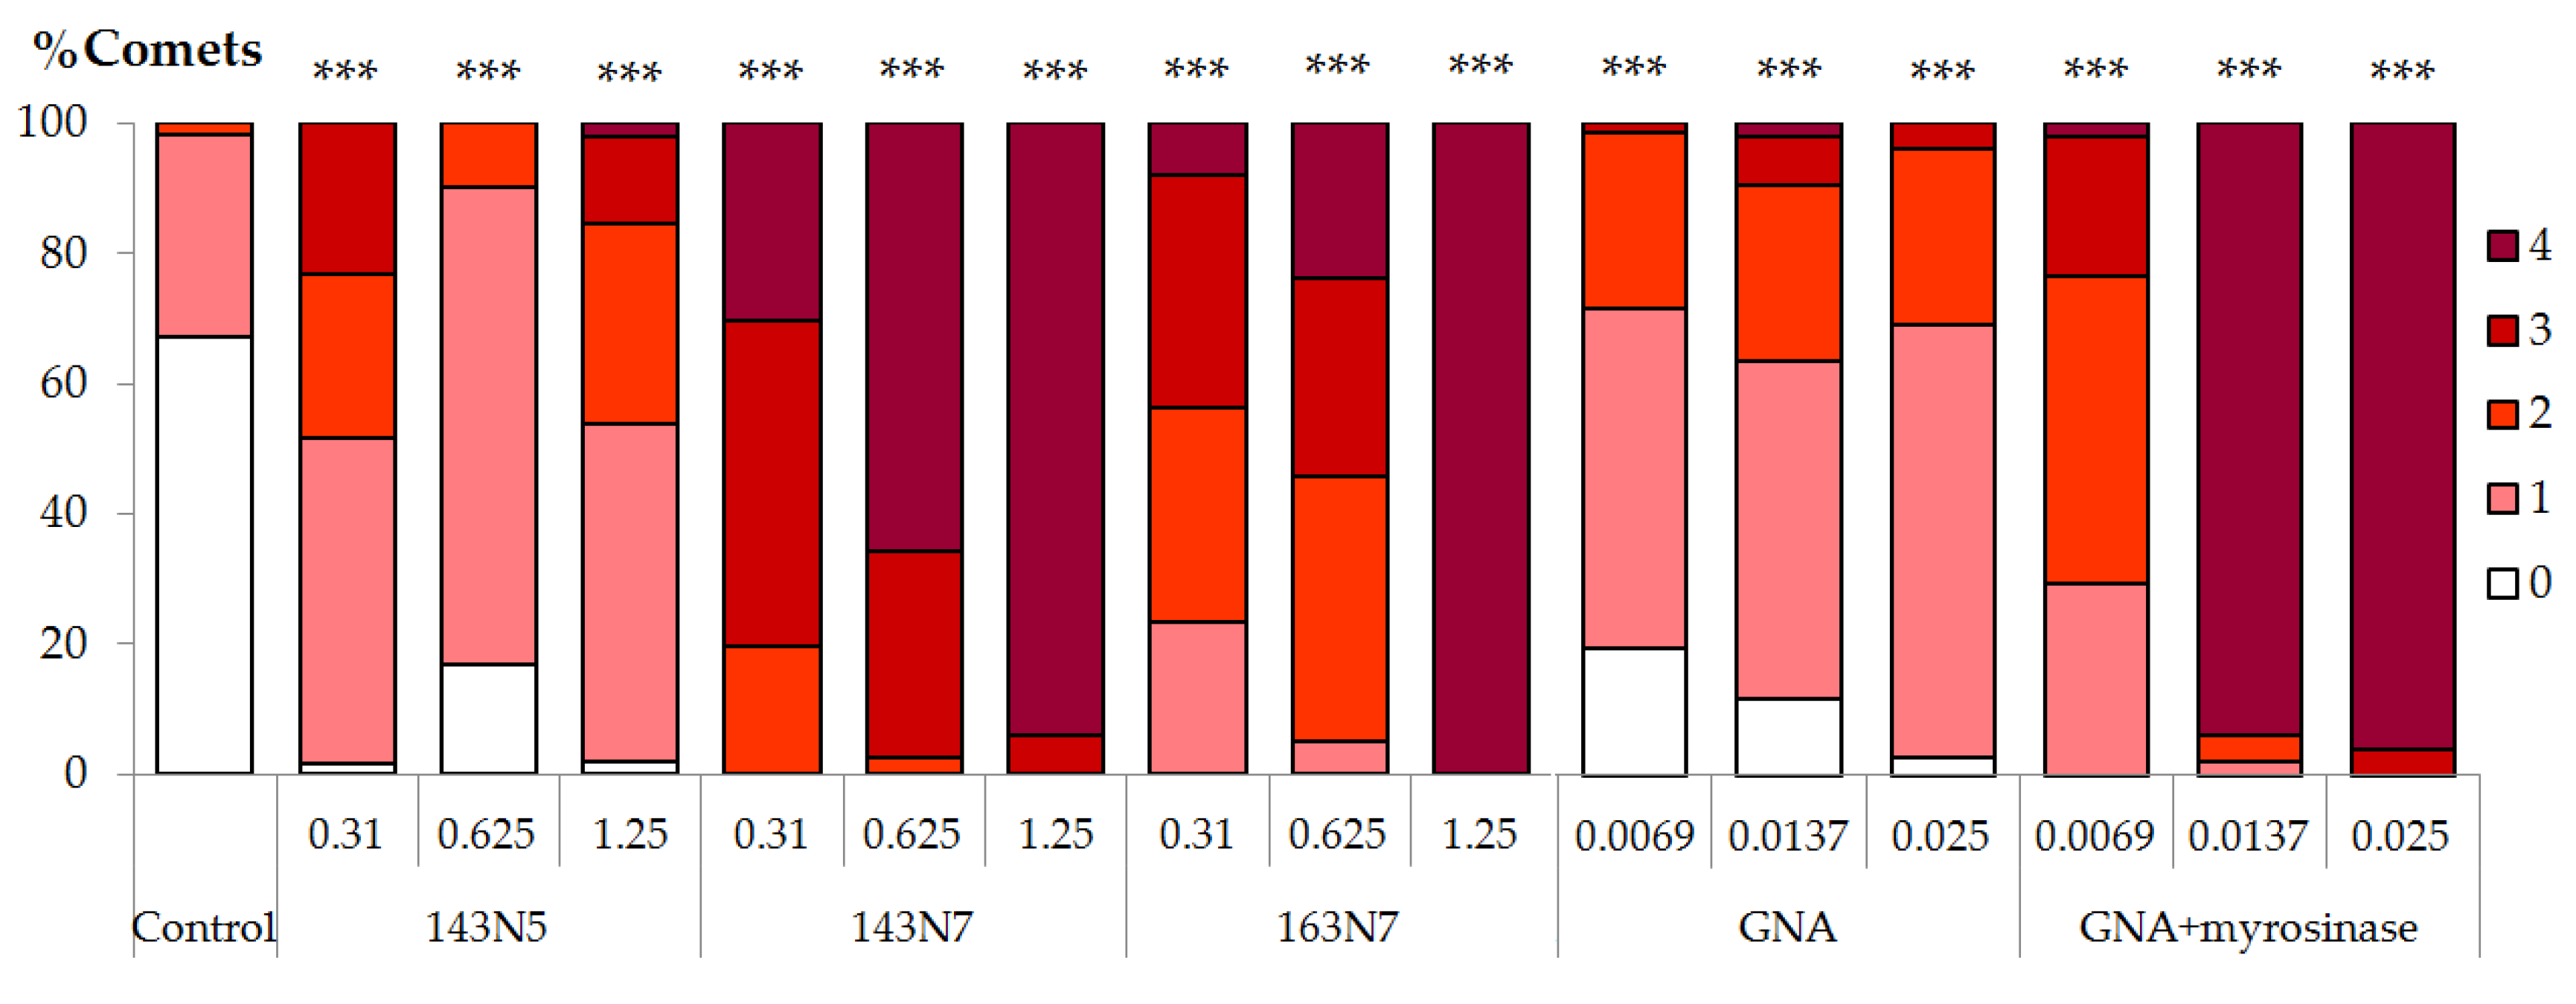
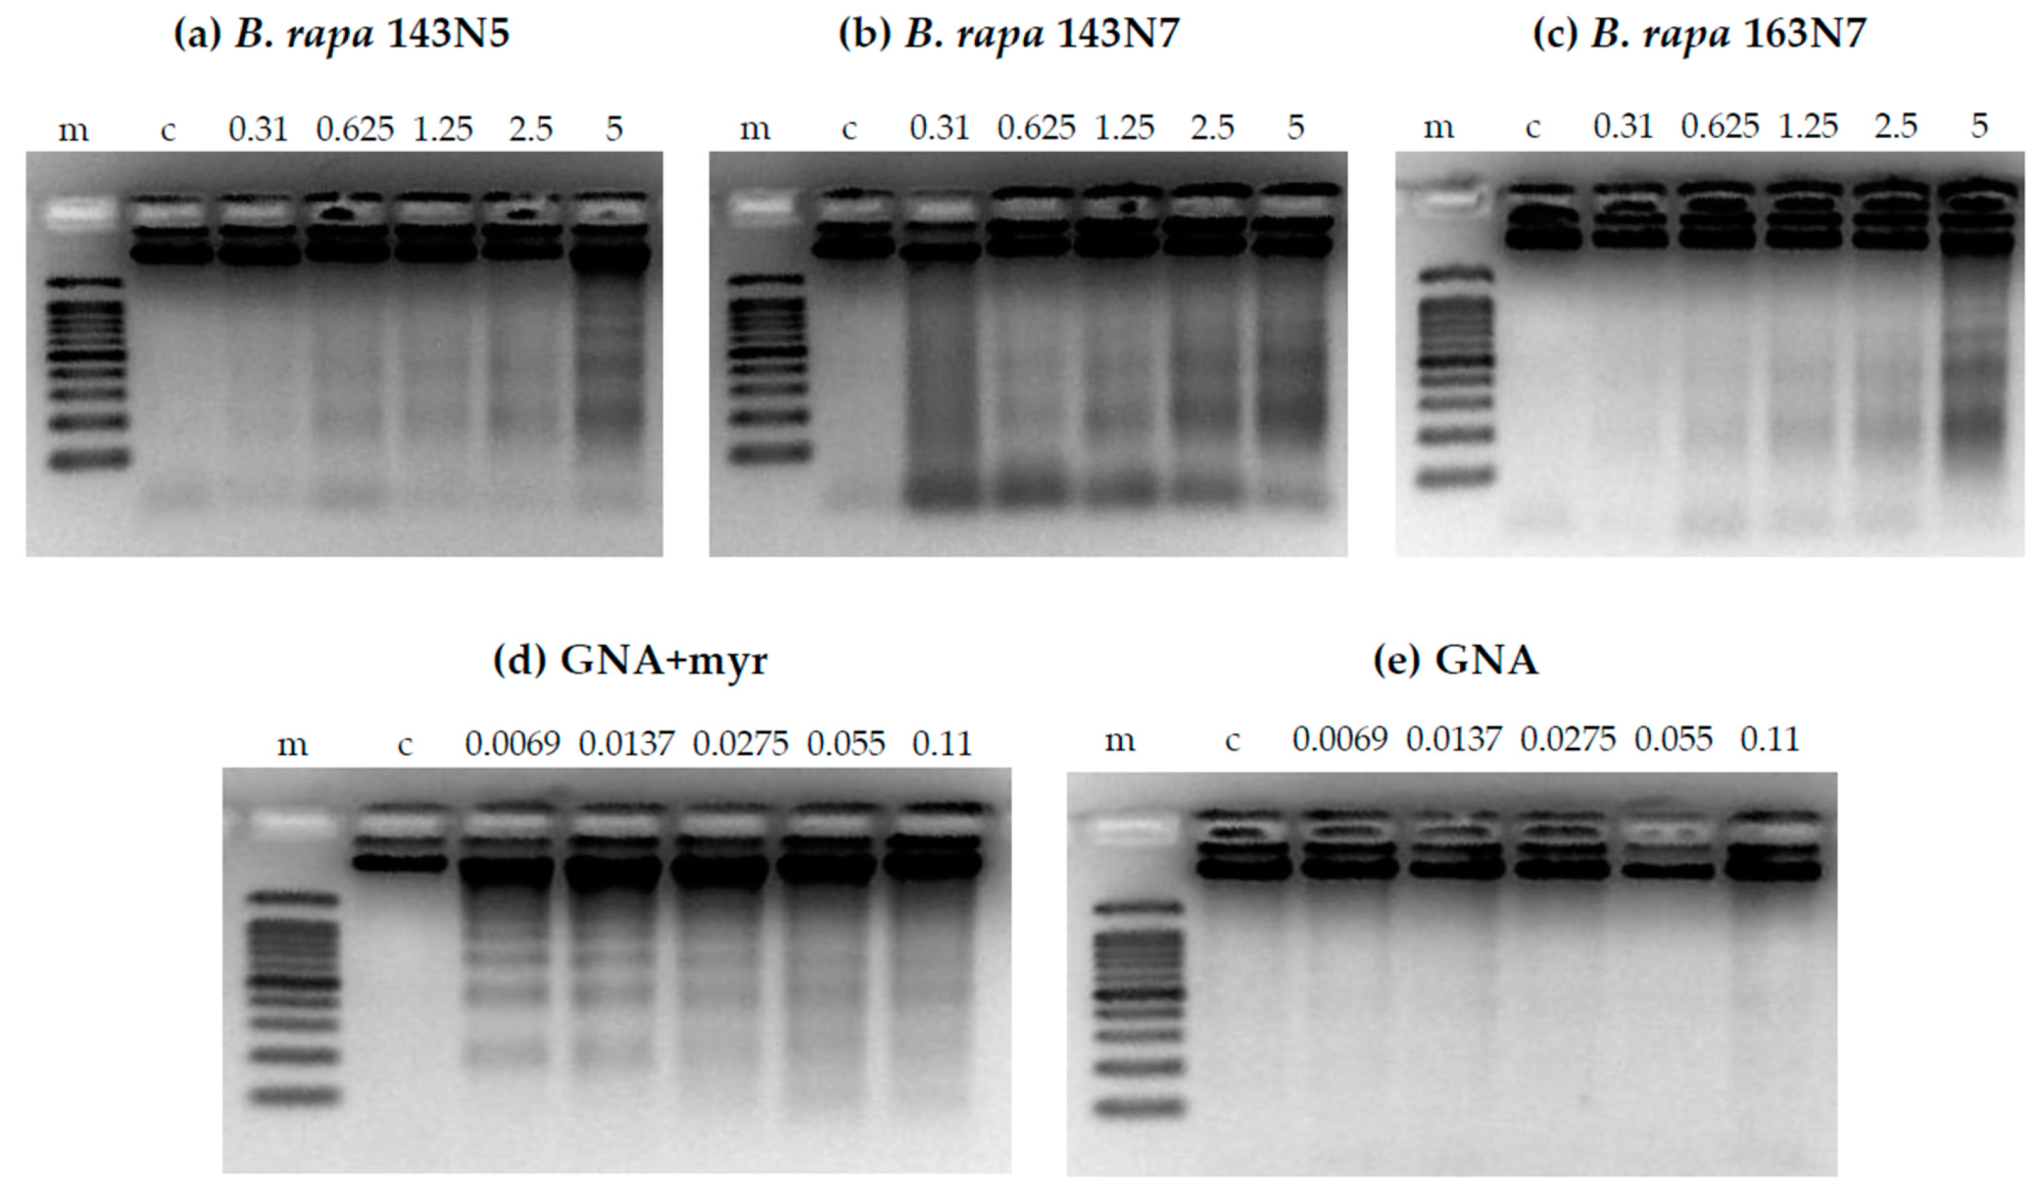
3.2.3. DNA Fragmentation
3.3. Activity Against Degenerative/Oxidative Processes
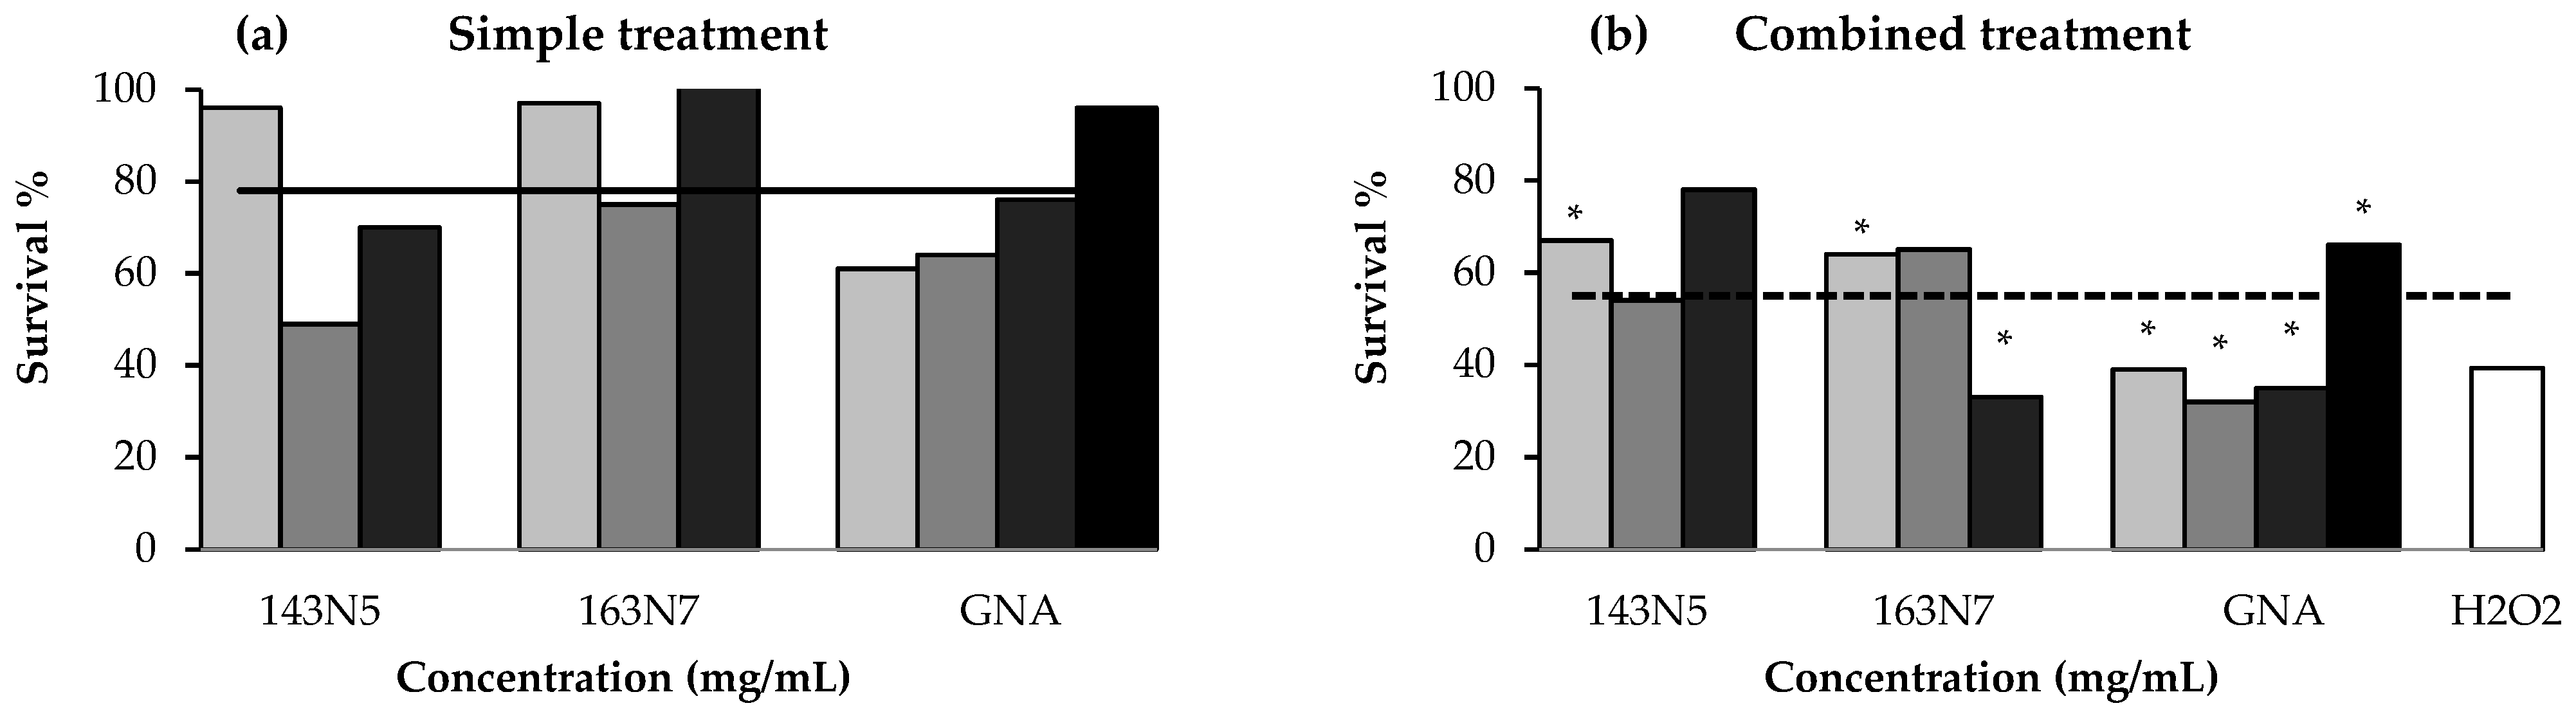
3.3.1. Anti/Toxicity Studies
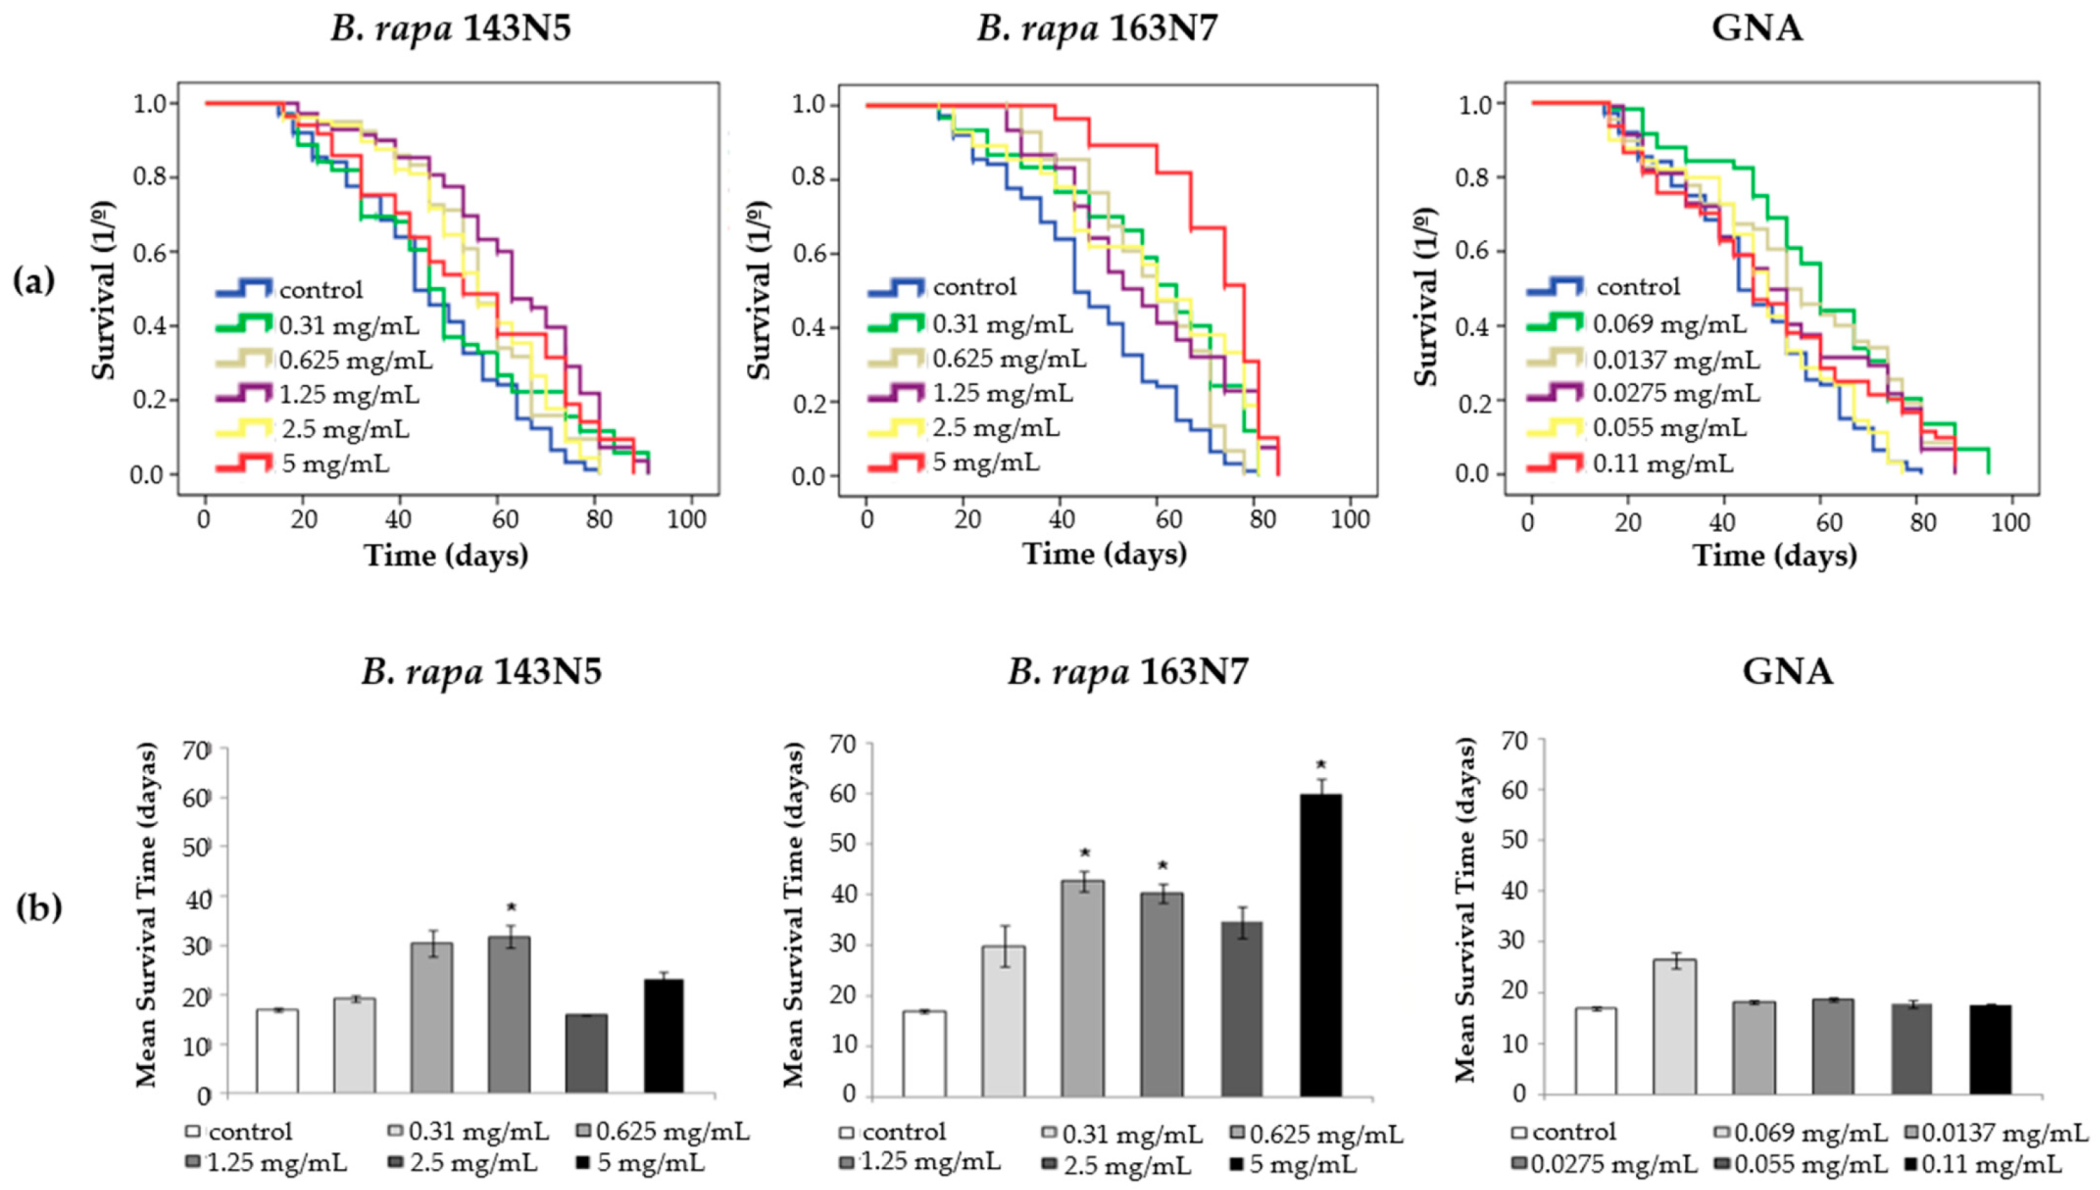
3.3.2. Longevity and Healthspan Studies
3.3.3. Anti/Genotoxicity Assays
4. Conclusions
Author Contributions
Funding
Institutional Review Board Statement
Informed Consent Statement
Data Availability Statement
Conflicts of Interest
References
- Satija, A.; Bhupathiraju, S.N.; Rimm, E.B.; Spiegelman, D.; Chiuve, S.; Borgi, L.; Willett, W.C.; Manson, J.E.; Sun, Q.; Hu, F.B. Plant-Based Dietary Patterns and Incidence of Type 2 Diabetes in US Men and Women: Results from Three Prospective Cohort Studies. PLoS Med. 2016, 13, e1002039. [Google Scholar] [CrossRef] [PubMed] [Green Version]
- Dinu, M.; Pagliai, G.; Casini, A.; Sofi, F. Mediterranean diet and multiple health outcomes: An umbrella review of meta-analyses of observational studies and randomised trials. Eur. J. Clin. Nutr. 2018, 72, 30–43. [Google Scholar] [CrossRef] [PubMed]
- Higdon, J.V.; Delage, B.; Williams, D.E.; Dashwood, R.H. Cruciferous vegetables and human cancer risk: Epidemiologic evidence and mechanistic basis. Pharmacol. Res. 2007, 55, 224–236. [Google Scholar] [CrossRef] [PubMed] [Green Version]
- Keck, A.-S.; Finley, J.W. Cruciferous Vegetables: Cancer Protective Mechanisms of Glucosinolate Hydrolysis Products and Selenium. Integr. Cancer Ther. 2004, 3, 5–12. [Google Scholar] [CrossRef]
- Elshafie, H.; Caputo, L.; De Martino, L.; Sakr, S.; De Feo, V.; Camele, I. Study of Bio-Pharmaceutical and Antimicrobial Properties of Pomegranate (Punica granatum L.) Leathery Exocarp Extract. Plants 2021, 10, 153. [Google Scholar] [CrossRef]
- Biondi, F.; Balducci, F.; Capocasa, F.; Visciglio, M.; Mei, E.; Vagnoni, M.; Mezzetti, B.; Mazzoni, L. Environmental Conditions and Agronomical Factors Influencing the Levels of Phytochemicals in Brassica Vegetables Responsible for Nutritional and Sensorial Properties. Appl. Sci. 2021, 11, 1927. [Google Scholar] [CrossRef]
- D’Antuono, L.F.; Elementi, S.; Neri, R. Exploring new potential health-promoting vegetables: Glucosinolates and sensory attributes of rocket salads and related Diplotaxis and Eruca species. J. Sci. Food Agric. 2009, 89, 713–722. [Google Scholar] [CrossRef]
- Fahey, J.W.; Zhang, Y.; Talalay, P. Broccoli sprouts: An exceptionally rich source of inducers of enzymes that protect against chemical carcinogens. Proc. Natl. Acad. Sci. USA 1997, 94, 10367–10372. [Google Scholar] [CrossRef] [Green Version]
- Mithen, R.F.; Dekker, M.; Verkerk, R.; Rabot, S.; Johnson, I.T. The nutritional significance, biosynthesis and bioavailability of glucosinolates in human foods. J. Sci. Food Agric. 2000, 80, 967–984. [Google Scholar] [CrossRef]
- Traka, M.; Mithen, R. Glucosinolates, isothiocyanates and human health. Phytochem. Rev. 2009, 8, 269–282. [Google Scholar] [CrossRef]
- Lozano-Baena, M.-D.; Tasset, I.; Obregón-Cano, S.; De Haro-Bailón, A.; Muñoz-Serrano, A.; Alonso-Moraga, Á. Antigenotoxicity and Tumor Growing Inhibition by Leafy Brassica carinata and Sinigrin. Molecules 2015, 20, 15748–15765. [Google Scholar] [CrossRef] [Green Version]
- Castro-Torres, I.G.; Castro-Torres, V.A.; Hernández-Lozano, M.; Naranjo-Rodríguez, E.B.; Domínguez-Ortiz, M.Á. Glucosinolates and metabolism. In Glucosinolates: Properties, Recovery, and Applications; Elsevier BV: London, UK, 2020; pp. 107–141. [Google Scholar]
- Vo, Q.V. Biosynthesis and nutritious effects. In Glucosinolates: Properties, Recovery, and Applications; Elsevier BV: London, UK, 2020; pp. 47–78. [Google Scholar]
- Gómez-Campo, C.; Prakash, S. 2 Origin and domestication. In Developments in Plant Genetics and Breeding; Elsevier BV: London, UK, 1999; pp. 33–58. [Google Scholar]
- Prakash, S.; Wu, X.-M.; Bhat, S.R. History, Evolution, and Domestication of Brassica Crops. Plant Breed. Rev. 2011, 35, 19–84. [Google Scholar] [CrossRef]
- Mithen, R. Glucosinolates-biochemistry, genetics and biological activity. Plant Growth Regul. 2001, 34, 91–103. [Google Scholar] [CrossRef]
- Authority, E.F.S. Glucosinolates as undesirable substances in animal feed-Scientific Opinion of the Panel on Contaminants in the Food Chain. EFSA J. 2008, 6, 590. [Google Scholar]
- Di Gioia, F.; Pinela, J.; de Haro Bailón, A.; Fereira, I.C.; Petropoulos, S.A. The dilemma of “good” and “bad” glucosinolates and the potential to regulate their content. In Glucosinolates: Properties, Recovery, and Applications; Elsevier BV: London, UK, 2020; pp. 1–45. [Google Scholar]
- Cartea, M.E.; Cámara-Martos, F.; Obregón, S.; Badenes-Pérez, F.R.; De Haro, A. Advances in Breeding in Vegetable Brassica rapa Crops. Brassica Breed. Biotechnol. 2021, 1–18. [Google Scholar] [CrossRef]
- Schreiner, M.; Mewis, I.; Huyskens-Keil, S.; Jansen, M.; Zrenner, R.; Winkler, J.B.; O’Brien, N.; Krumbein, A. UV-B-Induced Secondary Plant Metabolites—Potential Benefits for Plant and Human Health. Crit. Rev. Plant Sci. 2012, 31, 229–240. [Google Scholar] [CrossRef]
- Bloem, E.; Haneklaus, S.; Schnug, E. Comparative effects of sulfur and nitrogen fertilization and post-harvest processing parameters on the glucotropaeolin content of Tropaeolum majus L. J. Sci. Food Agric. 2007, 87, 1576–1585. [Google Scholar] [CrossRef]
- Poveda, J.; Velasco, P.; de Haro, A.; Johansen, T.; McAlvay, A.; Möllers, C.; Mølmann, J.; Ordiales, E.; Rodríguez, V. Agronomic and Metabolomic Side-Effects of a Divergent Selection for Indol-3-Ylmethylglucosinolate Content in Kale (Brassica oleracea var. acephala). Metabolites 2021, 11, 384. [Google Scholar] [CrossRef]
- Obregón-Cano, S.; Cartea, M.; Moreno, R.; De Haro-Bailón, A. Variation in glucosinolate and mineral content in Galician germplasm of Brassica rapa L. cultivated under Mediterranean conditions. Acta Hortic. 2018, 157–164. [Google Scholar] [CrossRef]
- Font, R.; Celestino, M.D.R.; Cartea, E.; de Haro-Bailón, A. Quantification of glucosinolates in leaves of leaf rape (Brassica napus ssp. pabularia) by near-infrared spectroscopy. Phytochemistry 2005, 66, 175–185. [Google Scholar] [CrossRef]
- Wathelet, J.; Wagstaffe, P.; Boenke, A. The Certification of the Total Glucosinolate and Sulphur Contents of Three Rapeseeds [colza]: CRMs 190, 366 and 367; Final Report; Office for Official Publ. of the Europ. Communities European Commission: Brussels, Belgium, 1991; pp. 1–40. [Google Scholar]
- ISO Norm. Rapeseed, I. Determination of Glucosinolates Content-Part I: Method using High-Performance Liquid Chromatography. ISO 9167-1: 1992; International Standard Organization: Geneva, Switzerland, 1992; pp. 1–9. [Google Scholar]
- Gallagher, R.; Collins, S.; Trujillo, J.; McCredie, K.; Ahearn, M.; Tsai, S.; Metzgar, R.; Aulakh, G.; Ting, R.; Ruscetti, F. Characterization of the continuous, differentiating myeloid cell line (HL-60) from a patient with acute promyelocytic leukemia. Blood 1979, 54, 713. [Google Scholar] [CrossRef] [Green Version]
- Olive, P.L.; Banáth, J.P. The comet assay: A method to measure DNA damage in individual cells. Nat. Protoc. 2006, 1, 23–29. [Google Scholar] [CrossRef]
- Mateo-Fernández, M.; Merinas-Amo, T.; Moreno-Millán, M.; Alonso-Moraga, Á.; Demyda-Peyrás, S. In vivo and in vitro genotoxic and epigenetic effects of two types of cola beverages and caffeine: A multiassay approach. BioMed Res. Int. 2016, 2016, 1–15. [Google Scholar] [CrossRef] [PubMed] [Green Version]
- Pereira, L.L.S.; Marcussi, S.; Sátiro, L.C.; Pereira, C.; Andrade, L.F.; Davide, L.C.; Dos Santos, C.D. Application of Comet assay to assess the effects of white bean meal on DNA of human lymphocytes. Braz. J. Pharm. Sci. 2012, 48, 103–108. [Google Scholar] [CrossRef] [Green Version]
- Merinas-Amo, T.; Tasset-Cuevas, I.; Díaz-Carretero, A.M.; Alonso-Moraga, Á.; Calahorro, F. In vivo and in vitro studies of the role of lyophilised blond Lager beer and some bioactive components in the modulation of degenerative processes. J. Funct. Foods 2016, 27, 274–294. [Google Scholar] [CrossRef]
- Yan, J.; Huen, D.; Morely, T.; Johnson, G.; Gubb, D.; Roote, J.; Adler, P.N. The multiple-wing-hairs Gene Encodes a Novel GBD–FH3 Domain-Containing Protein That Functions Both Prior to and After Wing Hair Initiation. Genetics 2008, 180, 219–228. [Google Scholar] [CrossRef] [Green Version]
- Ren, N.; Charlton, J.; Adler, P.N. The flare Gene, Which Encodes the AIP1 Protein of Drosophila, Functions to Regulate F-Actin Disassembly in Pupal Epidermal Cells. Genetics 2007, 176, 2223–2234. [Google Scholar] [CrossRef] [Green Version]
- Graf, U.; Würgler, F.E.; Katz, A.J.; Frei, H.; Juon, H.; Hall, C.B.; Kale, P.G. Somatic mutation and recombination test in Drosophila melanogaster. Environ. Mutagen. 1984, 6, 153–188. [Google Scholar] [CrossRef]
- Tasset-Cuevas, I.; Fernández-Bedmar, Z.; Lozano-Baena, M.D.; Campos-Sánchez, J.; De Haro-Bailón, A.; Muñoz-Serrano, A.; Alonso-Moraga, Á. Protective Effect of Borage Seed Oil and Gamma Linolenic Acid on DNA: In Vivo and In Vitro Studies. PLoS ONE 2013, 8, e56986. [Google Scholar] [CrossRef] [PubMed] [Green Version]
- Frei, H.; Würgler, F. Statistical methods to decide whether mutagenicity test data from Drosophila assays indicate a positive, negative, or inconclusive result. Mutat. Res. Mutagen. Relat. Subj. 1988, 203, 297–308. [Google Scholar] [CrossRef]
- Frei, H.; Würgler, F.E. Optimal experimental design and sample size for the statistical evaluation of data from somatic mutation and recombination tests (SMART) in Drosophila. Mutat. Res. Mutagen. Relat. Subj. 1995, 334, 247–258. [Google Scholar] [CrossRef]
- Zimmering, S.; Olvera, O.; Hernández, M.; Cruces, M.; Arceo, C.; Pimental, E. Evidence for a radioprotective effect of chlorophyllin in Drosophila. Mutat. Res. Lett. 1990, 245, 47–49. [Google Scholar] [CrossRef]
- Abraham, S.K. Antigenotoxicity of coffee in the Drosophila assay for somatic mutation and recombination. Mutagenesis 1994, 9, 383–386. [Google Scholar] [CrossRef] [PubMed]
- Francisco, M.; Moreno-Fernández, D.Á.; Cartea, M.E.; Ferreres, F.; Garcia-Viguera, C.; Velasco, P. Simultaneous identification of glucosinolates and phenolic compounds in a representative collection of vegetable Brassica rapa. J. Chromatogr. A 2009, 1216, 6611–6619. [Google Scholar] [CrossRef]
- Padilla, G.; Cartea, M.E.; Velasco, P.; De Haro, A.; Ordás, A. Variation of glucosinolates in vegetable crops of Brassica rapa. Phytochemistry 2007, 68, 536–545. [Google Scholar] [CrossRef]
- Cámara-Martos, F.; Obregón-Cano, S.; Mesa-Plata, O.; Cartea-González, M.; de Haro-Bailón, A. Quantification and in vitro bioaccessibility of glucosinolates and trace elements in Brassicaceae leafy vegetables. Food Chem. 2021, 339, 127860. [Google Scholar] [CrossRef] [PubMed]
- Van Doorn, H.E.; Van der Kruk, G.C.; van Holst, G.J.; Raaijmakers-Ruijs, N.C.; Postma, E.; Groeneweg, B.; Jongen, W.H. The glucosinolates sinigrin and progoitrin are important determinants for taste preference and bitterness of Brussels sprouts. J. Sci. Food Agric. 1998, 78, 30–38. [Google Scholar] [CrossRef]
- Azqueta, A.; Collins, A. The essential comet assay: A comprehensive guide to measuring DNA damage and repair. Arch. Toxicol. 2013, 87, 949–968. [Google Scholar] [CrossRef]
- Azqueta, A.; Meier, S.; Priestley, C.; Gutzkow, K.B.; Brunborg, G.; Sallette, J.; Soussaline, F.; Collins, A. The influence of scoring method on variability in results obtained with the comet assay. Mutagenesis 2011, 26, 393–399. [Google Scholar] [CrossRef]
- Collins, A.; Dušinská, M.; Franklin, M.; Somorovská, M.; Petrovská, H.; Duthie, S.; Fillion, L.; Panayiotidis, M.; Rašlová, K.; Vaughan, N. Comet assay in human biomonitoring studies: Reliability, validation, and applications. Environ. Mol. Mutagenesis 1997, 30, 139–146. [Google Scholar] [CrossRef]
- Eberhardt, M.V.; Kobira, K.; Keck, A.-S.; Juvik, A.J.A.; Jeffery, E. Correlation Analyses of Phytochemical Composition, Chemical, and Cellular Measures of Antioxidant Activity of Broccoli (Brassica oleracea L. Var. italica). J. Agric. Food Chem. 2005, 53, 7421–7431. [Google Scholar] [CrossRef]
- Gill, C.I.R.; Haldar, S.; Porter, S.; Matthews, S.; Sullivan, S.; Coulter, J.; McGlynn, H.; Rowland, I. The effect of cruciferous and leguminous sprouts on genotoxicity, in vitro and in vivo. Cancer Epidemiol. Biomark. Prev. 2004, 13, 1199–1205. [Google Scholar]
- Zang, Y.-X.; Kim, H.U.; A Kim, J.; Lim, M.-H.; Jin, M.; Lee, S.C.; Kwon, S.-J.; Lee, S.-I.; Hong, J.K.; Park, T.-H.; et al. Genome-wide identification of glucosinolate synthesis genes in Brassica rapa. FEBS J. 2009, 276, 3559–3574. [Google Scholar] [CrossRef]
- Kwon, D.; Yoon, S.; Carter, O.; Bailey, G.S.; Dashwood, R.H. Antioxidant and antigenotoxic activities of Angelica keiskei, Oenanthe javanica and Brassica oleracea in the Salmonella mutagenicity assay and in HCT116 human colon cancer cells. Biofactors 2006, 26, 231–244. [Google Scholar] [CrossRef] [PubMed]
- de Bruin, E.C.; Medema, J.P. Apoptosis and non-apoptotic deaths in cancer development and treatment response. Cancer Treat Rev. 2008, 34, 737–749. [Google Scholar] [CrossRef]
- Jarvis, W.D.; Turner, A.J.; Povirk, L.F.; Traylor, R.S.; Grant, S. Induction of apoptotic DNA fragmentation and cell death in HL-60 human promyelocytic leukemia cells by pharmacological inhibitors of protein kinase C. Cancer Res. 1994, 54, 1707–1714. [Google Scholar]
- Rubin, G.M.; Yandell, M.D.; Wortman, J.R.; Gabor, G.L.; Miklos, G.L.G.; Nelson, C.R.; Hariharan, I.K.; Fortini, M.E.; Li, P.W.; Apweiler, R.; et al. Comparative Genomics of the Eukaryotes. Science 2000, 287, 2204–2215. [Google Scholar] [CrossRef] [Green Version]
- Zhou, S.; Morozova, T.V.; Hussain, Y.N.; Luoma, S.E.; McCoy, L.; Yamamoto, A.; Mackay, T.F.; Anholt, R.R. The Genetic Basis for Variation in Sensitivity to Lead Toxicity in Drosophila melanogaster. Environ. Health Perspect. 2016, 124, 1062–1070. [Google Scholar] [CrossRef] [PubMed] [Green Version]
- Anter, J.; Tasset, I.; Demyda-Peyrás, S.; Ranchal, I.; Moreno-Millán, M.; Romero-Jimenez, M.; Muntané, J.; de Castro, M.D.L.; Muñoz-Serrano, A.; Alonso-Moraga, Á. Evaluation of potential antigenotoxic, cytotoxic and proapoptotic effects of the olive oil by-product “alperujo”, hydroxytyrosol, tyrosol and verbascoside. Mutat. Res. Toxicol. Environ. Mutagen. 2014, 772, 25–33. [Google Scholar] [CrossRef]
- Lozano-Baena, M.-D.; Tasset, I.; Muñoz-Serrano, A.; Alonso-Moraga, Á.; De Haro-Bailón, A. Cancer Prevention and Health Benefices of Traditionally Consumed Borago officinalis Plants. Nutrients 2016, 8, 48. [Google Scholar] [CrossRef] [PubMed] [Green Version]
- Fleming, J.; Reveillaud, I.; Niedzwiecki, A. Role of oxidative stress in Drosophila aging. Mutat. Res. 1992, 275, 267–279. [Google Scholar] [CrossRef]
- Villatoro, M.; Font, R.; Saha, S.; Obregón-Cano, S.; Anter, J.; Muñoz-Serrano, A.; De Haro-Bailón, A.; Alonso-Moraga, A.; Celestino, M.D.R. In vivo biological activity of rocket extracts (Eruca vesicaria subsp. sativa (Miller) Thell) and sulforaphane. Food Chem. Toxicol. 2012, 50, 1384–1392. [Google Scholar] [CrossRef]
- Romero-Jiménez, M.; Campos-Sánchez, J.; Analla, M.; Muñoz-Serrano, A.; Alonso-Moraga, Á. Genotoxicity and anti-genotoxicity of some traditional medicinal herbs. Mutat. Res. Toxicol. Environ. Mutagen. 2005, 585, 147–155. [Google Scholar] [CrossRef]
- Fernández-Bedmar, Z.; Anter, J.; De La Cruz-Ares, S.; Muñoz-Serrano, A.; Alonso-Moraga, Á.; Pérez-Guisado, J. Role of Citrus Juices and Distinctive Components in the Modulation of Degenerative Processes: Genotoxicity, Antigenotoxicity, Cytotoxicity, and Longevity in Drosophila. J. Toxicol. Environ. Health Part A 2011, 74, 1052–1066. [Google Scholar] [CrossRef] [PubMed]
- Sortibrán, A.; Téllez, M.; Arnaiz, R. Assessment of the genotoxic and antioxidant activities of several vegetables, spices and herbs in combination with cyclophosphamide and 4-nitroquinoline n-oxide in Drosophila melanogaster. Adv. Tech. Biol. Med. 2015, 1, 2379-1764. [Google Scholar]
- Mann, S.K.; Khanna, N.; Kaur, S. Health Promoting Effects of Phytochemicals from Brassicaceae: A Review. Indian J. Pharm. Biol. Res. 2013, 1, 120–131. [Google Scholar] [CrossRef]
- Ren, W.; Qiao, Z.; Wang, H.; Zhu, L.; Zhang, L. Flavonoids: Promising anticancer agents. Med. Res. Rev. 2003, 23, 519–534. [Google Scholar] [CrossRef] [PubMed]
- Liu, R.H. Potential Synergy of Phytochemicals in Cancer Prevention: Mechanism of Action. J. Nutr. 2004, 134, 3479S–3485S. [Google Scholar] [CrossRef] [Green Version]

| Trivial Name | Chemical Class—Systematic Name | Abbreviation |
|---|---|---|
| Aliphatic | ||
| Gluconapin | 3-Butenyl glucosinolate | GNA |
| Progoitrin | 2-Hydroxy-3-butenyl glucosinolate | PRO |
| Glucobrassicanapin | 4-Pentenyl glucosinolate | GBN |
| Aromatic | ||
| Gluconasturtin | 2-Phenylethyl glucosinolate | GST |
| Indole | ||
| Glucobrassicin | 3-Indolymethyl glucosinolate | GBS |
| Glucosinolate Content (µmol/g Dry Weight) | |||||||
|---|---|---|---|---|---|---|---|
| Aliphatic | Indole | Aromatic | |||||
| B. rapa | Total | GNA * | PRO | GBN | GST | GBS | Others |
| 143N5 | 8.58 | 6.07 (1) | 0.90 (2) | 0.43 (4) | 0.46 (3) | 0.19 (5) | 0.53 |
| 143N7 | 25.45 | 19.35 (1) | 3.06 (2) | 0.72 (4) | 1.12 (3) | 0.31 (5) | 0.89 |
| 163N7 | 60.88 | 54.12 (1) | 0.89 (5) | 2.21 (2) | 1.82 (3) | 0.92 (4) | 0.91 |
| Compound | Concentration (mg/mL) | Lifespan Average (days) | Mean Lifespan Difference (%) | Healthspan Average (days) | Mean Healthspan Difference (%) |
|---|---|---|---|---|---|
| B. rapa 143N5 | control | 46.365 | 16.929 | ||
| 0.31 | 49.506 | 7 | 19.231 | 13 | |
| 0.625 | 56.332 ** | 21 | 30.308 | 79 | |
| 1.25 | 62.747 *** | 35 | 31.714 * | 87 | |
| 2.5 | 55.891 ** | 20 | 16.000 | −5 | |
| 5 | 54.611 * | 18 | 23.286 | 37 | |
| B. rapa 163N7 | control | 46.365 | 16.929 | ||
| 0.31 | 58.098 ** | 25 | 40.238 | 137 | |
| 0.625 | 58.510 * | 26 | 42.679 * | 152 | |
| 1.25 | 57.908 ** | 26 | 40.302 * | 138 | |
| 2.5 | 57.917 *** | 25 | 34.574 | 104 | |
| 5 | 72.066 *** | 55 | 59.854 * | 253 | |
| GNA | control | 46.365 | 16.929 | ||
| 0.0069 | 59.931 *** | 29 | 26.357 | 55 | |
| 0.0137 | 55.157 *** | 19 | 18.143 | 7 | |
| 0.0275 | 51.819 ** | 12 | 18.700 | 10 | |
| 0.055 | 48.241 | 4 | 17.929 | 6 | |
| 0.11 | 49.828 * | 7 | 17.500 | 3 |
| Mutation Rate (Spots/Wing) Diagnosis 1 | ||||||
|---|---|---|---|---|---|---|
| Compound | N° of Wings | Small Spots (1–2 Cells) m = 2 | Large Spots (>2 Cells) m = 5 | Twin Spots m = 5 | Total Spots m = 2 | Estimate Recombination Percentage |
| H2O | 40 | 0.15 (6) i | 0.025 (1) d | 0 | 0.175 (7) | |
| H2O2 (0.12 M) | 40 | 0.3 (12) i | 0.15 (6) i | 0.025 (1) d | 0.475 (19) + | |
| H2O2 (0.12 M) (S 2) | 40 | 0.275 (11) + | 0 | 0 | 0.275 (11) + | [(0.475–0.275)/0.475] × 100 = 42.107 |
| B. rapa 143N5 (mg/mL) | ||||||
| 1.25 | 40 | 0.375 (15) i | 0.05 (2) − | 0 | 0.425 (17) + | |
| 1.25 (S 2) | 40 | 0.225 (9) + | 0.025 (1) i | 0 | 0.25 (10) + | [(0.4–0.25)/0.4] × 100 = 37.5 |
| 5 | 40 | 0.2 (8) i | 0.025 (1) d | 0.05 (2) − | 0.275 (11) i | |
| B. rapa 163N7 (mg/mL) | ||||||
| 1.25 | 40 | 0.175 (7) i | 0 | 0 | 0.175 (7) i | |
| 5 | 40 | 0.125 (5) i | 0.075 (3) − | 0.025 (1) d | 0.225 (9) i | |
| GNA (mg/mL) | ||||||
| 0.0137 | 40 | 0.1 (4) − | 0.05 (2) − | 0.025 (1) d | 0.175 (7) i | |
| 0.11 | 40 | 0.25 (10) i | 0 | 0 | 0.25 (10) i | |
| Mutation Rate (Spots/Wing) Diagnosis 1 | ||||||
|---|---|---|---|---|---|---|
| Compound | N° of Wings | Small Spots (1–2 Cells) m = 2 | Large Spots (>2 Cells) m = 5 | Twin Spots m = 5 | Total Spots m = 2 | IP 2 (%) |
| H2O | 40 | 0.15 (6) | 0.025 (1) | 0 | 0.175 (7) | |
| H2O2 (0.12 M) | 40 | 0.3 (12) i | 0.15 (6) i | 0.025 (1) d | 0.475 (19) + | |
| B. rapa 143N5 (mg/mL) | ||||||
| 1.25 | 40 | 0.225 (9) i | 0 | 0.025 (1) d | 0.25 (10) i | 47.4 * |
| 5 | 40 | 0.15 (6) i | 0.025 (1) d | 0 | 0.175 (7) i | 63.2 ** |
| B. rapa 163N7 (mg/mL) | ||||||
| 1.25 | 40 | 0.175 (7) i | 0.025 (1) d | 0.025 (1) d | 0.225 (9) i | 52.6 * |
| 5 | 34 | 0.147 (5) i | 0 | 0 | 0.147 (5) i | 69 ** |
| GNA (mg/mL) | ||||||
| 0.0137 | 40 | 0.2 (8) i | 0 | 0.025 (1) d | 0.225 (9) i | 52.6 * |
| 0.11 | 39 | 0.128 (5) i | 0 | 0 | 0.128 (5) i | 73 *** |
Publisher’s Note: MDPI stays neutral with regard to jurisdictional claims in published maps and institutional affiliations. |
© 2021 by the authors. Licensee MDPI, Basel, Switzerland. This article is an open access article distributed under the terms and conditions of the Creative Commons Attribution (CC BY) license (https://creativecommons.org/licenses/by/4.0/).
Share and Cite
Merinas-Amo, T.; Lozano-Baena, M.-D.; Obregón-Cano, S.; Alonso-Moraga, Á.; de Haro-Bailón, A. Role of Glucosinolates in the Nutraceutical Potential of Selected Cultivars of Brassica rapa. Foods 2021, 10, 2720. https://doi.org/10.3390/foods10112720
Merinas-Amo T, Lozano-Baena M-D, Obregón-Cano S, Alonso-Moraga Á, de Haro-Bailón A. Role of Glucosinolates in the Nutraceutical Potential of Selected Cultivars of Brassica rapa. Foods. 2021; 10(11):2720. https://doi.org/10.3390/foods10112720
Chicago/Turabian StyleMerinas-Amo, Tania, María-Dolores Lozano-Baena, Sara Obregón-Cano, Ángeles Alonso-Moraga, and Antonio de Haro-Bailón. 2021. "Role of Glucosinolates in the Nutraceutical Potential of Selected Cultivars of Brassica rapa" Foods 10, no. 11: 2720. https://doi.org/10.3390/foods10112720
APA StyleMerinas-Amo, T., Lozano-Baena, M.-D., Obregón-Cano, S., Alonso-Moraga, Á., & de Haro-Bailón, A. (2021). Role of Glucosinolates in the Nutraceutical Potential of Selected Cultivars of Brassica rapa. Foods, 10(11), 2720. https://doi.org/10.3390/foods10112720