
Impact of Nutritional Intervention on Taste Perception—A Scoping Review

 , ,
, ,  ,
,  , and
, and
Abstract
:1. Introduction
2. Scoping Review Methods
2.1. Eligibility Criteria
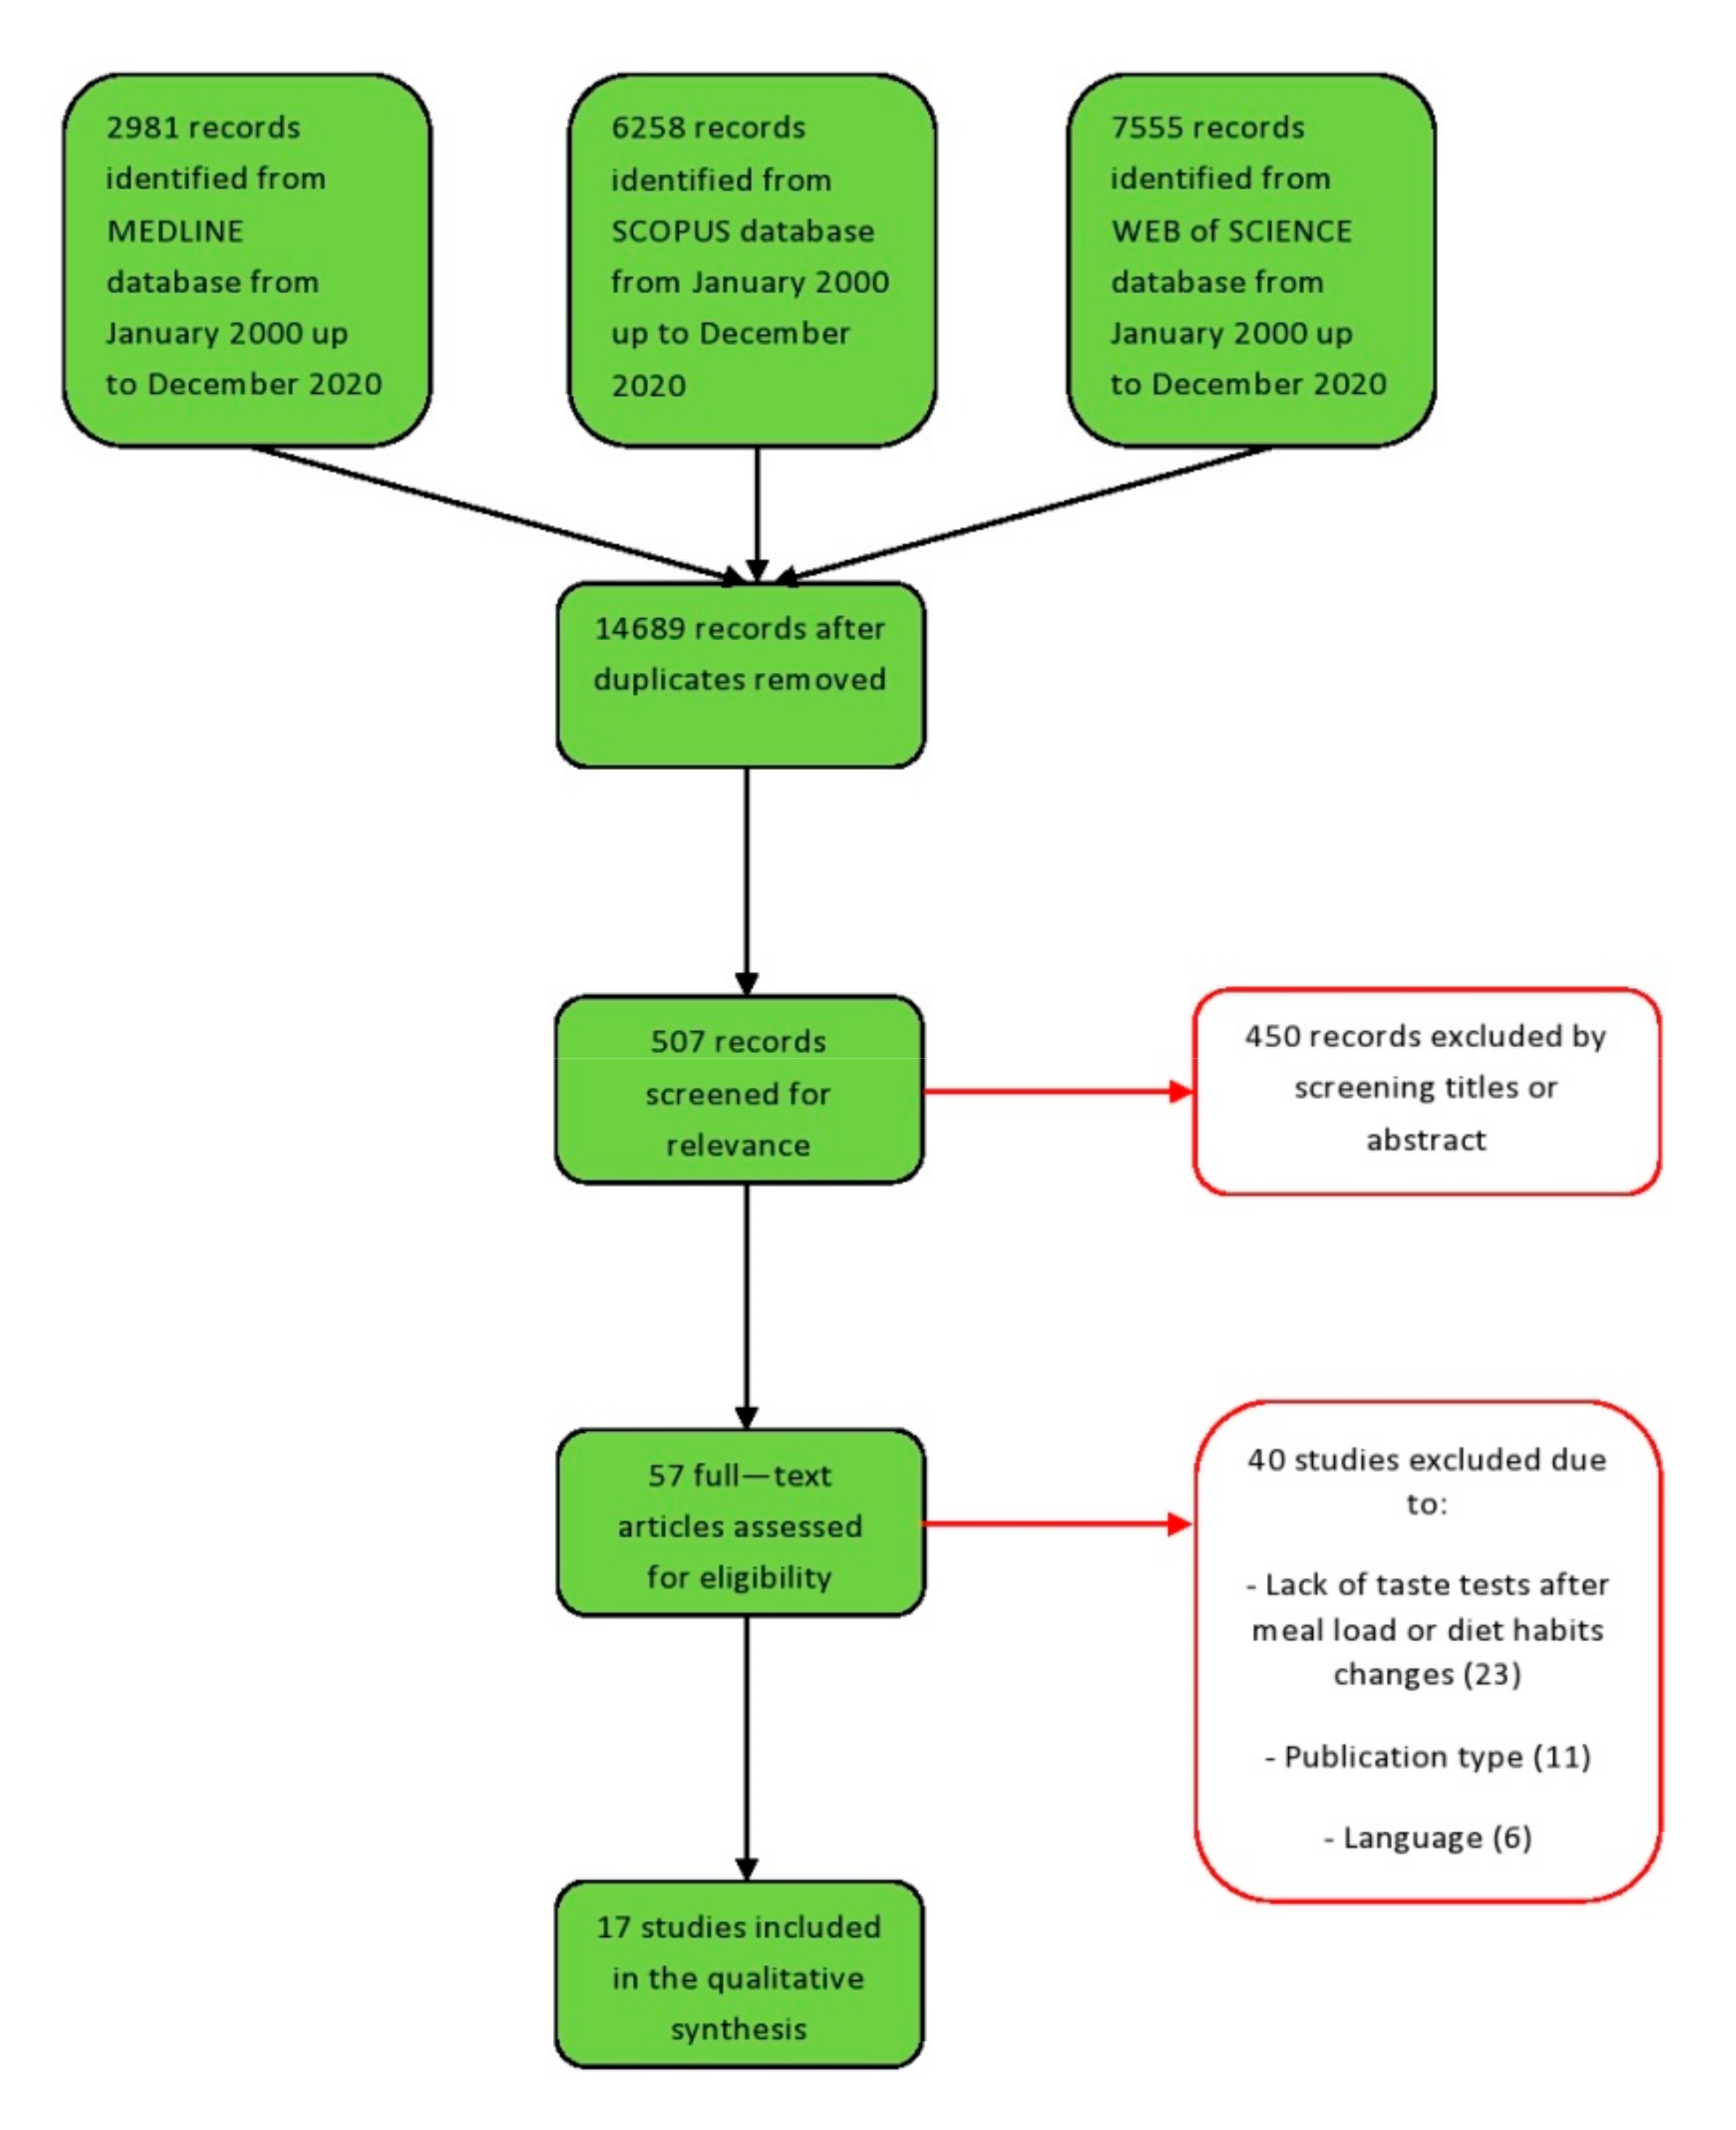
2.2. Information Sources, Search Strategy, and Study Selection
2.3. Data Extraction
3. Results
3.1. Observational Studies
3.2. Interventional Studies
4. Discussion
Author Contributions
Funding
Institutional Review Board Statement
Informed Consent Statement
Data Availability Statement
Conflicts of Interest
References
- Boesveldt, S.; De Graaf, K. The Differential Role of Smell and Taste for Eating Behavior. Perception 2017, 46, 307–319. [Google Scholar] [CrossRef]
- Bolhuis, D.P.; Forde, C.; Cheng, Y.; Xu, H.; Martin, N.; De Graaf, C. Slow Food: Sustained Impact of Harder Foods on the Reduction in Energy Intake over the Course of the Day. PLoS ONE 2014, 9, e93370. [Google Scholar] [CrossRef]
- Dongen, M.V.-V.; Kok, F.J.; de Graaf, C. Eating rate of commonly consumed foods promotes food and energy intake. Appetite 2011, 56, 25–31. [Google Scholar] [CrossRef] [Green Version]
- Zijlstra, N.; Mars, M.; A De Wijk, R.; Westerterp-Plantenga, M.S.; De Graaf, C. The effect of viscosity on ad libitum food intake. Int. J. Obes. 2007, 32, 676–683. [Google Scholar] [CrossRef] [PubMed] [Green Version]
- Forde, C.; van Kuijk, N.; Thaler, T.; de Graaf, C.; Martin, N. Texture and savoury taste influences on food intake in a realistic hot lunch time meal. Appetite 2013, 60, 180–186. [Google Scholar] [CrossRef]
- Weijzen, P.L.G.; Smeets, P.; De Graaf, C. Sip size of orangeade: Effects on intake and sensory-specific satiation. Br. J. Nutr. 2009, 102, 1091–1097. [Google Scholar] [CrossRef] [Green Version]
- Bolhuis, D.P.; Lakemond, C.M.M.; De Wijk, R.A.; Luning, P.A.; De Graaf, C. Consumption with Large Sip Sizes Increases Food Intake and Leads to Underestimation of the Amount Consumed. PLoS ONE 2013, 8, e53288. [Google Scholar] [CrossRef]
- Bolhuis, D.; Lakemond, C.M.; de Wijk, R.A.; Luning, P.A.; de Graaf, C. Both a higher number of sips and a longer oral transit time reduce ad libitum intake. Food Qual. Preference 2014, 32, 234–240. [Google Scholar] [CrossRef]
- Berthoud, H.-R. Multiple neural systems controlling food intake and body weight. Neurosci. Biobehav. Rev. 2002, 26, 393–428. [Google Scholar] [CrossRef]
- Landis, B.N.; Leuchter, I.; San Millán Ruíz, D.; Lacroix, J.S.; Landis, T. Transient hemiageusia in cerebrovascular lateral pontine lesions. J. Neurol. Neurosurg. Psychiatry 2006, 77, 680–683. [Google Scholar] [CrossRef] [Green Version]
- Fromentin, G.; Darcel, N.; Chaumontet, C.; Marsset-Baglieri, A.; Nadkarni, N.; Tomé, D. Peripheral and central mechanisms involved in the control of food intake by dietary amino acids and proteins. Nutr. Res. Rev. 2012, 25, 29–39. [Google Scholar] [CrossRef] [PubMed] [Green Version]
- Faipoux, R.; Tomé, D.; Gougis, S.; Darcel, N.; Fromentin, G. Proteins Activate Satiety-Related Neuronal Pathways in the Brainstem and Hypothalamus of Rats. J. Nutr. 2008, 138, 1172–1178. [Google Scholar] [CrossRef] [Green Version]
- Henkin, R.I.; Powell, G.F. Increased Sensitivity of Taste and Smell in Cystic Fibrosis. Science 1962, 138, 1107–1108. [Google Scholar] [CrossRef] [PubMed]
- Henkin, R.I.; Gill, J.R.; Bartter, F.C. Studies on taste thresholds in normal man and in patients with adrenal cortical insufficiency: The role of adrenal cortical steroids and of serum sodium concentration. J. Clin. Investig. 1963, 42, 727–735. [Google Scholar] [CrossRef] [Green Version]
- Ahne, G.; Erras, A.; Hummel, T.; Kobal, G. Assessment of Gustatory Function by Means of Tasting Tablets. Laryngoscope 2000, 110, 1396–1401. [Google Scholar] [CrossRef]
- Hummel, T.; Erras, A.; Kobal, G. A test for the screening of taste function. Rhinol. J. 1997, 35, 146–148. [Google Scholar]
- Mueller, C.; Kallert, S.; Renner, B.; Stiassny, K.; Temmel, A.F.P.; Hummel, T.; Kobal, G. Quantitative assessment of gustatory function in a clinical context using impregnated "taste strips". Rhinol. J. 2003, 41, 2–6. [Google Scholar]
- Landis, B.N.; Welge-Luessen, A.; Brämerson, A.; Bende, M.; Mueller, C.A.; Nordin, S.; Hummel, T. “Taste Strips”–A rapid, lateralized, gustatory bedside identification test based on impregnated filter papers. J. Neurol. 2009, 256, 242–248. [Google Scholar] [CrossRef] [PubMed] [Green Version]
- Mueller, C.A.; Khatib, S.; Landis, B.N.; Temmel, A.F.P.; Hummel, T. Gustatory Function after Tonsillectomy. Arch. Otolaryngol. Head Neck Surg. 2007, 133, 668–671. [Google Scholar] [CrossRef] [PubMed]
- Stewart, J.E.; Feinle-Bisset, C.; Golding, M.; Delahunty, C.; Clifton, P.M.; Keast, R.S.J. Oral sensitivity to fatty acids, food consumption and BMI in human subjects. Br. J. Nutr. 2010, 104, 145–152. [Google Scholar] [CrossRef] [Green Version]
- E Stewart, J.; Keast, R. Recent fat intake modulates fat taste sensitivity in lean and overweight subjects. Int. J. Obes. 2011, 36, 834–842. [Google Scholar] [CrossRef] [Green Version]
- Tucker, R.M.; Nuessle, T.M.; Garneau, N.; Smutzer, G.; Mattes, R.D. No Difference in Perceived Intensity of Linoleic Acid in the Oral Cavity between Obese and Nonobese Individuals. Chem. Senses 2015, 40, 557–563. [Google Scholar] [CrossRef]
- Hinchcliffe, R. Clinical Quantitative Gustometry. Acta Oto-Laryngologica 1958, 49, 453–466. [Google Scholar] [CrossRef]
- Nishimoto, K.; Hirota, R.; Egawa, M.; Furuta, S. Clinical Evaluation of Taste Dysfunction Using a Salt-Impregnated Taste Strip. ORL 1996, 58, 258–261. [Google Scholar] [CrossRef] [PubMed]
- Essed, N.H.; Kleikers, S.; Van Staveren, W.A.; Kok, F.J.; De Graaf, C. No effect on intake and liking of soup enhanced with mono-sodium glutamate and celery powder among elderly people with olfactory and/or gustatory loss. Int. J. Food Sci. Nutr. 2009, 60 (Suppl. 5), 143–154. [Google Scholar] [CrossRef] [PubMed]
- Krarup, B. Electrogustometric examinations in cerebellopontine tumors and on taste pathways. Neurology 1959, 9, 53. [Google Scholar] [CrossRef] [PubMed]
- Schuster, B.; Iannilli, E.; Gudziol, V.; Landis, B.N. Gustatory testing for clinicians. B-ENT 2009, 5 (Suppl. 13), 109–113. [Google Scholar]
- Shibamori, Y.; Yamamoto, T.; Saito, T.; Manabe, Y.; Ohtsubo, T.; Yamagishi, T.; Saito, H. Morphological and functional study of regenerated chorda tympani nerves in humans. Ann. Otol. Rhinol. Laryngol. 2000, 109, 703–709. [Google Scholar] [CrossRef] [PubMed]
- Saito, T.; Manabe, Y.; Shibamori, Y.; Yamagishi, T.; Igawa, H.; Tokuriki, M.; Fukuoka, Y.; Noda, I.; Ohtsubo, T.; Saito, H. Long-Term Follow-up Results of Electrogustometry and Subjective Taste Disorder After Middle Ear Surgery. Laryngoscope 2001, 111, 2064–2070. [Google Scholar] [CrossRef]
- Schoenfeld, M.; Neuer, G.; Tempelmann, C.; Schüßler, K.; Noesselt, T.; Hopf, J.-M.; Heinze, H.-J. Functional magnetic resonance tomography correlates of taste perception in the human primary taste cortex. Neuroscience 2004, 127, 347–353. [Google Scholar] [CrossRef]
- Ogawa, H.; Wakita, M.; Hasegawa, K.; Kobayakawa, T.; Sakai, N.; Hirai, T.; Yamashita, Y.; Saito, S. Functional MRI Detection of Activation in the Primary Gustatory Cortices in Humans. Chem. Senses 2005, 30, 583–592. [Google Scholar] [CrossRef] [PubMed] [Green Version]
- Small, D.M.; Jones-Gotman, M.; Zatorre, R.J.; Petrides, M.; Evans, A.C. Flavor processing: More than the sum of its parts. NeuroReport 1997, 8, 3913–3917. [Google Scholar] [CrossRef] [PubMed]
- Just, T.; Pau, H.W.; Bombor, I.; Guthoff, R.F.; Fietkau, R.; Hummel, T. Confocal microscopy of the Peripheral Gustatory System: Comparison between Healthy Subjects and Patients Suffering from Taste Disorders during Radiochemotherapy. Laryngoscope 2005, 115, 2178–2182. [Google Scholar] [CrossRef]
- Just, T.; Pau, H.W.; Witt, M.; Hummel, T. Contact Endoscopic Comparison of Morphology of Human Fungiform Papillae of Healthy Subjects and Patients with Transected Chorda Tympani Nerve. Laryngoscope 2006, 116, 1216–1222. [Google Scholar] [CrossRef] [PubMed]
- Tricco, A.C.; Lillie, E.; Zarin, W.; O’Brien, K.K.; Colquhoun, H.; Levac, D.; Moher, D.; Peters, M.; Horsley, T.; Weeks, L.; et al. PRISMA Extension for Scoping Reviews (PRISMA-ScR): Checklist and Explanation. Ann. Intern. Med. 2018, 169, 467–473. [Google Scholar] [CrossRef] [PubMed] [Green Version]
- Peters, M.D.J. In no uncertain terms: The importance of a defined objective in scoping reviews. JBI Database Syst. Rev. Implement. Rep. 2016, 14, 1–4. [Google Scholar] [CrossRef] [Green Version]
- Munn, Z.; Peters, M.D.J.; Stern, C.; Tufanaru, C.; McArthur, A.; Aromataris, E. Systematic review or scoping review? Guidance for authors when choosing between a systematic or scoping review approach. BMC Med. Res. Methodol. 2018, 18, 1–7. [Google Scholar] [CrossRef]
- Ouzzani, M.; Hammady, H.; Fedorowicz, Z.; Elmagarmid, A. Rayyan—A web and mobile app for systematic reviews. Syst. Rev. 2016, 5, 1–10. [Google Scholar] [CrossRef] [PubMed] [Green Version]
- Mattes, R.D.; DiMeglio, D. Ethanol perception and ingestion. Physiol. Behav. 2001, 72, 217–229. [Google Scholar] [CrossRef]
- Noh, H.; Paik, H.-Y.; Kim, J.; Chung, J. Salty Taste Acuity Is Affected by the Joint Action of αENaC A663T Gene Polymorphism and Available Zinc Intake in Young Women. Nutrients 2013, 5, 4950–4963. [Google Scholar] [CrossRef] [PubMed]
- Zdilla, M.J.; Saling, J.R.; Starkey, L.D. Zinc sulfate taste acuity reflects dietary zinc intake in males. Clin. Nutr. ESPEN 2016, 11, e21–e25. [Google Scholar] [CrossRef] [PubMed]
- Costanzo, A.; Orellana, L.; Nowson, C.; Duesing, K.; Keast, R. Fat Taste Sensitivity Is Associated with Short-Term and Habitual Fat Intake. Nutrients 2017, 9, 781. [Google Scholar] [CrossRef] [PubMed] [Green Version]
- Dalenberg, J.R.; Patel, B.P.; Denis, R.; Veldhuizen, M.; Nakamura, Y.; Vinke, P.C.; Luquet, S.; Small, D.M. Short-Term Consumption of Sucralose with, but Not without, Carbohydrate Impairs Neural and Metabolic Sensitivity to Sugar in Humans. Cell Metab. 2020, 31, 493–502. [Google Scholar] [CrossRef]
- Fjaeldstad, A.W.; Fernandes, H.M. Chemosensory Sensitivity after Coffee Consumption Is Not Static: Short-Term Effects on Gustatory and Olfactory Sensitivity. Foods 2020, 9, 493. [Google Scholar] [CrossRef] [PubMed] [Green Version]
- A Noel, C.; Finlayson, G.; Dando, R. Prolonged Exposure to Monosodium Glutamate in Healthy Young Adults Decreases Perceived Umami Taste and Diminishes Appetite for Savory Foods. J. Nutr. 2018, 148, 980–988. [Google Scholar] [CrossRef] [PubMed] [Green Version]
- Pasquet, P.; Monneuse, M.-O.; Simmen, B.; Marez, A.; Hladik, C.-M. Relationship between taste thresholds and hunger under debate. Appetite 2006, 46, 63–66. [Google Scholar] [CrossRef] [PubMed] [Green Version]
- Wise, P.M.; Nattress, L.; Flammer, L.J.; Beauchamp, G.K. Reduced dietary intake of simple sugars alters perceived sweet taste intensity but not perceived pleasantness. Am. J. Clin. Nutr. 2016, 103, 50–60. [Google Scholar] [CrossRef]
- Zverev, Y.P. Effects of caloric deprivation and satiety on sensitivity of the gustatory system. BMC Neurosci. 2004, 5, 5. [Google Scholar] [CrossRef] [PubMed] [Green Version]
- Kusaba, T.; Mori, Y.; Masami, O.; Hiroko, N.; Adachi, T.; Sugishita, C.; Sonomura, K.; Kimura, T.; Kishimoto, N.; Nakagawa, H.; et al. Sodium restriction improves the gustatory threshold for salty taste in patients with chronic kidney disease. Kidney Int. 2009, 76, 638–643. [Google Scholar] [CrossRef] [PubMed] [Green Version]
- Umabiki, M.; Tsuzaki, K.; Kotani, K.; Nagai, N.; Sano, Y.; Matsuoka, Y.; Kitaoka, K.; Okami, Y.; Sakane, N.; Higashi, A. The Improvement of Sweet Taste Sensitivity with Decrease in Serum Leptin Levels during Weight Loss in Obese Females. Tohoku J. Exp. Med. 2010, 220, 267–271. [Google Scholar] [CrossRef] [PubMed] [Green Version]
- Bolhuis, D.P.; Gijsbers, L.; De Jager, I.; Geleijnse, J.M.; De Graaf, K. Encapsulated sodium supplementation of 4weeks does not alter salt taste preferences in a controlled low sodium and low potassium diet. Food Qual. Preference 2015, 46, 58–65. [Google Scholar] [CrossRef]
- Newman, L.P.; Bolhuis, D.P.; Torres, S.J.; Keast, R.S. Dietary fat restriction increases fat taste sensitivity in people with obesity. Obesity 2016, 24, 328–334. [Google Scholar] [CrossRef] [PubMed] [Green Version]
- Newman, L.P.; Torres, S.J.; Bolhuis, D.P.; Keast, R.S. The influence of a high-fat meal on fat taste thresholds. Appetite 2016, 101, 199–204. [Google Scholar] [CrossRef]
- Chen, K.; Yan, J.; Suo, Y.; Li, J.; Wang, Q.; Lv, B. Nutritional status alters saccharin intake and sweet receptor mRNA expression in rat taste buds. Brain Res. 2010, 1325, 53–62. [Google Scholar] [CrossRef]
- Maliphol, A.B.; Garth, D.J.; Medler, K.F. Diet-Induced Obesity Reduces the Responsiveness of the Peripheral Taste Receptor Cells. PLoS ONE 2013, 8, e79403. [Google Scholar] [CrossRef] [PubMed] [Green Version]
- Tellez, L.A.; Han, W.; Zhang, X.; Ferreira, T.; Perez, I.O.; Shammah-Lagnado, S.J.; Pol, A.N.V.D.; De Araujo, I.E. Separate circuitries encode the hedonic and nutritional values of sugar. Nat. Neurosci. 2016, 19, 465–470. [Google Scholar] [CrossRef] [Green Version]
- ter Horst, K.W.; Lammers, N.M.; Trinko, R.; Opland, D.M.; Figee, M.; Ackermans, M.T.; Booij, J.; Munckhof, P.V.D.; Schuurman, P.R.; Fliers, E.; et al. Striatal dopamine regulates systemic glucose metabolism in humans and mice. Sci. Transl. Med. 2018, 10, eaar3752. [Google Scholar] [CrossRef] [PubMed] [Green Version]
- Denton, D.; McKinley, M.J.; Nelson, J.F.; Osborne, P.; Simpson, J.; Tarjan, E.; Weisinger, R.S. Species differences in the effect of decreased CSF sodium concentration on salt appetite. J. de Physiol. 1984, 79, 499–504. [Google Scholar]
- Beauchamp, G.K.; Bertino, M.; Burke, D.; Engelman, K. Experimental sodium depletion and salt taste in normal human volunteers. Am. J. Clin. Nutr. 1990, 51, 881–889. [Google Scholar] [CrossRef] [Green Version]
- Teow, B.H.; Di Nicolantonio, R.; Morgan, T.O. Sodium Chloride Preference and Recognition Threshold in Normotensive Subjects on High and Low salt Diet. Clin. Exp. Hypertens. 1985, 7, 1681–1695. [Google Scholar] [CrossRef]
- Uzu, T.; Kimura, G. Diuretics Shift Circadian Rhythm of Blood Pressure From Nondipper to Dipper in Essential Hypertension. Circulation 1999, 100, 1635–1638. [Google Scholar] [CrossRef] [Green Version]
- Uzu, T.; Kazembe, F.S.; Ishikawa, K.; Nakamura, S.; Inenaga, T.; Kimura, G. High Sodium Sensitivity Implicates Nocturnal Hypertension in Essential Hypertension. Hypertension 1996, 28, 139–142. [Google Scholar] [CrossRef]
- Golik, A.; Modai, D.; Weissgarten, J.; Cohen, N.; Averbukh, Z.; Sigler, E.; Zaidenstein, R.; Shaked, U. Hydrochlorothiazide-amiloride causes excessive urinary zinc excretion. Clin. Pharmacol. Ther. 1987, 42, 42–44. [Google Scholar] [CrossRef] [PubMed]
- Sartor, F.; Donaldson, L.; Markland, D.A.; Loveday, H.; Jackson, M.; Kubis, H.-P. Taste perception and implicit attitude toward sweet related to body mass index and soft drink supplementation. Appetite 2011, 57, 237–246. [Google Scholar] [CrossRef]
- Martin, C.; Passilly-Degrace, P.; Gaillard, D.; Merlin, J.-F.; Chevrot, M.; Besnard, P. The Lipid-Sensor Candidates CD36 and GPR120 Are Differentially Regulated by Dietary Lipids in Mouse Taste Buds: Impact on Spontaneous Fat Preference. PLoS ONE 2011, 6, e24014. [Google Scholar] [CrossRef] [Green Version]
- Zhao, G.Q.; Zhang, Y.; Hoon, M.A.; Chandrashekar, J.; Erlenbach, I.; Ryba, N.J.; Zuker, C.S. The Receptors for Mammalian Sweet and Umami Taste. Cell 2003, 115, 255–266. [Google Scholar] [CrossRef] [Green Version]
- Cartoni, C.; Yasumatsu, K.; Ohkuri, T.; Shigemura, N.; Yoshida, R.; Godinot, N.; Le Coutre, J.; Ninomiya, Y.; Damak, S. Taste Preference for Fatty Acids Is Mediated by GPR40 and GPR120. J. Neurosci. 2010, 30, 8376–8382. [Google Scholar] [CrossRef] [Green Version]
- Laugerette, F.; Passilly-Degrace, P.; Patris, B.; Niot, I.; Febbraio, M.; Montmayeur, J.-P.; Besnard, P. CD36 involvement in orosensory detection of dietary lipids, spontaneous fat preference, and digestive secretions. J. Clin. Investig. 2005, 115, 3177–3184. [Google Scholar] [CrossRef] [PubMed] [Green Version]
- Zhang, X.-J.; Zhou, L.-H.; Ban, X.; Liu, D.-X.; Jiang, W.; Liu, X.-M. Decreased expression of CD36 in circumvallate taste buds of high-fat diet induced obese rats. Acta Histochem. 2011, 113, 663–667. [Google Scholar] [CrossRef]
- Sudakov, K.V. Brain neuronal mechanisms of motivation and reinforcement: Systemic organization of behavior. Integr. Physiol. Behav. Sci. 1993, 28, 396–407. [Google Scholar] [CrossRef]
- Plata-Salamán, C.R. Regulation of Hunger and Satiety in Man. Dig. Dis. 1991, 9, 253–268. [Google Scholar] [CrossRef] [PubMed]
- Sulimov, A.V. The hunger dominant in man and the reactions of the autonomic nervous system. Zhurnal vysshei nervnoi deiatelnosti imeni IP Pavlova 1993, 43, 707–712. [Google Scholar]
- Uryvaev Iu, V.; Zverev Iu, P. A stimulated shift in heart rhythm stability as a condition for CNS activation and stimulus perception. Zhurnal vysshei nervnoi deiatelnosti imeni IP Pavlova 1991, 41, 828–830. [Google Scholar] [CrossRef] [PubMed]
- Fanti, M.; Mishra, A.; Longo, V.D.; Brandhorst, S. Time-Restricted Eating, Intermittent Fasting, and Fasting-Mimicking Diets in Weight Loss. Curr. Obes. Rep. 2021, 10, 70–80. [Google Scholar] [CrossRef]
- Fischer, M.E.; Cruickshanks, K.J.; Ms, C.R.S.; Pinto, A.; Klein, B.E.K.; Klein, R.; Nieto, F.J.; Pankow, J.; Huang, G.-H.; Snyder, D.J. Taste intensity in the Beaver Dam Offspring Study. Laryngoscope 2013, 123, 1399–1404. [Google Scholar] [CrossRef] [PubMed] [Green Version]
- Noel, C.; Dando, R. The effect of emotional state on taste perception. Appetite 2015, 95, 89–95. [Google Scholar] [CrossRef]
- Martin, L.; Sollars, S.I. Contributory role of sex differences in the variations of gustatory function. J. Neurosci. Res. 2017, 95, 594–603. [Google Scholar] [CrossRef] [PubMed]
- A Noel, C.; Cassano, P.A.; Dando, R. College-Aged Males Experience Attenuated Sweet and Salty Taste with Modest Weight Gain. J. Nutr. 2017, 147, 1885–1891. [Google Scholar] [CrossRef] [PubMed] [Green Version]
- Donaldson, L.F.; Bennett, L.; Baic, S.; Melichar, J.K. Taste and weight: Is there a link? Am. J. Clin. Nutr. 2009, 90, 800S–803S. [Google Scholar] [CrossRef] [Green Version]
- Faas, M.M.; Melgert, B.N.; De Vos, P. A Brief Review on How Pregnancy and Sex Hormones Interfere with Taste and Food Intake. Chemosens. Percept. 2009, 3, 51–56. [Google Scholar] [CrossRef] [Green Version]
- Choo, E.; Dando, R. The Impact of Pregnancy on Taste Function. Chem. Senses 2017, 42, 279–286. [Google Scholar] [CrossRef] [PubMed]

| Population |
|
| Concept |
|
| Context |
|
| Main Objectives of the Study | Taste Tests | Setting/Protocol and Other Outcome Measures | Subjects | Taste Results | Reference |
|---|---|---|---|---|---|
| Taste detection thresholds for ethanol and tetralone using a forced-choice, staircase procedure. Quality ratings (% sweet, % salty, % sour, and % bitter) of ethanol and tetralone were obtained for new samples at threshold and for each of the two concentration steps above each subjects’ threshold concentration. Intensity judgements of suprathreshold concentrations of ethanol and tetralone were obtained by having participants rate concentrations of each in duplicate on 100-cm VAS. | Participants recruited by public advertisement, divided in 17 light beer consumers, 17 casual beer consumers, and 16 regular consumers. Oronasal olfactory detection thresholds for ethanol and trigeminal thresholds in the nasal cavity were performed; anthropometric measurements and diet records were collected. | 50 healthy participants (25 females, 25 males; mean age = 28.0 years; mean BMI = 23.6 kg/m2) | Taste thresholds for ethanol and tetralone were not significantly different between light, casual, and regular ethanol consumers. The variance in ethanol and tetralone taste threshold was about twice as high in light users compared to heavier users. Suprathreshold intensity ratings of ethanol and tetralone did not differ between ethanol user groups. Rinse with nonalcoholic beer led to higher sweetness intensity (p = 0.006) compared with other conditions, and higher saltiness and sourness ratings when compared with carbonated water (p = 0.023 and p = 0.016 for 0.5% and 1.5% NaCl solutions, respectively) and beer (p < 0.001 for both). | Mattes RD and Di Meglio D, 2001 [39] |
| To evaluate the relationships among αENaC A663T gene polymorphism, zinc status, and salty taste perception including salty taste acuity and preference. | Salty taste acuity determined by measuring the salty taste recognition threshold with 15 sodium chloride test solutions, administered from lowest to highest concentration, and viceversa. Salty taste preference by measuring the preferred concentration of sodium chloride (with a salt-meter) in a clear soup made with soybean sprouts, seasoned with salt until suiting individual taste. | At the first visit, salty taste acuity and preference were measured by sensory evaluation, and dietary intake data were collected using a 24-h recall method. At the second visit, fasting blood samples and anthropometric data were obtained. Additionally, subjects submitted the dietary intake records at the second visit. Three-day dietary record, anthropometric measurements, biochemical assessments, and αENaC A663T genotyping were collected. | 207 healthy participants (104 males, mean age = 23.6, mean BMI = 23.0 kg/m2; 103 females, mean age = 23.6, mean BMI = 20.9 kg/m2) | The salty taste threshold was positively correlated with the sodium intake (r = 0.18, p < 0.01). In women, salty taste threshold was significantly lower in the third tertile of total zinc intake and available zinc intake than in the first tertile (p = 0.04 and p = 0.02). Negative correlation between available zinc intake and salty taste threshold in women (r = −0.21, p = 0.04), especially with αENaC A663T AA genotype. In men, salty taste thresholds were similar in all tertiles of available zinc intake. | Noh H et al., 2013 [40] |
| To evaluate the relationship between the dietary intake of zinc and zinc sulfate taste acuity. | Bryce-Smith and Simpson zinc taste test: Participants were instructed to taste but not swallow 10 mL of a 0.1% zinc sulfate solution and then spit the solution into a sink. | The taste intensity VAS and the zinc-specific food frequency questionnaire calculating zinc intake upon responses to questions regarding intake of foods containing zinc. Participants completed the VAS by marking a line perpendicular to a continuous horizontal line measuring 100 mm at a point that reflected their perceived intensity of the zinc sulfate solution. | 363 healthy participants (286 females, mean age = 21.0 years; 77 males, mean age = 20.6 years) | Female zinc intake was not correlated with zinc sulfate taste perception as gauged by both the zinc taste test (r = 0.014, p = 0.816) and the taste intensity visual analog scale (r = 0.025, p = 0.679). Male zinc intake was not correlated with zinc taste test scores (r = 0.199, p = 0.099) but significantly correlated with taste intensity VAS (r = 0.237; p = 0.048). | Zdilla MJ et al., 2016 [41] |
| Participants, wearing nose clips, rated the intensity of edible strips impregnated with either no stimulus (blank) or varying concentrations of linoleic acid on a 100 mm (VAS). The sucralose stimulus served to check that participants could perform the rating task using the VAS scale. | A subset of adults recorded the amount of food and beverage consumed during their last eating occasion prior to testing. One undergraduate dietetics student entered the data into Nutritionist Pro 5.0 dietary analysis software to eliminate inter-rater error. Intensity ratings of an edible taste strip containing sucralose (to check that participants could perform the rating task using the VAS scale), a spicy cinnamon candy (to evaluate trigeminal nerve/chemesthetic sensitivity) and the odor of spearmint extract (to confirm functional olfactory capability) were performed. Anthropometric measurements were collected. | 735 (549 adults, 180 children, 6 unknown; 37.9% were male; 85.9% White, 3.1% Asian, 1.4% Black and 8.8% Hispanic; mean age 33; mean body fat percentage among adults 26.9) obese and non-obese participants | There were significant differences (p < 0.001) for intensity ratings of low, medium, and high concentrations of fat taste stimuli. Ratings increased in a dose-dependent fashion. There were significant differences (p < 0.001) between children’s and adults’ ratings of fat taste intensity on a VAS scale. No differences in fat taste intensity ratings were noted between nonobese (236) and obese adults (304), except for the medium linoleic acid concentration where lean participants rated the taste strip as more intense (p = 0.03). Obese and nonobese women were also more sensitive than obese/nonobese men (p < 0.001) at the highest concentration. In the obese participants, for the medium concentration, mono- and polyunsaturated fat intake was negatively associated with fat taste intensity ratings (r = −0.21, p = 0.021; r = −0.24, p = 0.006, respectively). | Tucker RM et al., 2015 [22] |
| To assess the associations between fat taste thresholds, anthropometric measurements, fat intake, and liking of fatty foods | All participants, wearing nose clips, were tested for detection thresholds to oleic acid (fat taste thresholds) and sensitivities to the five basic tastes (sweet, salty, sour, bitter, and umami). Fatty acid ascending series mixed with long-life fat-free milk by 3-Alternate Forced Choice methodology were used for the fat taste threshold measurement. Ascending concentrations of sucrose, NaCl, citric acid, caffeine and MSG were used for the sensory evaluation of the five basic tastes. | A 24-h dietary recall was used to assess short-term dietary intake (energy intake, total consumption of protein, total fat and saturated, monounsaturated and polyunsaturated fat, carbohydrates, alcohol, and percentage of energy derived from protein, fats, and carbohydrates) using computer software FoodWorks. To evaluate the participants’ ability to discriminate different levels of fat content between food samples, the fat raking task was evaluated. Anthropometric measurements were collected. | 69 Australian females (mean age 41.3; mean BMI 26.3) in under- (3), normal- (33), over-weight (13) or obese (20) individuals | Fat taste sensitivity appears to be associated with short-term fat intake, but not body size in this group of females. There was no association between fat taste rank and total dietary fat intake, with or without controlling for energy. This indicates that fat taste sensitivity is associated with the proportion of fat consumed relative to total energy intake rather than the total amount of fat consumed. No significant associations were observed between fat taste rank and sensitivity to any of the five basic tastes (sweet, salty, sour, bitter, and umami). | Costanzo A et al., 2017 [42] |
| Main Objectives of the Study | Taste Tests | Setting/Protocol and other Outcome Measures | Subjects | Taste Results | Reference |
|---|---|---|---|---|---|
| To test if different sweetened beverages may differently impact on taste testing, OGTT, and neuroimaging findings | Before and after the 2-weeks exposure session, participants rated the perceptual qualities of basic tastes (sucrose, 0.56 M; citric acid, 18 mM; NaCl, 0.32 M; quinine, 0.18 mM, and MPG (100 mM) alone and when combined as binary taste mixtures (sucrose-citric acid, sucrose-quinine, sucrose-MPG, citric acid-NaCl and NaCl-quinine). Participants rated the sweetness, sourness, saltiness, bitterness, and umami intensity of each taste using the gLMS. Sweet concentration preference using a sucrose preference test pre- and post-beverage exposure was used. Sweet, sour, salty, umami, and tasteless/odorless stimuli were presented with a custom-designed gustometer in a block design across two fMRI runs. | All groups subjects were randomly assigned to consume for 2 weeks: (1) beverages sweetened with 0.06 g sucralose (sweet uncoupled from calories—LCS), (2) beverages sweetened with 30.38 g sucrose (sweet coupled with calories—Sugar), or (3) beverages sweetened with sucralose and combined with 31.8 g maltodextrin (Combo). GLP-1, insulin, OGTT before and after the exposure session, and anthropometric measurements were recorded. | Tirthy-nine healthy young adults (21 females, 18 males; mean age = 27.8 years; mean BMI = 23.7 kg/m2) | Regressing insulin iAUC difference scores on the BOLD-difference maps for sweet taste showed a strong negative relation in several limbic and mesolimbic areas in the Combo group. In this group, the left anterior insula, right middle insula, anterior cingulate, right ventral tegmental area, right putamen, and several cortical areas in the superior temporal gyrus and postcentral gyrus showed a decreased fMRI-BOLD response to sweet taste as a function of iAUC. In a second experiment with maltodextrin consumption alone no insulin sensitivity alteration was seen. | Dalenberg JR et al., 2020 [43] |
| To investigate the immediate effects of coffee consumption on gustatory and olfactory sensitivity on cohorts of participants reguarly consuming Cofee or Decaffeinated Coffee | Taste-drop-test applied to assess the recognition and detection threshold, consisting of 10 steps of tastant dilutions for sweet (sucrose), sour (citric acid), salty (NaCl), and bitter (quinine) in tap water solvent, with a halving of tastant concentration in every dilution step. | 15 min after taste and smell testing, participants were served a lukewarm espresso and instructed to drink it in two sips and to ensure that the coffee was swirled around the entire oral cavity. Within 2 min, participants were provided with 150 mL of tap water and instructed to swirl each sip and drink all of the water. This was done to cleanse their palates prior to retesting smell and taste sensitivity, which took approximately 20 min. Sniffin’ Sticks Test (only in Regular Coffee Group) was performed Same procedure in a group using de-caffeinated coffee | Regular Coffee Group: 101 healthy participants (55 females, 46 males; mean age = 25.5 years). Decaffeinated Coffee Group: 55 healthy participants (30 females, 25 males; mean age = 24.5 years). | Two minutes after coffee consumption, the detection threshold for the sweet tastant was increased (MD = 0.26, p < 0.001 and MD = 0.73, p < 0.001) while the threshold for the bitter tastant was significantly decreased (MD = −0.56, p < 0.001 and MD = −0.64, p < 0.001) in Regular Coffee and Decaffeinated Coffee Group, respectively. The decrease in bitter sensitivity (F(1,99) = 4.7975, p = 0.031) was found to be larger in participants that did not consume coffee daily (n = 25; decrease in mean bitter sensitivity score of −1.0). A small negative correlation between baseline tastant sensitivity and coffee consumption for all tastants was found: sweet (ρ = −0.17, p = 0.09); bitter (ρ = −0.20, p = 0.04); salty (ρ = −0.08, p = 0.42); sour (ρ = −0.07, p = 0.50) | Fjaeldstad AW and Fernandes HM, 2020 [44] |
| To investigate the influence of a habitual exposure to umami taste on umami taste perception, hedonics, and satiety | Whole mouth suprathreshold taste intensity ratings for aqueous umami, sweet, and salty stimuli were captured on the gLMS. Aqueous taste stimuli were prepared in deionized water and were presented twice, separately, in a series of three ascending concentrations: sucrose for sweet taste at 27.0, 81.0, and 243.0 mmol/L; sodium chloride (NaCl) for salty taste at 11.1, 33.3, and 100.0 mmol/L; MSG for umami taste at 3.0, 9.0, and 27.0 mmol/L. | 4-week intervention with one cup of broth daily. The treatment group’s low glutamate vegetable broth (237 mL) was supplemented with 3.8 g MSG. The control group’s broth contained no added MSG, but was sodium-matched with 1.8 g NaCl to ensure both broths contained the same amount of sodium. Both broths contained 15 kcal, 0.3 g fat, 2 g carbohydrates, 1 g protein, and 615 mg sodium. Diet History Questionnaire, anthropometric measurements, Leeds Food Preference Questionnaire, preference of real foods (using an hedonic ratings after consuming samples of different real foods) and an ad-libitum test meal used to assess satiation and satiety (using a VAS before and after both savory and sweet course) were captured at baseline and post-treatment 4-week intervention of testing sessions. | 58 healthy participants, 30 in control and 28 in treatment group (72.4% females; mean age = 22.7 years; mean BMI = 21.8 kg/m2). | At the start of the intervention, the broth supplemented with MSG tended to be rated as more intensely umami on average compared to the control broth (control: 20.2 ± 2.5; treatment: 27.7 ± 3.2), although not significantly (p = 0.06). Treatment group for the highest aqueous stimuli concentration of umami rated the high concentration 5.6 units lower than the baseline. Females in the treatment group but not in control group rated the umami stimulus 8.4 units lower on the gLMS following exposure to MSG. After 4 weeks, the control group increased in consumption of savory foods relative to baseline (42 g), while the treatment group decreased intake (−36 g). Desire for savory foods decreased in the treatment group after 4 weeks | Noel CA et al., 2018 [45] |
| To test how short-term fasted and satiated states impact on taste thresholds | Determination of taste thresholds carried out in blind conditions, using a series of six pure chemicals in solution in a commercialized drinking water with a staircase-method and presented in a random order with ascending concentrations and up-and-down procedure. Twofold step series (0.3 log-step) included sucrose (2.0 to 1000 mM), fructose (2.0 to 1000 mM), quinine sulphate (0.0004 to 1.6 mM), and purified liquorice (0.015 to 1 g/l of glycyrrhizin), whereas the solutions of NaCl (1.77 to 1000 mM) and PROP (0.001 to 3.2 mM) were diluted with a 0.25 log-step. | Participants were divided in two groups: one group was tested first in the fasted state, whereas the other one was first tested in the satiated state. Both groups were tested twice, within a 2-day interval: in the morning between 8:30 and 10 am, in the fasted state (after an overnight fast), and in the afternoon, about 1 h after a standard lunch, completed before the test, by ad libitum consumption of a standard dish of sweetened cream. Subjective hunger magnitude was recorded on a nine points scale. | 24 participants (21 females, 3 males; mean age = 26 years; BMI < 25 kg/m2) | No statistically significant variation for recognition threshold of both sugars (sucrose and fructose), purified liquorice, NaCl, PROP, or quinine sulphate when comparing satiated and fasted states. The mean level of subjective hunger differed significantly between the fasted and satiated states (respectively 5.4 ± 2.2 and 1.8 ± 0.9; p < 0.0001). | Pasquet P et al., 2006 [46] |
| To determine how a substantial reduction in dietary intake of simple sugars affects sweetness intensity and pleasantness of sweet foods and beverages | Sweet taste intensity rating by marking 117-mm printed gLMS and pleasantness rating on a 23-point category scale for vanilla puddings and raspberry beverages varied in amounts of added sucrose: 0%, 6.6%, 11%, 25%, 31%, 40%, 47%, and 52% by weight and 0%, 2.5%, 5%, 7.5%, 10%, 12.5%, 16%, 19%, and 25% by weight, respectively. Pleasantness rating on a 23-point category scale for broth and soda crackers varied in amount of sodium chloride: 0.014, 0.06, 01.0, 0.16, 0.25, 0.39, 0.62, and 0.87 mol/L and 0.5%, 1.2%, 2.5%, 4.5%, and 8.5% by weight, respectively. Sensory testing occurred for all concentrations of all stimuli. Sucrose detection thresholds by a forced-choice ascending method of limits. In each trial, subjects sampled a 10-mL aliquot of sucrose solution and two 10-mL water blanks, in random order. Sucrose amounts ranged from 0.0006 to 0.06 mol/L in 12 1.52-fold concentration steps. | After 1 month of normal diet, the control group was instructed to maintain their intake of simple sugars for the first 4 months of the study. The low-sugar group was instructed to lower their sugar intake by 40% (relative to month 1) during months 2–4. Both groups were allowed to follow any diet they wished during the last (fifth) month. Taste tests were performed each month. Anthropometric measurements and food/activity records were recorded. | 16 participants in control group (mean age = 34.4 ± 9.7 years; female = 56.3%) and 13 participants in low-sugar diet group (mean age = 36.7 ± 10.2 years; female = 53.4%) | No significant differences between the two groups in rated sweetness intensity during month 1 and 2. By month 3, the low sugar group rated low-concentration samples as sweeter than did the control group (more for pudding than for beverage samples). By month 4, the low-sugar group gave higher sweetness ratings across a wide range of added-sugar concentrations. During month 5, the differences between groups were no longer apparent. In contrast to sweet intensity, there were no significant differences between groups for rated pleasantness. The low-sugar group gave significantly higher sweetness ratings during month 4 than they did during month 1 (p < 0.02). No effect on broth and cracker samples. | Wise PM et al., 2015 [47] |
| To assess the effects of short-term caloric deprivation and satiety on recognition taste thresholds | Recognition thresholds were measured for sweet, salty, and bitter qualities of taste using different concentrations of sucrose (from 1.9 to 233.6 mmol/L), salt (from 1.3 to 171.2 mmol/L), and quinine (from 0.077 to 7.860 mmol/L) solutions, respectively, in cups of 5 mL of distilled water or tested solution with a sipping technique and the standard two-alternative forced-choice technique. Eight concentrations of each substance under test were presented in randomized order. The lowest intensity of a taste stimulus, which could be recognised by taste, was noted as the threshold of recognition. | Participants took their last meal between 6 pm and 7 pm, they missed a breakfast the following morning, and had a lunch at 12.30 pm. All volunteers had the same food at dinner and lunch. Taste thresholds in hunger state in all subjects were measured between 9 am and 10 am, after 14–16 h of fasting. A 1-h interval was allowed between food intake and measurements of taste thresholds in order to avoid the lingering effects of taste adaptation. In eight volunteers, taste thresholds were initially detected in satiated state after a standard dinner and then in hunger state the following morning. In the remaining eight subjects, the order of testing was the opposite: Taste thresholds were initially detected in the morning in hunger state and then in satiated state after a standard lunch. Subjective magnitude of hunger was used to assess at the beginning of the testing procedure on the basis of a self-reported five-points scale. | 16 male participants (age = 19–24 years; BMI = 20.5–25 kg/m2) | The mean values of recognition thresholds for the sweet and salty substances were significantly higher during satiety state than in fasting state (p < 0.05 and p < 0.02, respectively). The mean value of recognition thresholds for the bitter substance in fasting states and that after caloric loading did not differ significantly. The difference in taste thresholds between two subgroups of subjects divided on the basis of order of tasting was not statistically significant. | Zverev YP, 2004 [48] |
| CKD patients and healthy volunteers tasted different concentrations of sodium-impregnated test strips before and after 1 week of protocol study. The impregnated salt concentration was initially 0% and increased in 0.2% intervals from 0.6 to 1.6%. Detection and recognition threshold were assessed. | One week of sodium restriction by means of an educational program including a meal with low salt (5 g/day), low protein (0.8 g/kg/day × ideal body weight) and low potassium (1500 mg/day) was served to all CKD patients. The calories were not altered for either diet, unless the patient had diabetes mellitus. Blood and urinary samples were collected | Group A: 29 patients with chronic kidney disease (CKD; mean age = 62.9 years; 19 males and 10 females; no smoking; 10 with diabetic nephropathy) Group B: 11 healthy volunteers (mean age = 37.7 years; 8 males and 3 females; no smoking and no diabetic nephropathy) | After 1 week of sodium restriction, the average value of the recognition threshold in CKD patients decreased from 0.84 ± 0.27 to 0.76 ± 0.25% (p < 0.05) and from 0.68 ± 0.14 to 0.65 ± 0.09% in healthy volunteers (NS). The average value of the detection threshold in CKD patients also decreased from 0.74 ± 0.21 to 0.71 ± 0.23% (NS) and from 0.64 ± 0.08 to 0.62 ± 0.06 in healthy volunteers (NS). | Kusaba T et al., 2009 [49] |
| Subjects tasted 10 different concentrations of sucrose dissolved in sterile water (0.0098, 0.0195, 0.0391, 0.0781, 0.1560, 0.3130, 0.6250, 1.2500, 2.5000 and 5.0000%) according to the whole-mouth gustatory method, before and after 12 weeks protocol study. Detection threshold was measured. | Participants completed a 12-week weight-loss program based on energy restriction through diet and exercise, which aimed at achieving their optimal weight. Changes in serum leptin levels were evaluated during a loss-weight program in connection with a leptin receptor polymorphism (Lys109Arg) that may be related to insulin and glucose metabolism. | 20 obese, but otherwise healthy, free-living Japanese females (mean age = 55 ± 7 years; mean weight = 61.7 ± 4.6 Kg; mean BMI = 26.1 ± 1.7 kg/m2) | The sweet taste threshold decreased significatively in a solution of sucrose (p = 0.004); in contrast, there was no difference in changes to the sweet taste threshold between the groups with versus without the Lys109 allele. Serum leptin levels decreased significantly (p = 0.014) and were significatively correlated with those in the sweet taste threshold, independently from the initial threshold levels and the Lys109 allele. | Umabiki M et al., 2010 [50] |
| To evaluate the effects of a high-fat and low-fat diet on taste sensitivity to oleic acid. | Taste thresholds were established 24 h before initiating a prescribed diet, and again during week 4 of each dietary intervention. Oral sensitivity to C18:1 was determined using a fatty acid ascending series (0.02, 0.06, 1, 1.4, 2, 2.8, 3.8, 5, 6.4, 8, 9.8, and 12 mM) mixed with long-life non-fat milk by a 3-Alternate Forced Choice methodology | All participants were randomized into two groups, which would consume, over a 4-week period, modified fat diets in the following orders: Group 1: high-fat (>45% fat) diet followed by low-fat (<20% fat) diet. Group 2: low-fat (<20% fat) diet followed by high-fat (>45% fat) diet. There was a compulsory 2-week wash-out period between the diets. Fat ranking task was assessed to test the subjects’ ability to discriminate between custards containing small differences (2–4%) in their fat content and to establish what effect consumption of a modified fat diet may have on their ability to detect these differences. Subjects were required to rate their liking and preference of five sets of RF and LF foods by using a nine-point hedonic scale. | 19 lean (mean age = 33 years; mean BMI = 23.2 kg/m2) and 12 overweight/obese (mean age = 40 years; mean BMI = 28 kg/m2) unrestrained eater subjects | Consumption of the low-fat diet increased taste sensitivity to C18:1 among lean and overweight/obese subjects (p = 0.05) and increased the subjects’ ability to perceive small differences in the fat content of custard (p = 0.05). Consumption of the high-fat diet significantly decreased taste sensitivity to C18:1 among lean subjects (p = 0.05). | Stewart JE and Keast RSJ, 2011 [21] |
| To investigate whether encapsulated sodium and potassium supplementation lead to altered salt taste responses | Participants were subjected to sensory evaluation in week 0, 5, 9, and 13. They started with the detection threshold test by 3-Alternate Forced Choice of NaCl ascending concentrations (0.0125, 0.025, 0.05, 0.1, 0.2, 0.4, 0.8, 1.6, 3.2 and 6.4 g NaCl/L). After that, they rated pleasantness and saltiness intensity of different salt concentrations of water (0, 0.05, 0.16, and 0.5 M NaCl), tomato juice (0.03, 0.05, 0.09, 0.16, 0.28, and 0.5 M NaCl), and bread (0.5%, 1%, 2%, and 4% NaCl) | Participants were exposed to a fully controlled low sodium and low potassium diet (targeted to provide 2 g of sodium and 2 g of potassium at an energy intake of 2500 kcal a day) for 13 weeks. Participants received capsules with sodium (3 g/d), potassium (3 g/d) or placebo, for 4 weeks each, in randomized order in a double-blind crossover design. To compare changes in taste responses and desire-to-eat salty foods, five sweet foods (pancake with sugar, gingerbread, bananas, cookies, and chocolate), and foods that were neither dominant in sweet nor salty taste (‘neutral’ taste) (boiled egg, cucumber, unsalted cashew nuts, rice waffle, yoghurt) were included by using a 100 mm VAS (visual analogue scale). Participants were instructed to collect 24-h urine for the quantitative determination of sodium and potassium. | 26 participants (mean age = 66 years; mean BMI = 26.8 kg/m2) with untreated upper-range prehypertension or stage 1 hypertension. | The threshold was not affected over the weeks during the intervention diet (p = 0.75), not affected by supplementation (p = 0.59), and there was no interaction between duration and supplementation (p = 0.43). | Bolhuis DP et al., 2015 [51] |
| To assess the effect of a low-fat or portion control diet on fat taste thresholds, fat perception, and preference | All participants were required to attend one laboratory session at baseline and week 6. They tasted a series of 13 variants of the fatty acid vehicle (non-fat milk) with increasing concentrations of C18:1 (0.02, 0.06, 1, 1.4, 2, 2.8, 3.8, 5, 6.4, 8, 9.8, 12, and 20 mM) to evaluate fat detection threshold, and a series of eight different concentrations of sucrose (0.99, 1.61, 2.75, 4.55, 7.56, 12.62, 21.03, 35.05) and NaCl (2.74, 4.11, 5.82, 8.21, 11.81, 16.77, 23.96, and 34.22 mM) to evaluate sweet and salty detection thresholds by using ascending forced choice triangle tests. | Participants were randomized to follow one of two weight loss diets: (1) consumption of a low-fat (<25% total energy from fat) diet (n = 26) or (2) consumption of a PC (33% total energy from fat, reduction in total energy by 25%) diet (n = 27), for 6 weeks. Anthropometric measurements were recorded. In order to test the subjects’ ability to discriminate between custards containing small differences (2–4%) in their fat content, the fat ranking task was evaluated. Participants completed a preference test with three sets (9-point hedonic scale) of RF and LF foods for the hedonic evaluation. | 53 (17 males and 36 females; mean age = 56.5 ± 1.9 years; mean BMI = 32.3 ± 0.7 kg/m2) overweight/obese subjects. | Consumption of the LF and PC diets over the 6-week period significantly decreased C18:1 threshold (p = 0.014), and the effect tended to be stronger in the LF diet versus PC diet (p = 0.060). Diets had no significant effect on detection thresholds for sucrose (p = 0.227) or NaCl (p = 0.558). | Newman LP et al., 2016 [52] |
| To determine the effect of a high-fat meal immediately prior to detection threshold testing for oleic acid | Fat taste thresholds to C18:1 (added to long-life skim milk samples at varying concentrations [0.02, 0.06, 1, 1.4, 2, 2.8, 3.8, 5, 6.4, 8, 9.8, and 12 mM]) was determined using triangle tests with ascending forced choice methodology 1 h and 2 h after the frittatas administration. Fat ranking task in which participants were presented with custard samples containing varying amounts of vegetable oil (0, 2, 6 and 10%) and ranking the fattiness of each sample. | Frittatas contained varying amounts of fat: high-fat frittata (60% fat: 21% carbohydrate: 18% protein) contained a total of 9.7 g/100 g of fat and 2.4 g (2410 mg) of C18:1 per 100 g; the balanced-fat frittata (33% fat: 32% carbohydrate: 32% protein) contained a total of 3.0 g/100 g of fat and 1.3 g (1261 mg) C18:1 per 100 g; and the low-fat frittata (20% fat: 43% carbohydrate: 33% protein) contained a total of 1.7 g of fat per serving and 0.7 g (710 mg) C18:1 per 100 g. Hedonic tests using a range of regular-fat and low-fat foods including cream cheese, vanilla yoghurt, and chocolate mousse were used; food consumption record of the day before their first testing session was collected. | 32 participants (15 males: mean age = 49.3 years, mean BMI = 24.7 kg/m2; 17 females: mean age = 31.5 years, mean BMI = 21.9 kg/m2). Out of the total 32 participants, 7 were classified as overweight/obese (5 males, 2 females, mean BMI = 29.1 kg/m2) | Fat taste threshold and fat ranking were not different after the three different fat-content breakfasts, as well as no difference in food preferences No significant difference in fatty acid threshold between lean and overweight/obese | Newman LP et al., 2016 [53] |
Publisher’s Note: MDPI stays neutral with regard to jurisdictional claims in published maps and institutional affiliations. |
© 2021 by the authors. Licensee MDPI, Basel, Switzerland. This article is an open access article distributed under the terms and conditions of the Creative Commons Attribution (CC BY) license (https://creativecommons.org/licenses/by/4.0/).
Share and Cite
Micarelli, A.; Malacrida, S.; Strapazzon, G.; Mrakic-Sposta, S.; Micarelli, B.; Alessandrini, N.; Carbini, V.; Caputo, S.; Falla, M.; Alessandrini, M. Impact of Nutritional Intervention on Taste Perception—A Scoping Review. Foods 2021, 10, 2747. https://doi.org/10.3390/foods10112747
Micarelli A, Malacrida S, Strapazzon G, Mrakic-Sposta S, Micarelli B, Alessandrini N, Carbini V, Caputo S, Falla M, Alessandrini M. Impact of Nutritional Intervention on Taste Perception—A Scoping Review. Foods. 2021; 10(11):2747. https://doi.org/10.3390/foods10112747
Chicago/Turabian StyleMicarelli, Alessandro, Sandro Malacrida, Giacomo Strapazzon, Simona Mrakic-Sposta, Beatrice Micarelli, Nicolò Alessandrini, Valentina Carbini, Sara Caputo, Marika Falla, and Marco Alessandrini. 2021. "Impact of Nutritional Intervention on Taste Perception—A Scoping Review" Foods 10, no. 11: 2747. https://doi.org/10.3390/foods10112747
APA StyleMicarelli, A., Malacrida, S., Strapazzon, G., Mrakic-Sposta, S., Micarelli, B., Alessandrini, N., Carbini, V., Caputo, S., Falla, M., & Alessandrini, M. (2021). Impact of Nutritional Intervention on Taste Perception—A Scoping Review. Foods, 10(11), 2747. https://doi.org/10.3390/foods10112747