Article

Allelic Variation at Glutenin Loci (Glu-1, Glu-2 and Glu-3) in a Worldwide Durum Wheat Collection and Its Effect on Quality Attributes

1
Centro de Recursos Naturales Renovables de la Zona Semiárida (CERZOS), Departamento de Agronomía, Universidad Nacional del Sur (UNS)-CONICET, Buenos Aires 8000, Argentina
2
Departamento de Genética, Escuela Técnica Superior de Ingeniería Agronómica y de Montes, Edificio Gregor Mendel, Campus de Rabanales, Universidad de Córdoba, CeiA3, ES-14071 Córdoba, Spain
3
Compañía Molinera del Sur, Buenos Aires 8000, Argentina
4
Global Wheat Program, International Maize and Wheat Improvement Center (CIMMYT), El Batán, Texcoco 56237, Edo. Mexico, Mexico
5
CEI Barrow, Laboratorio de Calidad Industrial de Granos (Convenio INTA-Ministerio de Desarrollo Agrario), Buenos Aires 7500, Argentina
6
EEA Cesareo Naredo, Instituto Nacional de Tecnología Agropecuaria (INTA), Buenos Aires 6417, Argentina
*
Author to whom correspondence should be addressed.
Foods 2021, 10(11), 2845; https://doi.org/10.3390/foods10112845
Submission received: 21 September 2021 / Revised: 9 November 2021 / Accepted: 10 November 2021 / Published: 18 November 2021

Abstract

:
Durum wheat grains (Triticum turgidum L. ssp. durum) are the main source for the production of pasta, bread and a variety of products consumed worldwide. The quality of pasta is mainly defined by the rheological properties of gluten, an elastic network in wheat endosperms formed of gliadins and glutenins. In this study, the allelic variation at five glutenin loci was analysed in 196 durum wheat genotypes. Two loci (Glu-A1 and Glu-B1), encoding for high-molecular-weight glutenin subunits (HMW-GS), and three loci (Glu-B2, Glu-A3 and Glu-B3), encoding for low molecular weight glutenin subunits (LMW-GS), were assessed by SDS-PAGE. The SDS-sedimentation test was used and the grain protein content was evaluated. A total of 32 glutenin subunits and 41 glutenin haplotypes were identified. Four novel alleles were detected. Fifteen haplotypes represented 85.7% of glutenin loci variability. Some haplotypes carrying the 7 + 15 and 7 + 22 banding patterns at Glu-B1 showed a high gluten strength similar to those that carried the 7 + 8 or 6 + 8 alleles. A decreasing trend in grain protein content was observed over the last 85 years. Allelic frequencies at the three main loci (Glu-B1, Glu-A3 and Glu-B3) changed over the 1915–2020 period. Gluten strength increased from 1970 to 2020 coinciding with the allelic changes observed. These results offer valuable information for glutenin haplotype-based selection for use in breeding programs.

1. Introduction

Durum wheat grains (Triticum turgidum L. ssp. durum Desf. Husn) are widely consumed all around the world as an important part of the diet in several countries. Historically, it was used worldwide to make pasta and is also the main source for making different products consumed in the Mediterranean basin, in particular flat and leavened bread, couscous and bulgur, as well as freekeh in the WANA (West Asia and North Africa) region [1]. Pasta is also an important part of the food produced and consumed in Latin America. In particular, in Argentina, the consumption of pasta is 8.54 kg per capita per year, the seventh-highest in the world [2], with a durum wheat growing area of 129,255 ha during the crop season 2020/21, which is comparatively smaller than the area occupied by other cereals and oil crops, although it represents the greatest planted area in Latin America. Until the 1970s, Argentina exported high-quality durum wheat mainly to Italy [3]. However, grain quality decreased during the green revolution with the introduction of semi-dwarf wheat from CIMMYT, mainly due to an increase in Fusarium susceptibility, which caused a reduction in both the production area and exports.
The level and composition of protein in gluten is the reason why durum wheat is preferred for making pasta [4,5,6], since the gluten quality strongly affects the firmness of pasta after cooking [7,8]. Moreover, consumers prefer pasta products with a strong yellow colour and firmness, resulting in tasty and nutritionally superior food [9]. Gliadins and glutenins are the major storage proteins in wheat endosperm; they form an elastic network called gluten and can be distinguished based on their solubility or insolubility in aqueous alcohols, respectively [10]. The level [11] and composition [12,13] of protein are directly associated with the quality of wheat-derived products. Gliadins are responsible for gluten viscosity and extensibility and are encoded by two loci (Gli-1 and Gli-2) located on the short arms of group 1 (-γ and -ω types) and 6 (-α and -β types) chromosomes [14,15]. Glutenins are associated with the viscoelastic properties of gluten [16]. Two groups of single monomeric glutenins were separated according to their mobility in SDS-PAGE, and were classified as high- (HMW-GS) and low-molecular-weight glutenin subunits (LMW-GS) controlled by orthologous genes located on the long and short arms of the group 1 chromosomes, respectively [17,18]. LMW-GS are encoded by Glu-2 and Glu-3 genes [18,19], whereas HMW-GS are encoded by Glu-1 genes [20]. It was suggested that Glu-A1 and Glu-B1 in tetraploid wheat contained sequences encoding x- and y-type subunits as a result of an ancestral duplication [21]. In cultivated durum wheat the Glu-A1 y subunit is always inactive.
The association between the γ-gliadin 45 and gluten strength was reported in durum wheat [22]. Later, it was demonstrated that linked gene/s coding for low-molecular-weight (LMW) glutenin subunits were mostly responsible for the changes in quality [23]. The LMW subunits are classified according to two models (1 and 2), associated with low and high quality, respectively [24]. The variability and role of high-molecular-weight (HMW) glutenin subunits were examined in wild emmer [25,26], durum [27] and hexaploid wheat subspecies [28,29].
In Argentina, the genetic variability in durum wheat storage proteins was previously evaluated [30,31] but only using a limited number of genotypes. However, a wider screening of modern and historical Argentinian genotypes, as well as worldwide accessions, could help to identify favourable alleles or allele combinations with greater effect on quality. For this purpose, we used a collection composed of South American and Mediterranean germplasms, also including CIMMYT/ICARDA genotypes or derivatives [32]. This collection was previously evaluated for genetic diversity, population structure and linkage disequilibrium patterns, exhibiting high genetic differences between subpopulations, making it possible to trace the origin of the South American germplasm.
The characterisation and availability of glutenin allelic composition could be beneficial to implement its use in marker-assisted selection (MAS) in breeding programs. In the present study, we assessed (i) the allelic variations in five glutenin genes using a worldwide durum wheat collection composed mainly of Argentinian genotypes [32], (ii) the effect of Glu haplotypes or individual allelic variants on gluten strength and protein content, (iii) the association of predictive traits and rheological parameters for different glutenin haplotypes using historical datasets, (iv) the changes in gluten composition due to breeding activities between periods or origins. In addition, a detailed description of LMW subunits, not previously available for Argentinian durum wheat, was undertaken.

2. Materials and Methods

2.1. Plant Material

The total evaluated plant material consisted of 196 durum wheat accessions (Triticum turgidum L. ssp. durum), mostly representative of the Argentinian breeding programs (85), but also including accessions from Italy (33), Chile (26), France (21), West Africa and North Asia (WANA) (17), CIMMYT (10) and the USA (4) (Supplementary Table S1).

2.2. Glutenin Characterisation and Haplotype Analysis

The genetic variability of high- (HMW) and low-molecular-weight (LMW) glutenin loci was evaluated in 196 durum wheat accessions using the sodium dodecyl sulphate (one dimensional SDS-PAGE) methodology, according to the protocol proposed by Peña et al. [33]. For this purpose, 20 mg of whole meal flour was incubated with 0.75 mL of 50% propanol (v/v) for 30 min in a Thermomixer (Eppendorf, Germany) at 1400 rpm and 65 °C to extract the gliadins, as described in Maryami et al. [34]. Specifically, tubes were centrifuged for 2 min at 10,000 rpm and the supernatant, including the gliadins fraction, was discarded. This step was repeated to remove any remaining gliadins. Subsequently, 100 uL of a solution with DTT at 1.5% (w/v) with 50 uL of propanol at 50% (v/v) and 50 uL of Tris-HCl 0.08 M pH 8.0 was added to the pellet. Tubes were mixed with vortex and incubated for 30 min in a Thermomixer at 1400 rpm and 65 °C. After that, the tubes were centrifuged for 2 min at 10,000 rpm with 100 uL of a solution of vinylpyridine at 1.4% (v/v), prepared with 50 uL of propanol at 50% (v/v), and 50 uL Tris-HCl 0.08 M pH 8.0, was added. Tubes were mixed again with vortex and incubated in a Thermomixer at 1400 rpm and 65 °C for 15 min. Then, the tubes were centrifuged for 2 min at 13,000 rpm. The supernatant was transferred to a new tube and 180 uL of a solution of Tris-HCl M pH 6.8, 2% SDS (w/v), 40% glycerol (w/v), and 0.02% (w/v) bromophenol blue was added. Tubes were mixed with vortex and incubated for 5 min in a Thermomixer at 1400 rpm at 90 °C, and then were centrifuged for 2 min at 13,000 rpm. From the supernatant, 6 uL was taken and used to run the gels. Separating gels with a concentration of 15% of acrylamide were prepared using 1 M Tris buffer at pH of 8.0 instead of the conventional 8.8. Gels were run at 12.5 mA per gel for 20 h and then stained using Coomasie blue. Five different loci, two encoding HMW glutenins (Glu-A1, Glu-B1), and three encoding LMW glutenins (Glu-A3, Glu-B3 and Glu-B2) were characterised. Allele designations were made following previously proposed rules [35,36]. LMW-GS model classified the allelic combinations as 1 or 2 at Glu-3 and Glu-2 loci associated with low and intermediate/high gluten quality, respectively. Glutenin loci haplotypes were constructed considering all possible allele combinations for these five loci and named as Hap_[number].

2.3. KASP Markers

Additionally, two KASP markers for the Gpc-B1 (6BS) locus affecting grain protein content (SNP marker: wMAS000017) and the glutenin locus Glu-A1 (1AL) (SNP marker: Glu-Ax1/x2*_SNP) were assessed in the entire collection [37]. Allele-specific primers were designed using FAM and VIC tails and are shown in Supplementary Table S2. Three-week-old seedlings obtained from purified seeds were used for DNA extraction following a CTAB protocol [38]. For PCR, a touchdown protocol was used started with a 15 min hot enzyme activation at 94 °C followed by 11 cycles of 94° for 30 s, 65–55 °C for 60 s (−0.8 °C/cycle), 72 °C for 30 s. This was continued with 26 cycles of 94 °C for 30 s, 57 °C for 60 s, 72 °C for 30 s, and a final step at 10 °C. PCR was carried out using 5 μL of volume per well arrayed in a 384 PCR plate. DNA samples were briefly centrifuged and oven-dried at 60 °C for 1 h. SNP-specific KASP reagents, such as the assay mix and the 2X KASP Master mix, including the fluorescent dyes FAM and VIC, were added to dried DNA samples (150 ng/well). PCR-amplified products were subjected to an end-point fluorescence reading using the PHERAstar Plus plate reader from BMG LABTECH. Alleles were assigned based on the differential fluorescence reading using Excel software.

2.4. Field Experiments

Seven field trials were conducted during three growing seasons (three in 2011/12, three in 2014/15 and one in 2017/18) at three locations (Cabildo [39°36′ S, 61°64′ W], Barrow [38°20′ S, 60°13′ W] and Pieres [37°46′ S, 58°18′ W]) under rainfed conditions. From the total genotyped accessions (196), 132 and 170 were phenotyped in successive years according to the population size availability in 2011 (132), 2014 (170) and 2017 (170). Plots were arranged using an alpha-lattice design [39] with two repetitions (incomplete blocks, 17 × 8 in 2011 and 10 × 17 in 2014 and 2017). Seed density was adjusted to achieve 300 viable plants per m2. Plot size and growing conditions for each experiment are detailed in Supplementary Table S3. Trials were kept free of weeds and diseases and managed according to local practices.
Additional experiments from the National Durum Wheat Experimental Network (NDWEN) or from the Instituto Nacional de Tecnología Agropecuaria (INTA) breeding program, listed in Supplementary Table S4, were used. From these trials, Argentinian genotypes with contrasting glutenin haplotypes were selected. Unbalanced, historical quality datasets were used to assess the glutenin haplotype effect.

2.5. Phenotypic Evaluations

Whole-meal flour from each plot was obtained by milling 20 g samples of clean grains in a Cyclotec® 1093 mill (Foss Denmark). The grain protein content (GPC, %, adjusted to 13.5% H°) was determined by near-infrared spectroscopy (NIR Systems DS2500, Foss Denmark). Gluten strength was assessed using the sodium dodecyl sulfate (SDSS) micro-sedimentation test (mm) (adapted from AACC Method 56–70, 1984; for Argentinian strong gluten wheat). The GPC was obtained from each plot in all the trials, while SDSS was only assessed in the 2011 and 2014 field trials.
In the NDWEN or the INTA trials additional quality parameters, which were not evaluated in the collection, were considered. The percentage of gluten, wet and dry gluten, and the gluten index (GI) were obtained according to the IRAM 15864 (Part 2) method and the ICC standard 155 (International Association for Cereal Science and Technology, 1986) method using the Glutomatic system (Perten Instruments, Sweden). Farinograph parameters (Development time and Energy level) were assessed according to Irvine et al. [40] with modifications. A 50 g dough mixer, with constant water hydration (45%) and a fixed mixing time (8 min) were used. Development time (%) = peak height (min)-end height (min)/peak height (min) × 100. Energy level = (peak height (FU)/20) + Area (cm2) [41].

2.6. Statistical Analyses

Genotype-adjusted means (LSMEANs) were obtained using a mixed linear model (PROC MIXED) with SAS 9.0® software [42], within a maximum restricted probability model (REML). The analysis was performed annually and by location for each trait. For ANOVA and LSMEAN, performed annually, the locations and incomplete blocks within repetitions were considered as random factors and the genotype and repetitions within environment as fixed factors. Analysis of variance (ANOVA) was performed for each trait considering the period, glutenin markers or haplotypes as fixed factors using the INFOSTAT software [43]. The Tukey–Kramer [44] test was implemented to evaluate allele ranking at each locus, while the BSS test [45,46] was applied to analyse the haplotype rank. This test proposed a recursive algorithm based on the combination of a clustering technique and a hierarchical analysis of variance. The combination of the analysis by year and by location was referred to as the environment. For the breeding period effect, the Duncan test (p < 0.05) was used.

3. Results

One hundred and ninety-six durum wheat genotypes from different origins and periods, including a large set of Argentinian genotypes, three landraces and historical genotypes, were characterised for their glutenin subunit banding patterns by using SDS-PAGE. A total of 32 glutenin subunits from five evaluated loci were identified in the collection (Table 1). The combination of these allelic variants formed a total of 41 glutenin haplotypes (Table 2).

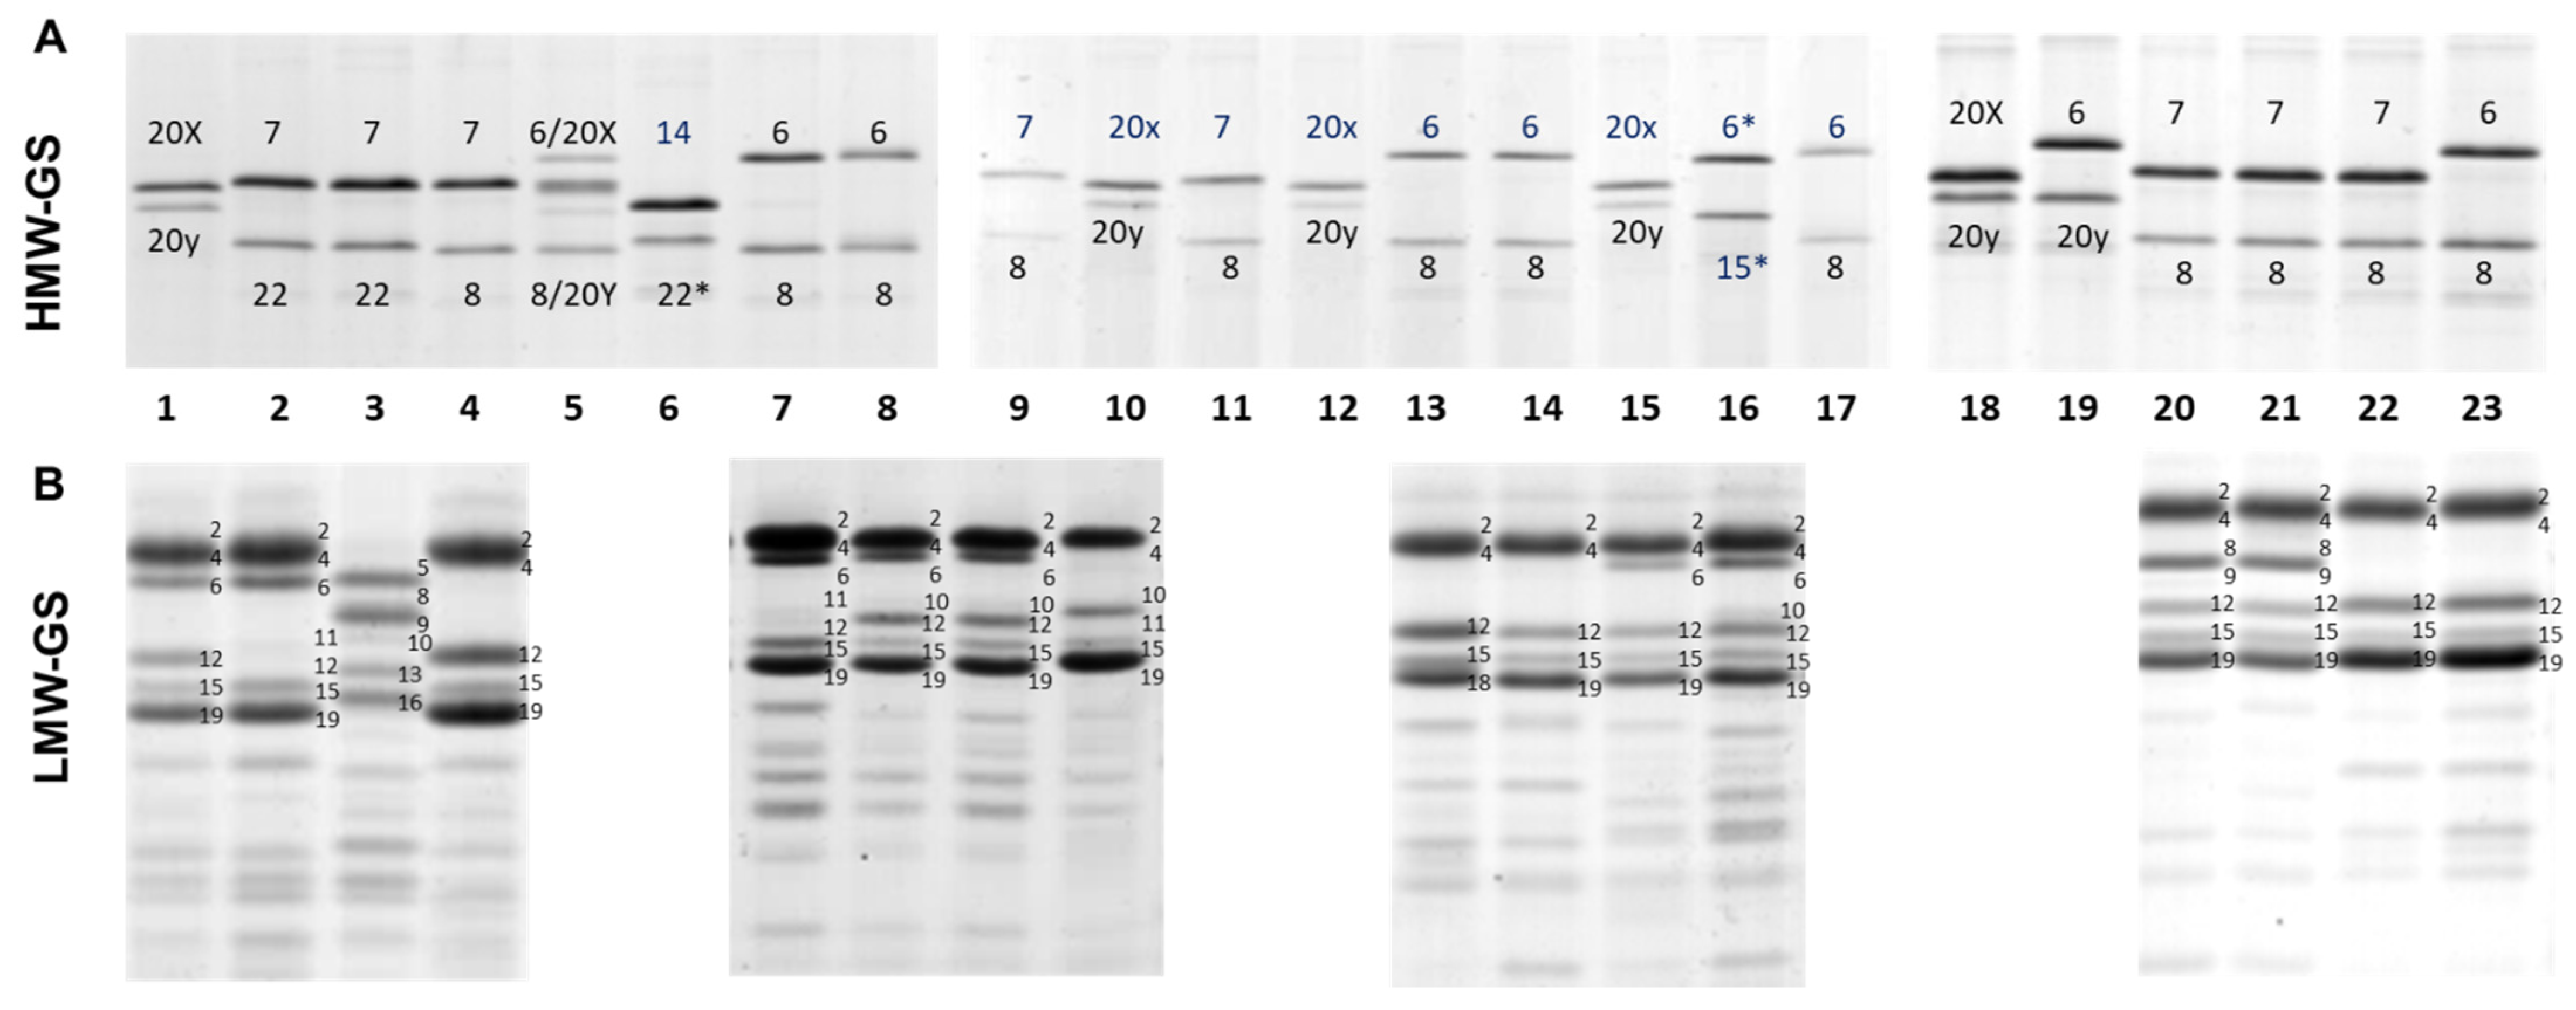
3.1. High-Molecular-Weight Glutenin Subunits (HMW-GS)

The highest variation between genes encoding for HMW-GS was exhibited by Glu-B1, contributing ten alleles to the collection, whereas, for Glu-A1, only two alleles were detected (2* (b) and null (c)). The 2* allele at Glu-A1 was only found in one Argentinian breeding line (CBW 0105), also confirmed by using the KASP marker designed for the Glu-A1 locus (Supplementary Table S2). At Glu-B1, the 7 + 8 (b), 6 + 8 (d) and 20x + 20y (e) alleles covered most of the variation (89.8%) with percentages of 38.3, 26.0 and 25.5, respectively. The frequency of the remaining seven alleles was lower than 4%, as the 7 + 15 (z) subunits detected in seven modern cultivars or breeding lines. The 13 + 16 (f) subunits were only observed in one old Argentinian (Bonaerense 202), one French (Neodur) and three Italians genotypes (Supplementary Table S1). Some specific allelic variants at Glu-B1 were only detected in Argentinian (subunit 6), Italian (14 + 22* and 6 + 20y) and WANA (6* + 15*) germplasms (Figure 1). The combinations of glutenin subunits 14 + 22*, 6* + 15*, and 6+20y were not previously described and should be considered as novel alleles. We propose to name these alleles Glu-B1cr, Glu-B1cs, and Glu-B1ct, respectively, following the order of the Wheat Gene Catalogue and the latest publications on this topic [34].

3.2. Low-Molecular-Weight Glutenin Subunits (LMW-GS)

The highest variation between LMW-GS coding genes was observed at the Glu-A3 locus with nine alleles, followed by Glu-B3 and Glu-B2, which presented eight and three alleles, respectively (Table 1). The most frequent glutenin subunits encoded by Glu-A3 were 6 (a) and 6 + 10 (c), with frequencies of 57.7 and 26.5 percent, respectively, followed by null (h) and 5 (b) subunits (Table 1). The Glu-A3ax (6.1 subunit) allele was detected privatively in genotypes from Argentina (Buck Cristal and two breeding lines, VF0154 and VF042), but our study conformed a new banding pattern (6.1 + 10). In addition, 10 + 11 and 5 + 10 banding patterns were only detected in the Biensur and Langdon (Dic-3A)-10 cultivars, respectively (Supplementary Table S1). At the Glu-B3 locus, the Glu-B3a (2 + 4 + 15 + 19) allele was present in approximately 90% of the genotypes, followed by 8 + 9 + 13 + 16 and 2 + 4 + 15 + 16 subunit combinations. A new banding pattern (2 + 4 + 8 + 9 + 15 + 19) was detected in three Argentinian breeding lines (Figure 1) and a rare variant (2 + 4 + 16) was obtained in the old cultivar Bonaerense 202 (Supplementary Table S1). The analysis at Glu-B2 resulted in the detection of three alleles (a, b and c), subunit 12 (a) being present in 93.4% of the genotypes. The 12* allele (c) was the least frequent, only detected in two genotypes from Italy and the WANA region, while the null (b) allele was carried by 11 genotypes and it was more widely distributed among the origins than Glu-B2c (Table 1).

3.3. Effect of HMW-GS and LMW-GS on Gluten Strength and Protein Content

The relevance of glutenin alleles for improving gluten strength (measured by the SDSS test) and grain protein content (GPC) was assessed in samples from a total of seven field trials (Table 3 and Table 4). ANOVA was conducted, taking into account the characterised alleles, in 132 (2011) and 170 (2014–2017) genotypes phenotypically evaluated for quality traits. Data for the genotypes numbered from 171 to 196 are not available since they were added to the collection after the field trials were conducted. For HMW-GS, only the alleles at the Glu-B1 locus were associated with highly significant differences (p < 0.001) in the SDSS test and significant differences in GPC (in four out of seven trials). This locus explained the 36–41% and 18–21% of the variation in the SDSS test during 2011 and 2014, respectively (Supplementary Table S5). The Glu-A1 locus was practically fixed with only one genotype carrying a differential allele, and it became difficult to test for differences.
Considering LMW-GS, all three loci (Glu-A3, Glu-B3 and Glu-B2) showed significant differences between alleles in the SDSS test values in all the evaluated experiments. According to the ANOVA test, the SDSS variance was explained in the following order Glu-B3 > Glu-A3 > Glu-B2 in both years. In addition, the Glu-A3 locus also significantly affected the grain protein content in BW 2011, PS 2014 and BW 2017, whereas the Glu-B3 showed a significant effect on the GPC in BW 2011, CA 2014, PS 2014 and BW 2017.
For all loci, the SDSS variance was explained significantly in the following order: Glu-B1 > Glu-B3 > Glu-A3 > Glu-B2, in 2011, and Glu-B3 > Glu-A3 > Glu-B1 > Glu-B2, in 2014 (Supplementary Table S5). After ANOVA, the rank of alleles was established using the Tukey–Kramer test (p < 0.01). Banding patterns 7 + 8, 6 + 8, 7 + 15, 7 + 22 and 6* + 15* at the Glu-B1 locus were associated with the highest mean values of the SDSS test (Table 3 and Table 4). Additionally, the 13 + 16 allele, carried mainly by European genotypes, reached high SDSS test values in several environments, whereas the 20x + 20y banding pattern showed intermediate values in both evaluated years. In addition, the 14 + 22* banding pattern was associated with a detrimental effect on the SDSS test value, but a high GPC value. On the other hand, the 6, 11, 6 + 11 and 6 + 10 banding patterns at the Glu-A3 locus were associated with high SDSS test values, their effects being significantly different to other alleles in most of the environments. The worst performance was exhibited by genotypes carrying the subunit 5, followed by the 5 + 10 and 6.1 + 10 banding patterns.
At Glu-B3, the 2 + 4 + 15 + 19 (allele a) banding pattern was responsible for significantly increased SDSS test values. On the contrary, genotypes carrying the 8 + 9 + 13 + 16 and 1 + 3 + 14 + 18 banding patterns showed the lowest SDSS test values. A null allele (j) at the Glu-B3 locus, not previously described in durum wheat, was identified in the Chilean breeding line Quc 3506-2009. This allele was associated with a high SDSS test value. Regarding the effect of the Glu-B2 alleles on the SDSS test, it was 12 (a) > null (b) > 12* (c), although significant differences were only detected between 12* and null, or 12* and 12 subunits.

3.4. HMW-GS and LMW-GS Distribution along Different Periods and Origins

Six breeding periods were considered for the analysis of the allele distribution at the three main loci that showed high variability (Glu-B1, Glu-A3 and Glu-B3). The results are summarised in Figure 2. The effect of breeding on gluten strength showed a positive selection of alleles associated with high values of the sedimentation test (SDSS). At the Glu-B1 locus, the allele 20x + 20y (e) was associated with low–intermediate gluten quality decreased its frequency over time, whereas the alleles 6 + 8 (d) and 7 + 8 (b) were favoured by selection and their proportion increased, mostly in the 7 + 8 allele. At the Glu-A3 locus, the proportion of genotypes carrying the allele 6 (a) did not change over time, whereas the genotypes with 6 + 10 (c) and 6 + 11 (d) increased from the old to the modern germplasm. In addition, the null allele (h) and the subunit 5 (b) were progressively discarded from the 1915–1979 to the 2000–2020 periods. On the other hand, for Glu-B3 the greatest variability was observed from 1915 to 1979 with a predominance of the 2 + 4 + 15 + 19 (a) allele, which progressively increased to reach 100% in modern genotypes. The allelic distribution by origin is shown in Supplementary Figure S1. At Glu-B1, the 6 + 8 (d) was the main allele detected in the Argentinian genotypes, while the 7 + 8 (b) subunits were more frequent in Chilean and CIMMYT germplasm. The 20x + 20y (e) banding pattern was mostly detected in genotypes from France, WANA and Italy. At Glu-A3, the subunit 6 was mostly detected in the Argentinian, Italian and Chilean genotypes, whereas 6 + 10 (c) was the main allele in germplasm from WANA and France.

3.5. Quality Traits Variation over Different Breeding Periods

The variation in GPC and the SDSS test over the six breeding periods previously mentioned was assessed by ANOVA and Duncan tests (p < 0.05) for each environment and year. A decreasing trend in GPC was observed from the 1915–1969 to the 2000–2009 periods in six out of seven experiments, with a slight recovery also observed during the 2010–2020 period in some environments (Supplementary Figure S2). This decrease in GPC represented an average of 5.32% (in relative value) from 1934 to 2020 (−0.07% year−1 in GPC). On the other hand, the SDSS test values also decreased from 1915–1969 to 1970–1979, but this was later followed by a growth trend in the subsequent periods (Supplementary Figure S2). The overall estimated genetic gain for the gluten strength (SDSS test) was 10.8% from 1934–1969 to 2010–2020 (0.14% year−1 in SDSS). However, when the first breeding interval was removed, the overall genetic gain from 1970–1979 to 2010–2020 was 37.8%, representing an increase of 0.48% year−1 caused by breeding in our collection.

3.6. Glutenin Haplotype Frequency, Distribution and Effect

A total of 41 haplotypes could be conformed based on the alleles detected at the five glutenin loci (Table 2). Most of the haplotypes (30 of total) were poorly represented, showing frequencies of up to 1%. The most frequent haplotype, carried by 22.4% of the genotypes, was Hap_22, followed by Hap_11 and Hap_16 with 12.8% each, Hap 17 (10.2%) and Hap_23 (9.2%). The distribution of haplotypes by origin is shown in Supplementary Table S6. The most frequently observed haplotypes among the genotypes that ranked in the top 20% for the best SDSS test values were Hap_22 (for ex. BonINTA Cumenay), Hap_23 (CBW 09034), Hap_17 (CBW 0111) and Hap_16 (Buck#33). Additionally, some of the less frequent haplotypes obtained high SDSS values in both years (Hap_9, Hap_19, Hap_31, Hap_1, Hap_4 and Hap_18). Significant differences between haplotypes in the SDSS test were observed using the Bautista multiple comparison test p < 0.05) (BSS, [45]). A significant haplotype effect on GPC was only observed in three environments (BW 2011, PS 2014 and BW 2017) and the LSMEAN in the 2014/2017 trials (Figure 3). The ANOVA test considering the haplotype effect explained 70–77% of the variance in the SDSS test during 2011, and 48–53% during 2014, whereas, for GPC, it explained 33% of the phenotypic variation (Supplementary Table S5a,b).

3.7. Haplotype Effect on Additional Quality Parameters in Argentinian Genotypes

The contrasting haplotype effects in additional quality parameters, such as % gluten, wet gluten, dry gluten, gluten index and farinograph measurements (Development time and Energy level) as well as protein content, were analysed using historical datasets of Argentinian genotypes. For these analyses, 13 genotypes grown in up to 11 environments (11–175) from 1995/96 to 2017/18, representing a total of eight haplotypes (detailed in Supplementary Table S4), were used. These haplotypes varied at the Glu-B1, Glu-B2 and Glu-A3 loci. The ANOVA test showed a significant effect of the haplotypes on the Gluten Index, Grain protein, Energy level and Development time (Supplementary Figure S3). The haplotypes Hap_23 and Hap_22 exhibited the highest gluten index and Energy level, but obtained the lowest Development time from the farinograph. Additionally, the Hap_29 carrying 20x + 20y subunits at Glu-B1 but a triple null at Glu-A1, Glu-B2 and Glu-A3 and Glu-B3a also showed a high gluten index and Energy level.

4. Discussion

The importance of durum wheat prolamins (glutenins and gliadins) and their effect on gluten strength for pasta and breadmaking was mainly studied in different genetic backgrounds [4,7,47,48,49,50,51]. Our study focused on the characterisation of HMW-GS and LMW-GS variation in a worldwide durum wheat collection. The effect of these variants on quality traits was analysed gene-by-gene or as haplotypes, highlighting the importance of common and rare allelic variants to improve gluten quality. A description was also made of the glutenin profile of landraces, as well as old and modern germplasms, mainly from Argentina and other countries.

4.1. Glutenin Allelic and Haplotype Variation and Its Effect on GPC and the SDSS Test

In this study, a high number of alleles were detected at the glutenin loci, the Glu-B1, Glu-A3 and Glu-B3 genes being the main sources of variation in modern durum wheat germplasms exploited for gluten strength improvement. Most of the SDSS variance was explained alternatively by Glu-B1 or Glu-B3 in the two years evaluated, indicating that the expression of these genes was affected environmentally. However, these genes exerted a small effect on GPC in one year (2014), suggesting a weak association with this trait. Previous studies yielded controversial results regarding the relative importance of Glu-B1 and Glu-B3 and their association with gluten quality. According to Martínez et al. [52], the alleles at Glu-B3 strongly affect the gluten quality measured by the SDSS, mixograph and alveograph tests. On the contrary, Glu-B1 was also reported to play a major role in the end-use quality of durum wheat, affecting W and P/L ratio values [53]. However, other authors did not find any effect of Glu-B1 on gluten quality [54].
A better association between the glutenin loci and quality traits was obtained based on haplotypes, which could explain most of the variation in SDSS, most likely because the haplotype analysis also considers the possible effect of the interactions between loci.
Considering individual loci, Glu-A1 (HMW-GS) and Glu-B2 (LMW-GS) showed the lowest variation in our collection. The low variation at Glu-A1 in modern germplasms was also mentioned by several authors [27,50]. The null allele was practically fixed in our collection as well as in modern germplasms worldwide [51,53,55]. In our analysis, the 2* (b) allele was the unique differential subunit at Glu-A1 and was also detected at a very low frequency in durum wheat cultivars by other authors [27]. However, frequencies of 18.4% [56], 23.3% [57] and 41.1% [34] were observed in Iranian and Spanish durum wheats and Iranian bread wheat landraces, respectively. We found the 2* subunit to be associated with high gluten strength (higher SDSS), as was previously reported [56,58]. Nonetheless, the contribution of the non-null Glu-A1 alleles to improve durum wheat quality is still not well defined [55].
In our study, the highest variation was observed at the Glu-B1 locus with ten alleles, which coincided with previous reports on landraces and modern cultivars of durum wheat [50]. Glu-B1b (7 + 8) followed by Glu-B1d (6 + 8) and Glu-B1e (20x + 20y) were the most frequent alleles. Similar results were obtained in durum wheat, but with different frequencies, with 20x + 20y being > 6 + 8 > 7 + 8 [27]. In this study, the Glu-B1d (6 + 8) or Glu-B1b (7 + 8) alleles were among the four alleles with higher SDSS values. However, this effect was environmentally impacted, showing Glu-B1d with higher SDSS values in 2011 and Glu-B1b in 2014. The lower precipitation and mean temperature values obtained at all locations in 2011, suggested that an environmental effect could affect the allelic performance. Glu-B1b was widely associated with strong gluten and a good pasta-making quality [53]. Conversely, subunits 6 + 8 were associated with higher SDSS values than 7 + 8 and 20x + 20y [52]. According to Ammar et al. [59] Glu-B1d exhibited a better overall breadmaking quality compared to the 7 + 8 or 20 banding patterns. Based on our results, we cannot establish a clear order of importance at Glu-B1 between the 7 + 8 and 6 + 8 banding patterns or the haplotypes carrying these alleles, but a small difference of Glu-B1b (7 + 8) increasing SDSS was observed.
Previously, the 20x + 20y banding pattern was associated with inferior quality [48,59]. In our study, the Glu-B1e (20x + 20y) allele was associated with intermediate values of SDSS. This result was coincident with previous studies [31]. However, genotypes with Hap_14 and Hap_29, where Glu-B1e was combined with the Glu-A3h (null) allele, resulted in similar mean SDSS values to the genotypes with the 6 + 8 banding pattern. The breeding line CBW 05024 (Hap_29) carried Glu-B1e/Glu-A3h, but also a null allele at Glu-A1 and Glu-B2, which could be an interesting alternative haplotype, showing a high gluten strength.
Two additional Glu-B1 banding patterns involving the Bx7 subunit (7 + 15 and 7 + 22) were identified among old, intermediate and modern genotypes from Argentina, France, Italy and CIMMYT. Glu-B1z (7 + 15) was reported in CIMMYT-derived germplasms and in one Iranian landrace [56,60]. In addition, the Glu-B1ch (7 + 22) allele was reported in one Mediterranean landrace [50] and three Iranian landraces [56]. The latter authors also associated Glu-B1ch with low gluten quality. Conversely, in the present study the haplotypes (Hap_19, Hap_20 and Hap_21) carrying 7 + 15 or 7 + 22 banding patterns ranked among the best glutenin profiles increasing the SDSS values, suggesting that they should be more carefully evaluated for use in durum wheat breeding programs. The Glu-B1f (13 + 16) allele was detected at a low frequency, which was also reported in other cultivars and durum wheat landraces [53,61,62]. However, the frequency of Glu-B1f was high (21.38%) in an Algerian durum wheat collection [63] and it was suggested that this allele was associated with low gluten quality [62]. However, our results showed that this allele in Hap_9 was associated with high gluten quality. Hap_9, ranked among the best haplotypes in both years.
A unique banding pattern was carried by the Italian cultivar, Polesine (14 + 22*), associated with low gluten quality (as SDSS), but showing a high GPC value. Two other different banding patterns (13 + 16 and 23 + 18) were previously reported for this genotype [27]. Although the genetics and morphology observed in Polesine, such as plant height and a light green colour (typically only observed in old Italian germplasms) the differences in banding pattern could suggest a misclassification of this material in our seed stock. As far as we know, this is the first report of the 14 + 22* subunit combination in durum wheat. Subunit 22* was previously mentioned as a rare variant [56]. Another unique banding pattern (6* + 15*) was obtained in the landrace, Haurani. A previous study described the 6 + 16 banding pattern in this landrace [60]. Subunit 6* has a higher mobility than subunit 6 in SDS-PAGE. In our study, Haurani showed high SDSS values in both years evaluated, suggesting that the 6* + 15* subunits could be a useful resource for breeding. Additionally, the 6 + 20y banding pattern resulted in a new combination of subunits at the Glu-B1 locus, only observed in the Italian cultivar, Capeiti8. Nevertheless, different patterns for this cultivar were reported in previous studies as 20x + 20y and 7 + 8 [60,64]. The 6 + 20y banding pattern was not evaluated phenotypically. According to the Catalogue of Gene Symbols for Wheat [65] and the 2020 Supplement (https://wheat.pw.usda.gov/GG3/wgc, accessed date on 2 September 2021), the 14 + 22*, 6 + 20y and 6* + 15* banding patterns were not annotated, and we tentatively propose the nomenclature of Glu-B1cq, Glu-B1cr and Glu-B1cs for these subunit combinations.
Significant interactions between Glu-B1 and Glu-B3 or Glu-A3 were indicated as playing an important effect on quality parameters [52]. Supporting this, the presence of the Glu-B3b (8 + 9 + 13 + 16) or Glu-B3h (1 + 3 + 14 + 18) allele causes a detrimental effect on SDSS, regardless of which allele is present at Glu-B1. Since Glu-B3a (2 + 4 + 15 + 19) represented about 90% of the total variation and was gradually fixed in modern germplasms, most of the differences in quality traits were due to the allelic effect from Glu-B1 and Glu-A3 and eventually at Glu-B2. A low level of variation was observed at Glu-B3 in comparison with other studies conducted on landraces [50,55,56] or durum wheat germplasm from North Africa [60] and Spain [66]. Contrary to our study, the 2 + 4 + 15 + 18 banding pattern was recorded with a relatively high frequency in Mediterranean landraces [67] and was also reported by other authors [35,56,66].
The rare allelic variant Glu-B3ag (2 + 4 + 16) [56] was only detected in the old Argentinian cultivar Bonaerense 202 (1966). In addition, the 2 + 4 + 8 + 9 + 15 + 19 banding pattern was not previously reported, and we tentatively suggest that this new allele be known as Glu-B3aw, following the order of the Catalogue of Gene Symbols for wheat [65] and its 2020 Supplement (https://wheat.pw.usda.gov/GG3/wgc, accessed date on 2 September 2021). Additionally, the subunit combination 2 + 4 + 15 + 18 was not previously named and we propose the name of Glu-B3ax for this allele.
Another rare variant at Glu-B3j (null) was previously mentioned as a result of the wheat–rye translocation 1BL/1RS [68,69] that caused the loss of Glu-B3 LMW-GS and possibly the linked gliadins (Gli-B1 locus), and incorporated the secalins (Sec-1 locus) into the wheat, causing dough stickiness and a reduced gluten quality [70,71,72]. However, the unique genotype which carried Glu-B3j (Quc 3506-2009) showed high gluten strength. This Chilean breeding line (Hap_41) is a triple null genotype (Glu-A1, Glu-B3 and Glu-B2), also carrying the Glu-B1b and Glu-A3a alleles, which showed bread wheat ancestry as being the possible origin of the rye translocation. To our knowledge this allele was not previously reported in durum wheat.
Among LMW-GS the Glu-A3 locus exhibited a slightly higher variability but explained less of the SDSS test variance than Glu-B3. The level of polymorphism at Glu-A3 observed in our study was comparable to previous reports [55,57] in Moroccan and Spanish durum wheat germplasms. The most common variants at Glu-A3, 6 and 6 + 10, associated with high gluten strength, are also widely distributed worldwide [36,50,55,56,57,62,66]. However, we could not find a clear significant difference favouring these two alleles over the others. Among the Glu-A3 alleles, the unique banding patterns 5 + 10 (Langdon (Dic-3A)-10) and 10 + 11 (Biensur) were only previously described in Mediterranean durum wheat germplasms [50]. Only the presence of the subunit 5 (Glu-A3b), or combined as 5 + 10, was clearly associated with low SDSS values (Hap_35 to Hap_40). The absence of subunit 5 at Glu-A3 in old, but also modern, Argentinian genotypes could be one of the reasons for this, since Argentinian durum wheat was considered to be of high quality in the past.
In our study, the 6.1 + 10 banding pattern was only detected in three Argentinian genotypes. The Glu-A3ax (6.1) allele was described previously and named in the Argentinian cultivar Buck Cristal [31]. However, we observed the 6.1 + 10 banding pattern in Buck Cristal. This could be attributed to different resolution levels in the methodology. The 6.1 subunit [66] is equivalent to the previously designated 7* subunit [73]. Glu-A3e (11) was described in durum wheat by several authors [36,55,62] but only detected in the French and Italian germplasm in our collection.
As previously mentioned, the interaction between HMW-GS and LMW-GS, in particular for the Glu-1 and Glu-3 loci, has an important influence on technological properties [74,75,76]. According to He et al., interactions such as Glu-B1 × Glu-B3 and Glu-D1 × Glu-A3, strongly affect the SDS sedimentation value, farinograph stability and loaf volume [77]. Similarly, both additive and epistatic effects between glutenin loci significantly affect the dough characteristics [78]. To address this problem, we analysed the effects of these genes on quality traits using haplotypes as in previous reports [33,62,66]. The analysis of allelic combinations instead of individual loci better explained the SDSS and partially explained the GPC variations. Some haplotypes were only detected in the Argentinian (10), Italian (8), French (5), WANA (4), USA (2) and Chilean (1) genotypes, showing the benefits of germplasm exchange. Some rare haplotypes in genotypes from the USA, Italy and Chile were likely a consequence of the allele’s introgression through wide crosses during the breeding process.

4.2. Variability in Quality Traits between Breeding Periods and Its Relationship with Allelic Variation at Glutenin Loci

Our results showed a decreasing trend in GPC over six breeding periods in most of the environments evaluated. The negative relationship between GPC and grain yield under most environmental conditions is well known [79,80]. This result agrees well with the increase in grain yield over time, reported by our group [81] using a subset of our collection, as well as from other authors [51,53,82,83]. The estimated reduction in GPC based on our data over time (−0.07% year−1) was about half of the value reported in previous studies [53,62,84].
Moreover, the SDSS test showed an initial decrease from the first period (1915–1969) to the second (1970–1979), followed by a consistent improvement in gluten quality until the 2010–2020 period. The positive growth rate period was similar to results obtained for Italian and Spanish cultivars [53,62]. In the same way, an increased glutenin content without any changes in the albumin/globulin rate from 1891 to 2010 was reported in bread wheat [85]. Nevertheless, the improvement in gluten strength over the last 50 years partially recovered the loss observed during the first and second breeding periods. This finding supports the idea that a reduction in grain quality occurred after the introduction of semi-dwarfism during the 1970s. This agrees well with the fact that all genotypes from the 1934–1969 period were tall and carried the Rht-B1a allele [86]. The SDSS genetic gain from 1970–1979 to 2010–2020 (37.8%) was slightly higher than that reported for Spanish and Italian germplasms [62].
Our study shows that the increases in gluten strength over time are strongly associated with changes in allele composition in the HMW and LMW glutenin subunits and were associated with a progressive replacement of the 20x + 20y banding pattern by the 7 + 8 and 6 + 8 subunits at Glu-B1 as also reported previously [62]. Negative effect alleles, such as Glu-A3h and Glu-A3b, were also progressively replaced by more advantageous ones (6 + 10 and 6 + 11). The Glu-A1, Glu-B3 and Glu-B2 loci were progressively fixed (null(c), 2 + 4 + 15 + 19 (a), 12 (a), respectively) from old to modern accessions, indicating that most of the variation observed today is due to allelic variations at the Glu-B1 and Glu-A3 loci. The most frequent haplotypes (22, 23, 17 and 16) carried this conserved allelic combination. The Glu-B3a/Glu-B2a combination was also present in 75% of all the intermediate and in 100% of the modern Italian cultivars [51].

4.3. Haplotype Effect on Additional Quality Parameters

The gluten strength in durum wheat is mainly responsible for pasta quality, and several methodologies were proposed as predictors or as direct tests for rheological properties (micromixograph, viscoelastograph, farinograph, alveograph, gluten index and SDSS) [87]. The SDSS test is widely used as a predictor of gluten strength [24,48,88,89]. Although the SDSS test and Gluten Index are highly correlated, it is noted that the SDSS is clearly influenced by protein content [90]. We evaluated the effect of the five most frequent haplotypes and some contrasting haplotypes in selected Argentinian genotypes by using historical datasets for quality traits, including the gluten index. Our results confirmed that Hap_23 and Hap_22, both carrying 7 + 8 subunits at Glu-B1, showed a superior performance based both on the gluten index or farinograph parameters. This analysis provides additional evidence for the high gluten strength associated with Hap_29 by the SDSS test. These results confirm the suitability of SDSS as a gluten strength predictor and its association with allelic variants at glutenin loci and haplotypes.

5. Conclusions

In the present study, the allelic variations at five durum wheat glutenin loci were characterised and four new alleles were detected. Additionally, the contribution of individual alleles to improve gluten quality, and their influence on grain protein content, was highlighted, and the haplotype analysis offered valuable information for use in durum wheat breeding programs. Our results showed a decreasing trend in grain protein content over the last 85 years, which could be attributed to a dilution effect due to grain yield improvements. The changes in gluten strength measured by the SDSS test over the same breeding period were associated with the variation in the allele frequency at glutenin loci. Furthermore, some haplotypes poorly represented in modern germplasms were shown to be associated with a high SDSS and quality performance and should be considered for use in breeding programs.

Supplementary Materials

The following are available online at https://www.mdpi.com/article/10.3390/foods10112845/s1, Figure S1: Allelic distribution of the three main glutenin loci (Glu-B1, Glu-A3 and Glu-B3) considering the origin of accession in the whole collection. Figure S2: Multiple comparison tests (Duncan test, p < 0.05) performed on the GPC and SDSS means considering six breeding periods in each environment and by year. The environmental references are CA: Cabildo; BW: Barrow; PS: Pieres, followed by the year of sowing. Bars in the same environment with a different letter on the top are significantly different. Figure S3: Bar plot showing additional quality traits mean values according to the corresponding haplotype. Means with a different letter on the top indicate significant differences according to the Tukey–Kramer test (p < 0.05). Table S1: Allelic characterisation of HMW-GS and LMW-GS glutenin loci in a worldwide durum wheat collection of 196 genotypes. Table S2: List of KASP markers for Glu-A1 and Gpc-B1 used in this study. Table S3: Precipitation, mean temperature and adopted management in the seven field trials. Table S4: Summary of genotypes/haplotypes and trials considered with additional quality parameters. Table S5: Percentage of variance explained by each locus, model and haplotypes for GPC and SDS sedimentation test. Table S6: Frequency and distribution of haplotypes according to the origin of accessions.

Author Contributions

Conceptualization, P.F.R. and V.E.; Methodology, P.F.R., A.O.L., C.G., S.D., E.M., V.A.; Validation, P.F.R., A.O.L., C.G.; Formal Analysis, P.F.R., A.L.A.; Investigation, P.F.R., C.G., A.O.L., A.L.A., E.M. and V.A.; Resources, P.F.R., V.E., C.G., S.D., E.M.; Data Curation, P.F.R., A.O.L., C.G., E.M.; Visualization P.F.R., C.G.; Writing—Original Draft Preparation, P.F.R.; Writing—Review and Editing, P.F.R., V.E., A.L.A., C.G.; Funding Acquisition, V.E., P.F.R., C.G., S.D.; Supervision, P.F.R., V.E. and C.G.; Project Administration, V.E., P.F.R. All authors have read and agreed to the published version of the manuscript.

Funding

This research was funded by CONICET, CERZOS-CCT CONICET Bahía Blanca, Universidad Nacional del Sur/ME (NUTRIPASTA PCESU9-UNS993), ANPCYT: PICT 2015-1401. We also acknowledge the support of the H2020-MSCA-RISE-2015 project EXPOSEED (grant no. 691109) and CGIAR Research Program WHEAT. Carlos Guzman gratefully acknowledges the European Social Fund and the Spanish State Research Agency (Ministry of Science and Innovation) for financial funding through the Ramon y Cajal Program (RYC-2017-21891).

Data Availability Statement

Data in this study are available in the article and Supplementary Materials. Plant material and raw data are available upon request from the first author.

Acknowledgments

Thanks are due to all seed donors for building the collection analysed in this study. Additionally, we would like to thank ACA Coop LTDA, BUCK Semillas Companies and INTA Barrow for facilitating their experimental fields. We especially thank CIMMYT for expertise support in genetic markers.

Conflicts of Interest

The authors declare no conflict of interest. The funders had no role in decision in this manuscript.

References

  1. Matsuo, R.R. Durum wheat: Its unique pasta-making properties. In Wheat: Production, Properties and Quality; Bushuk, W., Rasper, V.F., Eds.; Springer: Boston, MA, USA, 1994; pp. 169–178. [Google Scholar] [CrossRef]
  2. Unión de Industriales Fideeros de la República Argentina (UIFRA). Pastas Secas, Estadísticas Sectoriales. Unión De Industriales Fideeros De La República Argentina. 2020, pp. 1–12. Available online: https://uifra.org.ar/wp-content/uploads/2020/04/dossier2020v2.pdf (accessed on 20 September 2021).
  3. Motzo, R.; Giunta, F.; Fois, S.; Deidda, M. Evoluzione Varietale e Qualità in Frumento Duro (Triticum turgidum subsp. durum): Dalle Vecchie Popolazioni Alle Attuali Cultivar; Dipartimento di Scienze Agronomiche e Genetica Vegetale Agraria, Facoltà di Agraria, Università degli Studi di Sassari: Sassari, Italy, 2001; p. 30. [Google Scholar]
  4. Matsuo, R.R.; Bradley, J.W.; Irvine, G.M. Effect of protein content on the cooking quality of spaghetti. Cereal Chem. 1972, 49, 707. [Google Scholar]
  5. Dexter, J.E.; Matsuo, R.R. Relationship between Durum Wheat Protein Properties and Pasta Dough Rheology and Spaghetti Cooking Quality. J. Agric. Food Chem. 1980, 8, 899–902. [Google Scholar] [CrossRef]
  6. Boggini, G.; Pogna, N.E. The Breadmaking Quality and Storage Protein Composition of Italian Durum Wheat. J. Cereal Sci. 1989, 9, 131–138. [Google Scholar] [CrossRef]
  7. Matsuo, R.R.; Irvine, G.M. Effect of gluten on the cooking quality of spaghetti. Cereal Chem. 1970, 47, 173–180. [Google Scholar]
  8. Impiglia, A.; Nachit, M.; Lafiandra, D.; Porceddu, E. Effect of gliadin and glutenin components on gluten strength in durum wheat. In Durum Wheat Quality in the Mediterranean Region; Di Fonzo, N., Kaan, F., Nachit, M., Eds.; Options Méditerranéennes: Série, A. Séminaires Méditerranéens n 22; CIHEAM: Zaragoza, Spain, 1995; pp. 167–172. [Google Scholar]
  9. Troccoli, A.; Borrelli, G.M.; De Vita, P.; Fares, C.; Di Fonzo, N. Durum Wheat Quality: A Multidisciplinary Concept. Mini Review. J. Cereal Sci. 2000, 32, 99–113. [Google Scholar] [CrossRef]
  10. Osborne, T.B. The Proteins of the Wheat Kernel; Carnegie Inst Washington Publication: Washington, WA, USA, 1907; Volume 84, pp. 1–119. [Google Scholar]
  11. Dexter, J.E.; Matsuo, R.R. Influence of protein content on some durum wheat quality parameters. Can. J. Plant Sci. 1977, 57, 717–727. [Google Scholar] [CrossRef] [Green Version]
  12. Payne, P.I.; Holt, L.M.; Lawrence, G.J.; Law, C.N. The genetics of gliadin and glutenin, the major storage proteins of the wheat endosperm. Plant Foods Hum. Nutr. 1982, 31, 229–241. [Google Scholar] [CrossRef]
  13. Porceddu, E. Durum wheat quality in the Mediterranean countries. In Durum Wheat Quality in the Mediterranean Region; Di Fonzo, N., Kaan, F., Nachit, M., Eds.; Options Méditerranéennes: Série, A. Séminaires Méditerranéens n 22; CIHEAM: Zaragoza, Spain, 1995; pp. 11–21. [Google Scholar]
  14. Shepherd, K.W. Chromosomal control of endosperm proteins in wheat and rye. In Proceedings of the 3rd International Wheat Genetic Symptoms, Australian Academy of Sciences, Canberra, Australia, 5–9 August 1968; pp. 86–96. [Google Scholar]
  15. Joppa, L.R.; Khan, K.; Williams, N.D. Chromosomal location of genes for gliadin polypeptides in durum wheat Triticum turgidum. Theor. Appl. Genet. 1983, 64, 289–293. [Google Scholar] [CrossRef]
  16. Pogna, N.; Lafiandra, D.; Feillet, P.; Autran, J.C. Evidence for direct casual effect of low molecular weight subunits of glutenins on gluten viscoelasticity in durum wheats. J. Cereal Sci. 1988, 7, 211–214. [Google Scholar] [CrossRef]
  17. Lawrence, G.J.; Shepherd, K.W. Variation in Glutenin Protein Subunits of Wheat. Aust. J. Bioi. Sci. 1980, 33, 221–234. [Google Scholar] [CrossRef] [Green Version]
  18. Payne, P.I. Genetics of wheat storage proteins and the effect of allelic variation on bread-making quality. Ann. Rev. Plant Physiol. 1987, 38, 141–153. [Google Scholar] [CrossRef]
  19. Jackson, E.A.; Holt, L.M.; Payne, P.I. Glu-B2, a storage protein locus controlling the D group of LMW glutenin subunits in bread wheat (Triticum aestivum). Genet. Res. 1985, 46, 11–17. [Google Scholar] [CrossRef]
  20. Shewry, P.; Tatham, A.S.; Forde, J.; Kreis, M.; Miflin, B.J. The Classification and Nomenclature of Wheat Gluten Proteins: A Reassessment. J. Cereal Sci. 1986, 4, 97–106. [Google Scholar] [CrossRef]
  21. Harberd, N.P.; Bartels, D.; Thompson, R.D. DNA restriction-fragment variation in the gene family encoding high molecular weight (HMW) glutenin subunits of wheat. Biochem. Genet. 1986, 24, 579–596. [Google Scholar] [CrossRef] [PubMed]
  22. Damidaux, R.; Grignac, P.; Feillet, P. Relation applicable en sélection entre l’électrophoregramme des gliadines et les proprietés viscoélastiques du gluten de Triticum durum Desf. C. R. Acad. Sci. Paris 1978, 287, 701–704. [Google Scholar]
  23. Payne, P.I.; Jackson, E.A.; Holt, L.M. The association between γ-gliadin 45 and gluten strength in durum wheat varieties: A direct causal effect or the result of genetic linkage? J. Cereal Sci. 1984, 2, 73–81. [Google Scholar] [CrossRef]
  24. Autran, J.-C.; Laignelet, B.; Morel, M.-H. Characterization and quantification of low molecular weight glutenins in durum wheats. Biochimie 1987, 69, 699–711. [Google Scholar] [CrossRef]
  25. Levy, A.A.; Galili, G.; Feldman, M. Polymorphism and genetic control of high molecular weight glutenin subunits in wild tetraploid wheat Triticum turgidum var. dicoccoides. Heredity 1988, 61, 63–72. [Google Scholar] [CrossRef]
  26. Xu, S.S.; Khan, K.; Klindworth, D.L.; Faris, J.D.; Nygard, G. Chromosomal location of genes for novel glutenin subunits and gliadins in wild emmer wheat (Triticum turgidum L. var. dicoccoides). Theor. Appl. Genet. 2004, 108, 1221–1228. [Google Scholar] [CrossRef]
  27. Branlard, G.; Autran, C.; Monneveux, P. High molecular weight glutenin subunit in durum wheat (T. durum). Theor. Appl. Genet. 1989, 78, 353–358. [Google Scholar] [CrossRef]
  28. Caballero, L.; Martín, M.A.; Alvarez, J.B. Allelic variation for the high- and low-molecular-weight glutenin subunits in wild diploid wheat (Triticum urartu) and its comparison with durum wheats. Aust. J. Agric. Res. 2008, 59, 906–910. [Google Scholar] [CrossRef]
  29. Alvarez, J.B.; Guzmán, C. Recovery of Wheat Heritage for Traditional Food: Genetic Variation for High Molecular Weight Glutenin Subunits in Neglected/Underutilized Wheat. Agronomy 2019, 9, 755. [Google Scholar] [CrossRef] [Green Version]
  30. Wallace, J.; Bainotti, C.; Nisi, M.M.; Formica, B.; Seghezzo, M.L.; Molfese, E.; Jensen, C.; Nisi, J.; Helguera, M. Variabilidad genética de proteínas de reserva en trigos candeales argentinos y su interacción con la calidad industrial. AgriScientia 2003, 20, 19–27. [Google Scholar] [CrossRef]
  31. Lerner, S.E.; Cogliatti, M.; Ponzio, N.R.; Seghezzo, M.L.; Molfese, E.R.; Rogers, W.J. Genetic variation for grain protein components and industrial quality of durum wheat cultivars sown in Argentina. J. Cereal Sci. 2004, 40, 161–166. [Google Scholar] [CrossRef]
  32. Roncallo, P.F.; Larsen, A.O.; Achilli, A.L.; Saint Pierre, C.; Gallo, C.A.; Dreisigacker, S.; Echenique, V. Linkage disequilibrium patterns, population structure and diversity analysis in a worldwide durum wheat collection including Argentinian genotypes. BMC Genom. 2021, 22, 233. [Google Scholar] [CrossRef] [PubMed]
  33. Peña, R.J.; Gonzalez-Santoyo, J.; Cervantes, F. Relationship between Glu-D1/Glu-B3 allelic combinations and bread-making quality-related parameters commonly used in wheat breeding. In The Gluten Proteins, Proceedings of the 8th Gluten Workshop, Viterbo, Italy, 8–10 September 2003; Lafiandra, D., Masci, S., D’Ovidio, R., Eds.; Royal Society of Chemistry: Cambridge, UK, 2003; pp. 156–157. [Google Scholar] [CrossRef]
  34. Maryami, Z.; Huertas-García, A.B.; Azimi, M.R.; Hernández-Espinosa, N.; Payne, T.; Cervantes, F.; Govindan, V.; Ibba, M.I.; Guzman, C. Variability for Glutenins, Gluten Quality, Iron, Zinc and Phytic Acid in a Set of One Hundred and Fifty-Eight Common Wheat Landraces from Iran. Agronomy 2020, 10, 1797. [Google Scholar] [CrossRef]
  35. Payne, P.I.; Lawrence, G.J. Catalogue of alleles for the complex gene loci, Glu-A1, Glu-B1, and Glu-D1 which code for high-molecular-weight subunits of glutenin in hexaploid wheat. Cereal Res. Commun. 1983, 11, 29–35. [Google Scholar]
  36. Nieto-Taladriz, M.T.; Ruiz, M.; Martínez, M.C.; Vazquez, J.F.; Carrillo, J.M. Variation and classification of B low-molecular-weight glutenin subunit alleles in durum wheat. Theor. Appl. Genet. 1997, 95, 1155–1160. [Google Scholar] [CrossRef]
  37. Rasheed, A.; Wen, W.; Gao, F.; Zhai, S.; Jin, H.; Liu, J.; Guo, Q.; Zhang, Y.; Dreisigacker, S.; Xia, X.; et al. Development and validation of KASP assays for genes underpinning key economic traits in bread wheat. Theor. Appl. Genet. 2016, 129, 1843–1860. [Google Scholar] [CrossRef]
  38. Saghai-Maroof, M.A.; Soliman, K.M.; Jorgensen, R.A.; Allard, R.W. Ribosomal DNA spacer length polymorphism in barley: Mendelian inheritance, chromosomal location and population dynamics. Proc. Nat. Acad. Sci. USA 1984, 81, 8014–8019. [Google Scholar] [CrossRef] [Green Version]
  39. Patterson, H.D.; Williams, E.R. A new class of resolvable incomplete block designs. Biometrika 1976, 63, 83–92. [Google Scholar] [CrossRef]
  40. Irvine, G.; Bradley, J.; Martin, G. A farinograph technique for macaroni doughs. Cereal Chem. 1961, 38, 153–164. [Google Scholar]
  41. Molfese, E.; Astiz, V.; Seghezzo, M.L. Evaluación de la calidad del trigo candeal (Triticum turgidum L. subsp. durum) en los programas de mejoramiento de Argentina. RIA 2017, 43, 303–311. [Google Scholar]
  42. SAS Institute INC. Base SAS 9.2 Procedures Guide; SAS Institute INC: Cary, NC, USA, 2010. [Google Scholar]
  43. Di Rienzo, J.A.; Casanoves, F.; Balzarini, M.G.; Gonzalez, L.; Tablada, M.; Robledo, C.W. InfoStat Versión 2016; Grupo InfoStat (FCA, Universidad Nacional de Córdoba): Cordoba, Argentina, 2016; Available online: http://www.infostat.com.ar (accessed on 2 September 2021).
  44. Miller, R.G. Simultaneous Statistical Inference, 2nd ed.; Springer: New York, NY, USA, 1981. [Google Scholar] [CrossRef]
  45. Bautista, M.G.; Smith, D.W.; Steiner, R.L. A Cluster-Based approach to Means Separation. J. Agric. Biol. Environ. Stat. 1997, 2, 179–197. [Google Scholar] [CrossRef]
  46. Di Rienzo, J.A.; Guzman, A.W.; Casanoves, F. A multiple-comparisons method based on the distribution of the root node distance of a binary tree. JABES 2002, 7, 129–142. [Google Scholar] [CrossRef]
  47. Kosmolak, F.G.; Dexter, J.E.; Matsuo, R.R.; Leisle, D.; Marchylo, B.A. A relationship between durum wheat quality and gliadin electrophoregrams. Can. J. Plant Sci. 1980, 60, 427–432. [Google Scholar] [CrossRef] [Green Version]
  48. Carrillo, J.M.; Vazquez, J.F.; Orellana, J. Relationship between gluten strength and glutenin proteins in durum wheat cultivars. Plant Breed 1990, 104, 325–333. [Google Scholar] [CrossRef]
  49. Carrillo, J.M.; Martínez, M.C.; Brites, M.C.; Nieto-Taladriz, M.T.; Vázquez, J.F. Proteins and quality in durum wheat (Triticum turgidum L. var. durum). In Durum Wheat Quality in the Mediterranean Region: New Challenges; Royo, C., Nachit, M., Di Fonzo, N., Araus, J.L., Eds.; Options Méditerranéennes: Série, A. Séminaires Méditerranéens; n. 40; CIHEAM: Zaragoza, Spain, 2000; pp. 463–467. [Google Scholar]
  50. Nazco, R.; Peña, R.J.; Ammar, K.; Villegas, D.; Crossa, J.; Moragues, M.; Royo, C. Variability in glutenin subunit composition of Mediterranean durum wheat germplasm and its relationship with gluten strength. J. Agric. Sci. 2014, 152, 379–393. [Google Scholar] [CrossRef] [Green Version]
  51. De Santis, M.A.; Giuliani, M.M.; Giuzio, L.; De Vita, P.; Lovegrove, A.; Shewry, P.R.; Flagella, Z. Differences in gluten protein composition between old and modern durum wheat genotypes in relation to 20th century breeding in Italy. Eur. J. Agron. 2017, 87, 19–29. [Google Scholar] [CrossRef]
  52. Martínez, M.C.; Ruiz, M.; Carrillo, J.M. Effect of different prolamin alleles on durum wheat quality properties. J. Cereal Sci. 2005, 41, 123–131. [Google Scholar] [CrossRef]
  53. De Vita, P.; Nicosia, O.L.D.; Nigro, F.; Platani, C.; Riefolo, C.; Di Fonzo, N.; Cattivelli, L. Breeding progress in morpho-physiological, agronomical and qualitative traits of durum wheat cultivars released in Italy during the 20th century. Eur. J. Agron. 2007, 26, 39–53. [Google Scholar] [CrossRef]
  54. Vázquez, J.F.; Ruiz, M.; Nieto-Taladriz, M.T.; Albuquerque, M.M. Effects on gluten strength of low Mr glutenin subunits coded by alleles at Glu-A3 and Glu-B3 loci in durum wheat. J. Cereal Sci. 1996, 24, 125–130. [Google Scholar] [CrossRef]
  55. Chegdali, Y.; Ouabbou, H.; Essamadi, A.; Cervantes, F.; Ibba, M.I.; Guzmán, C. Assessment of the glutenin subunits diversity in a durum wheat (T. turgidum ssp. durum) collection from Morocco. Agronomy 2020, 10, 957. [Google Scholar] [CrossRef]
  56. Hernández-Espinosa, N.; Payne, T.; Huerta-Espino, J.; Cervantes, F.; Gonzalez-Santoyo, H.; Ammar, K.; Guzmán, C. Preliminary characterization for grain quality traits and high and low molecular weight glutenins subunits composition of durum wheat landraces from Iran and Mexico. J. Cereal Sci. 2019, 88, 47–56. [Google Scholar] [CrossRef]
  57. Chacón, E.A.; Vázquez, F.J.; Giraldo, P.; Carrillo, J.M.; Benavente, E.; Rodríguez-Quijano, M. Allelic Variation for Prolamins in Spanish Durum Wheat Landraces and Its Relationship with Quality Traits. Agronomy 2020, 10, 136. [Google Scholar] [CrossRef] [Green Version]
  58. Pasqualone, A.; Piarulli, L.; Mangini, G.; Gadaleta, A.; Blanco, A.; Simeone, R. Quality characteristics of parental lines of wheat mapping populations. Agric. Food Sci. 2015, 24, 118–127. [Google Scholar] [CrossRef]
  59. Ammar, K.; Kronstad, W.E.; Morris, C.F. Breadmaking Quality of Selected Durum Wheat Genotypes and Its Relationship with High Molecular Weight Glutenin Subunits Allelic Variation and Gluten Protein Polymeric Composition. Cereal Chem. 2000, 77, 230–236. [Google Scholar] [CrossRef]
  60. Bellil, I.; Hamdi, O.; Khelifi, D. Diversity of five glutenin loci within durum wheat (Triticum turgidum L. ssp. durum (Desf.) Husn.) germplasm grown in Algeria. Plant Breed 2014, 133, 179–183. [Google Scholar] [CrossRef]
  61. Carrillo, J.M. Variability for glutenin proteins in Spanis h durum wheat landraces. In Durum Wheat Quality in the Mediterranean Region; Di Fonzo, N., Kaan, F., Nachit, M., Eds.; Options Méditerranéennes: Série, A. Séminaires Méditerranéens n. 22; CIHEAM: Zaragoza, Spain, 1995; pp. 143–147. [Google Scholar]
  62. Subira, J.; Peña, R.J.; Álvaro, F.; Ammar, K.; Ramdani, A.; Royo, C. Breeding progress in the pasta-making quality of durum wheat cultivars released in Italy and Spain during the 20th Century. Crop. Pasture Sci. 2014, 65, 16–26. [Google Scholar] [CrossRef] [Green Version]
  63. Hamdi, W.; Bellil, I.; Branlard, G.; Douadi, K. Genetic Variation and Geographical Diversity for Seed Storage Proteins of Seventeen Durum Wheat Populations Collected in Algeria. Not. Bot. Horti Agrobot. Cluj-Napoca 2010, 38, 22–32. [Google Scholar] [CrossRef]
  64. Vallega, V. High-molecular-weight glutenin subunit composition ofItalian Triticum durum cultivars and spaghetti cooking quality. Cer. Res. Comm. 1986, 14, 251–257. [Google Scholar]
  65. Mcintosh, R.A.; Yamazaki, Y.; Dubcovsky, J.; Rogers, W.J.; Morris, C.; Appels, R.; Xia, X.C. Catalogue of Gene Symbols for Wheat. 2013. Available online: https://shigen.nig.ac.jp/wheat/komugi/genes/symbolClassList.jsp (accessed on 31 August 2021).
  66. Ruiz, M.; Bernal, G.; Giraldo, P. An update of low molecular weight glutenin subunits in durum wheat relevant to breeding for quality. J. Cereal Sci. 2018, 83, 236–244. [Google Scholar] [CrossRef]
  67. Nazco, R.; Peña, R.J.; Ammar, K.; Villegas, D.; Crossa, J.; Royo, C. Durum wheat (Triticum durum Desf.) Mediterranean landraces as sources of variability for allelic combinations at Glu-1/Glu-3 loci affecting gluten strength and pasta cooking quality. Genet. Resour. Crop. Evol. 2014, 61, 1219–1236. [Google Scholar] [CrossRef] [Green Version]
  68. Martínez-Cruz, E.; Espitia-Rangel, E.; Villaseñor-Mir, H.E.; Molina-Galán, J.D.; Benítez-Riquelme, I.; Santacruz-Varela, A.; Peña-Bautista, R.J. Diversidad genética de gluteninas y gliadinas en trigos harineros (Triticum aestivum L.) mexicanos. Agrociencia 2010, 44, 187–195. [Google Scholar]
  69. Howell, T.; Hale, I.; Jankuloski, L.; Bonafede, M.; Gilbert, M.; Dubcovsky, J. Mapping a region within the 1RS.1BL translocation in common wheat affecting grain yield and canopy water status. Theor. Appl. Genet. 2014, 127, 2695–2709. [Google Scholar] [CrossRef] [PubMed] [Green Version]
  70. Rajaram, S.R.; Braun, H.J. Wheat yield potential. In International Symposium on Wheat Yield Potential: Challenges to International Wheat Breeding; Reynolds, M., Pietragalla, P.J., Braun, H.J., Eds.; CIMMYT: Mexico City, México, 2008; pp. 103–107. [Google Scholar]
  71. Fenn, D.; Lukow, O.M.; Bushuk, W.; Depauw, R.M. Milling and baking quality of 1BL/1RS translocation wheats. I. Effects of genotype and environment. Cereal Chem. 1994, 71, 189–195. [Google Scholar]
  72. Liu, L.; He, H.Z.; Yan, Y.; Xia, X.C.; Peña, R.J. Allelic variations at the Glu-1 and Glu-3 loci, presence of the 1B.1R translocation, and their effects on mixographic properties in Chinese bread wheats. Euphytica 2005, 142, 197–204. [Google Scholar] [CrossRef]
  73. Aguiriano, E.; Ruiz, M.; Fité, R.; Carrillo, J.M. Genetic variation for glutenin and gliadins associated with quality in durum wheat (Triticum turgidum L. ssp. turgidum) landraces from Spain. Span. J. Agric. Res. 2008, 6, 599–609. [Google Scholar] [CrossRef] [Green Version]
  74. Gupta, R.B.; Paul, J.G.; Cornish, B.B.; Palmer, G.A.; Bekes, F.; Rathjen, A.J. Allelic variation at glutenin subunit and gliadin loci, Glu-1, Glu-3 and Gli-1, of common wheats. I. Its additive and interaction effects on dough properties. J. Cereal Sci. 1994, 19, 9–17. [Google Scholar] [CrossRef]
  75. Ito, M.; Fushie, S.; Maruyama-Funatsuki, W.; Ikeda, T.M.; Nishio, Z.; Nagasawa, K.; Tabiki, T.; Yamauchi, H. Effect of allelic variation in three glutenin loci on dough properties and breadmaking qualities of winter wheat. Breed Sci. 2011, 61, 281–287. [Google Scholar] [CrossRef] [Green Version]
  76. Krystkowiak, K.; Langner, M.; Adamski, T.; Salmanowicz, B.P.; Kaczmarek, Z.; Krajewski, P.; Surma, M. Interactions between Glu-1 and Glu-3 loci and associations of selected molecular markers with quality traits in winter wheat (Triticum aestivum L.) DH lines. J. Appl. Genet. 2017, 58, 37–48. [Google Scholar] [CrossRef] [Green Version]
  77. He, Z.H.; Liu, L.; Xia, X.C.; Liu, J.J.; Peña, R.J. Composition of HMW and LMW Glutenin Subunits and Their Effects on Dough Properties, Pan Bread, and Noodle Quality of Chinese Bread Wheats. Cereal Chem. 2005, 82, 345–350. [Google Scholar] [CrossRef]
  78. Nieto-Taladriz, M.T.; Perretant, M.R.; Rousset, M. Effect of gliadins and HMW and LMW subunits of glutenin on dough properties in the F6 recombinant inbred lines from a bread wheat cross. Theor. Appl. Genet. 1994, 88, 81–88. [Google Scholar] [CrossRef] [PubMed]
  79. Laidig, F.; Piepho, H.P.; Rentel, D.; Drobek, T.; Meyer, U.; Huesken, A. Breeding progress, environmental variation and correlation of winter wheat yield and quality traits in german official variety trials and on-farm during 1983–2014. Theor. Appl. Genet. 2017, 130, 223–245. [Google Scholar] [CrossRef] [PubMed] [Green Version]
  80. Eichi, V.R.; Okamoto, M.; Garnett, T.; Eckermann, P.; Darrier, B.; Riboni, M.; Langridge, P. Strengths and Weaknesses of National Variety Trial Data for Multi-Environment Analysis: A Case Study on Grain Yield and Protein Content. Agronomy 2020, 10, 753. [Google Scholar] [CrossRef]
  81. Achilli, A.L.; Roncallo, P.F.; Echenique, V. Genetic gains in grain yield and agronomic traits of Argentinian durum wheat from 1934 to 2015. CERZOS-CONICET, Bahía Blanca, Buenos Aires. Argentina 2021. manuscript being submitted. [Google Scholar]
  82. Mefleh, M.; Conte, P.; Fadda, C.; Giunta, F.; Piga, A.; Hassoun, G.; Motzo, R. From ancient to old and modern durum wheat varieties: Interaction among cultivar traits, management, and technological quality. J. Sci. Food Agric. 2019, 99, 2059–2067. [Google Scholar] [CrossRef]
  83. Kibite, S.; Evans, L.E. Causes of negative correlations between grain yield and grain protein concentration in common wheat. Euphytica 1984, 33, 801–810. [Google Scholar] [CrossRef]
  84. Taghouti, M.; Nsarellah, N.; Rhrib, K.; Benbrahim, N.; Amallah, L.; Rochdi, A. Evolution from durum wheat landraces to recent improved varieties in Morocco in terms of productivity increase to the detriment of grain quality. Rev. Mar. Sci. Agron. Vét. 2017, 5, 351–358. [Google Scholar]
  85. Pronin, D.; Börner, A.; Weber, H.; Scherf, K.A. Wheat (Triticum aestivum L.) Breeding from 1891 to 2010 Contributed to Increasing Yield and Glutenin Contents but Decreasing Protein and Gliadin Contents. J. Agric. Food Chem. 2020, 68, 13247–13256. [Google Scholar] [CrossRef]
  86. Roncallo, P.F.; Larsen, A.O.; Achilli, A.L.; Ammar, K.; Huerta Espino, J.; Gonzalez, L.; Campos, P.; Dreisigacker, S.; Beker, M.; Echenique, V. Effect of major genes and loci identified by association mapping on yield, plant height and head date in durum wheat. In Proceedings of the RAFV Conference 202, XXXIII Argentinian Meeting of Plant Physiology, Santa Fe, Argentina, 13–17 September 2021; Available online: https://rafv2020.wixsite.com/santa-fe (accessed on 2 September 2021).
  87. Cubadda, R.; Carcea, M.; Pasqui, L.A. Suitability of the gluten index method for assessing gluten strength in durum wheat and semolina. Cereal Foods World 1992, 37, 866–869. [Google Scholar]
  88. Dexter, J.E.; Matsuo, R.R.; Kosmolak, F.G.; Leisle, D.; Marchylo, B.A. The suitability of the SDS-sedimentation test for assessing gluten strength in durum wheat. Can. J. Plant Sci. 1980, 60, 427. [Google Scholar] [CrossRef]
  89. Dick, J.W.; Quick, J.S. A modified screening test for the rapid estimation of gluten strength in early-generation durum wheat breeding lines. Cereal Chem. 1983, 60, 315. [Google Scholar]
  90. Clarke, F.R.; Clarke, J.M.; Ames, N.A.; Knox, R.E.; Ross, J.R. Gluten index compared with SDS sedimentation volume for early generation selection for gluten strength in durum wheat. Can. J. Plant Sci. 2010, 90, 1–11. [Google Scholar] [CrossRef]
Figure 1. Representative variability of HMW-GS (A) and LMW-GS (B) found in the evaluated durum wheat collection. Genotypes are as follows: (A), 1, Candeal Durumbuck; 2, CRZ-1.12; 3, GAB 125; 4, Gerardo 574; 5, Maristella; 6, Polesine; 7, Buck#33 (33.1123.16-3-4-3); 8, Langdon; 9, Coccorit; 10, Gan; 11, Cham 1 = Waha; 12, Korifla = Cham 3; 13, Focha; 14, Bha; 15, Buck No6; 16, Haurani; 17, Langdon; 18, Cappelli; 19, Capeiti8; 20, Chagual INIA; 21, ACA 5284.06; 22, ACA 3571.13; 23, ACA 3576.13. (B), 1, Quc 3462-2009; 2, Quc 3763-2008; 3, Langdon (Dic-3A)-10; 4, CBW 05024; 7, Dupri; 8, Durobonus; 9, Joyau; 10, Biensur; 13, Ardente; 14, Appullo; 15, Ixos; 16, Buck Granate; 20, CBW 0416; 21, CBW 09161; 22, CBW 09270; 23, CBW 09280.
Foods 10 02845 g001
Figure 2. Allelic distribution of the three main glutenin loci (Glu-B1, Glu-A3 and Glu-B3) in a worldwide collection of durum wheat over six breeding periods.
Foods 10 02845 g002
Figure 3. Multiple comparison test (BSS) between haplotypes considering the LSMEANs of grain protein content (GPC) and sodium dodecyl sulfate micro-sedimentation (SDSS) test by year (2011 (A,C) and 2014 (D) or grouping 2014/2017 (B)). Bars with a symbol (*) represent haplotypes detected in at least two genotypes. Bars with different letters at the top and colours indicate significant differences according to the BSS test. Hap_: Haplotype_(number).
Foods 10 02845 g003
Table 1. Allele frequency at five glutenin loci (HMW-GS and LMW-GS) detected in a worldwide collection of 196 durum wheat.
Argentina (85)Chile (26)CIMMYT (10)France (21)Italy (33)USA (4)WANA (17)
Locus/Banding PatternAlleleN%N%N%N%N%N%N%N%
HMW glutenin subunits
Glu-A1 (2)
2 *b10.511.2
nullc19599.58498.826100.010100.021100.033100.04100.017100.0
Glu-B1 (10)
7 + 8b7437.82832.91869.2550.0419.01239.4125.0635.3
6 + 8d5226.53541.2623.1110.0419.013.0375.0211.8
20x + 20ye5025.51618.827.7220.01047.61233.3 847.1
13 + 16f52.611.2 14.839.1
7 + 15z73.633.5 220.029.5
6an10.511.2
7 + 22ch42.011.2 39.1
14 + 22 *new (cr)10.5 13.0
6 * + 15 *new (cs)10.5 15.9
6 + 20ynew (ct)10.5 13.0
LMW glutenin subunits
Glu-A3 (9)
6a11357.75058.81765.4880.0733.32575.8 635.3
5b73.6 13.8 26.1125.0317.6
6 + 10c5226.52327.1726.9220.0942.913.0250.0847.1
6 + 11d42.011.213.8 14.813.0
11e31.5 29.513.0
nullh126.189.4 14.839.1
6.1 + 10ax31.533.5
5 + 10 10.5 125.0
10 + 11 10.5 14.8
Glu-B3 (8)
2 + 4 + 15 + 19a17689.88094.12492.310100.01990.52987.9250.01270.6
8 + 9 + 13 + 16b84.1 13.8 26.1250.0317.6
2 + 4 + 15 + 16g42.011.2 13.0 211.8
1 + 3 + 14 + 18h10.5 13.0
2 + 4 + 15 + 18ax21.0 29.5
2 + 4 + 16ag10.511.2
2 + 4 + 8 + 9 + 15 + 19new (aw)31.533.5
Nullj10.5 13.8
Glu-B2 (3)
12a18393.48195.32596.210100.02095.22987.9250.01694.1
nullb115.644.713.8 14.839.1250.0
12 *c21.0 13.0 15.9
LMW-GS Model
1 84.1 13.8 26.1250.0317.6
2 18795.485100.02492.310100.021100.03193.9250.01482.4
none 10.5 13.8
19610085100.026100.010100.021100.033100.04100.017100.0
Bold number and percentages indicate a unique banding pattern by origin. LMW: Low molecular weight, HMW: High molecular weight. * corresponds with bands showing a slightly mobility difference in SDS-PAGE respect to the original band with the same number.
Table 2. Frequency and allele composition of haplotypes for HMW-GS and LMW-GS detected in a worldwide collection of durum wheat.
Loci
HaplotypeGlu-A1Glu-B3Glu-B2Glu-B1Glu-A3NFrequency (%)Quality Traits Assessed 1
Hap_1Ax2 *2 + 4 + 15 + 19126 + 8610.5yes
Hap_2null1 + 3 + 14 + 1812 *14 + 22 *null10.5yes
Hap_3null2 + 4 + 15 + 161220x + 20y6 + 1010.5yes
Hap_4null2 + 4 + 15 + 16126 * + 15 *610.5yes
Hap_5null2 + 4 + 15 + 161220x + 20y610.5yes
Hap_6null2 + 4 + 15 + 16null6 + 8610.5no
Hap_7null2 + 4 + 15 + 181220x + 20y1110.5yes
Hap_8null2 + 4 + 15 + 18127 + 15null10.5yes
Hap_9null2 + 4 + 15 + 191213 + 16621.0yes
Hap_10null2 + 4 + 15 + 191213 + 166 + 1010.5yes
Hap_11null2 + 4 + 15 + 191220x + 20y62512.8yes
Hap_12null2 + 4 + 15 + 191220x + 20y6.1 + 1031.5yes
Hap_13null2 + 4 + 15 + 191220x + 20y6 + 10115.6yes
Hap_14null2 + 4 + 15 + 191220x + 20ynull31.5yes
Hap_15null2 + 4 + 15 + 19126 + 20y610.5no
Hap_16null2 + 4 + 15 + 19126 + 862512.8yes
Hap_17null2 + 4 + 15 + 19126 + 86 + 102010.2yes
Hap_18null2 + 4 + 15 + 19127 + 151110.5yes
Hap_19null2 + 4 + 15 + 19127 + 15652.6yes
Hap_20null2 + 4 + 15 + 19127 + 22621.0yes
Hap_21null2 + 4 + 15 + 19127 + 22null21.0yes
Hap_22null2 + 4 + 15 + 19127 + 864422.4yes
Hap_23null2 + 4 + 15 + 19127 + 86 + 10189.2yes
Hap_24null2 + 4 + 15 + 19127 + 86 + 1142.0yes
Hap_25null2 + 4 + 15 + 19127 + 8null21.0no
Hap_26null2 + 4 + 15 + 19null13 + 161110.5yes
Hap_27null2 + 4 + 15 + 19null20x + 20y610.5yes
Hap_28null2 + 4 + 15 + 19null20x + 20y6 + 1010.5yes
Hap_29null2 + 4 + 15 + 19null20x + 20ynull10.5yes
Hap_30null2 + 4 + 15 + 19null6 + 8610.5no
Hap_31null2 + 4 + 15 + 19null7 + 810 + 1110.5yes
Hap_32null2 + 4 + 161213 + 16610.5no
Hap_33null2 + 4 + 8 + 9 + 15 + 19126610.5no
Hap_34null2 + 4 + 8 + 9 + 15 + 19126 + 8null21.0no
Hap_35null8 + 9 + 13 + 161220x + 20y510.5yes
Hap_36null8 + 9 + 13 + 16127 + 8531.5yes
Hap_37null8 + 9 + 13 + 1612 *7 + 8510.5yes
Hap_38null8 + 9 + 13 + 16null20x + 20y510.5yes
Hap_39null8 + 9 + 13 + 16null6 + 8510.5yes
Hap_40null8 + 9 + 13 + 16null6 + 85 + 1010.5yes
Hap_41nullnullnull7 + 8610.5yes
Total (N or %)283109196100.0
1 Haplotypes reported without quality trait evaluations because they were not among the genotypes assessed in the 2011, 2014 and 2017 field trials. * corresponds with bands showing a slightly mobility difference in SDS-PAGE respect to the original band with the same number.
Table 3. The effect of glutenin alleles on grain protein content and the SDSS test in 132 durum wheat genotypes grown in Argentina (2011).
2011GPC 1SDSS Test
Locus/Banding PatternAlleleN%CA 2011BW 2011PS 2011LSmeanCA 2011BW 2011PS 2011LSmean
HMW glutenin subunits
Glu-A1 (2)
2 *b10.813.92 a12.29 a11.5 a12.58 a84.50 a86.66 a68.51 a80.17 a
nullc13199.214.62 a13.39 a11.95 a13.32 a62.11 a66.51 a54.16 a60.92 a
Glu-B1 (10)
7 + 8b4231.814.49 a13.28 a11.93 a13.23 a67.6 b71.18 b61.94 b66.34 b
6 + 8d3325.014.81 a13.32 ab11.85 a13.32 a71.97 b77.19 b62.58 b70.63 b
20x + 20ye4332.614.59 a13.43 ab11.96 a13.33 a48.69 ab52.66 ab38.87 ab46.71 ab
13 + 16f43.014.48 a13.45 ab11.78 a13.23 a61.0 b74.37 b54.24 ab63.34 b
7 + 15z43.014.57 a13.49 ab12.15 a13.41 a73.13 b77.85 b69.14 b73.38 b
6annananananananananana
7 + 22ch43.014.54 a13.84 ab12.35 a13.59 a69.0 b71.62 b60.43 b66.92 b
14 + 22 *new (cr)10.814.99 a14.78 b13.18 a14.3 a24.5 a19.61 a20.6 a21.83 a
6 * + 15 *new (cs)10.814.99 a14.17 ab12.47 a13.9 a80.5 b88.57 b70.82 b79.83 b
6 + 20ynew (ct)nananananananananana
LMW glutenin subunits
Glu-A3 (9)
6a7456.114.65 a13.41 ab11.99 a13.35 a64.72 b68.53 b56.55 ab63.28 b
5b64.514.84 a13.85 ab12.35 a13.67 a22.0 a22.36 a18.25 a20.94 a
6 + 10c3728.014.46 a13.21 ab11.8 a13.15 a64.31 b70.92 b56.27 ab63.83 b
6 + 11d10.815.09 a13.25 ab11.94 a13.4 a56.5 ab75.98 b52.84 ab61.67 b
11e32.314.6 a13.23 ab11.88 a13.24 a69.8 b71.37 b52.37 ab64.61 b
nullh75.314.94 a14.14 b12.4 a13.84 a57.0 ab60.11 ab48.49 ab55.0 ab
6.1 + 10ax32.314.09 a12.64 a11.0 a12.57 a59.2 ab57.3 ab54.02 ab56.83 ab
5 + 10 nananananananananana
10 + 11 10.814.34 a13.01 ab11.9 a13.12 a78.0 b86.87 b75.79 b80.17 b
Glu-B3 (8)
2 + 4 + 15 + 19a12090.914.59 a13.34 a11.9 a13.28 a64.9 c69.6 b56.79 a63.78 b
8 + 9 + 13 + 16b64.514.84 a13.85 ab12.35 a13.67 a22.0 a22.36 a18.25 a20.94 a
2 + 4 + 15 + 16g32.314.41 a13.69 ab12.47 a13.53 a51.8 abc52.75 ab45.42 a49.78 ab
1 + 3 + 14 + 18h10.814.99 a14.78 b13.18 a14.3 a24.5 ab15.5 a20.6 a21.83 a
2 + 4 + 15 + 18ax21.515.34 a13.54 a12.35 a13.75 a58.3 bc67.07 b41.03 a55.25 ab
2 + 4 + 16agnananananananananana
2 + 4 + 8 + 9 + 15 + 19new (aw)nananananananananana
Nulljnananananananananana
Glu-B2 (3)
12a12594.714.60 a13.37 a11.92 a13.3 a63.76 b68.35 b55.48 b62.52 b
nullb53.814.86 a13.51 a12.23 a13.55 a42.8 ab44.22 ab39.5 ab42.23 ab
12 *c21.514.47 a14.08 a12.84 a13.78 a18.75 a16.93 a15.59 a17.17 b
LMW-GS Model
1 64.514.6 a13.85 b12.35 a13.67 a22.0 a22.4 a18.3 a20.9 a
2 12695.514.84 a13.36 a11.93 a13.3 a64.2 b68.8 b56.0 b60.98 b
none nananananananananana
1 LSMEAN estimated using 132 genotypes in each environment and over the environments. GPC: grain protein content; SDSS: sodium dodecyl sulfate micro-sedimentation. The environmental references are CA: Cabildo; BW: Barrow; PS: Pieres, followed by the year of sowing. Values in the same column for each locus followed by a different letter are significantly different using the Tukey–Kramer test (p < 0.01). * corresponds with bands showing a slightly mobility difference in SDS-PAGE respect to the original band with the same number.
Table 4. The effect of glutenin alleles on grain protein content and the SDSS test in 170 genotypes grown in Argentina (2014 and 2017).
2014/17GPC 1SDSS Test
Locus/Banding PatternAlleleN%CA 2014BW 2014PS 2014BW 2017LSmeanCA 2014BW 2014PS 2014LSmean
HMW glutenin subunits
Glu-A1 (2)
2 *b10.613.2 a10.61 a11.54 a10.51 a11.64 a72.08 a68.99 a59.08 a66.84 a
nullc16194.712.98 a12.2 a12.37 a11.14 a12.16 a58.81 a66.38 a66.28 a63.83 a
Glu-B1 (10)
7 + 8b6538.212.49 ab12.31 a12.31 a10.93 a12.0 a61.99 b73.03 b71.16 b68.69 b
6 + 8d4425.913.68 ab11.94 a12.34 a11.23 ab12.29 a64.82 b66.39 ab67.48 b66.31 b
20x + 20ye4727.613.08 ab12.26 a12.41 a11.3 ab12.27 a48.12 ab55.19 ab56.46 ab53.27 ab
13 + 16f42.411.73 ab11.6 a11.98 a11.23 ab11.59 a59.34 ab77.87 b78.02 b71.61 b
7 + 15z42.412.32 ab11.81 a12.42 a10.94 a11.9 a61.59 b69.14 b78.82 b69.63 b
6annana
7 + 22ch42.414.04 ab12.58 a12.33 a11.26 ab12.48 ab74.9 b80.61 b72.01 b76.15 b
14 + 22 *new (cr)10.615.38 b12.5 a14.82 b12.7 b14.02 b18.41 a21.97 a21.28 a20.31 a
6 * + 15 *new (cs)10.611.43 a13.31 a13.67 b11.82 ab12.35 a68.67 b87.02 b72.0 b75.48 b
6 + 20ynew (ct)nana
LMW glutenin subunits
Glu-A3 (9)
6a9857.612.98 a12.23 a12.39 ab11.11 ab12.07 a61.92 abc69.18 bc70.11 b67.10 c
5b63.513.06 a13.12 a13.05 ab11.69 ab12.77 a18.72 a19.9 a23.6 a20.66 a
6 + 10c4828.212.89 a12.08 a12.23 ab11.08 ab12.07 a58.11 abc68.68 bc64.69 ab63.81 bc
6 + 11d21.213.80 a11.97 a12.44 ab10.73 ab12.24 a67.58 bc73.09 c60.76 ab67.15 c
11e31.811.92 a11.77 a12.03 ab11.42 ab11.78 a61.25 abc67.0 abc72.51 b66.55 c
nullh84.713.35 a12.15 a12.65 ab11.44 ab12.43 a57.36 abc64.48 abc64.27 ab62.03 bc
6.1 + 10ax31.813.86 a11.29 a11.15 a10.8 ab11.72 a51.01 abc42.33 abc58.57 ab50.7 abc
5 + 10 10.614.24 a11.99 a11.96 ab12.3 ab12.64 a31.45 ab21.96 ab23.78 a25.97 ab
10 + 11 10.611.79 a12.33 a13.29 b10.42 a11.69 a78.4 c80.56 c90.74 b83.22 c
Glu-B3 (8)
2 + 4 + 15 + 19a156117.312.99 a12.15 a12.32 a11.10 ab12.13 a61.17 ab68.92 bc68.42 b66.18 b
8 + 9 + 13 + 16b75.313.23 a12.96 a12.98 ab11.78 ab12.75 ab20.54 a20.20 a23.63 a21.42 a
2 + 4 + 15 + 16g32.311.96 a12.32 a12.26 a11.32 ab11.95 a49 ab67.52 abc58.82 ab58.59 ab
1 + 3 + 14 + 18h10.815.38 b12.5 a14.82 b12.70 b14.02 b18.41 a21.97 ab21.88 a20.31 a
2 + 4 + 15 + 18ax21.510.92 a12.54 a12.81 ab10.88 ab11.96 a45.83 ab44.0 abc70.91 b53.48 ab
2 + 4 + 16agnana
2 + 4 + 8 + 9 + 15 + 19new (aw)nana
Nullj10.814.61 ab10.97 a12.11 a10.60 a12.06 a66.5 b82.04 c81.69 b76.94 b
Glu-B2 (3)
12a15993.512.96 a12.19 a12.33 a11.11 a12.14 a60.06 b68.02 b67.54 b65.22 b
nullb95.313.16 a11.96 a12.44 a11.36 a12.25 a48.00 b48.89 b54.30 b50.31 b
12 *c21.214.08 a12.88 a14.48 b12.07 a13.43 b14.65 a16.43 a16.66 a15.52 a
LMW-GS Model
1 74.113.23 a12.96 b12.98 a11.78 a12.74 a20.54 a20.20 a23.63 a21.42 a
2 16295.312.96 a12.16 ab12.34 a11.11 a12.14 a60.5 b68.3 b67.98 b65.6 b
none 10.58814.61 a10.88 a12.11 a10.60 a12.06 a66.5 b82.04 b81.68 b76.94 b
1 LSMEAN estimated using 132 genotypes in each environment and over the environments. GPC: grain protein content; SDSS: sodium dodecyl sulfate micro-sedimentation. The environmental references are CA: Cabildo; BW: Barrow; PS: Pieres, followed by the year of sowing. Values in the same column for each locus followed by a different letter are significantly different using the Tukey–Kramer test (p < 0.01). * corresponds with bands showing a slightly mobility difference in SDS-PAGE respect to the original band with the same number.
Publisher’s Note: MDPI stays neutral with regard to jurisdictional claims in published maps and institutional affiliations.

